Embed Size (px)
Citation preview
7242019 CE-341 Lectures 1amp2
httpslidepdfcomreaderfullce-341-lectures-12 115
02-08-2012
1
983112983129983108983122983119983116983119983111983129
Science of water that deals with the occurrence circulation anddistribution of water of the earth and earthrsquos atmosphere
2
7242019 CE-341 Lectures 1amp2
httpslidepdfcomreaderfullce-341-lectures-12 215
02-08-2012
2
3
Hydrological data
4
5 Engineering Hydrology by K Subramanya6 Hydrology by H M Raghunath
7242019 CE-341 Lectures 1amp2
httpslidepdfcomreaderfullce-341-lectures-12 315
02-08-2012
3
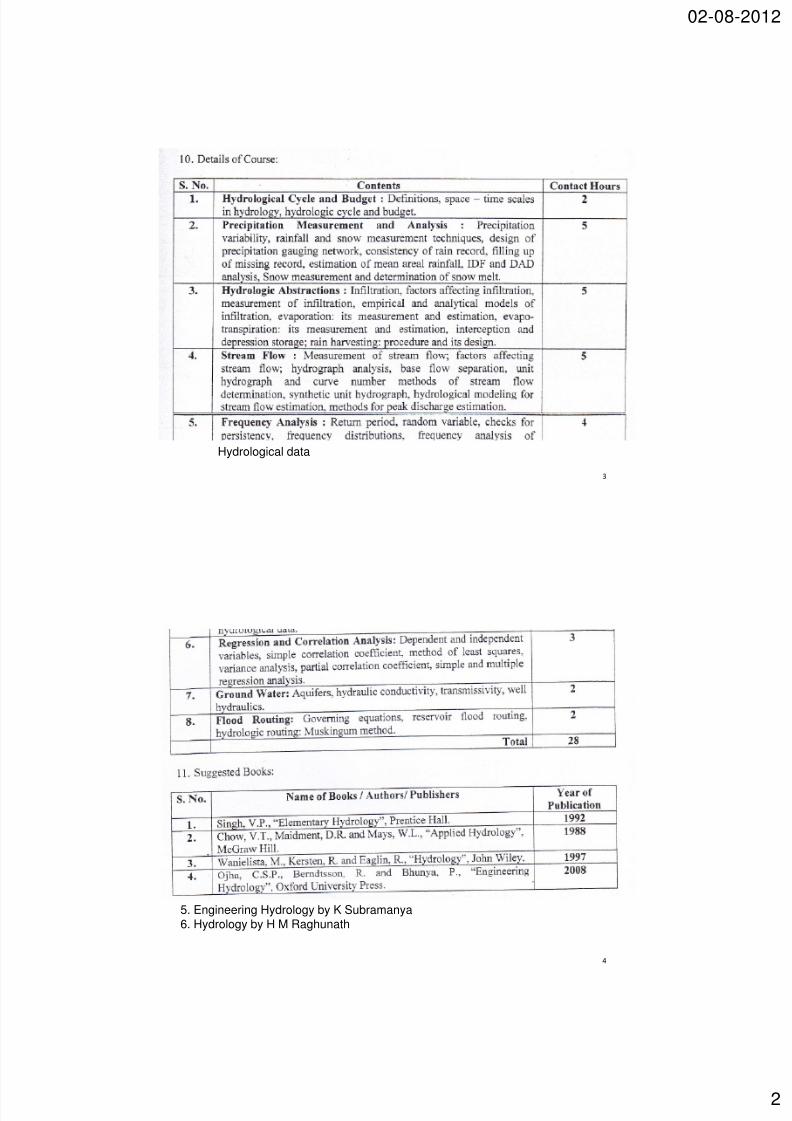
983116983141983139983156983157983154983141983155983135 983089 983078983090
Definitions
Hydrological Cycles and Water Distribution
Water Budget
Space-time Scales
Catchment Area
History of Hydrology
Applications
5
10 Hydrologic Cycle
7242019 CE-341 Lectures 1amp2
httpslidepdfcomreaderfullce-341-lectures-12 415
02-08-2012
4
8
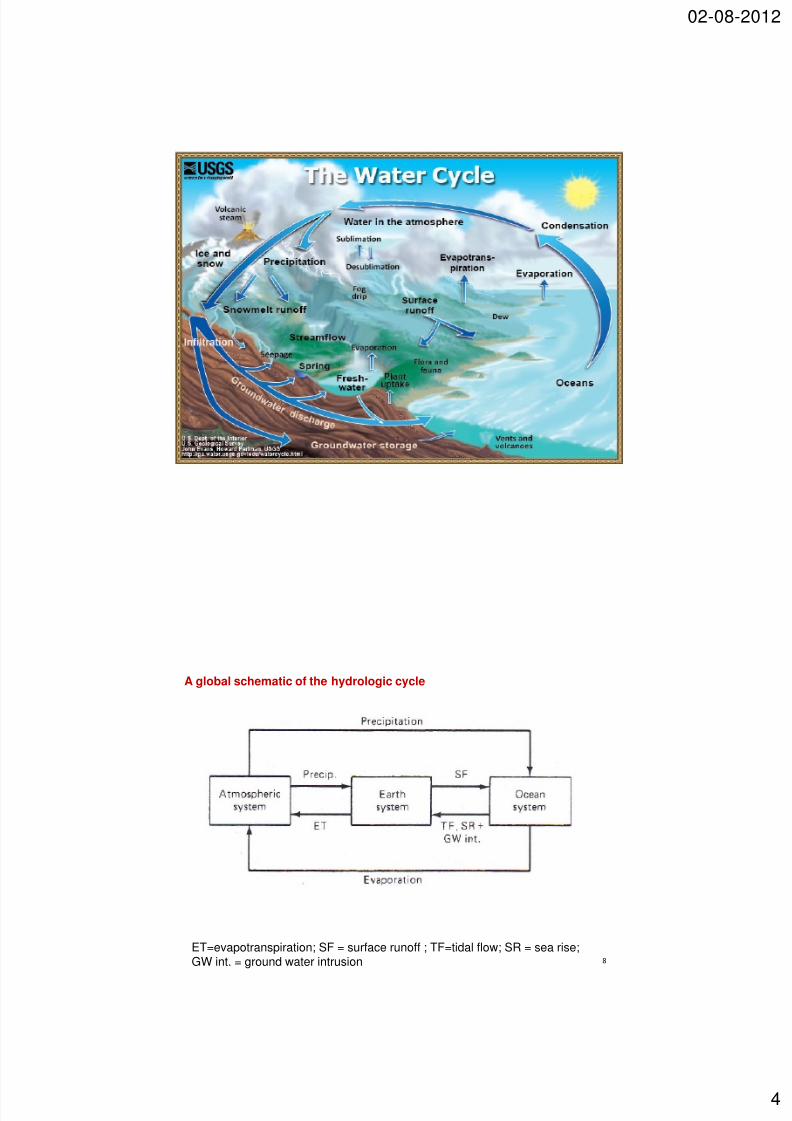
A global schematic of the hydrologic cycle
ET=evapotranspiration SF = surface runoff TF=tidal flow SR = sea riseGW int = ground water intrusion
7242019 CE-341 Lectures 1amp2
httpslidepdfcomreaderfullce-341-lectures-12 515
02-08-2012
5
9
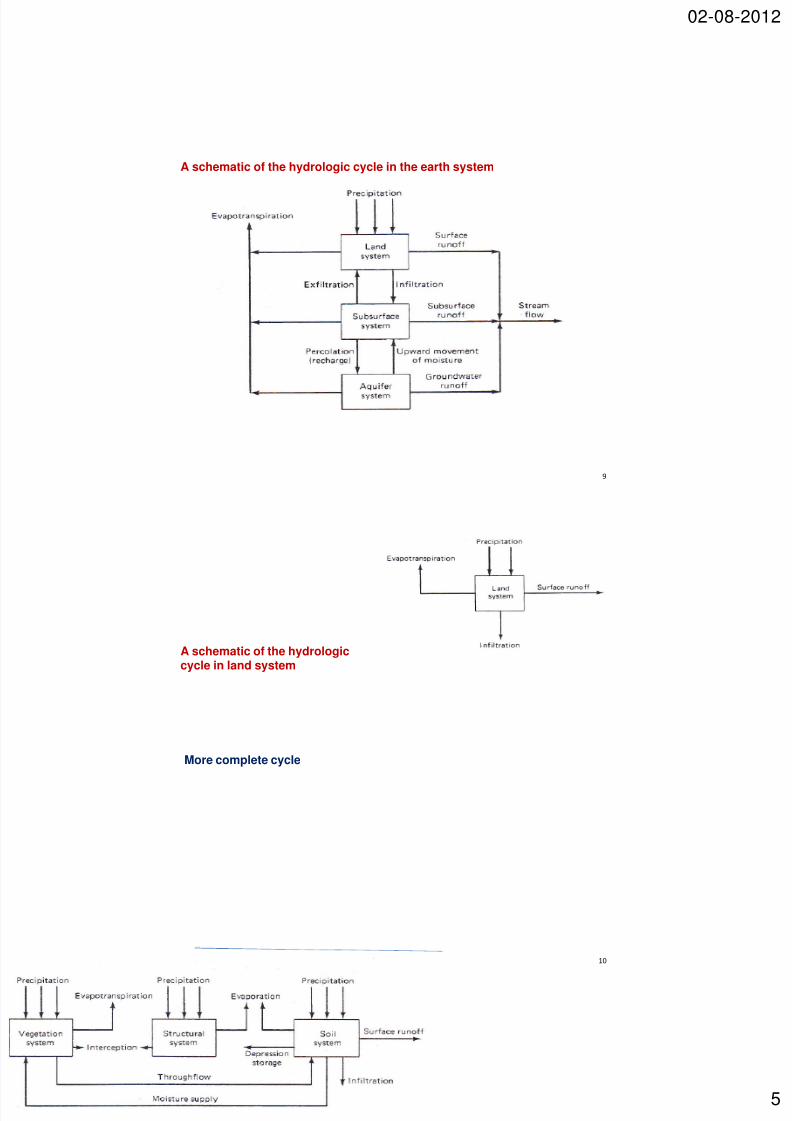
A schematic of the hydrologic cycle in the earth system
10
A schematic of the hydrologiccycle in land system
More complete cycle
7242019 CE-341 Lectures 1amp2
httpslidepdfcomreaderfullce-341-lectures-12 615
02-08-2012
6
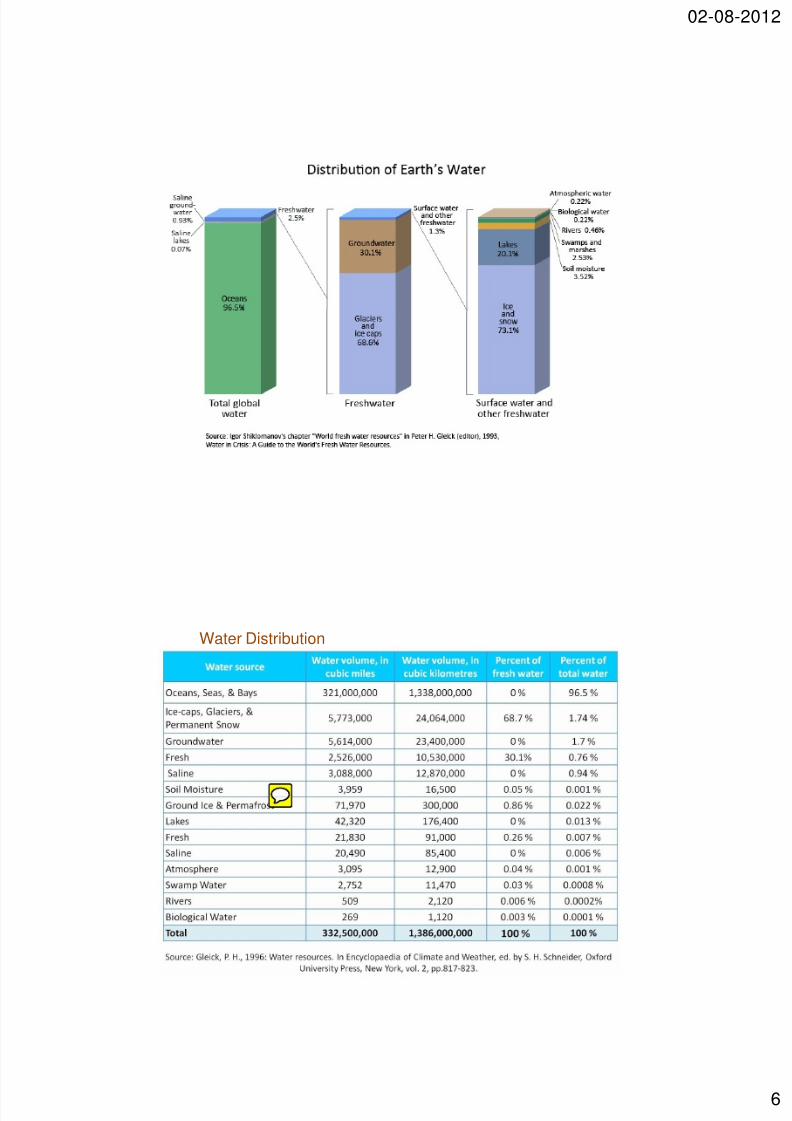
Water Distribution
7242019 CE-341 Lectures 1amp2
httpslidepdfcomreaderfullce-341-lectures-12 715
02-08-2012
7
Land and Water Resources of India
Source-CWC India
7242019 CE-341 Lectures 1amp2
httpslidepdfcomreaderfullce-341-lectures-12 815
02-08-2012
8
Source-CWC India
Water Resources Potential (km3) in Major River Basins of India
2 Hydrologic Budget
The water budget represents the inventory of water for a specific waterbody (or hydrologic region) during a certain time interval
It can be estimated using the mass conservation equation whichexpresses the balance between the inflows outflows and change ofstorage in any water body hydrologic region over a period of time For a
drainage basin
P - R - G - E - T = ∆S (1)
16
P=precipitation R= runoff G= ground water flow E=evaporationT= Transpiration S = storage
7242019 CE-341 Lectures 1amp2
httpslidepdfcomreaderfullce-341-lectures-12 915
02-08-2012
9
For a drainage basin
17
Subscripts s=surface storage m = soil moisture storage g = ground water storagei = interception storage
Ir = rainfall intensity Isn = rate of snowfall Osr= surface runoff Osb= subsurfacerunoff Og = ground water runoff e = rate of evaporation et = rate of transpirationf = infiltration rate
( ) f eeOOO I I S S S S dt
d
O I dt dS
t gsbsr snr igms minusminusminusminusminusminus+=+++
minus=
3 Space-Time scales
Depending on the hydrologic problem under consideration thehydrologic cycle or its component can be treated at different scales oftime and space
The global scale is the largest spatial scale and the drainage basin thesmallest spatial scale
The time scales used in hydrologic studies range from a fraction of anhour to a year or perhaps many years The time scale used in ahydrologic study depends on the purpose of the study and the probleminvolved
18
7242019 CE-341 Lectures 1amp2
httpslidepdfcomreaderfullce-341-lectures-12 1015
02-08-2012
10
4 Catchment Area (drainage area drainage basin Watershed in USA)
983122983145983140983143983141 983148983145983150983141 983145983155 983137983148983155983151 983139983137983148983148983141983140 983108983145983158983145983140983141 983145983150 983125983123983105 983137983150983140 983127983137983156983141983154983155983144983141983140 983145983150 983125983115
19
983124983144983141 983148983145983150983141 983151983142 983156983144983141 983143983154983151983157983150983140 983159983137983156983141983154 983156983137983138983148983141 983142983154983151983149 983159983144983145983139983144 983156983144983141 983159983137983156983141983154 983156983137983138983148983141 983155983148983151983152983141983155 983140983151983159983150983159983137983154983140 983137983159983137983161
983142983154983151983149 983156983144983141 983148983145983150983141 983151983150 983138983151983156983144 983155983145983140983141983155 983145983155 983139983137983148983148983141983140 983156983144983141 983143983154983151983157983150983140 983159983137983156983141983154 983140983145983158983145983140983141
20
Catchmentboundary of
the Kosi riverAlmora
7242019 CE-341 Lectures 1amp2
httpslidepdfcomreaderfullce-341-lectures-12 1115
02-08-2012
11
21
StreamDrainagePattern
983107983144983137983154983137983139983156983141983154983145983155983156983145983139983155 983151983142 983156983144983141 983140983154983137983145983150983137983143983141
1 The number of streams
2 The length of streams
3
4 Drainage density
Stream density9830842-
km areaCatchment
streamsof Nunmber
A
N D s
s =
A
L D sd
nt)intermitteand(perennialchannelsstreamsallof lengthTotal=
22
Drainage density varies inversely as the length of overland flow andindicates the drainage efficiency of the basin
A high value indicates a well-developed network and torrential runoff causingintense floods while a low value indicates moderate runoff and highpermeability of the terrain
7242019 CE-341 Lectures 1amp2
httpslidepdfcomreaderfullce-341-lectures-12 1215
02-08-2012
12
983124983144983141 983155983144983137983152983141 983151983142 983137 983140983154983137983145983150983137983143983141 983138983137983155983145983150 983139983137983150 983143983141983150983141983154983137983148983148983161 983138983141 983141983160983152983154983141983155983155983141983140 983138983161
983110983151983154983149 983142983137983139983156983151983154 1 2
lt==
bb
b
f L
A
L
W F
983127 983138983101983137983160983145983137983148 983159983145983140983156983144 983151983142 983138983137983155983145983150
983116983138983101983137983160983145983137983148 983148983141983150983143983156983144 983151983142 983138983137983155983145983150 983145983141 983156983144983141 983140983145983155983156983137983150983139983141 983142983154983151983149 983156983144983141 983149983141983137983155983157983154983145983150983143 983152983151983145983150983156 983156983151 983156983144983141 983149983151983155983156
983154983141983149983151983156983141 983152983151983145983150983156 983151983150 983156983144983141 983138983137983155983145983150
983107983151983149983152983137983139983156983150983141983155983155 983139983151983141983142983142983145983139983145983141983150983156 1 2
ge=
A
PC b
cπ
983120983138983101983152983141983154983145983149983141983156983141983154 983151983142 983156983144983141 983138983137983155983145983150
Aπ 2 983101983139983145983154983139983157983149983142983141983154983141983150983139983141 983151983142 983139983145983154983139983157983148983137983154 983137983154983141983137 983144983137983158983145983150983143 983137983154983141983137 983141983153983157983137983148 983156983151 983156983144983141 983137983154983141983137 983151983142 983156983144983141 983138983137983155983145983150
983123983144983137983152983141 983142983137983139983156983151983154 1 2
gt= A
L B b
s
983109983148983151983150983143983137983156983145983151983150 983154983137983156983145983151 1 lengthWatershed
areawatershedof circleof Diameterle=
983107983145983154983139983157983148983137983154983145983156983161 9831549831379831569831459831511 perimeterwatershedof circleof Area
areaWatershedle=
24
7242019 CE-341 Lectures 1amp2
httpslidepdfcomreaderfullce-341-lectures-12 1315
02-08-2012
13
983106983137983155983145983150 983155983148983151983152983141 983101 983140983145983142983142983141983154983141983150983139983141 983145983150 983141983148983141983158983137983156983145983151983150 983138983141983156983159983141983141983150 983142983137983154983156983144983141983155983156 983152983151983145983150983156 983137983150983140 983151983157983156983148983141983156
983140983145983155983156983137983150983139983141 983142983154983151983149 983142983137983154983156983144983141983155983156 983152983151983145983150983156 983156983151 983151983157983156983148983141983156
983123983156983154983141983137983149 983155983148983151983152983141
1 983105983158983141983154983137983143983141 983155983156983154983141983137983149 983155983148983151983152983141983101983156983151983156983137983148 983142983137983148983148 983151983142 983156983144983141 983148983151983150983143983141983155983156 983159983137983156983141983154 983139983151983157983154983155983141983148983141983150983143983156983144 983151983142 983156983144983141
983141983150983156983145983154983141 983148983151983150983143983141983155983156 983159983137983156983141983154 983139983151983157983154983155983141
2
1
1
2 1
sum
sum=
=
=
N
ii
N
iii
m
L
S LS
2 The channel is divided into N number of reaches each having Slope Siand length Li (Johnstone and Cross 1949)
The equivalent stream slope
History of Hydrology
It is not easy to answer the question ldquoHow and where the science ofhydrology beganrdquo
In ancient times various hydrologic principles were successfullyapplied in practice
Early Chinese irrigation and flood control works and Greek andRoman aqueducts are worth mentioning
The Roman engineer Marcus Vitruvius (1st century BC) developedan early theory of the hydrologic cycle in his treatise On Architecture
During the Middle Ages Vitruviuss work was the standard referencebook on Hydrology
26
7242019 CE-341 Lectures 1amp2
httpslidepdfcomreaderfullce-341-lectures-12 1415
02-08-2012
14
15th century Leonardo da Vinci and Bernard Palissy gave independently ofeach other an accurate explanation of the hydrologic cycle
17th
century the modern science of hydrology was established by PerraultMariotte and Halley Perrault measured the rainfall and runoff in the SeineRiver and proved that rainfall contributes significantly to river flow He alsomeasured evaporation and capillarity Mariotte recorded the velocity of flow inthe Seine River and made measurements of the cross section estimating thedischarge Halley measured evaporation of the Mediterranean Sea
18th century The Bernoulli piezometer and theorem the Pitot tube andChezys formula are representative achievements
19th century experimental hydrology made considerable progress Darcyslaw of flow in porous media and Dupuit-Thiems well formula were
elaborated
Early 20th century governmental agencies developed their own programs ofhydrologic research Shermans unit hydrograph Hortons infiltration theoryand Theiss non-equilibrium approach to well hydraulics were based on theiranalyses and were the results of research programs
27
983107983144983151983159 983139983148983137983155983155983145983142983145983141983155 983156983144983141 983144983145983155983156983151983154983161 983151983142 983144983161983140983154983151983148983151983143983161 983145983150983156983151 983141983145983143983144983156 983152983141983154983145983151983140983155 983137983155
bull Period of Speculation ndash prior to AD 1400
bull Period of Observation ndash 1400 ndash 1600
bull Period of Measurement ndash 1600 ndash 1700
bull Period of Experimentation ndash 1700- 1800
bull Period of Modernization ndash 1800 ndash 1900
bull Period of Empiricism ndash 1900 ndash 1930
bull Period of Rationalization ndash 1930 ndash 1950
bull Period of Theorization ndash 1950 ndash to date
28
7242019 CE-341 Lectures 1amp2
httpslidepdfcomreaderfullce-341-lectures-12 1515
02-08-2012
983105983152983152983148983145983139983137983156983145983151983150983155 983113983150 983109983150983143983145983150983141983141983154983145983150983143
983112983161983140983154983151983148983151983143983161 983142983145983150983140983155 983145983156983155 983143983154983141983137983156983141983155983156 983137983152983152983148983145983139983137983156983145983151983150 983145983150 983156983144983141 983140983141983155983145983143983150 983137983150983140 983151983152983141983154983137983156983145983151983150 983151983142
983159983137983156983141983154 983154983141983155983151983157983154983139983141983155 983141983150983143983145983150983141983141983154983145983150983143 983155983157983139983144 983137983155 983156983144983151983155983141 983142983151983154
(983145) 983113983154983154983145983143983137983156983145983151983150
(983145983145) 983127983137983156983141983154 983155983157983152983152983148983161
(983145983145983145) 983110983148983151983151983140 983139983151983150983156983154983151983148
(983145983158) 983112983161983140983154983151983152983151983159983141983154 983137983150983140
(983158) 983118983137983158983145983143983137983156983145983151983150
29
1 Scientific Hydrology-a study concerned with academic aspects2 Engineering or applied Hydrology- a study concerned with
engineering applications
983112983161983140983154983151983148983151983143983145983139983137983148 983108983137983156983137
The basic hydrological data required are
1 Precipitation and climatological data - IMD
2 Topographic maps - SOI
3 Stream-flow records - CWC
4 Ground water data ndash Central Ground Water Board5 Evaporation and transpiration data -IMD
6 Cropping pattern crops and their consumptive use ndash Irrigation Dept
7 Soil map
8 Water quality data of surface streams and groundwater
9 Geological maps - GSI
30
7242019 CE-341 Lectures 1amp2
httpslidepdfcomreaderfullce-341-lectures-12 215
02-08-2012
2
3
Hydrological data
4
5 Engineering Hydrology by K Subramanya6 Hydrology by H M Raghunath
7242019 CE-341 Lectures 1amp2
httpslidepdfcomreaderfullce-341-lectures-12 315
02-08-2012
3
983116983141983139983156983157983154983141983155983135 983089 983078983090
Definitions
Hydrological Cycles and Water Distribution
Water Budget
Space-time Scales
Catchment Area
History of Hydrology
Applications
5
10 Hydrologic Cycle
7242019 CE-341 Lectures 1amp2
httpslidepdfcomreaderfullce-341-lectures-12 415
02-08-2012
4
8
A global schematic of the hydrologic cycle
ET=evapotranspiration SF = surface runoff TF=tidal flow SR = sea riseGW int = ground water intrusion
7242019 CE-341 Lectures 1amp2
httpslidepdfcomreaderfullce-341-lectures-12 515
02-08-2012
5
9
A schematic of the hydrologic cycle in the earth system
10
A schematic of the hydrologiccycle in land system
More complete cycle
7242019 CE-341 Lectures 1amp2
httpslidepdfcomreaderfullce-341-lectures-12 615
02-08-2012
6
Water Distribution
7242019 CE-341 Lectures 1amp2
httpslidepdfcomreaderfullce-341-lectures-12 715
02-08-2012
7
Land and Water Resources of India
Source-CWC India
7242019 CE-341 Lectures 1amp2
httpslidepdfcomreaderfullce-341-lectures-12 815
02-08-2012
8
Source-CWC India
Water Resources Potential (km3) in Major River Basins of India
2 Hydrologic Budget
The water budget represents the inventory of water for a specific waterbody (or hydrologic region) during a certain time interval
It can be estimated using the mass conservation equation whichexpresses the balance between the inflows outflows and change ofstorage in any water body hydrologic region over a period of time For a
drainage basin
P - R - G - E - T = ∆S (1)
16
P=precipitation R= runoff G= ground water flow E=evaporationT= Transpiration S = storage
7242019 CE-341 Lectures 1amp2
httpslidepdfcomreaderfullce-341-lectures-12 915
02-08-2012
9
For a drainage basin
17
Subscripts s=surface storage m = soil moisture storage g = ground water storagei = interception storage
Ir = rainfall intensity Isn = rate of snowfall Osr= surface runoff Osb= subsurfacerunoff Og = ground water runoff e = rate of evaporation et = rate of transpirationf = infiltration rate
( ) f eeOOO I I S S S S dt
d
O I dt dS
t gsbsr snr igms minusminusminusminusminusminus+=+++
minus=
3 Space-Time scales
Depending on the hydrologic problem under consideration thehydrologic cycle or its component can be treated at different scales oftime and space
The global scale is the largest spatial scale and the drainage basin thesmallest spatial scale
The time scales used in hydrologic studies range from a fraction of anhour to a year or perhaps many years The time scale used in ahydrologic study depends on the purpose of the study and the probleminvolved
18
7242019 CE-341 Lectures 1amp2
httpslidepdfcomreaderfullce-341-lectures-12 1015
02-08-2012
10
4 Catchment Area (drainage area drainage basin Watershed in USA)
983122983145983140983143983141 983148983145983150983141 983145983155 983137983148983155983151 983139983137983148983148983141983140 983108983145983158983145983140983141 983145983150 983125983123983105 983137983150983140 983127983137983156983141983154983155983144983141983140 983145983150 983125983115
19
983124983144983141 983148983145983150983141 983151983142 983156983144983141 983143983154983151983157983150983140 983159983137983156983141983154 983156983137983138983148983141 983142983154983151983149 983159983144983145983139983144 983156983144983141 983159983137983156983141983154 983156983137983138983148983141 983155983148983151983152983141983155 983140983151983159983150983159983137983154983140 983137983159983137983161
983142983154983151983149 983156983144983141 983148983145983150983141 983151983150 983138983151983156983144 983155983145983140983141983155 983145983155 983139983137983148983148983141983140 983156983144983141 983143983154983151983157983150983140 983159983137983156983141983154 983140983145983158983145983140983141
20
Catchmentboundary of
the Kosi riverAlmora
7242019 CE-341 Lectures 1amp2
httpslidepdfcomreaderfullce-341-lectures-12 1115
02-08-2012
11
21
StreamDrainagePattern
983107983144983137983154983137983139983156983141983154983145983155983156983145983139983155 983151983142 983156983144983141 983140983154983137983145983150983137983143983141
1 The number of streams
2 The length of streams
3
4 Drainage density
Stream density9830842-
km areaCatchment
streamsof Nunmber
A
N D s
s =
A
L D sd
nt)intermitteand(perennialchannelsstreamsallof lengthTotal=
22
Drainage density varies inversely as the length of overland flow andindicates the drainage efficiency of the basin
A high value indicates a well-developed network and torrential runoff causingintense floods while a low value indicates moderate runoff and highpermeability of the terrain
7242019 CE-341 Lectures 1amp2
httpslidepdfcomreaderfullce-341-lectures-12 1215
02-08-2012
12
983124983144983141 983155983144983137983152983141 983151983142 983137 983140983154983137983145983150983137983143983141 983138983137983155983145983150 983139983137983150 983143983141983150983141983154983137983148983148983161 983138983141 983141983160983152983154983141983155983155983141983140 983138983161
983110983151983154983149 983142983137983139983156983151983154 1 2
lt==
bb
b
f L
A
L
W F
983127 983138983101983137983160983145983137983148 983159983145983140983156983144 983151983142 983138983137983155983145983150
983116983138983101983137983160983145983137983148 983148983141983150983143983156983144 983151983142 983138983137983155983145983150 983145983141 983156983144983141 983140983145983155983156983137983150983139983141 983142983154983151983149 983156983144983141 983149983141983137983155983157983154983145983150983143 983152983151983145983150983156 983156983151 983156983144983141 983149983151983155983156
983154983141983149983151983156983141 983152983151983145983150983156 983151983150 983156983144983141 983138983137983155983145983150
983107983151983149983152983137983139983156983150983141983155983155 983139983151983141983142983142983145983139983145983141983150983156 1 2
ge=
A
PC b
cπ
983120983138983101983152983141983154983145983149983141983156983141983154 983151983142 983156983144983141 983138983137983155983145983150
Aπ 2 983101983139983145983154983139983157983149983142983141983154983141983150983139983141 983151983142 983139983145983154983139983157983148983137983154 983137983154983141983137 983144983137983158983145983150983143 983137983154983141983137 983141983153983157983137983148 983156983151 983156983144983141 983137983154983141983137 983151983142 983156983144983141 983138983137983155983145983150
983123983144983137983152983141 983142983137983139983156983151983154 1 2
gt= A
L B b
s
983109983148983151983150983143983137983156983145983151983150 983154983137983156983145983151 1 lengthWatershed
areawatershedof circleof Diameterle=
983107983145983154983139983157983148983137983154983145983156983161 9831549831379831569831459831511 perimeterwatershedof circleof Area
areaWatershedle=
24
7242019 CE-341 Lectures 1amp2
httpslidepdfcomreaderfullce-341-lectures-12 1315
02-08-2012
13
983106983137983155983145983150 983155983148983151983152983141 983101 983140983145983142983142983141983154983141983150983139983141 983145983150 983141983148983141983158983137983156983145983151983150 983138983141983156983159983141983141983150 983142983137983154983156983144983141983155983156 983152983151983145983150983156 983137983150983140 983151983157983156983148983141983156
983140983145983155983156983137983150983139983141 983142983154983151983149 983142983137983154983156983144983141983155983156 983152983151983145983150983156 983156983151 983151983157983156983148983141983156
983123983156983154983141983137983149 983155983148983151983152983141
1 983105983158983141983154983137983143983141 983155983156983154983141983137983149 983155983148983151983152983141983101983156983151983156983137983148 983142983137983148983148 983151983142 983156983144983141 983148983151983150983143983141983155983156 983159983137983156983141983154 983139983151983157983154983155983141983148983141983150983143983156983144 983151983142 983156983144983141
983141983150983156983145983154983141 983148983151983150983143983141983155983156 983159983137983156983141983154 983139983151983157983154983155983141
2
1
1
2 1
sum
sum=
=
=
N
ii
N
iii
m
L
S LS
2 The channel is divided into N number of reaches each having Slope Siand length Li (Johnstone and Cross 1949)
The equivalent stream slope
History of Hydrology
It is not easy to answer the question ldquoHow and where the science ofhydrology beganrdquo
In ancient times various hydrologic principles were successfullyapplied in practice
Early Chinese irrigation and flood control works and Greek andRoman aqueducts are worth mentioning
The Roman engineer Marcus Vitruvius (1st century BC) developedan early theory of the hydrologic cycle in his treatise On Architecture
During the Middle Ages Vitruviuss work was the standard referencebook on Hydrology
26
7242019 CE-341 Lectures 1amp2
httpslidepdfcomreaderfullce-341-lectures-12 1415
02-08-2012
14
15th century Leonardo da Vinci and Bernard Palissy gave independently ofeach other an accurate explanation of the hydrologic cycle
17th
century the modern science of hydrology was established by PerraultMariotte and Halley Perrault measured the rainfall and runoff in the SeineRiver and proved that rainfall contributes significantly to river flow He alsomeasured evaporation and capillarity Mariotte recorded the velocity of flow inthe Seine River and made measurements of the cross section estimating thedischarge Halley measured evaporation of the Mediterranean Sea
18th century The Bernoulli piezometer and theorem the Pitot tube andChezys formula are representative achievements
19th century experimental hydrology made considerable progress Darcyslaw of flow in porous media and Dupuit-Thiems well formula were
elaborated
Early 20th century governmental agencies developed their own programs ofhydrologic research Shermans unit hydrograph Hortons infiltration theoryand Theiss non-equilibrium approach to well hydraulics were based on theiranalyses and were the results of research programs
27
983107983144983151983159 983139983148983137983155983155983145983142983145983141983155 983156983144983141 983144983145983155983156983151983154983161 983151983142 983144983161983140983154983151983148983151983143983161 983145983150983156983151 983141983145983143983144983156 983152983141983154983145983151983140983155 983137983155
bull Period of Speculation ndash prior to AD 1400
bull Period of Observation ndash 1400 ndash 1600
bull Period of Measurement ndash 1600 ndash 1700
bull Period of Experimentation ndash 1700- 1800
bull Period of Modernization ndash 1800 ndash 1900
bull Period of Empiricism ndash 1900 ndash 1930
bull Period of Rationalization ndash 1930 ndash 1950
bull Period of Theorization ndash 1950 ndash to date
28
7242019 CE-341 Lectures 1amp2
httpslidepdfcomreaderfullce-341-lectures-12 1515
02-08-2012
983105983152983152983148983145983139983137983156983145983151983150983155 983113983150 983109983150983143983145983150983141983141983154983145983150983143
983112983161983140983154983151983148983151983143983161 983142983145983150983140983155 983145983156983155 983143983154983141983137983156983141983155983156 983137983152983152983148983145983139983137983156983145983151983150 983145983150 983156983144983141 983140983141983155983145983143983150 983137983150983140 983151983152983141983154983137983156983145983151983150 983151983142
983159983137983156983141983154 983154983141983155983151983157983154983139983141983155 983141983150983143983145983150983141983141983154983145983150983143 983155983157983139983144 983137983155 983156983144983151983155983141 983142983151983154
(983145) 983113983154983154983145983143983137983156983145983151983150
(983145983145) 983127983137983156983141983154 983155983157983152983152983148983161
(983145983145983145) 983110983148983151983151983140 983139983151983150983156983154983151983148
(983145983158) 983112983161983140983154983151983152983151983159983141983154 983137983150983140
(983158) 983118983137983158983145983143983137983156983145983151983150
29
1 Scientific Hydrology-a study concerned with academic aspects2 Engineering or applied Hydrology- a study concerned with
engineering applications
983112983161983140983154983151983148983151983143983145983139983137983148 983108983137983156983137
The basic hydrological data required are
1 Precipitation and climatological data - IMD
2 Topographic maps - SOI
3 Stream-flow records - CWC
4 Ground water data ndash Central Ground Water Board5 Evaporation and transpiration data -IMD
6 Cropping pattern crops and their consumptive use ndash Irrigation Dept
7 Soil map
8 Water quality data of surface streams and groundwater
9 Geological maps - GSI
30
7242019 CE-341 Lectures 1amp2
httpslidepdfcomreaderfullce-341-lectures-12 615
02-08-2012
6
Water Distribution
7242019 CE-341 Lectures 1amp2
httpslidepdfcomreaderfullce-341-lectures-12 715
02-08-2012
7
Land and Water Resources of India
Source-CWC India
7242019 CE-341 Lectures 1amp2
httpslidepdfcomreaderfullce-341-lectures-12 815
02-08-2012
8
Source-CWC India
Water Resources Potential (km3) in Major River Basins of India
2 Hydrologic Budget
The water budget represents the inventory of water for a specific waterbody (or hydrologic region) during a certain time interval
It can be estimated using the mass conservation equation whichexpresses the balance between the inflows outflows and change ofstorage in any water body hydrologic region over a period of time For a
drainage basin
P - R - G - E - T = ∆S (1)
16
P=precipitation R= runoff G= ground water flow E=evaporationT= Transpiration S = storage
7242019 CE-341 Lectures 1amp2
httpslidepdfcomreaderfullce-341-lectures-12 915
02-08-2012
9
For a drainage basin
17
Subscripts s=surface storage m = soil moisture storage g = ground water storagei = interception storage
Ir = rainfall intensity Isn = rate of snowfall Osr= surface runoff Osb= subsurfacerunoff Og = ground water runoff e = rate of evaporation et = rate of transpirationf = infiltration rate
( ) f eeOOO I I S S S S dt
d
O I dt dS
t gsbsr snr igms minusminusminusminusminusminus+=+++
minus=
3 Space-Time scales
Depending on the hydrologic problem under consideration thehydrologic cycle or its component can be treated at different scales oftime and space
The global scale is the largest spatial scale and the drainage basin thesmallest spatial scale
The time scales used in hydrologic studies range from a fraction of anhour to a year or perhaps many years The time scale used in ahydrologic study depends on the purpose of the study and the probleminvolved
18
7242019 CE-341 Lectures 1amp2
httpslidepdfcomreaderfullce-341-lectures-12 1015
02-08-2012
10
4 Catchment Area (drainage area drainage basin Watershed in USA)
983122983145983140983143983141 983148983145983150983141 983145983155 983137983148983155983151 983139983137983148983148983141983140 983108983145983158983145983140983141 983145983150 983125983123983105 983137983150983140 983127983137983156983141983154983155983144983141983140 983145983150 983125983115
19
983124983144983141 983148983145983150983141 983151983142 983156983144983141 983143983154983151983157983150983140 983159983137983156983141983154 983156983137983138983148983141 983142983154983151983149 983159983144983145983139983144 983156983144983141 983159983137983156983141983154 983156983137983138983148983141 983155983148983151983152983141983155 983140983151983159983150983159983137983154983140 983137983159983137983161
983142983154983151983149 983156983144983141 983148983145983150983141 983151983150 983138983151983156983144 983155983145983140983141983155 983145983155 983139983137983148983148983141983140 983156983144983141 983143983154983151983157983150983140 983159983137983156983141983154 983140983145983158983145983140983141
20
Catchmentboundary of
the Kosi riverAlmora
7242019 CE-341 Lectures 1amp2
httpslidepdfcomreaderfullce-341-lectures-12 1115
02-08-2012
11
21
StreamDrainagePattern
983107983144983137983154983137983139983156983141983154983145983155983156983145983139983155 983151983142 983156983144983141 983140983154983137983145983150983137983143983141
1 The number of streams
2 The length of streams
3
4 Drainage density
Stream density9830842-
km areaCatchment
streamsof Nunmber
A
N D s
s =
A
L D sd
nt)intermitteand(perennialchannelsstreamsallof lengthTotal=
22
Drainage density varies inversely as the length of overland flow andindicates the drainage efficiency of the basin
A high value indicates a well-developed network and torrential runoff causingintense floods while a low value indicates moderate runoff and highpermeability of the terrain
7242019 CE-341 Lectures 1amp2
httpslidepdfcomreaderfullce-341-lectures-12 1215
02-08-2012
12
983124983144983141 983155983144983137983152983141 983151983142 983137 983140983154983137983145983150983137983143983141 983138983137983155983145983150 983139983137983150 983143983141983150983141983154983137983148983148983161 983138983141 983141983160983152983154983141983155983155983141983140 983138983161
983110983151983154983149 983142983137983139983156983151983154 1 2
lt==
bb
b
f L
A
L
W F
983127 983138983101983137983160983145983137983148 983159983145983140983156983144 983151983142 983138983137983155983145983150
983116983138983101983137983160983145983137983148 983148983141983150983143983156983144 983151983142 983138983137983155983145983150 983145983141 983156983144983141 983140983145983155983156983137983150983139983141 983142983154983151983149 983156983144983141 983149983141983137983155983157983154983145983150983143 983152983151983145983150983156 983156983151 983156983144983141 983149983151983155983156
983154983141983149983151983156983141 983152983151983145983150983156 983151983150 983156983144983141 983138983137983155983145983150
983107983151983149983152983137983139983156983150983141983155983155 983139983151983141983142983142983145983139983145983141983150983156 1 2
ge=
A
PC b
cπ
983120983138983101983152983141983154983145983149983141983156983141983154 983151983142 983156983144983141 983138983137983155983145983150
Aπ 2 983101983139983145983154983139983157983149983142983141983154983141983150983139983141 983151983142 983139983145983154983139983157983148983137983154 983137983154983141983137 983144983137983158983145983150983143 983137983154983141983137 983141983153983157983137983148 983156983151 983156983144983141 983137983154983141983137 983151983142 983156983144983141 983138983137983155983145983150
983123983144983137983152983141 983142983137983139983156983151983154 1 2
gt= A
L B b
s
983109983148983151983150983143983137983156983145983151983150 983154983137983156983145983151 1 lengthWatershed
areawatershedof circleof Diameterle=
983107983145983154983139983157983148983137983154983145983156983161 9831549831379831569831459831511 perimeterwatershedof circleof Area
areaWatershedle=
24
7242019 CE-341 Lectures 1amp2
httpslidepdfcomreaderfullce-341-lectures-12 1315
02-08-2012
13
983106983137983155983145983150 983155983148983151983152983141 983101 983140983145983142983142983141983154983141983150983139983141 983145983150 983141983148983141983158983137983156983145983151983150 983138983141983156983159983141983141983150 983142983137983154983156983144983141983155983156 983152983151983145983150983156 983137983150983140 983151983157983156983148983141983156
983140983145983155983156983137983150983139983141 983142983154983151983149 983142983137983154983156983144983141983155983156 983152983151983145983150983156 983156983151 983151983157983156983148983141983156
983123983156983154983141983137983149 983155983148983151983152983141
1 983105983158983141983154983137983143983141 983155983156983154983141983137983149 983155983148983151983152983141983101983156983151983156983137983148 983142983137983148983148 983151983142 983156983144983141 983148983151983150983143983141983155983156 983159983137983156983141983154 983139983151983157983154983155983141983148983141983150983143983156983144 983151983142 983156983144983141
983141983150983156983145983154983141 983148983151983150983143983141983155983156 983159983137983156983141983154 983139983151983157983154983155983141
2
1
1
2 1
sum
sum=
=
=
N
ii
N
iii
m
L
S LS
2 The channel is divided into N number of reaches each having Slope Siand length Li (Johnstone and Cross 1949)
The equivalent stream slope
History of Hydrology
It is not easy to answer the question ldquoHow and where the science ofhydrology beganrdquo
In ancient times various hydrologic principles were successfullyapplied in practice
Early Chinese irrigation and flood control works and Greek andRoman aqueducts are worth mentioning
The Roman engineer Marcus Vitruvius (1st century BC) developedan early theory of the hydrologic cycle in his treatise On Architecture
During the Middle Ages Vitruviuss work was the standard referencebook on Hydrology
26
7242019 CE-341 Lectures 1amp2
httpslidepdfcomreaderfullce-341-lectures-12 1415
02-08-2012
14
15th century Leonardo da Vinci and Bernard Palissy gave independently ofeach other an accurate explanation of the hydrologic cycle
17th
century the modern science of hydrology was established by PerraultMariotte and Halley Perrault measured the rainfall and runoff in the SeineRiver and proved that rainfall contributes significantly to river flow He alsomeasured evaporation and capillarity Mariotte recorded the velocity of flow inthe Seine River and made measurements of the cross section estimating thedischarge Halley measured evaporation of the Mediterranean Sea
18th century The Bernoulli piezometer and theorem the Pitot tube andChezys formula are representative achievements
19th century experimental hydrology made considerable progress Darcyslaw of flow in porous media and Dupuit-Thiems well formula were
elaborated
Early 20th century governmental agencies developed their own programs ofhydrologic research Shermans unit hydrograph Hortons infiltration theoryand Theiss non-equilibrium approach to well hydraulics were based on theiranalyses and were the results of research programs
27
983107983144983151983159 983139983148983137983155983155983145983142983145983141983155 983156983144983141 983144983145983155983156983151983154983161 983151983142 983144983161983140983154983151983148983151983143983161 983145983150983156983151 983141983145983143983144983156 983152983141983154983145983151983140983155 983137983155
bull Period of Speculation ndash prior to AD 1400
bull Period of Observation ndash 1400 ndash 1600
bull Period of Measurement ndash 1600 ndash 1700
bull Period of Experimentation ndash 1700- 1800
bull Period of Modernization ndash 1800 ndash 1900
bull Period of Empiricism ndash 1900 ndash 1930
bull Period of Rationalization ndash 1930 ndash 1950
bull Period of Theorization ndash 1950 ndash to date
28
7242019 CE-341 Lectures 1amp2
httpslidepdfcomreaderfullce-341-lectures-12 1515
02-08-2012
983105983152983152983148983145983139983137983156983145983151983150983155 983113983150 983109983150983143983145983150983141983141983154983145983150983143
983112983161983140983154983151983148983151983143983161 983142983145983150983140983155 983145983156983155 983143983154983141983137983156983141983155983156 983137983152983152983148983145983139983137983156983145983151983150 983145983150 983156983144983141 983140983141983155983145983143983150 983137983150983140 983151983152983141983154983137983156983145983151983150 983151983142
983159983137983156983141983154 983154983141983155983151983157983154983139983141983155 983141983150983143983145983150983141983141983154983145983150983143 983155983157983139983144 983137983155 983156983144983151983155983141 983142983151983154
(983145) 983113983154983154983145983143983137983156983145983151983150
(983145983145) 983127983137983156983141983154 983155983157983152983152983148983161
(983145983145983145) 983110983148983151983151983140 983139983151983150983156983154983151983148
(983145983158) 983112983161983140983154983151983152983151983159983141983154 983137983150983140
(983158) 983118983137983158983145983143983137983156983145983151983150
29
1 Scientific Hydrology-a study concerned with academic aspects2 Engineering or applied Hydrology- a study concerned with
engineering applications
983112983161983140983154983151983148983151983143983145983139983137983148 983108983137983156983137
The basic hydrological data required are
1 Precipitation and climatological data - IMD
2 Topographic maps - SOI
3 Stream-flow records - CWC
4 Ground water data ndash Central Ground Water Board5 Evaporation and transpiration data -IMD
6 Cropping pattern crops and their consumptive use ndash Irrigation Dept
7 Soil map
8 Water quality data of surface streams and groundwater
9 Geological maps - GSI
30
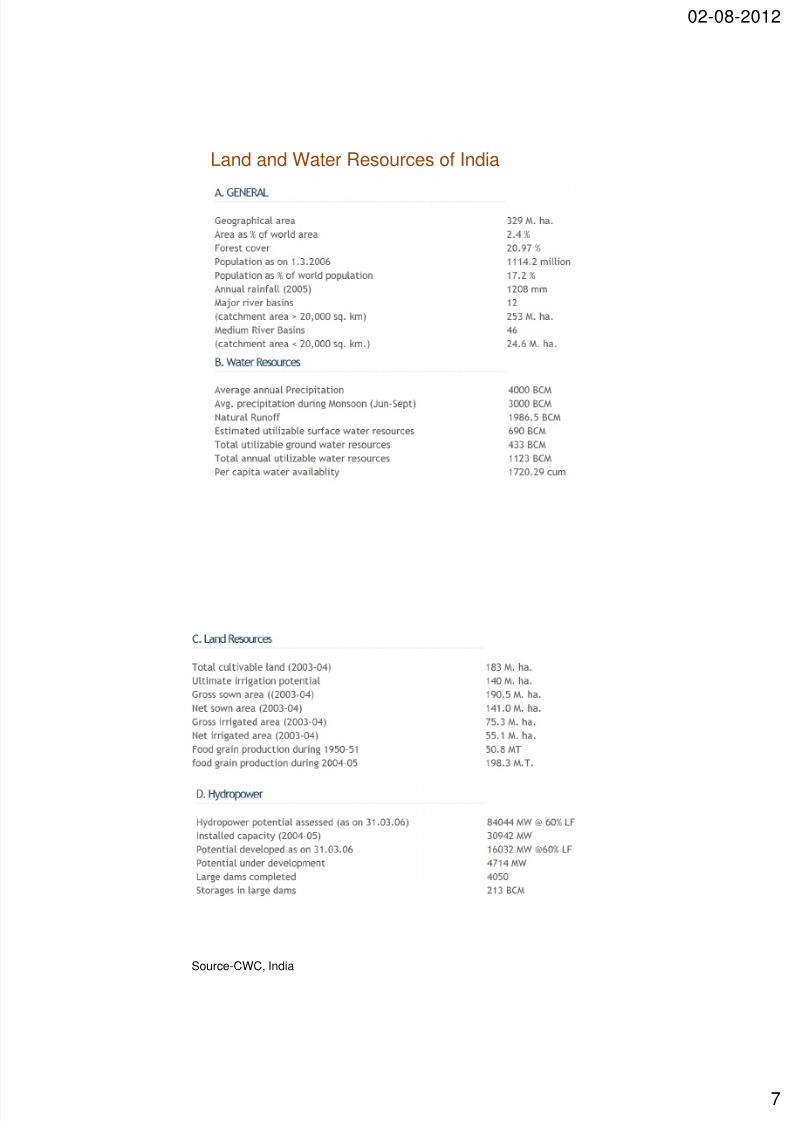
7242019 CE-341 Lectures 1amp2
httpslidepdfcomreaderfullce-341-lectures-12 715
02-08-2012
7
Land and Water Resources of India
Source-CWC India
7242019 CE-341 Lectures 1amp2
httpslidepdfcomreaderfullce-341-lectures-12 815
02-08-2012
8
Source-CWC India
Water Resources Potential (km3) in Major River Basins of India
2 Hydrologic Budget
The water budget represents the inventory of water for a specific waterbody (or hydrologic region) during a certain time interval
It can be estimated using the mass conservation equation whichexpresses the balance between the inflows outflows and change ofstorage in any water body hydrologic region over a period of time For a
drainage basin
P - R - G - E - T = ∆S (1)
16
P=precipitation R= runoff G= ground water flow E=evaporationT= Transpiration S = storage
7242019 CE-341 Lectures 1amp2
httpslidepdfcomreaderfullce-341-lectures-12 915
02-08-2012
9
For a drainage basin
17
Subscripts s=surface storage m = soil moisture storage g = ground water storagei = interception storage
Ir = rainfall intensity Isn = rate of snowfall Osr= surface runoff Osb= subsurfacerunoff Og = ground water runoff e = rate of evaporation et = rate of transpirationf = infiltration rate
( ) f eeOOO I I S S S S dt
d
O I dt dS
t gsbsr snr igms minusminusminusminusminusminus+=+++
minus=
3 Space-Time scales
Depending on the hydrologic problem under consideration thehydrologic cycle or its component can be treated at different scales oftime and space
The global scale is the largest spatial scale and the drainage basin thesmallest spatial scale
The time scales used in hydrologic studies range from a fraction of anhour to a year or perhaps many years The time scale used in ahydrologic study depends on the purpose of the study and the probleminvolved
18
7242019 CE-341 Lectures 1amp2
httpslidepdfcomreaderfullce-341-lectures-12 1015
02-08-2012
10
4 Catchment Area (drainage area drainage basin Watershed in USA)
983122983145983140983143983141 983148983145983150983141 983145983155 983137983148983155983151 983139983137983148983148983141983140 983108983145983158983145983140983141 983145983150 983125983123983105 983137983150983140 983127983137983156983141983154983155983144983141983140 983145983150 983125983115
19
983124983144983141 983148983145983150983141 983151983142 983156983144983141 983143983154983151983157983150983140 983159983137983156983141983154 983156983137983138983148983141 983142983154983151983149 983159983144983145983139983144 983156983144983141 983159983137983156983141983154 983156983137983138983148983141 983155983148983151983152983141983155 983140983151983159983150983159983137983154983140 983137983159983137983161
983142983154983151983149 983156983144983141 983148983145983150983141 983151983150 983138983151983156983144 983155983145983140983141983155 983145983155 983139983137983148983148983141983140 983156983144983141 983143983154983151983157983150983140 983159983137983156983141983154 983140983145983158983145983140983141
20
Catchmentboundary of
the Kosi riverAlmora
7242019 CE-341 Lectures 1amp2
httpslidepdfcomreaderfullce-341-lectures-12 1115
02-08-2012
11
21
StreamDrainagePattern
983107983144983137983154983137983139983156983141983154983145983155983156983145983139983155 983151983142 983156983144983141 983140983154983137983145983150983137983143983141
1 The number of streams
2 The length of streams
3
4 Drainage density
Stream density9830842-
km areaCatchment
streamsof Nunmber
A
N D s
s =
A
L D sd
nt)intermitteand(perennialchannelsstreamsallof lengthTotal=
22
Drainage density varies inversely as the length of overland flow andindicates the drainage efficiency of the basin
A high value indicates a well-developed network and torrential runoff causingintense floods while a low value indicates moderate runoff and highpermeability of the terrain
7242019 CE-341 Lectures 1amp2
httpslidepdfcomreaderfullce-341-lectures-12 1215
02-08-2012
12
983124983144983141 983155983144983137983152983141 983151983142 983137 983140983154983137983145983150983137983143983141 983138983137983155983145983150 983139983137983150 983143983141983150983141983154983137983148983148983161 983138983141 983141983160983152983154983141983155983155983141983140 983138983161
983110983151983154983149 983142983137983139983156983151983154 1 2
lt==
bb
b
f L
A
L
W F
983127 983138983101983137983160983145983137983148 983159983145983140983156983144 983151983142 983138983137983155983145983150
983116983138983101983137983160983145983137983148 983148983141983150983143983156983144 983151983142 983138983137983155983145983150 983145983141 983156983144983141 983140983145983155983156983137983150983139983141 983142983154983151983149 983156983144983141 983149983141983137983155983157983154983145983150983143 983152983151983145983150983156 983156983151 983156983144983141 983149983151983155983156
983154983141983149983151983156983141 983152983151983145983150983156 983151983150 983156983144983141 983138983137983155983145983150
983107983151983149983152983137983139983156983150983141983155983155 983139983151983141983142983142983145983139983145983141983150983156 1 2
ge=
A
PC b
cπ
983120983138983101983152983141983154983145983149983141983156983141983154 983151983142 983156983144983141 983138983137983155983145983150
Aπ 2 983101983139983145983154983139983157983149983142983141983154983141983150983139983141 983151983142 983139983145983154983139983157983148983137983154 983137983154983141983137 983144983137983158983145983150983143 983137983154983141983137 983141983153983157983137983148 983156983151 983156983144983141 983137983154983141983137 983151983142 983156983144983141 983138983137983155983145983150
983123983144983137983152983141 983142983137983139983156983151983154 1 2
gt= A
L B b
s
983109983148983151983150983143983137983156983145983151983150 983154983137983156983145983151 1 lengthWatershed
areawatershedof circleof Diameterle=
983107983145983154983139983157983148983137983154983145983156983161 9831549831379831569831459831511 perimeterwatershedof circleof Area
areaWatershedle=
24
7242019 CE-341 Lectures 1amp2
httpslidepdfcomreaderfullce-341-lectures-12 1315
02-08-2012
13
983106983137983155983145983150 983155983148983151983152983141 983101 983140983145983142983142983141983154983141983150983139983141 983145983150 983141983148983141983158983137983156983145983151983150 983138983141983156983159983141983141983150 983142983137983154983156983144983141983155983156 983152983151983145983150983156 983137983150983140 983151983157983156983148983141983156
983140983145983155983156983137983150983139983141 983142983154983151983149 983142983137983154983156983144983141983155983156 983152983151983145983150983156 983156983151 983151983157983156983148983141983156
983123983156983154983141983137983149 983155983148983151983152983141
1 983105983158983141983154983137983143983141 983155983156983154983141983137983149 983155983148983151983152983141983101983156983151983156983137983148 983142983137983148983148 983151983142 983156983144983141 983148983151983150983143983141983155983156 983159983137983156983141983154 983139983151983157983154983155983141983148983141983150983143983156983144 983151983142 983156983144983141
983141983150983156983145983154983141 983148983151983150983143983141983155983156 983159983137983156983141983154 983139983151983157983154983155983141
2
1
1
2 1
sum
sum=
=
=
N
ii
N
iii
m
L
S LS
2 The channel is divided into N number of reaches each having Slope Siand length Li (Johnstone and Cross 1949)
The equivalent stream slope
History of Hydrology
It is not easy to answer the question ldquoHow and where the science ofhydrology beganrdquo
In ancient times various hydrologic principles were successfullyapplied in practice
Early Chinese irrigation and flood control works and Greek andRoman aqueducts are worth mentioning
The Roman engineer Marcus Vitruvius (1st century BC) developedan early theory of the hydrologic cycle in his treatise On Architecture
During the Middle Ages Vitruviuss work was the standard referencebook on Hydrology
26
7242019 CE-341 Lectures 1amp2
httpslidepdfcomreaderfullce-341-lectures-12 1415
02-08-2012
14
15th century Leonardo da Vinci and Bernard Palissy gave independently ofeach other an accurate explanation of the hydrologic cycle
17th
century the modern science of hydrology was established by PerraultMariotte and Halley Perrault measured the rainfall and runoff in the SeineRiver and proved that rainfall contributes significantly to river flow He alsomeasured evaporation and capillarity Mariotte recorded the velocity of flow inthe Seine River and made measurements of the cross section estimating thedischarge Halley measured evaporation of the Mediterranean Sea
18th century The Bernoulli piezometer and theorem the Pitot tube andChezys formula are representative achievements
19th century experimental hydrology made considerable progress Darcyslaw of flow in porous media and Dupuit-Thiems well formula were
elaborated
Early 20th century governmental agencies developed their own programs ofhydrologic research Shermans unit hydrograph Hortons infiltration theoryand Theiss non-equilibrium approach to well hydraulics were based on theiranalyses and were the results of research programs
27
983107983144983151983159 983139983148983137983155983155983145983142983145983141983155 983156983144983141 983144983145983155983156983151983154983161 983151983142 983144983161983140983154983151983148983151983143983161 983145983150983156983151 983141983145983143983144983156 983152983141983154983145983151983140983155 983137983155
bull Period of Speculation ndash prior to AD 1400
bull Period of Observation ndash 1400 ndash 1600
bull Period of Measurement ndash 1600 ndash 1700
bull Period of Experimentation ndash 1700- 1800
bull Period of Modernization ndash 1800 ndash 1900
bull Period of Empiricism ndash 1900 ndash 1930
bull Period of Rationalization ndash 1930 ndash 1950
bull Period of Theorization ndash 1950 ndash to date
28
7242019 CE-341 Lectures 1amp2
httpslidepdfcomreaderfullce-341-lectures-12 1515
02-08-2012
983105983152983152983148983145983139983137983156983145983151983150983155 983113983150 983109983150983143983145983150983141983141983154983145983150983143
983112983161983140983154983151983148983151983143983161 983142983145983150983140983155 983145983156983155 983143983154983141983137983156983141983155983156 983137983152983152983148983145983139983137983156983145983151983150 983145983150 983156983144983141 983140983141983155983145983143983150 983137983150983140 983151983152983141983154983137983156983145983151983150 983151983142
983159983137983156983141983154 983154983141983155983151983157983154983139983141983155 983141983150983143983145983150983141983141983154983145983150983143 983155983157983139983144 983137983155 983156983144983151983155983141 983142983151983154
(983145) 983113983154983154983145983143983137983156983145983151983150
(983145983145) 983127983137983156983141983154 983155983157983152983152983148983161
(983145983145983145) 983110983148983151983151983140 983139983151983150983156983154983151983148
(983145983158) 983112983161983140983154983151983152983151983159983141983154 983137983150983140
(983158) 983118983137983158983145983143983137983156983145983151983150
29
1 Scientific Hydrology-a study concerned with academic aspects2 Engineering or applied Hydrology- a study concerned with
engineering applications
983112983161983140983154983151983148983151983143983145983139983137983148 983108983137983156983137
The basic hydrological data required are
1 Precipitation and climatological data - IMD
2 Topographic maps - SOI
3 Stream-flow records - CWC
4 Ground water data ndash Central Ground Water Board5 Evaporation and transpiration data -IMD
6 Cropping pattern crops and their consumptive use ndash Irrigation Dept
7 Soil map
8 Water quality data of surface streams and groundwater
9 Geological maps - GSI
30
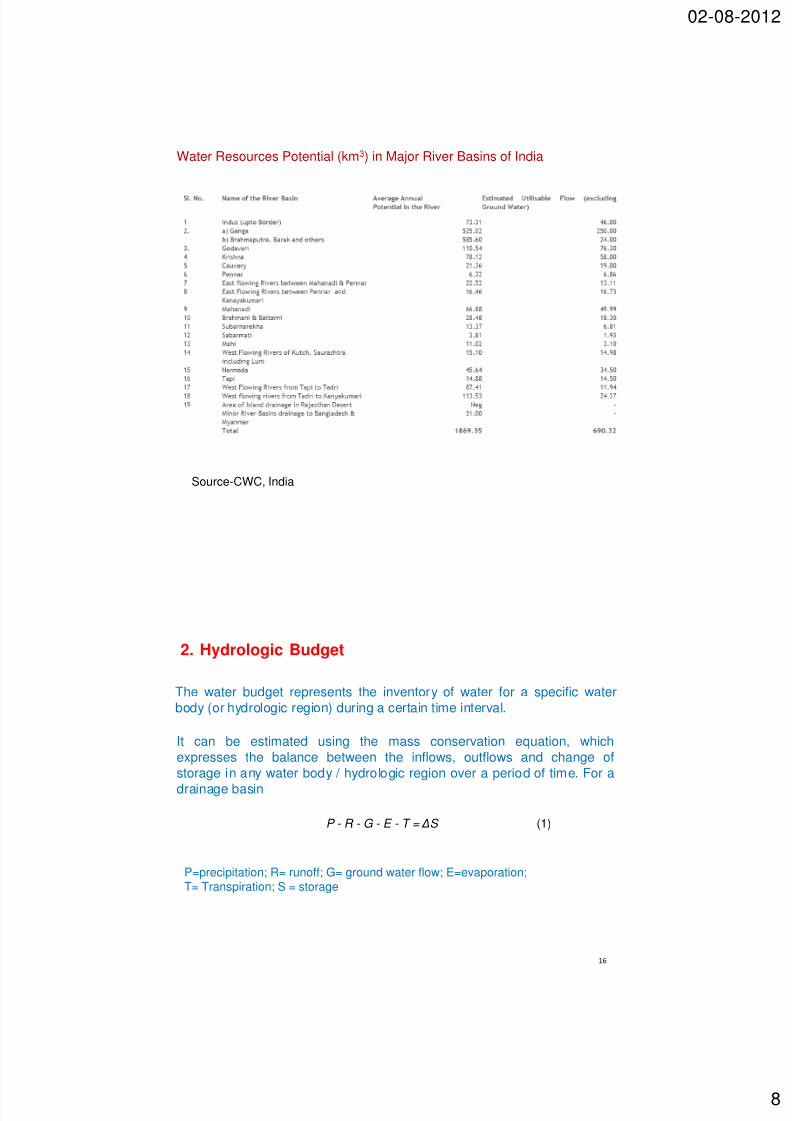
7242019 CE-341 Lectures 1amp2
httpslidepdfcomreaderfullce-341-lectures-12 815
02-08-2012
8
Source-CWC India
Water Resources Potential (km3) in Major River Basins of India
2 Hydrologic Budget
The water budget represents the inventory of water for a specific waterbody (or hydrologic region) during a certain time interval
It can be estimated using the mass conservation equation whichexpresses the balance between the inflows outflows and change ofstorage in any water body hydrologic region over a period of time For a
drainage basin
P - R - G - E - T = ∆S (1)
16
P=precipitation R= runoff G= ground water flow E=evaporationT= Transpiration S = storage
7242019 CE-341 Lectures 1amp2
httpslidepdfcomreaderfullce-341-lectures-12 915
02-08-2012
9
For a drainage basin
17
Subscripts s=surface storage m = soil moisture storage g = ground water storagei = interception storage
Ir = rainfall intensity Isn = rate of snowfall Osr= surface runoff Osb= subsurfacerunoff Og = ground water runoff e = rate of evaporation et = rate of transpirationf = infiltration rate
( ) f eeOOO I I S S S S dt
d
O I dt dS
t gsbsr snr igms minusminusminusminusminusminus+=+++
minus=
3 Space-Time scales
Depending on the hydrologic problem under consideration thehydrologic cycle or its component can be treated at different scales oftime and space
The global scale is the largest spatial scale and the drainage basin thesmallest spatial scale
The time scales used in hydrologic studies range from a fraction of anhour to a year or perhaps many years The time scale used in ahydrologic study depends on the purpose of the study and the probleminvolved
18
7242019 CE-341 Lectures 1amp2
httpslidepdfcomreaderfullce-341-lectures-12 1015
02-08-2012
10
4 Catchment Area (drainage area drainage basin Watershed in USA)
983122983145983140983143983141 983148983145983150983141 983145983155 983137983148983155983151 983139983137983148983148983141983140 983108983145983158983145983140983141 983145983150 983125983123983105 983137983150983140 983127983137983156983141983154983155983144983141983140 983145983150 983125983115
19
983124983144983141 983148983145983150983141 983151983142 983156983144983141 983143983154983151983157983150983140 983159983137983156983141983154 983156983137983138983148983141 983142983154983151983149 983159983144983145983139983144 983156983144983141 983159983137983156983141983154 983156983137983138983148983141 983155983148983151983152983141983155 983140983151983159983150983159983137983154983140 983137983159983137983161
983142983154983151983149 983156983144983141 983148983145983150983141 983151983150 983138983151983156983144 983155983145983140983141983155 983145983155 983139983137983148983148983141983140 983156983144983141 983143983154983151983157983150983140 983159983137983156983141983154 983140983145983158983145983140983141
20
Catchmentboundary of
the Kosi riverAlmora
7242019 CE-341 Lectures 1amp2
httpslidepdfcomreaderfullce-341-lectures-12 1115
02-08-2012
11
21
StreamDrainagePattern
983107983144983137983154983137983139983156983141983154983145983155983156983145983139983155 983151983142 983156983144983141 983140983154983137983145983150983137983143983141
1 The number of streams
2 The length of streams
3
4 Drainage density
Stream density9830842-
km areaCatchment
streamsof Nunmber
A
N D s
s =
A
L D sd
nt)intermitteand(perennialchannelsstreamsallof lengthTotal=
22
Drainage density varies inversely as the length of overland flow andindicates the drainage efficiency of the basin
A high value indicates a well-developed network and torrential runoff causingintense floods while a low value indicates moderate runoff and highpermeability of the terrain
7242019 CE-341 Lectures 1amp2
httpslidepdfcomreaderfullce-341-lectures-12 1215
02-08-2012
12
983124983144983141 983155983144983137983152983141 983151983142 983137 983140983154983137983145983150983137983143983141 983138983137983155983145983150 983139983137983150 983143983141983150983141983154983137983148983148983161 983138983141 983141983160983152983154983141983155983155983141983140 983138983161
983110983151983154983149 983142983137983139983156983151983154 1 2
lt==
bb
b
f L
A
L
W F
983127 983138983101983137983160983145983137983148 983159983145983140983156983144 983151983142 983138983137983155983145983150
983116983138983101983137983160983145983137983148 983148983141983150983143983156983144 983151983142 983138983137983155983145983150 983145983141 983156983144983141 983140983145983155983156983137983150983139983141 983142983154983151983149 983156983144983141 983149983141983137983155983157983154983145983150983143 983152983151983145983150983156 983156983151 983156983144983141 983149983151983155983156
983154983141983149983151983156983141 983152983151983145983150983156 983151983150 983156983144983141 983138983137983155983145983150
983107983151983149983152983137983139983156983150983141983155983155 983139983151983141983142983142983145983139983145983141983150983156 1 2
ge=
A
PC b
cπ
983120983138983101983152983141983154983145983149983141983156983141983154 983151983142 983156983144983141 983138983137983155983145983150
Aπ 2 983101983139983145983154983139983157983149983142983141983154983141983150983139983141 983151983142 983139983145983154983139983157983148983137983154 983137983154983141983137 983144983137983158983145983150983143 983137983154983141983137 983141983153983157983137983148 983156983151 983156983144983141 983137983154983141983137 983151983142 983156983144983141 983138983137983155983145983150
983123983144983137983152983141 983142983137983139983156983151983154 1 2
gt= A
L B b
s
983109983148983151983150983143983137983156983145983151983150 983154983137983156983145983151 1 lengthWatershed
areawatershedof circleof Diameterle=
983107983145983154983139983157983148983137983154983145983156983161 9831549831379831569831459831511 perimeterwatershedof circleof Area
areaWatershedle=
24
7242019 CE-341 Lectures 1amp2
httpslidepdfcomreaderfullce-341-lectures-12 1315
02-08-2012
13
983106983137983155983145983150 983155983148983151983152983141 983101 983140983145983142983142983141983154983141983150983139983141 983145983150 983141983148983141983158983137983156983145983151983150 983138983141983156983159983141983141983150 983142983137983154983156983144983141983155983156 983152983151983145983150983156 983137983150983140 983151983157983156983148983141983156
983140983145983155983156983137983150983139983141 983142983154983151983149 983142983137983154983156983144983141983155983156 983152983151983145983150983156 983156983151 983151983157983156983148983141983156
983123983156983154983141983137983149 983155983148983151983152983141
1 983105983158983141983154983137983143983141 983155983156983154983141983137983149 983155983148983151983152983141983101983156983151983156983137983148 983142983137983148983148 983151983142 983156983144983141 983148983151983150983143983141983155983156 983159983137983156983141983154 983139983151983157983154983155983141983148983141983150983143983156983144 983151983142 983156983144983141
983141983150983156983145983154983141 983148983151983150983143983141983155983156 983159983137983156983141983154 983139983151983157983154983155983141
2
1
1
2 1
sum
sum=
=
=
N
ii
N
iii
m
L
S LS
2 The channel is divided into N number of reaches each having Slope Siand length Li (Johnstone and Cross 1949)
The equivalent stream slope
History of Hydrology
It is not easy to answer the question ldquoHow and where the science ofhydrology beganrdquo
In ancient times various hydrologic principles were successfullyapplied in practice
Early Chinese irrigation and flood control works and Greek andRoman aqueducts are worth mentioning
The Roman engineer Marcus Vitruvius (1st century BC) developedan early theory of the hydrologic cycle in his treatise On Architecture
During the Middle Ages Vitruviuss work was the standard referencebook on Hydrology
26
7242019 CE-341 Lectures 1amp2
httpslidepdfcomreaderfullce-341-lectures-12 1415
02-08-2012
14
15th century Leonardo da Vinci and Bernard Palissy gave independently ofeach other an accurate explanation of the hydrologic cycle
17th
century the modern science of hydrology was established by PerraultMariotte and Halley Perrault measured the rainfall and runoff in the SeineRiver and proved that rainfall contributes significantly to river flow He alsomeasured evaporation and capillarity Mariotte recorded the velocity of flow inthe Seine River and made measurements of the cross section estimating thedischarge Halley measured evaporation of the Mediterranean Sea
18th century The Bernoulli piezometer and theorem the Pitot tube andChezys formula are representative achievements
19th century experimental hydrology made considerable progress Darcyslaw of flow in porous media and Dupuit-Thiems well formula were
elaborated
Early 20th century governmental agencies developed their own programs ofhydrologic research Shermans unit hydrograph Hortons infiltration theoryand Theiss non-equilibrium approach to well hydraulics were based on theiranalyses and were the results of research programs
27
983107983144983151983159 983139983148983137983155983155983145983142983145983141983155 983156983144983141 983144983145983155983156983151983154983161 983151983142 983144983161983140983154983151983148983151983143983161 983145983150983156983151 983141983145983143983144983156 983152983141983154983145983151983140983155 983137983155
bull Period of Speculation ndash prior to AD 1400
bull Period of Observation ndash 1400 ndash 1600
bull Period of Measurement ndash 1600 ndash 1700
bull Period of Experimentation ndash 1700- 1800
bull Period of Modernization ndash 1800 ndash 1900
bull Period of Empiricism ndash 1900 ndash 1930
bull Period of Rationalization ndash 1930 ndash 1950
bull Period of Theorization ndash 1950 ndash to date
28
7242019 CE-341 Lectures 1amp2
httpslidepdfcomreaderfullce-341-lectures-12 1515
02-08-2012
983105983152983152983148983145983139983137983156983145983151983150983155 983113983150 983109983150983143983145983150983141983141983154983145983150983143
983112983161983140983154983151983148983151983143983161 983142983145983150983140983155 983145983156983155 983143983154983141983137983156983141983155983156 983137983152983152983148983145983139983137983156983145983151983150 983145983150 983156983144983141 983140983141983155983145983143983150 983137983150983140 983151983152983141983154983137983156983145983151983150 983151983142
983159983137983156983141983154 983154983141983155983151983157983154983139983141983155 983141983150983143983145983150983141983141983154983145983150983143 983155983157983139983144 983137983155 983156983144983151983155983141 983142983151983154
(983145) 983113983154983154983145983143983137983156983145983151983150
(983145983145) 983127983137983156983141983154 983155983157983152983152983148983161
(983145983145983145) 983110983148983151983151983140 983139983151983150983156983154983151983148
(983145983158) 983112983161983140983154983151983152983151983159983141983154 983137983150983140
(983158) 983118983137983158983145983143983137983156983145983151983150
29
1 Scientific Hydrology-a study concerned with academic aspects2 Engineering or applied Hydrology- a study concerned with
engineering applications
983112983161983140983154983151983148983151983143983145983139983137983148 983108983137983156983137
The basic hydrological data required are
1 Precipitation and climatological data - IMD
2 Topographic maps - SOI
3 Stream-flow records - CWC
4 Ground water data ndash Central Ground Water Board5 Evaporation and transpiration data -IMD
6 Cropping pattern crops and their consumptive use ndash Irrigation Dept
7 Soil map
8 Water quality data of surface streams and groundwater
9 Geological maps - GSI
30
7242019 CE-341 Lectures 1amp2
httpslidepdfcomreaderfullce-341-lectures-12 915
02-08-2012
9
For a drainage basin
17
Subscripts s=surface storage m = soil moisture storage g = ground water storagei = interception storage
Ir = rainfall intensity Isn = rate of snowfall Osr= surface runoff Osb= subsurfacerunoff Og = ground water runoff e = rate of evaporation et = rate of transpirationf = infiltration rate
( ) f eeOOO I I S S S S dt
d
O I dt dS
t gsbsr snr igms minusminusminusminusminusminus+=+++
minus=
3 Space-Time scales
Depending on the hydrologic problem under consideration thehydrologic cycle or its component can be treated at different scales oftime and space
The global scale is the largest spatial scale and the drainage basin thesmallest spatial scale
The time scales used in hydrologic studies range from a fraction of anhour to a year or perhaps many years The time scale used in ahydrologic study depends on the purpose of the study and the probleminvolved
18
7242019 CE-341 Lectures 1amp2
httpslidepdfcomreaderfullce-341-lectures-12 1015
02-08-2012
10
4 Catchment Area (drainage area drainage basin Watershed in USA)
983122983145983140983143983141 983148983145983150983141 983145983155 983137983148983155983151 983139983137983148983148983141983140 983108983145983158983145983140983141 983145983150 983125983123983105 983137983150983140 983127983137983156983141983154983155983144983141983140 983145983150 983125983115
19
983124983144983141 983148983145983150983141 983151983142 983156983144983141 983143983154983151983157983150983140 983159983137983156983141983154 983156983137983138983148983141 983142983154983151983149 983159983144983145983139983144 983156983144983141 983159983137983156983141983154 983156983137983138983148983141 983155983148983151983152983141983155 983140983151983159983150983159983137983154983140 983137983159983137983161
983142983154983151983149 983156983144983141 983148983145983150983141 983151983150 983138983151983156983144 983155983145983140983141983155 983145983155 983139983137983148983148983141983140 983156983144983141 983143983154983151983157983150983140 983159983137983156983141983154 983140983145983158983145983140983141
20
Catchmentboundary of
the Kosi riverAlmora
7242019 CE-341 Lectures 1amp2
httpslidepdfcomreaderfullce-341-lectures-12 1115
02-08-2012
11
21
StreamDrainagePattern
983107983144983137983154983137983139983156983141983154983145983155983156983145983139983155 983151983142 983156983144983141 983140983154983137983145983150983137983143983141
1 The number of streams
2 The length of streams
3
4 Drainage density
Stream density9830842-
km areaCatchment
streamsof Nunmber
A
N D s
s =
A
L D sd
nt)intermitteand(perennialchannelsstreamsallof lengthTotal=
22
Drainage density varies inversely as the length of overland flow andindicates the drainage efficiency of the basin
A high value indicates a well-developed network and torrential runoff causingintense floods while a low value indicates moderate runoff and highpermeability of the terrain
7242019 CE-341 Lectures 1amp2
httpslidepdfcomreaderfullce-341-lectures-12 1215
02-08-2012
12
983124983144983141 983155983144983137983152983141 983151983142 983137 983140983154983137983145983150983137983143983141 983138983137983155983145983150 983139983137983150 983143983141983150983141983154983137983148983148983161 983138983141 983141983160983152983154983141983155983155983141983140 983138983161
983110983151983154983149 983142983137983139983156983151983154 1 2
lt==
bb
b
f L
A
L
W F
983127 983138983101983137983160983145983137983148 983159983145983140983156983144 983151983142 983138983137983155983145983150
983116983138983101983137983160983145983137983148 983148983141983150983143983156983144 983151983142 983138983137983155983145983150 983145983141 983156983144983141 983140983145983155983156983137983150983139983141 983142983154983151983149 983156983144983141 983149983141983137983155983157983154983145983150983143 983152983151983145983150983156 983156983151 983156983144983141 983149983151983155983156
983154983141983149983151983156983141 983152983151983145983150983156 983151983150 983156983144983141 983138983137983155983145983150
983107983151983149983152983137983139983156983150983141983155983155 983139983151983141983142983142983145983139983145983141983150983156 1 2
ge=
A
PC b
cπ
983120983138983101983152983141983154983145983149983141983156983141983154 983151983142 983156983144983141 983138983137983155983145983150
Aπ 2 983101983139983145983154983139983157983149983142983141983154983141983150983139983141 983151983142 983139983145983154983139983157983148983137983154 983137983154983141983137 983144983137983158983145983150983143 983137983154983141983137 983141983153983157983137983148 983156983151 983156983144983141 983137983154983141983137 983151983142 983156983144983141 983138983137983155983145983150
983123983144983137983152983141 983142983137983139983156983151983154 1 2
gt= A
L B b
s
983109983148983151983150983143983137983156983145983151983150 983154983137983156983145983151 1 lengthWatershed
areawatershedof circleof Diameterle=
983107983145983154983139983157983148983137983154983145983156983161 9831549831379831569831459831511 perimeterwatershedof circleof Area
areaWatershedle=
24
7242019 CE-341 Lectures 1amp2
httpslidepdfcomreaderfullce-341-lectures-12 1315
02-08-2012
13
983106983137983155983145983150 983155983148983151983152983141 983101 983140983145983142983142983141983154983141983150983139983141 983145983150 983141983148983141983158983137983156983145983151983150 983138983141983156983159983141983141983150 983142983137983154983156983144983141983155983156 983152983151983145983150983156 983137983150983140 983151983157983156983148983141983156
983140983145983155983156983137983150983139983141 983142983154983151983149 983142983137983154983156983144983141983155983156 983152983151983145983150983156 983156983151 983151983157983156983148983141983156
983123983156983154983141983137983149 983155983148983151983152983141
1 983105983158983141983154983137983143983141 983155983156983154983141983137983149 983155983148983151983152983141983101983156983151983156983137983148 983142983137983148983148 983151983142 983156983144983141 983148983151983150983143983141983155983156 983159983137983156983141983154 983139983151983157983154983155983141983148983141983150983143983156983144 983151983142 983156983144983141
983141983150983156983145983154983141 983148983151983150983143983141983155983156 983159983137983156983141983154 983139983151983157983154983155983141
2
1
1
2 1
sum
sum=
=
=
N
ii
N
iii
m
L
S LS
2 The channel is divided into N number of reaches each having Slope Siand length Li (Johnstone and Cross 1949)
The equivalent stream slope
History of Hydrology
It is not easy to answer the question ldquoHow and where the science ofhydrology beganrdquo
In ancient times various hydrologic principles were successfullyapplied in practice
Early Chinese irrigation and flood control works and Greek andRoman aqueducts are worth mentioning
The Roman engineer Marcus Vitruvius (1st century BC) developedan early theory of the hydrologic cycle in his treatise On Architecture
During the Middle Ages Vitruviuss work was the standard referencebook on Hydrology
26
7242019 CE-341 Lectures 1amp2
httpslidepdfcomreaderfullce-341-lectures-12 1415
02-08-2012
14
15th century Leonardo da Vinci and Bernard Palissy gave independently ofeach other an accurate explanation of the hydrologic cycle
17th
century the modern science of hydrology was established by PerraultMariotte and Halley Perrault measured the rainfall and runoff in the SeineRiver and proved that rainfall contributes significantly to river flow He alsomeasured evaporation and capillarity Mariotte recorded the velocity of flow inthe Seine River and made measurements of the cross section estimating thedischarge Halley measured evaporation of the Mediterranean Sea
18th century The Bernoulli piezometer and theorem the Pitot tube andChezys formula are representative achievements
19th century experimental hydrology made considerable progress Darcyslaw of flow in porous media and Dupuit-Thiems well formula were
elaborated
Early 20th century governmental agencies developed their own programs ofhydrologic research Shermans unit hydrograph Hortons infiltration theoryand Theiss non-equilibrium approach to well hydraulics were based on theiranalyses and were the results of research programs
27
983107983144983151983159 983139983148983137983155983155983145983142983145983141983155 983156983144983141 983144983145983155983156983151983154983161 983151983142 983144983161983140983154983151983148983151983143983161 983145983150983156983151 983141983145983143983144983156 983152983141983154983145983151983140983155 983137983155
bull Period of Speculation ndash prior to AD 1400
bull Period of Observation ndash 1400 ndash 1600
bull Period of Measurement ndash 1600 ndash 1700
bull Period of Experimentation ndash 1700- 1800
bull Period of Modernization ndash 1800 ndash 1900
bull Period of Empiricism ndash 1900 ndash 1930
bull Period of Rationalization ndash 1930 ndash 1950
bull Period of Theorization ndash 1950 ndash to date
28
7242019 CE-341 Lectures 1amp2
httpslidepdfcomreaderfullce-341-lectures-12 1515
02-08-2012
983105983152983152983148983145983139983137983156983145983151983150983155 983113983150 983109983150983143983145983150983141983141983154983145983150983143
983112983161983140983154983151983148983151983143983161 983142983145983150983140983155 983145983156983155 983143983154983141983137983156983141983155983156 983137983152983152983148983145983139983137983156983145983151983150 983145983150 983156983144983141 983140983141983155983145983143983150 983137983150983140 983151983152983141983154983137983156983145983151983150 983151983142
983159983137983156983141983154 983154983141983155983151983157983154983139983141983155 983141983150983143983145983150983141983141983154983145983150983143 983155983157983139983144 983137983155 983156983144983151983155983141 983142983151983154
(983145) 983113983154983154983145983143983137983156983145983151983150
(983145983145) 983127983137983156983141983154 983155983157983152983152983148983161
(983145983145983145) 983110983148983151983151983140 983139983151983150983156983154983151983148
(983145983158) 983112983161983140983154983151983152983151983159983141983154 983137983150983140
(983158) 983118983137983158983145983143983137983156983145983151983150
29
1 Scientific Hydrology-a study concerned with academic aspects2 Engineering or applied Hydrology- a study concerned with
engineering applications
983112983161983140983154983151983148983151983143983145983139983137983148 983108983137983156983137
The basic hydrological data required are
1 Precipitation and climatological data - IMD
2 Topographic maps - SOI
3 Stream-flow records - CWC
4 Ground water data ndash Central Ground Water Board5 Evaporation and transpiration data -IMD
6 Cropping pattern crops and their consumptive use ndash Irrigation Dept
7 Soil map
8 Water quality data of surface streams and groundwater
9 Geological maps - GSI
30
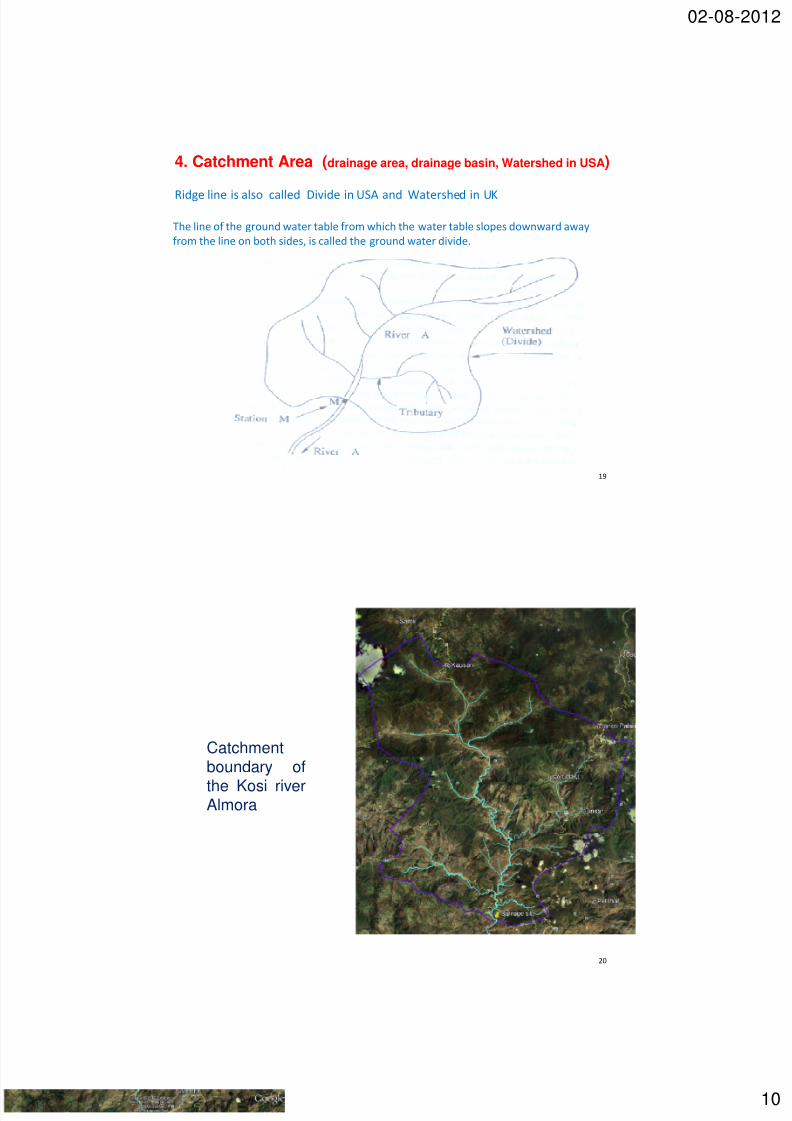
7242019 CE-341 Lectures 1amp2
httpslidepdfcomreaderfullce-341-lectures-12 1015
02-08-2012
10
4 Catchment Area (drainage area drainage basin Watershed in USA)
983122983145983140983143983141 983148983145983150983141 983145983155 983137983148983155983151 983139983137983148983148983141983140 983108983145983158983145983140983141 983145983150 983125983123983105 983137983150983140 983127983137983156983141983154983155983144983141983140 983145983150 983125983115
19
983124983144983141 983148983145983150983141 983151983142 983156983144983141 983143983154983151983157983150983140 983159983137983156983141983154 983156983137983138983148983141 983142983154983151983149 983159983144983145983139983144 983156983144983141 983159983137983156983141983154 983156983137983138983148983141 983155983148983151983152983141983155 983140983151983159983150983159983137983154983140 983137983159983137983161
983142983154983151983149 983156983144983141 983148983145983150983141 983151983150 983138983151983156983144 983155983145983140983141983155 983145983155 983139983137983148983148983141983140 983156983144983141 983143983154983151983157983150983140 983159983137983156983141983154 983140983145983158983145983140983141
20
Catchmentboundary of
the Kosi riverAlmora
7242019 CE-341 Lectures 1amp2
httpslidepdfcomreaderfullce-341-lectures-12 1115
02-08-2012
11
21
StreamDrainagePattern
983107983144983137983154983137983139983156983141983154983145983155983156983145983139983155 983151983142 983156983144983141 983140983154983137983145983150983137983143983141
1 The number of streams
2 The length of streams
3
4 Drainage density
Stream density9830842-
km areaCatchment
streamsof Nunmber
A
N D s
s =
A
L D sd
nt)intermitteand(perennialchannelsstreamsallof lengthTotal=
22
Drainage density varies inversely as the length of overland flow andindicates the drainage efficiency of the basin
A high value indicates a well-developed network and torrential runoff causingintense floods while a low value indicates moderate runoff and highpermeability of the terrain
7242019 CE-341 Lectures 1amp2
httpslidepdfcomreaderfullce-341-lectures-12 1215
02-08-2012
12
983124983144983141 983155983144983137983152983141 983151983142 983137 983140983154983137983145983150983137983143983141 983138983137983155983145983150 983139983137983150 983143983141983150983141983154983137983148983148983161 983138983141 983141983160983152983154983141983155983155983141983140 983138983161
983110983151983154983149 983142983137983139983156983151983154 1 2
lt==
bb
b
f L
A
L
W F
983127 983138983101983137983160983145983137983148 983159983145983140983156983144 983151983142 983138983137983155983145983150
983116983138983101983137983160983145983137983148 983148983141983150983143983156983144 983151983142 983138983137983155983145983150 983145983141 983156983144983141 983140983145983155983156983137983150983139983141 983142983154983151983149 983156983144983141 983149983141983137983155983157983154983145983150983143 983152983151983145983150983156 983156983151 983156983144983141 983149983151983155983156
983154983141983149983151983156983141 983152983151983145983150983156 983151983150 983156983144983141 983138983137983155983145983150
983107983151983149983152983137983139983156983150983141983155983155 983139983151983141983142983142983145983139983145983141983150983156 1 2
ge=
A
PC b
cπ
983120983138983101983152983141983154983145983149983141983156983141983154 983151983142 983156983144983141 983138983137983155983145983150
Aπ 2 983101983139983145983154983139983157983149983142983141983154983141983150983139983141 983151983142 983139983145983154983139983157983148983137983154 983137983154983141983137 983144983137983158983145983150983143 983137983154983141983137 983141983153983157983137983148 983156983151 983156983144983141 983137983154983141983137 983151983142 983156983144983141 983138983137983155983145983150
983123983144983137983152983141 983142983137983139983156983151983154 1 2
gt= A
L B b
s
983109983148983151983150983143983137983156983145983151983150 983154983137983156983145983151 1 lengthWatershed
areawatershedof circleof Diameterle=
983107983145983154983139983157983148983137983154983145983156983161 9831549831379831569831459831511 perimeterwatershedof circleof Area
areaWatershedle=
24
7242019 CE-341 Lectures 1amp2
httpslidepdfcomreaderfullce-341-lectures-12 1315
02-08-2012
13
983106983137983155983145983150 983155983148983151983152983141 983101 983140983145983142983142983141983154983141983150983139983141 983145983150 983141983148983141983158983137983156983145983151983150 983138983141983156983159983141983141983150 983142983137983154983156983144983141983155983156 983152983151983145983150983156 983137983150983140 983151983157983156983148983141983156
983140983145983155983156983137983150983139983141 983142983154983151983149 983142983137983154983156983144983141983155983156 983152983151983145983150983156 983156983151 983151983157983156983148983141983156
983123983156983154983141983137983149 983155983148983151983152983141
1 983105983158983141983154983137983143983141 983155983156983154983141983137983149 983155983148983151983152983141983101983156983151983156983137983148 983142983137983148983148 983151983142 983156983144983141 983148983151983150983143983141983155983156 983159983137983156983141983154 983139983151983157983154983155983141983148983141983150983143983156983144 983151983142 983156983144983141
983141983150983156983145983154983141 983148983151983150983143983141983155983156 983159983137983156983141983154 983139983151983157983154983155983141
2
1
1
2 1
sum
sum=
=
=
N
ii
N
iii
m
L
S LS
2 The channel is divided into N number of reaches each having Slope Siand length Li (Johnstone and Cross 1949)
The equivalent stream slope
History of Hydrology
It is not easy to answer the question ldquoHow and where the science ofhydrology beganrdquo
In ancient times various hydrologic principles were successfullyapplied in practice
Early Chinese irrigation and flood control works and Greek andRoman aqueducts are worth mentioning
The Roman engineer Marcus Vitruvius (1st century BC) developedan early theory of the hydrologic cycle in his treatise On Architecture
During the Middle Ages Vitruviuss work was the standard referencebook on Hydrology
26
7242019 CE-341 Lectures 1amp2
httpslidepdfcomreaderfullce-341-lectures-12 1415
02-08-2012
14
15th century Leonardo da Vinci and Bernard Palissy gave independently ofeach other an accurate explanation of the hydrologic cycle
17th
century the modern science of hydrology was established by PerraultMariotte and Halley Perrault measured the rainfall and runoff in the SeineRiver and proved that rainfall contributes significantly to river flow He alsomeasured evaporation and capillarity Mariotte recorded the velocity of flow inthe Seine River and made measurements of the cross section estimating thedischarge Halley measured evaporation of the Mediterranean Sea
18th century The Bernoulli piezometer and theorem the Pitot tube andChezys formula are representative achievements
19th century experimental hydrology made considerable progress Darcyslaw of flow in porous media and Dupuit-Thiems well formula were
elaborated
Early 20th century governmental agencies developed their own programs ofhydrologic research Shermans unit hydrograph Hortons infiltration theoryand Theiss non-equilibrium approach to well hydraulics were based on theiranalyses and were the results of research programs
27
983107983144983151983159 983139983148983137983155983155983145983142983145983141983155 983156983144983141 983144983145983155983156983151983154983161 983151983142 983144983161983140983154983151983148983151983143983161 983145983150983156983151 983141983145983143983144983156 983152983141983154983145983151983140983155 983137983155
bull Period of Speculation ndash prior to AD 1400
bull Period of Observation ndash 1400 ndash 1600
bull Period of Measurement ndash 1600 ndash 1700
bull Period of Experimentation ndash 1700- 1800
bull Period of Modernization ndash 1800 ndash 1900
bull Period of Empiricism ndash 1900 ndash 1930
bull Period of Rationalization ndash 1930 ndash 1950
bull Period of Theorization ndash 1950 ndash to date
28
7242019 CE-341 Lectures 1amp2
httpslidepdfcomreaderfullce-341-lectures-12 1515
02-08-2012
983105983152983152983148983145983139983137983156983145983151983150983155 983113983150 983109983150983143983145983150983141983141983154983145983150983143
983112983161983140983154983151983148983151983143983161 983142983145983150983140983155 983145983156983155 983143983154983141983137983156983141983155983156 983137983152983152983148983145983139983137983156983145983151983150 983145983150 983156983144983141 983140983141983155983145983143983150 983137983150983140 983151983152983141983154983137983156983145983151983150 983151983142
983159983137983156983141983154 983154983141983155983151983157983154983139983141983155 983141983150983143983145983150983141983141983154983145983150983143 983155983157983139983144 983137983155 983156983144983151983155983141 983142983151983154
(983145) 983113983154983154983145983143983137983156983145983151983150
(983145983145) 983127983137983156983141983154 983155983157983152983152983148983161
(983145983145983145) 983110983148983151983151983140 983139983151983150983156983154983151983148
(983145983158) 983112983161983140983154983151983152983151983159983141983154 983137983150983140
(983158) 983118983137983158983145983143983137983156983145983151983150
29
1 Scientific Hydrology-a study concerned with academic aspects2 Engineering or applied Hydrology- a study concerned with
engineering applications
983112983161983140983154983151983148983151983143983145983139983137983148 983108983137983156983137
The basic hydrological data required are
1 Precipitation and climatological data - IMD
2 Topographic maps - SOI
3 Stream-flow records - CWC
4 Ground water data ndash Central Ground Water Board5 Evaporation and transpiration data -IMD
6 Cropping pattern crops and their consumptive use ndash Irrigation Dept
7 Soil map
8 Water quality data of surface streams and groundwater
9 Geological maps - GSI
30
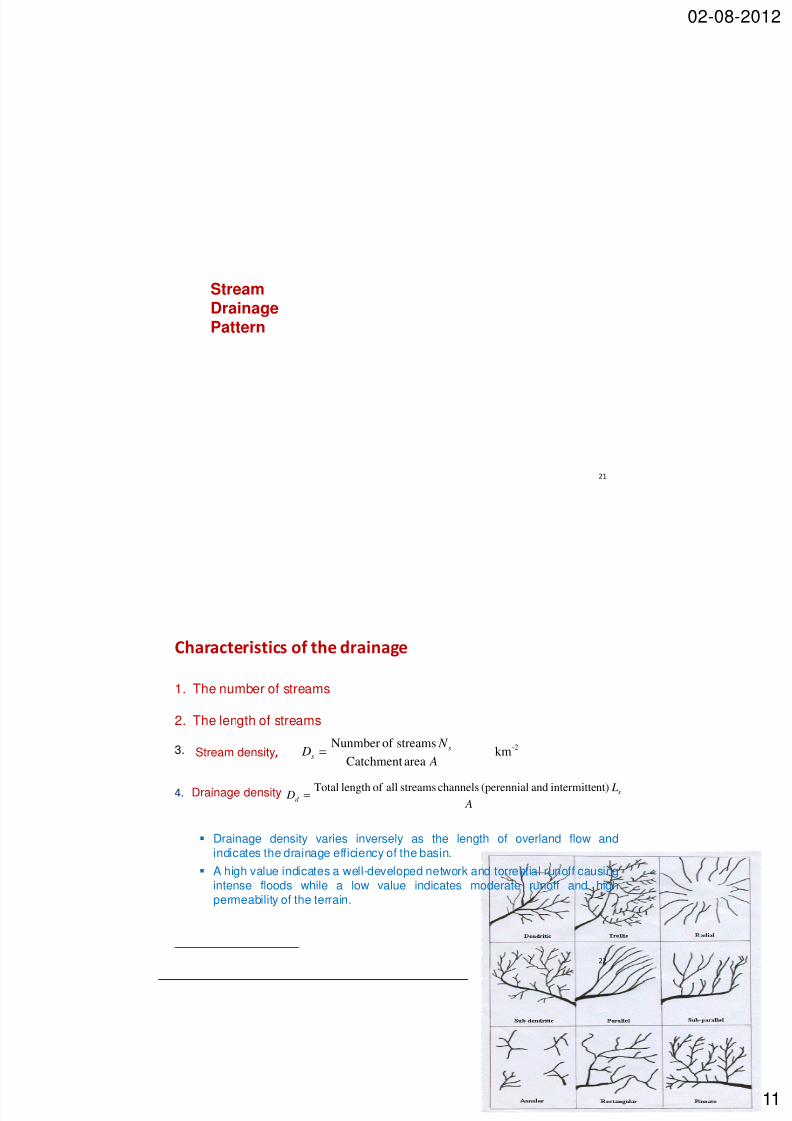
7242019 CE-341 Lectures 1amp2
httpslidepdfcomreaderfullce-341-lectures-12 1115
02-08-2012
11
21
StreamDrainagePattern
983107983144983137983154983137983139983156983141983154983145983155983156983145983139983155 983151983142 983156983144983141 983140983154983137983145983150983137983143983141
1 The number of streams
2 The length of streams
3
4 Drainage density
Stream density9830842-
km areaCatchment
streamsof Nunmber
A
N D s
s =
A
L D sd
nt)intermitteand(perennialchannelsstreamsallof lengthTotal=
22
Drainage density varies inversely as the length of overland flow andindicates the drainage efficiency of the basin
A high value indicates a well-developed network and torrential runoff causingintense floods while a low value indicates moderate runoff and highpermeability of the terrain
7242019 CE-341 Lectures 1amp2
httpslidepdfcomreaderfullce-341-lectures-12 1215
02-08-2012
12
983124983144983141 983155983144983137983152983141 983151983142 983137 983140983154983137983145983150983137983143983141 983138983137983155983145983150 983139983137983150 983143983141983150983141983154983137983148983148983161 983138983141 983141983160983152983154983141983155983155983141983140 983138983161
983110983151983154983149 983142983137983139983156983151983154 1 2
lt==
bb
b
f L
A
L
W F
983127 983138983101983137983160983145983137983148 983159983145983140983156983144 983151983142 983138983137983155983145983150
983116983138983101983137983160983145983137983148 983148983141983150983143983156983144 983151983142 983138983137983155983145983150 983145983141 983156983144983141 983140983145983155983156983137983150983139983141 983142983154983151983149 983156983144983141 983149983141983137983155983157983154983145983150983143 983152983151983145983150983156 983156983151 983156983144983141 983149983151983155983156
983154983141983149983151983156983141 983152983151983145983150983156 983151983150 983156983144983141 983138983137983155983145983150
983107983151983149983152983137983139983156983150983141983155983155 983139983151983141983142983142983145983139983145983141983150983156 1 2
ge=
A
PC b
cπ
983120983138983101983152983141983154983145983149983141983156983141983154 983151983142 983156983144983141 983138983137983155983145983150
Aπ 2 983101983139983145983154983139983157983149983142983141983154983141983150983139983141 983151983142 983139983145983154983139983157983148983137983154 983137983154983141983137 983144983137983158983145983150983143 983137983154983141983137 983141983153983157983137983148 983156983151 983156983144983141 983137983154983141983137 983151983142 983156983144983141 983138983137983155983145983150
983123983144983137983152983141 983142983137983139983156983151983154 1 2
gt= A
L B b
s
983109983148983151983150983143983137983156983145983151983150 983154983137983156983145983151 1 lengthWatershed
areawatershedof circleof Diameterle=
983107983145983154983139983157983148983137983154983145983156983161 9831549831379831569831459831511 perimeterwatershedof circleof Area
areaWatershedle=
24
7242019 CE-341 Lectures 1amp2
httpslidepdfcomreaderfullce-341-lectures-12 1315
02-08-2012
13
983106983137983155983145983150 983155983148983151983152983141 983101 983140983145983142983142983141983154983141983150983139983141 983145983150 983141983148983141983158983137983156983145983151983150 983138983141983156983159983141983141983150 983142983137983154983156983144983141983155983156 983152983151983145983150983156 983137983150983140 983151983157983156983148983141983156
983140983145983155983156983137983150983139983141 983142983154983151983149 983142983137983154983156983144983141983155983156 983152983151983145983150983156 983156983151 983151983157983156983148983141983156
983123983156983154983141983137983149 983155983148983151983152983141
1 983105983158983141983154983137983143983141 983155983156983154983141983137983149 983155983148983151983152983141983101983156983151983156983137983148 983142983137983148983148 983151983142 983156983144983141 983148983151983150983143983141983155983156 983159983137983156983141983154 983139983151983157983154983155983141983148983141983150983143983156983144 983151983142 983156983144983141
983141983150983156983145983154983141 983148983151983150983143983141983155983156 983159983137983156983141983154 983139983151983157983154983155983141
2
1
1
2 1
sum
sum=
=
=
N
ii
N
iii
m
L
S LS
2 The channel is divided into N number of reaches each having Slope Siand length Li (Johnstone and Cross 1949)
The equivalent stream slope
History of Hydrology
It is not easy to answer the question ldquoHow and where the science ofhydrology beganrdquo
In ancient times various hydrologic principles were successfullyapplied in practice
Early Chinese irrigation and flood control works and Greek andRoman aqueducts are worth mentioning
The Roman engineer Marcus Vitruvius (1st century BC) developedan early theory of the hydrologic cycle in his treatise On Architecture
During the Middle Ages Vitruviuss work was the standard referencebook on Hydrology
26
7242019 CE-341 Lectures 1amp2
httpslidepdfcomreaderfullce-341-lectures-12 1415
02-08-2012
14
15th century Leonardo da Vinci and Bernard Palissy gave independently ofeach other an accurate explanation of the hydrologic cycle
17th
century the modern science of hydrology was established by PerraultMariotte and Halley Perrault measured the rainfall and runoff in the SeineRiver and proved that rainfall contributes significantly to river flow He alsomeasured evaporation and capillarity Mariotte recorded the velocity of flow inthe Seine River and made measurements of the cross section estimating thedischarge Halley measured evaporation of the Mediterranean Sea
18th century The Bernoulli piezometer and theorem the Pitot tube andChezys formula are representative achievements
19th century experimental hydrology made considerable progress Darcyslaw of flow in porous media and Dupuit-Thiems well formula were
elaborated
Early 20th century governmental agencies developed their own programs ofhydrologic research Shermans unit hydrograph Hortons infiltration theoryand Theiss non-equilibrium approach to well hydraulics were based on theiranalyses and were the results of research programs
27
983107983144983151983159 983139983148983137983155983155983145983142983145983141983155 983156983144983141 983144983145983155983156983151983154983161 983151983142 983144983161983140983154983151983148983151983143983161 983145983150983156983151 983141983145983143983144983156 983152983141983154983145983151983140983155 983137983155
bull Period of Speculation ndash prior to AD 1400
bull Period of Observation ndash 1400 ndash 1600
bull Period of Measurement ndash 1600 ndash 1700
bull Period of Experimentation ndash 1700- 1800
bull Period of Modernization ndash 1800 ndash 1900
bull Period of Empiricism ndash 1900 ndash 1930
bull Period of Rationalization ndash 1930 ndash 1950
bull Period of Theorization ndash 1950 ndash to date
28
7242019 CE-341 Lectures 1amp2
httpslidepdfcomreaderfullce-341-lectures-12 1515
02-08-2012
983105983152983152983148983145983139983137983156983145983151983150983155 983113983150 983109983150983143983145983150983141983141983154983145983150983143
983112983161983140983154983151983148983151983143983161 983142983145983150983140983155 983145983156983155 983143983154983141983137983156983141983155983156 983137983152983152983148983145983139983137983156983145983151983150 983145983150 983156983144983141 983140983141983155983145983143983150 983137983150983140 983151983152983141983154983137983156983145983151983150 983151983142
983159983137983156983141983154 983154983141983155983151983157983154983139983141983155 983141983150983143983145983150983141983141983154983145983150983143 983155983157983139983144 983137983155 983156983144983151983155983141 983142983151983154
(983145) 983113983154983154983145983143983137983156983145983151983150
(983145983145) 983127983137983156983141983154 983155983157983152983152983148983161
(983145983145983145) 983110983148983151983151983140 983139983151983150983156983154983151983148
(983145983158) 983112983161983140983154983151983152983151983159983141983154 983137983150983140
(983158) 983118983137983158983145983143983137983156983145983151983150
29
1 Scientific Hydrology-a study concerned with academic aspects2 Engineering or applied Hydrology- a study concerned with
engineering applications
983112983161983140983154983151983148983151983143983145983139983137983148 983108983137983156983137
The basic hydrological data required are
1 Precipitation and climatological data - IMD
2 Topographic maps - SOI
3 Stream-flow records - CWC
4 Ground water data ndash Central Ground Water Board5 Evaporation and transpiration data -IMD
6 Cropping pattern crops and their consumptive use ndash Irrigation Dept
7 Soil map
8 Water quality data of surface streams and groundwater
9 Geological maps - GSI
30
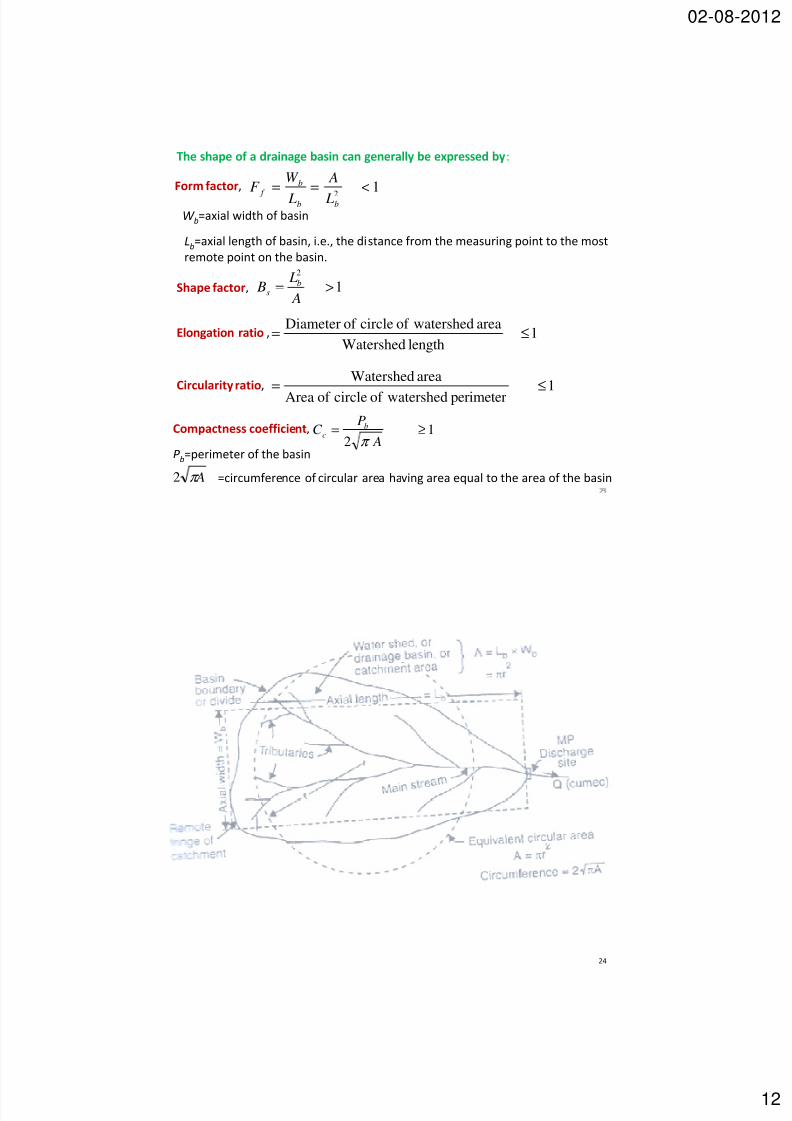
7242019 CE-341 Lectures 1amp2
httpslidepdfcomreaderfullce-341-lectures-12 1215
02-08-2012
12
983124983144983141 983155983144983137983152983141 983151983142 983137 983140983154983137983145983150983137983143983141 983138983137983155983145983150 983139983137983150 983143983141983150983141983154983137983148983148983161 983138983141 983141983160983152983154983141983155983155983141983140 983138983161
983110983151983154983149 983142983137983139983156983151983154 1 2
lt==
bb
b
f L
A
L
W F
983127 983138983101983137983160983145983137983148 983159983145983140983156983144 983151983142 983138983137983155983145983150
983116983138983101983137983160983145983137983148 983148983141983150983143983156983144 983151983142 983138983137983155983145983150 983145983141 983156983144983141 983140983145983155983156983137983150983139983141 983142983154983151983149 983156983144983141 983149983141983137983155983157983154983145983150983143 983152983151983145983150983156 983156983151 983156983144983141 983149983151983155983156
983154983141983149983151983156983141 983152983151983145983150983156 983151983150 983156983144983141 983138983137983155983145983150
983107983151983149983152983137983139983156983150983141983155983155 983139983151983141983142983142983145983139983145983141983150983156 1 2
ge=
A
PC b
cπ
983120983138983101983152983141983154983145983149983141983156983141983154 983151983142 983156983144983141 983138983137983155983145983150
Aπ 2 983101983139983145983154983139983157983149983142983141983154983141983150983139983141 983151983142 983139983145983154983139983157983148983137983154 983137983154983141983137 983144983137983158983145983150983143 983137983154983141983137 983141983153983157983137983148 983156983151 983156983144983141 983137983154983141983137 983151983142 983156983144983141 983138983137983155983145983150
983123983144983137983152983141 983142983137983139983156983151983154 1 2
gt= A
L B b
s
983109983148983151983150983143983137983156983145983151983150 983154983137983156983145983151 1 lengthWatershed
areawatershedof circleof Diameterle=
983107983145983154983139983157983148983137983154983145983156983161 9831549831379831569831459831511 perimeterwatershedof circleof Area
areaWatershedle=
24
7242019 CE-341 Lectures 1amp2
httpslidepdfcomreaderfullce-341-lectures-12 1315
02-08-2012
13
983106983137983155983145983150 983155983148983151983152983141 983101 983140983145983142983142983141983154983141983150983139983141 983145983150 983141983148983141983158983137983156983145983151983150 983138983141983156983159983141983141983150 983142983137983154983156983144983141983155983156 983152983151983145983150983156 983137983150983140 983151983157983156983148983141983156
983140983145983155983156983137983150983139983141 983142983154983151983149 983142983137983154983156983144983141983155983156 983152983151983145983150983156 983156983151 983151983157983156983148983141983156
983123983156983154983141983137983149 983155983148983151983152983141
1 983105983158983141983154983137983143983141 983155983156983154983141983137983149 983155983148983151983152983141983101983156983151983156983137983148 983142983137983148983148 983151983142 983156983144983141 983148983151983150983143983141983155983156 983159983137983156983141983154 983139983151983157983154983155983141983148983141983150983143983156983144 983151983142 983156983144983141
983141983150983156983145983154983141 983148983151983150983143983141983155983156 983159983137983156983141983154 983139983151983157983154983155983141
2
1
1
2 1
sum
sum=
=
=
N
ii
N
iii
m
L
S LS
2 The channel is divided into N number of reaches each having Slope Siand length Li (Johnstone and Cross 1949)
The equivalent stream slope
History of Hydrology
It is not easy to answer the question ldquoHow and where the science ofhydrology beganrdquo
In ancient times various hydrologic principles were successfullyapplied in practice
Early Chinese irrigation and flood control works and Greek andRoman aqueducts are worth mentioning
The Roman engineer Marcus Vitruvius (1st century BC) developedan early theory of the hydrologic cycle in his treatise On Architecture
During the Middle Ages Vitruviuss work was the standard referencebook on Hydrology
26
7242019 CE-341 Lectures 1amp2
httpslidepdfcomreaderfullce-341-lectures-12 1415
02-08-2012
14
15th century Leonardo da Vinci and Bernard Palissy gave independently ofeach other an accurate explanation of the hydrologic cycle
17th
century the modern science of hydrology was established by PerraultMariotte and Halley Perrault measured the rainfall and runoff in the SeineRiver and proved that rainfall contributes significantly to river flow He alsomeasured evaporation and capillarity Mariotte recorded the velocity of flow inthe Seine River and made measurements of the cross section estimating thedischarge Halley measured evaporation of the Mediterranean Sea
18th century The Bernoulli piezometer and theorem the Pitot tube andChezys formula are representative achievements
19th century experimental hydrology made considerable progress Darcyslaw of flow in porous media and Dupuit-Thiems well formula were
elaborated
Early 20th century governmental agencies developed their own programs ofhydrologic research Shermans unit hydrograph Hortons infiltration theoryand Theiss non-equilibrium approach to well hydraulics were based on theiranalyses and were the results of research programs
27
983107983144983151983159 983139983148983137983155983155983145983142983145983141983155 983156983144983141 983144983145983155983156983151983154983161 983151983142 983144983161983140983154983151983148983151983143983161 983145983150983156983151 983141983145983143983144983156 983152983141983154983145983151983140983155 983137983155
bull Period of Speculation ndash prior to AD 1400
bull Period of Observation ndash 1400 ndash 1600
bull Period of Measurement ndash 1600 ndash 1700
bull Period of Experimentation ndash 1700- 1800
bull Period of Modernization ndash 1800 ndash 1900
bull Period of Empiricism ndash 1900 ndash 1930
bull Period of Rationalization ndash 1930 ndash 1950
bull Period of Theorization ndash 1950 ndash to date
28
7242019 CE-341 Lectures 1amp2
httpslidepdfcomreaderfullce-341-lectures-12 1515
02-08-2012
983105983152983152983148983145983139983137983156983145983151983150983155 983113983150 983109983150983143983145983150983141983141983154983145983150983143
983112983161983140983154983151983148983151983143983161 983142983145983150983140983155 983145983156983155 983143983154983141983137983156983141983155983156 983137983152983152983148983145983139983137983156983145983151983150 983145983150 983156983144983141 983140983141983155983145983143983150 983137983150983140 983151983152983141983154983137983156983145983151983150 983151983142
983159983137983156983141983154 983154983141983155983151983157983154983139983141983155 983141983150983143983145983150983141983141983154983145983150983143 983155983157983139983144 983137983155 983156983144983151983155983141 983142983151983154
(983145) 983113983154983154983145983143983137983156983145983151983150
(983145983145) 983127983137983156983141983154 983155983157983152983152983148983161
(983145983145983145) 983110983148983151983151983140 983139983151983150983156983154983151983148
(983145983158) 983112983161983140983154983151983152983151983159983141983154 983137983150983140
(983158) 983118983137983158983145983143983137983156983145983151983150
29
1 Scientific Hydrology-a study concerned with academic aspects2 Engineering or applied Hydrology- a study concerned with
engineering applications
983112983161983140983154983151983148983151983143983145983139983137983148 983108983137983156983137
The basic hydrological data required are
1 Precipitation and climatological data - IMD
2 Topographic maps - SOI
3 Stream-flow records - CWC
4 Ground water data ndash Central Ground Water Board5 Evaporation and transpiration data -IMD
6 Cropping pattern crops and their consumptive use ndash Irrigation Dept
7 Soil map
8 Water quality data of surface streams and groundwater
9 Geological maps - GSI
30
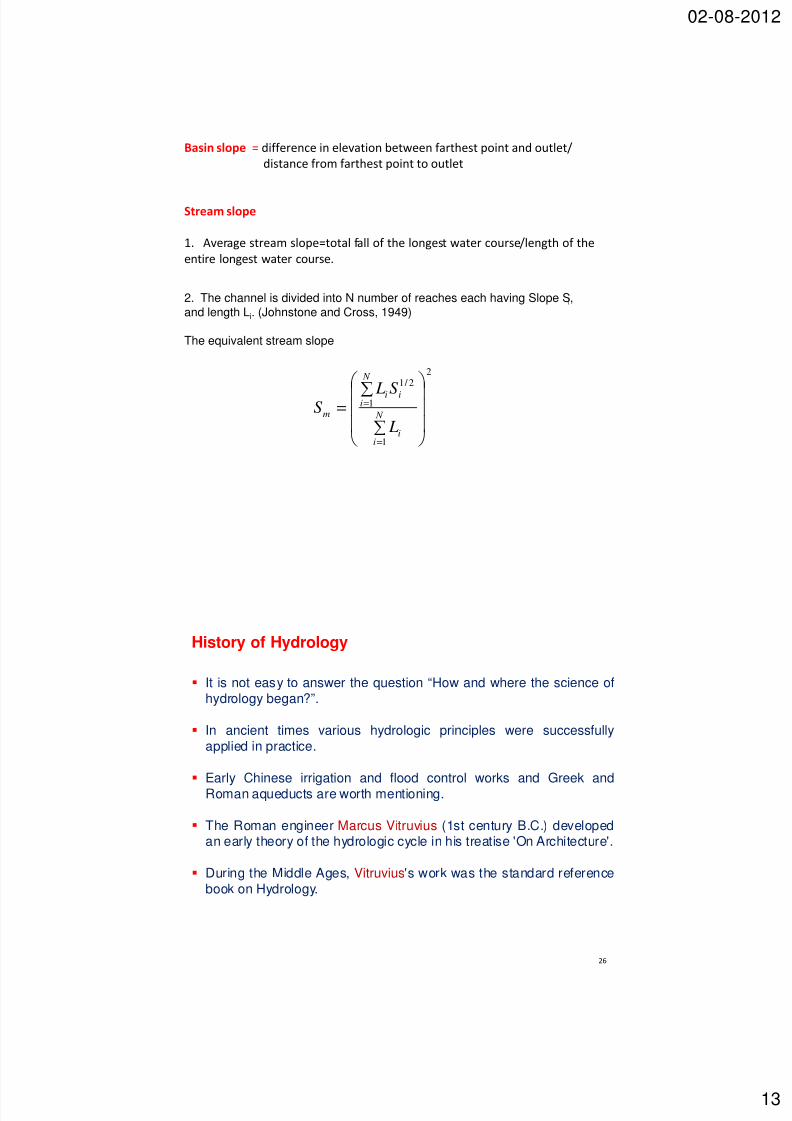
7242019 CE-341 Lectures 1amp2
httpslidepdfcomreaderfullce-341-lectures-12 1315
02-08-2012
13
983106983137983155983145983150 983155983148983151983152983141 983101 983140983145983142983142983141983154983141983150983139983141 983145983150 983141983148983141983158983137983156983145983151983150 983138983141983156983159983141983141983150 983142983137983154983156983144983141983155983156 983152983151983145983150983156 983137983150983140 983151983157983156983148983141983156
983140983145983155983156983137983150983139983141 983142983154983151983149 983142983137983154983156983144983141983155983156 983152983151983145983150983156 983156983151 983151983157983156983148983141983156
983123983156983154983141983137983149 983155983148983151983152983141
1 983105983158983141983154983137983143983141 983155983156983154983141983137983149 983155983148983151983152983141983101983156983151983156983137983148 983142983137983148983148 983151983142 983156983144983141 983148983151983150983143983141983155983156 983159983137983156983141983154 983139983151983157983154983155983141983148983141983150983143983156983144 983151983142 983156983144983141
983141983150983156983145983154983141 983148983151983150983143983141983155983156 983159983137983156983141983154 983139983151983157983154983155983141
2
1
1
2 1
sum
sum=
=
=
N
ii
N
iii
m
L
S LS
2 The channel is divided into N number of reaches each having Slope Siand length Li (Johnstone and Cross 1949)
The equivalent stream slope
History of Hydrology
It is not easy to answer the question ldquoHow and where the science ofhydrology beganrdquo
In ancient times various hydrologic principles were successfullyapplied in practice
Early Chinese irrigation and flood control works and Greek andRoman aqueducts are worth mentioning
The Roman engineer Marcus Vitruvius (1st century BC) developedan early theory of the hydrologic cycle in his treatise On Architecture
During the Middle Ages Vitruviuss work was the standard referencebook on Hydrology
26
7242019 CE-341 Lectures 1amp2
httpslidepdfcomreaderfullce-341-lectures-12 1415
02-08-2012
14
15th century Leonardo da Vinci and Bernard Palissy gave independently ofeach other an accurate explanation of the hydrologic cycle
17th
century the modern science of hydrology was established by PerraultMariotte and Halley Perrault measured the rainfall and runoff in the SeineRiver and proved that rainfall contributes significantly to river flow He alsomeasured evaporation and capillarity Mariotte recorded the velocity of flow inthe Seine River and made measurements of the cross section estimating thedischarge Halley measured evaporation of the Mediterranean Sea
18th century The Bernoulli piezometer and theorem the Pitot tube andChezys formula are representative achievements
19th century experimental hydrology made considerable progress Darcyslaw of flow in porous media and Dupuit-Thiems well formula were
elaborated
Early 20th century governmental agencies developed their own programs ofhydrologic research Shermans unit hydrograph Hortons infiltration theoryand Theiss non-equilibrium approach to well hydraulics were based on theiranalyses and were the results of research programs
27
983107983144983151983159 983139983148983137983155983155983145983142983145983141983155 983156983144983141 983144983145983155983156983151983154983161 983151983142 983144983161983140983154983151983148983151983143983161 983145983150983156983151 983141983145983143983144983156 983152983141983154983145983151983140983155 983137983155
bull Period of Speculation ndash prior to AD 1400
bull Period of Observation ndash 1400 ndash 1600
bull Period of Measurement ndash 1600 ndash 1700
bull Period of Experimentation ndash 1700- 1800
bull Period of Modernization ndash 1800 ndash 1900
bull Period of Empiricism ndash 1900 ndash 1930
bull Period of Rationalization ndash 1930 ndash 1950
bull Period of Theorization ndash 1950 ndash to date
28
7242019 CE-341 Lectures 1amp2
httpslidepdfcomreaderfullce-341-lectures-12 1515
02-08-2012
983105983152983152983148983145983139983137983156983145983151983150983155 983113983150 983109983150983143983145983150983141983141983154983145983150983143
983112983161983140983154983151983148983151983143983161 983142983145983150983140983155 983145983156983155 983143983154983141983137983156983141983155983156 983137983152983152983148983145983139983137983156983145983151983150 983145983150 983156983144983141 983140983141983155983145983143983150 983137983150983140 983151983152983141983154983137983156983145983151983150 983151983142
983159983137983156983141983154 983154983141983155983151983157983154983139983141983155 983141983150983143983145983150983141983141983154983145983150983143 983155983157983139983144 983137983155 983156983144983151983155983141 983142983151983154
(983145) 983113983154983154983145983143983137983156983145983151983150
(983145983145) 983127983137983156983141983154 983155983157983152983152983148983161
(983145983145983145) 983110983148983151983151983140 983139983151983150983156983154983151983148
(983145983158) 983112983161983140983154983151983152983151983159983141983154 983137983150983140
(983158) 983118983137983158983145983143983137983156983145983151983150
29
1 Scientific Hydrology-a study concerned with academic aspects2 Engineering or applied Hydrology- a study concerned with
engineering applications
983112983161983140983154983151983148983151983143983145983139983137983148 983108983137983156983137
The basic hydrological data required are
1 Precipitation and climatological data - IMD
2 Topographic maps - SOI
3 Stream-flow records - CWC
4 Ground water data ndash Central Ground Water Board5 Evaporation and transpiration data -IMD
6 Cropping pattern crops and their consumptive use ndash Irrigation Dept
7 Soil map
8 Water quality data of surface streams and groundwater
9 Geological maps - GSI
30
7242019 CE-341 Lectures 1amp2
httpslidepdfcomreaderfullce-341-lectures-12 1515
02-08-2012
983105983152983152983148983145983139983137983156983145983151983150983155 983113983150 983109983150983143983145983150983141983141983154983145983150983143
983112983161983140983154983151983148983151983143983161 983142983145983150983140983155 983145983156983155 983143983154983141983137983156983141983155983156 983137983152983152983148983145983139983137983156983145983151983150 983145983150 983156983144983141 983140983141983155983145983143983150 983137983150983140 983151983152983141983154983137983156983145983151983150 983151983142
983159983137983156983141983154 983154983141983155983151983157983154983139983141983155 983141983150983143983145983150983141983141983154983145983150983143 983155983157983139983144 983137983155 983156983144983151983155983141 983142983151983154
(983145) 983113983154983154983145983143983137983156983145983151983150
(983145983145) 983127983137983156983141983154 983155983157983152983152983148983161
(983145983145983145) 983110983148983151983151983140 983139983151983150983156983154983151983148
(983145983158) 983112983161983140983154983151983152983151983159983141983154 983137983150983140
(983158) 983118983137983158983145983143983137983156983145983151983150
29
1 Scientific Hydrology-a study concerned with academic aspects2 Engineering or applied Hydrology- a study concerned with
engineering applications
983112983161983140983154983151983148983151983143983145983139983137983148 983108983137983156983137
The basic hydrological data required are
1 Precipitation and climatological data - IMD
2 Topographic maps - SOI
3 Stream-flow records - CWC
4 Ground water data ndash Central Ground Water Board5 Evaporation and transpiration data -IMD
6 Cropping pattern crops and their consumptive use ndash Irrigation Dept
7 Soil map
8 Water quality data of surface streams and groundwater
9 Geological maps - GSI
30