Embed Size (px)
Citation preview

Imagerie par résonance magnétique : analyse de coûts
KCE reports 106B
Federaal Kenniscentrum voor de Gezondheidszorg Centre fédéral d’expertise des soins de santé
2009
Le Centre fédéral d’expertise des soins de santé
Présentation : Le Centre fédéral d’expertise des soins de santé est un parastatal, créé le 24 décembre 2002 par la loi-programme (articles 262 à 266), sous tutelle du Ministre de la Santé publique et des Affaires sociales, qui est chargé de réaliser des études éclairant la décision politique dans le domaine des soins de santé et de l’assurance maladie.
Conseil d’administration
Membres effectifs : Gillet Pierre (Président), Cuypers Dirk (Vice-Président), Avontroodt Yolande, De Cock Jo (Vice-Président), De Meyere Frank, De Ridder Henri, Gillet Jean-Bernard, Godin Jean-Noël, Goyens Floris, Maes Jef, Mertens Pascal, Mertens Raf, Moens Marc, Perl François, Van Massenhove Frank (Vice-Président), Vandermeeren Philippe, Verertbruggen Patrick, Vermeyen Karel.
Membres suppléants : Annemans Lieven, Bertels Jan, Collin Benoît, Cuypers Rita, Decoster Christiaan, Dercq Jean-Paul, Désir Daniel, Laasman Jean-Marc, Lemye Roland, Morel Amanda, Palsterman Paul, Ponce Annick, Remacle Anne, Schrooten Renaat, Vanderstappen Anne.
Commissaire du gouvernement : Roger Yves
Direction
Directeur général a.i. : Jean-Pierre Closon
Directeur général adjoint a.i. : Gert Peeters
Contact
Centre fédéral d’expertise des soins de santé (KCE). Cité Administrative Botanique, Doorbuilding (10ème) Boulevard du Jardin Botanique, 55 B-1000 Bruxelles Belgium
Tel: +32 [0]2 287 33 88 Fax: +32 [0]2 287 33 85
Email : [email protected] Web : http://www.kce.fgov.be
Imagerie par résonance magnétique : analyse de coûts
KCE reports 106B CAROLINE OBYN, IRINA CLEEMPUT, CHRISTIAN LEONARD, JEAN-PIERRE CLOSON
Federaal Kenniscentrum voor de gezondheidszorg Centre fédéral d’expertise des soins de santé
2009
KCE reports vol 106B
Titre: Imagerie par résonance magnétique : analyse de coûts
Auteurs: Caroline Obyn, Irina Cleemput, Christian Léonard, Jean-Pierre Closon
Experts externes: Rik Achten (UGent), Freddy Avni (ULB-Erasme), Jan Casselman (AZ St Jan Brugge), Françoise De Wolf (Soc. Mut.), Samira Ouraghi (SPF Santé Public), Patrick Seynaeve (AZ Groeninge Kortrijk), Maurice Tuerlinckx (VVI), Rob Van Den Oever (CM), Rudy Van Driessche (AZ St. Maarten Mechelen), Karen Vingerhoets (UZA)
Remerciements: Nous sommes reconnaissants pour leur bonne collaboration aux hôpitaux, radiologues et fournisseurs qui ont contribué aux enquêtes lancées à l’occasion de cette étude. Nos remerciements s’adressent aussi à tous les personnes suivantes qui ont contribué à cette étude: Anja Baele, Abdeslam Elmohandiz, Yves Nulens, Jean-Claude Renaut et Koen Schoonjans de l’SPF Santé Public; Herwin De Kind (Vlaamse overheid Welzijn, Volksgezondheid en Gezin); Sophie Verhaegen (Commission communautaire commune); Yves Smeets (cabinet Didier Donfut); Mickael Dauby, Kris Engels, Chris Hubin et August Van Mulders (INAMI); Lily Costers et Stefaan Pottie (Vlaams Infrastructuurfonds voor Persoonsgebonden Aangelegenheden); Fanny Vandamme et Raf Denayer (Verbond der Belgische Beroepsverenigingen van Geneesheren-Specialisten); Jean-Paul Joris (St. Luc Bouge).
Validateurs externes : Baudouin Maldague (UCL), Filip Roodhooft (KULeuven), Rosita Van Maele (réviseur d’entreprises)
Conflits d’intérêt : Les experts et validateur suivants travaillent dans un hôpital doté d'un scanner IRM: Rik Achten, Freddy Avni, Jan Casselman, Patrick Seynaeve, Rudy Van Driessche, Karen Vingerhoets, Baudouin Maldague. Jusqu’au juin 2007, Rosita Van Maele était réviseur d’entreprises de plusieurs hôpitaux contactés dans le cadre de l’enquête.
Disclaimer : Les experts externes ont collaboré au rapport scientifique qui a ensuite été soumis aux validateurs. La validation du rapport résulte d’un consensus ou d’un vote majoritaire entre les validateurs. Le KCE reste seul responsable des erreurs ou omissions qui pourraient subsister de même que des recommandations faites aux autorités publiques.
Mise en Page : Ine Verhulst
Bruxelles, 6 mai 2009 (2nd print) ; 26 mars 2009 (1st print)
Etude n° 2008-51
Domaine: Health Technology Assessment (HTA)
MeSH:Costs and Cost Analysis ; Hospital Costs ; Magnetic Resonance Imaging
Classification: WN185
Langage: français, anglais
Format: Adobe® PDF™ (A4)
Dépôt légal : D/2009/10.273/15
La reproduction partielle de ce document est autorisée à condition que la source soit mentionnée. Ce document est disponible en téléchargement sur le site Web du Centre fédéral d’expertise des soins de santé.
Comment citer ce rapport?
Obyn C, Cleemput I, Léonard C, Closon J-P. Imagerie par résonance magnétique : analyse de coûts. Health Technology Assessment (HTA). Bruxelles: Centre fédéral d'expertise des soins de santé (KCE); 2009. KCE reports 106B (D/2009/10.273/15)
KCE Reports 106B IRM analyse de coûts i
PRÉFACE En 2006, le KCE a publié un premier rapport sur l’imagerie par résonance magnétique dans lequel il avait étudié de façon approfondie les indications médicales pour lesquelles cette technique était appropriée.
Les autorités de santé et en particulier Madame la Ministre ont souhaité que le KCE ré aborde la problématique de l’IRM sous l’angle de sa programmation et de son financement. La Belgique semble en effet relativement sous équipée en IRM et sur équipée en CT Scanner par rapport aux pays voisins. Quel éclairage scientifique peut il être apporté aux décideurs préoccupés des effets de la programmation et du financement de l’IRM sur l’efficience, la qualité et l’accessibilité des soins ?
Comme les données nécessaires pour évaluer, de façon scientifique, le nombre d’appareils nécessaires n’étaient pas disponibles, l’accent a été mis sur l’étude des coûts de l’IRM et sur leur évolution dans le temps. L’objectif était de vérifier si le mode et le niveau de financement de l’IRM sont compatibles avec l’évolution de son coût d’investissement et d’exploitation. Nous espérons que les chiffres mis en évidence pourront être utiles dans les décisions à prendre en matière de financement.
La récolte des données utiles pour cette étude de coût s’est avérée particulièrement laborieuse. En effet, dans la plupart des hôpitaux, les chiffres relatifs à l’IRM sont noyés dans les comptes du service de radiologie, cette comptabilité elle-même n’est pas toujours des plus simples à interpréter, notamment parce que le personnel et les médecins partagent souvent leur temps entre l’IRM et d’autres techniques radiologiques. Toujours est il qu’avec la collaboration des directions générales et financières, des chefs de service de radiologie et des fournisseurs de matériel radiologique, nous avons finalement pu rassembler les données les plus correctes possibles. Nous les en remercions chaleureusement.
Gert Peeters Jean-Pierre Closon Directeur général adjoint a.i. Directeur général a.i.
ii IRM analyse de coûts KCE Reports 106B
Résumé
INTRODUCTION IRM
L’imagerie par résonance magnétique (IRM) est une technique d’imagerie médicale qui utilise un puissant champ magnétique pour faire tourner dans le même sens tous les atomes d’hydrogène contenus dans un corps. Lorsqu’un atome revient à son positionnement initial, ce retour s’accompagne d’une légère décharge électrique. C’est cette dernière qui est enregistrée. Contrairement aux autres techniques d’imagerie médicale, comme la tomographie assistée par ordinateur (CT-Scan) et la DSA (digital subtraction angiography ou angiographie par soustraction numérique), l’IRM n’utilise pas de radiations ionisantes délétères. En conséquence, lorsque cela est possible, la substitution par IRM est préférable. Une analyse détaillée des indications de cette technique d’imagerie médicale a fait l’objet d’un précédent rapport du KCE (Rapport N°37)
Comme l’intensité du champ magnétique, exprimée en nombre de Tesla, est un élément déterminant dans la qualité de l’image, des appareils de IRM dotés d’une intensité de champ de plus en plus forte on été mis au point au cours des dernières décennies.
En Belgique, l’intensité standard s’élève actuellement à 1.5 Tesla (c’était le cas de 79% des scanners fin 2005). En fonction des exigences, un examen avec un appareil d’une intensité de 3 Tesla requiert environ la moitié du temps nécessaire avec un appareil de 1.5 Tesla, cela avec une même qualité d’image. On peut alternativement obtenir des images d’une résolution supérieure si l’examen est de même durée. Actuellement, les appareils de 3 Tesla sont surtout installés dans les hôpitaux qui disposent déjà d’un appareil de 1,5 Tesla (fin 2005, les modèles de 3 Tesla représentaient 7% du parc installé).
L’IRM EN BELGIQUE Dans notre pays, les appareils IRM font l’objet d’une programmation. En d’autres termes, un hôpital doit recevoir une autorisation (agréement) des pouvoirs publics pour installer un appareil IRM, ce qui ouvre le remboursement des prestations par l’assurance maladie. Un hôpital ayant un appareil agréé a droit à une allocation annuelle fixe (via les parties A3 et B3 du budget des moyens financiers), à un forfait INAMI par prestation (pour les patients hospitalisés et ambulatoires) et un forfait par admission (pour les patients hospitalisés) ou un forfait par prescription et par jour ensemble avec un honoraire de consultance par prestation (pour les patients traités en ambulatoire).
Un certain nombre d’hôpitaux possédant déjà un appareil agréé utilisent en sus un scanner non agréé. Pour ces appareils, l’hôpital ne reçoit pas d’allocation A3-B3 mais il perçoit le remboursement de l’INAMI car ce dernier ne peut pas faire la différence entre les prestations effectuées sur un appareil agréé ou sur un qui ne l’est pas. Fin 2008, 92 appareils étaient agréés. À cette même date, on estimait à 4 le nombre d’appareils non agréés.
En 2007, les dépenses INAMI pour les honoraires spécifiques à l’IRM s’élevaient à 41 millions d’euro, ce qui représente 5% des dépenses totales INAMI pour l’imagerie médicale. En outre, les dépenses au titre des forfaits A3-B3 sont estimées à environ 28 millions d’euro pour cette même année. Les dépenses INAMI pour CT s’élevaient quant à elles à 170 millions d’euro. Pour les CT aucun financement A3-B3 n’est prévu. Le ratio moyen CT-IRM (en nombre de prestations) s’élevait en 2007 à 3,5. Comparé à celui des autres pays renseignés dans le rapport KCE n°37, ce ratio est toujours élevé. En 2007, plus de 500 000 examens IRM ont été facturés à l’INAMI, ce qui représente environ 6 300 examens par appareil (appareils non agréés inclus). Au cours de la. période 2000-2007, le nombre d’examens annuels par appareil a affiché un taux de croissance annuel moyen de pratiquement 6%.
KCE Reports 106B IRM analyse de coûts iii
Le case-mix des examens en termes des parties du corps examinées d’une part, et de patients hospitalisés par rapport à ceux examinés en ambulatoire d’autre part, ne s’est que légèrement modifié au cours de cette période. En revanche, le case-mix présente de sensibles variations entre les hôpitaux. En moyenne en 2007, 30% des examens d’IRM concernaient le rachis, 26% la tête, 25% un membre, 11% le cou/thorax/abdomen/bassin, 4% les vaisseaux du cou ou les vaisseaux sanguins thorax/abdomen/pelvis ou d’un membre, 3% le sein, 0.5% le coeur et 0.1% des études fonctionelles de l’encéphale (technique BOLD). En moyenne 86% des examens étaient réalisés en ambulatoire en 2007.
FINANCEMENT DE L’IRM De 2000 à 2008, le financement total (A3+B3+honoraires) pour un appareil d’IRM présentant un profil d’activité moyen a augmenté en moyenne de 27% sur l’ensemble de la période. La part A3 est restée inchangée, la part B3 a bénéficié de 4% de cette hausse et les honoraires des 96% restant. L’augmentation des honoraires est attribuable au nombre croissant d’examens par appareil qui a largement compensé la baisse des tarifs d’honoraires. Au cours de la même période, le financement opérationnel par examen (B3 + honoraires) a régressé de 10%. Pour les trois quarts, cette baisse est attribuable à la diminution du financement B3 par examen, et pour un quart, au recul des honoraires par examen.
OBJECTIF DE L’ETUDE L’autorité publique compétente a adressé une demande d’avis au KCE au sujet de la programmation et de l’évolution du coût de l’IRM. Etant donné que les données nécessaires d’une part à l’établissement du nombre souhaitable d’appareils et, d’autre part à la détermination de critères d’accréditation n’étaient pas disponibles, la présente étude a été focalisée sur les coûts L’objectif de l’étude consiste à fournir une vue d’ensemble des coûts totaux (investissement et coûts opérationnels) associés à l’imagerie par résonance magnétique, en se plaçant du point de vue de l’hôpital (ou du service d’IRM). Le but était également de voir dans quel rapport se situe le financement actuel par rapport à la structure des coûts de cette technique d’imagerie.
METHODE ET SOURCES La méthodologie choisie est un calcul basé sur les coûts historiques (par opposition à un calcul de coûts standards). Cette méthode se base sur les coûts réels (actuels et historiques). Un calcul de coûts standardisés se base sur une détermination de coûts standards pour une satisfaire des exigences minimales de qualité et d’efficience. Les coûts présentés dans cette étude reflètent donc les coûts tels qu’ils ont été observés dans les hôpitaux et ne reflètent pas nécessairement des standards de qualité et d’efficience des soins. La méthodologie est appliquée de manière top-down. Les coûts totaux ou ressources des services IRM ont été rassemblés et analysés en fonction du nombre d’heures opérationnelles ou du nombre d’examens. Idéalement, cette approche est combinée avec une analyse bottom-up du genre (time driven) activity based costing dans laquelle l’investissement en temps et les autres ressources utilisées sont enregistrés de façon précise pour un échantillon d’examens. Cette approche n’était cependant pas possible dans le délai imparti. L’analyse de coût se caractérise en plus par une approche full costing, ce qui signifie que tous les coûts sont pris en considération (par opposition à une approche où seuls les coûts variables et directs sont étudiés). Une distinction a été faite entre les coûts d’investissement et les coûts opérationnels. Les coûts d’investissement concernent l’achat de l’appareil, les aménagements des bâtiments, les frais de mise à niveau (« upgrade ») et les coûts financiers supplémentaires y afférents. Par coûts opérationnels, nous entendons l’entretien de l’appareil, le personnel hospitalier, les articles de consommation directe, le coût des médecins et les frais généraux (catégorie résiduelle comprenant le personnel technique et administratif, le matériel de bureau ou informatique, l’entretien général, les équipements communs, le chauffage, ainsi que les autres coûts directs et indirects comptabilisés).
iv IRM analyse de coûts KCE Reports 106B
Plusieurs sources d’informations ont été mobilisées. Des questionnaires ont été rédigés à l’attention des directions financières/générales et des chefs des services de radiologie. Par ailleurs, nous avons contacté les principaux fournisseurs d’appareils d’IRM et nous avons également utilisé de manière limitée des données de Finhosta (à savoir les données comptables des hôpitaux) jusqu’en 2005. Par ailleurs, un groupe d’experts a été consulté à l’occasion de deux réunions.
Pour l’étude des coûts nous nous sommes basés sur un case-mix moyen (tant en termes de parties du corps examinées que de répartition patients ambulatoires/hospitalisés et qu’en termes d’autres caractéristiques des patients) étant donné que les données suffisantes n’étaient pas disponibles pour faire varier les coûts en fonction des case-mix.
En raison de l’incertitude relative à l’estimation ponctuelle de certains éléments de coûts, des analyses de scénarios et d’incertitude approfondies ont été effectuées.
RESULTATS
PARAMETRES OPERATIONNELS Sur la base des données recueillies dans les questionnaires aux hôpitaux, les heures opérationnelles par scanner ne semblent pas s’être modifiées de manière sensible durant la période 2000-2008 (de 65 à 66 heures par semaine). Le nombre plus élevé d’examens par appareil (hausse de pratiquement 50%) est de ce fait essentiellement imputable à une vitesse d’examen accrue (selon les estimations, de 45 à 31 minutes en incluant les appareils non agréés dans le calcul et de 44 à 27 minutes s’ils ne sont pas pris en compte).
COUTS D’INVESTISSEMENT ET FINANCEMENT A3 En 2008, les coûts d’acquisition et d’installation d’un appareil d’IRM étaient compris entre 1 000 000 et 1 400 000 euros pour un appareil de 1.5 Tesla et entre 1 600 000 et 2 000 000 euros pour un appareil de 3 Tesla. Sur la base du questionnaire, les frais d’aménagement des bâtiments semblent présenter de fortes variations. Ainsi, ils s’étalent de 0 euro à 360 000 euros pour des aménagements limités (en cas de remplacement de l’appareil sans mise à niveau vers un 3 Tesla et sont compris entre 45 000 et 700 000 euros dans le cas d’aménagements importants du bâtiment (pour un premier appareil ou un appareil supplémentaire ou encore en cas de remplacement par un 3 Tesla).
Les coûts d’acquisition et de modernisation peuvent varier fortement d’un hôpital à l’autre, en fonction des attentes concernant la qualité de l’image, la vitesse et d’autres avancées technologiques. Étant donné que la plupart des appareils de la première génération sont encore utilisés, il n’est pas possible de se prononcer à propos de leur durée de vie moyenne ni sur leur coût de mise à niveau. Selon les fournisseurs, la durée de vie varierait entre 7 et 14 ans. Les résultats de l’analyse des coûts montrent que, dans un grand nombre de cas, les coûts d’investissement fixes (y compris les frais de financement) pour un appareil d’IRM et les aménagements du bâtiment, ne sont pas totalement couverts par le financement A3 actuel (148 736 euro par an durant 7 ou 14 ans). L’importance du différentiel est fonction du type d’appareil (1.5 ou 3 Tesla), de sa durée de vie, des frais de mise à niveau et des coûts d’aménagement du bâtiment. Plusieurs scénarios reflètent l’impact de ce différentiel sur le résultat net. Le ‘déficit d’investissement’ annuel varie entre -14 000 et -92 000 euro pour les appareils de 1,5 Tesla et de -82 000 à -179 000 euro pour les appareils de 3 Tesla.
Les coûts d’investissement paraissent ne pas avoir diminué de manière sensible depuis 1999. La tendance principale semble être celle-ci : on acquiert une technologie plus performante pour un prix pratiquement identique, en tout cas lorsqu’il s’agit d’appareils de 1.5 Tesla. Le coût d’investissement d’un 3 Tesla est nettement supérieur.
KCE Reports 106B IRM analyse de coûts v
COUTS OPERATIONNELS ET FINANCEMENT VIA LE BUDGET B3 ET LES HONORAIRES
Entre 2000 et 2007, le nombre d’examens par appareil a augmenté (en prenant en compte les appareils non agréés) de pratiquement 50%, tandis que le nombre d’heures opérationnelles par appareil est resté pratiquement inchangé. Dans l’analyse des coûts, il n’a pas été possible de se faire une idée claire du bilan financier final d’un appareil d’IRM pour l’hôpital. La raison principale de cette impossibilité est que la plupart des radiologues/directions des hôpitaux n’étaient pas prêts à révéler les honoraires nets (soit le revenu) du radiologue. En conséquence, l’analyse fournit une indication du bilan opérationnel « hors rémunération du radiologue », qui est ensuite partagé entre les médecins d’une part, au titre d’honoraires nets, et l’hôpital d’autre part, afin de couvrir l’éventuel déficit d’investissement dans l’IRM.
Dans la pratique, un bilan financier positif est parfois aussi utilisé pour le subventionnement croisé d’autres services hospitaliers ou pour couvrir l’investissement d’un appareil non accrédité.
Exactement comme pour les coûts d’investissement, nous avons modélisé plusieurs scénarios pour les coûts opérationnels (55 heures versus 65 versus 75 heures opérationnelles ; hôpital général versus hôpital universitaire ; frais d’entretien des appareils de 1.5 Tesla versus ceux de 3 Tesla). Pour chacun des scénarios, nous avons calculé un bilan opérationnel annuel que l’on peut combiner avec le bilan d’investissement annuel pour des scénarios d’investissement différents, dans le but de calculer le bilan total. Nous n’avons pas pu déterminer la répartition de l’excédent opérationnel entre les radiologues et l’hôpital. De ce fait, nous ne pouvons pas tirer de conclusions définitives à propos du bénéfice final ou de la perte finale pour l’hôpital, pas plus que pour les revenus du radiologue. Par ailleurs, dans le cadre de ce projet, nous n’avons pas non plus été en mesure de définir des revenus « équitables » pour comparer entre eux les revenus des radiologues. En revanche, dans le cas des hôpitaux universitaires, où la rémunération des médecins est connue, nous avons fait des estimations du bilan final pour les différents scénarios.
Pour un hôpital général avec 65 heures opérationnelles par semaine, le bilan opérationnel annuel pour la rémunération du radiologue et pour la compensation du déficit d’investissement est estimé à 650 000 euro (min. 500 000 euro – max. 780 000 euro) par unité. Pour un 3 Tesla (pour lequel un coût d’entretien supérieur a été pris en considération) on a estimé ce bilan à 600 000 (min. 450 000 euro – max. 730 000 euro) par unité. Sur base des réponses aux questionnaires, il a été tenu compte d’1,6 ETP radiologue pour 65 heures opérationnelles par semaine dans un hôpital général.
LIMITES DE L’ETUDE DES COUTS L’étude des coûts se fonde sur les données d’un nombre limité d’hôpitaux (les données relatives aux investissements ont été obtenues auprès de 28 hôpitaux, les paramètres opérationnels auprès de 20). Il se peut dès lors que les chiffres soient entachés d’un biais de sélection.
L’étude étant basée sur les coûts réels des hôpitaux, elle ne fournit par ailleurs pas nécessairement une image de ce que l’on peut considérer comme le minimum nécessaire pour une bonne qualité des soins.
Compte tenu des limitations des données de coûts issues de la comptabilité hospitalière, et plus encore, des données de la comptabilité du service d’IRM, nous avons limité leur utilisation au minimum dans la présente étude. Cela étant, nous avons dû faire appel à ces données pour quelques items des coûts, notamment les frais généraux et les biens de consommation directe. De nombreux coûts n’étant pas directement attribuables à l’IRM, une étude des coûts ne sera jamais qu’une approximation des coûts réels.
Différents scénarios de coûts opérationnels ont été étudiés mais ces scénarios ne couvrent pas toutes les différences entre les hôpitaux. On peut ainsi s’attendre à ce que les coûts des services d’IRM varient en fonction du case-mix.
vi IRM analyse de coûts KCE Reports 106B
Cela étant, nous disposions de trop peu d’informations pour modéliser les coûts en fonction du case–mix. Il est également possible que les coûts varient en fonction de la qualité et l’efficience des soins mais pour mettre cette relation en évidence, les données disponibles étaient insuffisantes. Au moyen d’analyses de scénarios, nous avons tenté d’établir des différences entre les appareils 1,5 et 3 Tesla, mais également entre les hôpitaux universitaires et généraux. Mais ici non plus, toutes les différences n’ont pas pu être intégrées. On n’a par exemple pas tenu compte du fait que des appareils 3 Tesla sont vraisemblablement associés à une rotation plus rapide des patients.
Le financement des services d’IRM ne se fonde pas uniquement sur les honoraires relatifs à la seule IRM. Pour les patients hospitalisés, il existe des honoraires par patient admis qui couvrent toute l’imagerie médicale. Pour les patients ambulatoires, le financement est également constitué en partie d’un honoraire par prescription qui sert éventuellement à couvrir d’autres examens d’imagerie médicale, effectués le même jour et chez le même patient. Pour se faire une idée précise du financement de l’IRM, ces honoraires par admission et par prescription doivent être en partie affectés à l’IRM. Toutefois, une ventilation correcte et précise de ces honoraires sur les différents examens d’imagerie médicale exige une évaluation du coût et du financement de toutes ces techniques d’imagerie. Un tel exercice sortait du champ de la présente étude. Pour cette raison, nous sommes partis du postulat selon lequel tous les patients étaient soignés et financés dans le secteur ambulatoire (en réalité, 86% de tous les patients sont pris en charge en ambulatoire). Par ailleurs, en l’absence d’informations précises sur d’éventuels examens complémentaires réalisés le même jour, nous avons considéré que les honoraires par prescription ne couvraient que l’IRM, indépendamment d’autres examens d’imagerie médicale éventuellement réalisés le même jour. Les analyses de sensibilité ont étudié l’impact de cette hypothèse sur les résultats.
OPTIONS DE FINANCEMENT POUR L’IRM Plusieurs options de financement peuvent être envisagées, sans pour autant qu’un système de financement idéal puisse être épinglé. Chaque option présente ses avantages et ses inconvénients. L’introduction d’un nouveau système de financement peut entraîner une modification du revenu des hôpitaux. Il convient dès lors de prévoir une période transitoire afin de leur permettre de procéder aux adaptations nécessaires.
Financement totalement variable
• Un système de financement totalement variable présente le risque d’encourager la « surconsommation ». Afin de mieux refléter la structure des coûts, on peut faire dépendre l’honoraire du niveau d’activité de l’appareil d’IRM. On peut alors réduire l’honoraire une fois qu’un certain niveau d’examens est atteint (break-even volume).
• On peut également faire varier le financement en fonction du type d’appareil (tels que le nombre de tesla ou des possibilités technologiques médicales relevantes). Pour cela, il faut réaliser un bilan entre (dans la plupart des cas) les coûts d’investissement élevés d’une part et un possible turnover de patients plus élevé d’autre part. Actuellement, nous ne savons pas dans quelle mesure les appareils plus puissants servent pour augmenter la vitesse de réalisation des examens ou améliorer la qualité des images.
Combinaison d’un financement fixe ou semi variable par appareil et d’un financement variable
• Pour mieux approcher la structure de coûts et éviter un usage inefficient des moyens, il est recommandé d’opter pour un financement semi-variable par appareil plutôt que pour un un financement fixe par appareil. Ainsi, les montants A3 et B3 peuvent être adaptés au niveau d’activité de l’appareil. Par exemple, un financement complet pourrait être octroyé dès que les capacités sont utilisées à 80%.
KCE Reports 106B IRM analyse de coûts vii
Financement commun CT-IRM individualisé par hôpital en fonction de parametres liés aux patients
• Une autre option de financement consiste à prévoir un financement commun pour les CT et l’IRM. Ce financement pourrait être une combinaison de financements fixe et variable, dans laquelle le financement fixe serait individualisé par hôpital, pas en fonction du nombre d’appareils, mais en fonction de paramètres liés aux patients. Ces paramètres peuvent être une combinaison du nombre de consultations effectuées par les prestataires qui peuvent prescrire les examens et du nombre de patients hospitalisés. Eventuellement, un paramètre lié au nombre d’urgences peut être ajouté.
• Ainsi, les organes compétents des hôpitaux pourraient décider, à l’intérieur de leur budget, quel nombre et quel type de scanners ils souhaitent acquérir, ce qui pourrait générer une meilleure allocation des moyens. Un contrôle de la qualité des soins devrait alors être effectué.
Financement global de l’imagerie médicale basé sur les ICPC • Le financement commun du CT-Scan et de l’IRM peut éventuellement être
élargi à d’autres techniques d’imagerie médicale.
• Dans le système de financement basé sur les ICPC l’honoraire actuel par admission qui constitue une partie du financement des patients hospitalisés, serait étendu à un honoraire unique par patient qui couvrirait tous les coûts d’imagerie médicale et remplacerait tous les autres honoraires d’imagerie médicale. Cet honoraire par patient serait fonction de l’indication spécifique renseignée par le prescripteur et réduirait les incitants financiers, et non justifiés par des raisons médicales, de choisir une technique plutôt qu’une autre.
• Un système de contrôle de qualité adapté est également indispensable pour éviter l’utilisation systématique de techniques moins onéreuses et moins efficientes et éviter une sous-consommation
viii IRM analyse de coûts KCE Reports 106B
RECOMMANDATIONS HARMONISATION IRM ET CT
Les règlementations et les financements relatifs à l’IRM et au CT ne devraient être tels qu’ils puissent inciter à choisir le CT plutôt que l’IRM pour d’autres raisons que des raisons médicales, comme cela semble être parfois le cas pour le moment. Un rééquilibrage CT / IRM est à encourager tant grâce à un assouplissement ou un abandon éventuel de la programmation IRM que par une révision des règles de financement de ces deux techniques radiologiques.
Assouplissement de la programmation
• Une suppression pure et simple de la programmation IRM risque d’entraîner un dérapage des coûts. Une alternative pourrait être d’autoriser l’installation d’un appareil d’IRM supplémentaire en échange d’un accord écrit des organes compétents sur une diminution du nombre d’examens par CT Scan.
• Compte tenu de la proportion d’examens réalisés en ambulatoire, les critères de programmation devraient plus tenir compte de l’activité ambulatoire (exemple : nombre de consultations) et moins du nombre d’admissions hospitalières.
Abandon de la programmation
• Parmi les alternatives de mode de financement énoncées plus haut, il apparaît qu’à court terme un financement conjoint CT- IRM avec un A3 – B3 commun pour les deux techniques, en fonction de paramètres liés aux patients, serait la solution la plus appropriée. Le niveau des forfaits et des honoraires dans une telle formule, ne pourra cependant être déterminé qu’après une étude de coûts du CT.
• A plus long terme, il convient de penser à un financement plus global de la radiologie basé sur un enregistrement des problèmes ou des indications (ICPC). Dans un tel système, le prescripteur adresserait son patient au radiologue pour la détermination ou l’exclusion d’un diagnostic suspecté, sans spécifier le type d’imagerie. Le radiologue déciderait ainsi lui-même quelle est l’imagerie la plus indiquée sur base des informations cliniques relatives au patient transmises par le prescripteur. La responsabilité médico-légale de ce dernier serait engagée au cas où les informations transmises ne sont pas correctes ou incomplètes.
KCE Reports 106B IRM analyse de coûts ix
QUALITE Pour encourager la qualité il est souhaitable :
• De lier la nomenclature non seulement aux types anatomiques d’examens réalisés mais aussi au profil des patients (comme sédation du patient, patient polytraumatisé, …)
• De prévoir une règle de non-cumul des deux types d’examen pour la même indication au cours d’une période donnée (par exemple 6 semaines) sauf dans le cas de certaines pathologies particulières (par exemple : cancer avéré).
CALCUL DES COUTS Il faut rappeler les recommandations qui avaient été faites dans le rapport n°7 du KCE dès décembre 2004 et notamment :
• le lancement régulier d’enquêtes pour recueillir des données bien qu’elles soient disponibles dans Finhosta ou dans d’autres banques de données. Il conviendrait de revoir la manière dont ces banques sont fabriquées et fiabilisées. Des instructions en matière de comptabilisation des honoraires et un contrôle plus précis devraient être appliqués de manière à rendre ces données fiables et facilement utilisables.
• la fixation d’un niveau adéquat de financement en fonction des coûts est étroitement dépendante du niveau des services attendus.
Par ailleurs, il convient de développer une méthode standardisée pour les études de coût destinées à des objectifs de financement, de façon à ce que toutes ces études soient consistantes et comparables

KCE Reports 106 Magnetic Resonance Imaging: cost analysis 1
Scientific summary
Table of contents
TABLE OF FIGURES ................................................................................................................. 4 TABLE OF TABLES................................................................................................................... 5 1 INTRODUCTION AND SCOPE OF THE STUDY................................................... 6 2 MRI TECHNOLOGY .................................................................................................... 7 3 OVERVIEW OF MRI ACTIVITIES IN BELGIUM...................................................... 9 3.1 MRI IN THE CONTEXT OF OTHER MEDICAL IMAGING .......................................................... 9
3.1.1 MRI versus CT and other medical imaging: expenditures and volume...................... 9 3.1.2 MRI and CT activity variations between provinces......................................................10 3.1.3 MRI and CT activity variations between hospitals .......................................................12
3.2 DIFFUSION OF MRI UNITS IN BELGIUM........................................................................................14 3.3 EXAMINATIONS PER UNIT................................................................................................................17 3.4 CASE MIX .................................................................................................................................................18 4 METHODS AND MATERIALS USED FOR THE COST ANALYSIS ................... 21 4.1 FINHOSTA 1999-2005 DATA .............................................................................................................23
4.1.1 The Finhosta dataset........................................................................................................... 23 4.1.2 Limitations of Finhosta .......................................................................................................24
4.2 HOSPITAL QUESTIONNAIRE ............................................................................................................24 4.3 MANUFACTURERS................................................................................................................................25 4.4 LITERATURE............................................................................................................................................25 5 OPERATIONAL PARAMETERS............................................................................... 26 5.1 OPERATING HOURS PER WEEK......................................................................................................26 5.2 PATIENT THROUGHPUT AND EXAMINATION SPEED...........................................................27
5.2.1 Estimate of examination speed evolution based on national NIHDI data...............28 5.2.2 Estimate of examination speed variances for a sample of hospitals .........................28 5.2.3 Results from time registration at one hospital (Callens, Pirenne & co study 2008 8)
.................................................................................................................................................29 5.2.4 Theoretical considerations on evolution in examination speed................................30
6 INVESTMENT COSTS............................................................................................... 31 6.1 INITIAL MRI PURCHASE AND INSTALLATION COSTS............................................................31
6.1.1 Data from the Federal Public Service Health, Food chain safety and Environment.. .................................................................................................................................................31
6.1.2 Hospital questionnaire data...............................................................................................31 6.1.3 Manufacturers data ............................................................................................................. 32
6.2 BUILDING ADJUSTMENT COSTS.....................................................................................................33 6.2.1 Hospital questionnaire data...............................................................................................33 6.2.2 Manufacturers data ............................................................................................................. 35
6.3 UPGRADING COSTS AND LIFETIME OF EQUIPMENT .............................................................35 6.3.1 Hospital questionnaire data ..........................................................................................35 6.3.2 Manufacturers’ information...............................................................................................39
6.4 EQUIVALENT ANNUAL COST (INCLUDING FINANCIAL COSTS)......................................39 6.5 INVESTMENT BALANCE SIMULATIONS........................................................................................40
6.5.1 Investment cost scenarios and input parameters .........................................................40 6.5.2 Investment cost simulation results ..................................................................................42
6.6 HISTORICAL EVOLUTION OF INVESTMENT COSTS................................................................46 6.6.1 Historical evolution of MRI scanner costs .....................................................................46 6.6.2 Historical evolution of building adjustment costs.........................................................47
7 OPERATIONAL COSTS............................................................................................ 48 7.1 COST OF MEDICAL EQUIPMENT MAINTENANCE ...................................................................48
7.1.1 Hospital questionnaire data...............................................................................................48 7.1.2 Manufacturers’ data ............................................................................................................ 49
2 Magnetic Resonance Imaging: cost analysis KCE reports 106
7.2 COST OF NURSING/PARAMEDICAL PERSONNEL.....................................................................49 7.2.1 Number of FTEs: hospital questionnaire data ...............................................................49 7.2.2 Cost per nursing and paramedical FTE: Finhosta data ................................................51
7.3 COST OF NON-REIMBURSABLE PHARMACEUTICAL AND OTHER MEDICAL CONSUMABLES......................................................................................................................................52 7.3.1 Hospital questionnaire data...............................................................................................53
7.4 OTHER DIRECT COSTS.......................................................................................................................54 7.4.1 Finhosta-based estimates ...................................................................................................59
7.5 INDIRECT COSTS..................................................................................................................................60 7.5.1 Indirect costs allocated by m²...........................................................................................61 7.5.2 Indirect costs allocated by FTEs.......................................................................................68
7.6 COST OF RADIOLOGISTS..................................................................................................................69 7.6.1 Number of radiologists ......................................................................................................69 7.6.2 Cost of radiologists per “FTE” .........................................................................................70
7.7 OPERATIONAL BALANCE SIMULATIONS ....................................................................................72 7.7.1 Operational cost scenarios and input parameters .......................................................72 7.7.2 Operational income input .................................................................................................73 7.7.3 Operational balance simulation results...........................................................................73
7.8 HISTORICAL EVOLUTION OF OPERATIONAL BALANCE......................................................76 8 INVESTMENT AND OPERATIONAL BALANCE ................................................. 77 8.1 BASE CASE ANALYSES .........................................................................................................................77 8.2 SENSITIVITY ANALYSES.......................................................................................................................78
8.2.1 Impact of double examinations on the same day/prescription form........................78 8.2.2 Impact of more/less scans per unit (or fewer/more operational units in 2007) on
balance ...................................................................................................................................79 9 CURRENT FINANCING OF MRI ............................................................................. 81 9.1 CURRENT FINANCING STRUCTURE.............................................................................................81 9.2 PART A3 AND B3 OF HOSPITAL BUDGET...................................................................................82
9.2.1 Current A3 and B3 financing of MRI...............................................................................82 9.2.2 Historical A3 and B3 financing of MRI ............................................................................83
9.3 PHYSICIAN FEES.....................................................................................................................................84 9.3.1 Overview of fees .................................................................................................................84 9.3.2 MRI-specific fees ..................................................................................................................85 9.3.3 Other fees.............................................................................................................................86
9.4 SYNTHESIS OF MRI FINANCING......................................................................................................87 9.5 REGIONAL SUBSIDIES FOR BUILDING INVESTMENT...............................................................90 10 REFLECTIONS ON FINANCING OPTIONS FOR MRI ........................................ 91 10.1 FULLY VARIABLE FINANCING..........................................................................................................91 10.2 COMBINATION OF FIXED OR SEMI-VARIABLE AND VARIABLE FINANCING ................91 10.3 JOINT FINANCING OF MRI AND CT.............................................................................................91 10.4 FINANCING OF MEDICAL IMAGING BASED ON ICPC’S ........................................................92 11 CONCLUSIONS AND DISCUSSION...................................................................... 93 11.1 LIMITATIONS OF THE COST ANALYSIS........................................................................................93 11.2 A3 FINANCING VERSUS INVESTMENT COSTS...........................................................................94 11.3 GENERAL REMARK ON A3 FINANCING ......................................................................................94 11.4 B3 AND HONORARIA FINANCING VERSUS OPERATIONAL COSTS ................................95 11.5 THE ISSUE OF NON-ACCREDITED MRI UNITS ..........................................................................96 11.6 ALIGNMENT OF MRI WITH CT........................................................................................................96 12 APPENDIX .................................................................................................................. 98 APPENDIX TO CHAPTER 3 .................................................................................................. 98 MRI VERSUS CT AND OTHER MEDICAL IMAGING: 2007 EXPENDITURES (€).................................98 MRI VERSUS CT: 2007 NUMBER OF EXAMINATIONS...............................................................................99 LIST OF HOSPITALS ACCREDITED FOR MRI .............................................................................................100
KCE Reports 106 Magnetic Resonance Imaging: cost analysis 3
ROYAL DECREES ON MAXIMUM NUMBER OF MRI EXPLOITATIONS.............................................102 APPENDIX TO CHAPTER 4 ................................................................................................104 INITIAL FINHOSTA DATA ANALYSES..........................................................................................................104 CONTACTED HOSPITALS................................................................................................................................109 INITIAL STAGE HOSPITAL QUESTIONNAIRE............................................................................................111 SECOND STAGE QUESTIONNAIRE: DIRECTED TO HEAD OF RADIOLOGY DEPARTMENT ..114 SECOND STAGE QUESTIONNAIRE: DIRECTED TO FINANCIAL AND GENERAL
MANAGEMENT ....................................................................................................................................116 APPENDIX TO CHAPTER 5 ................................................................................................119 EXAMINATION SPEED EVOLUTION ............................................................................................................119 APPENDIX TO CHAPTER 6 ................................................................................................119 DISCOUNT RATE CALCULATION................................................................................................................119 BUILDING INDEX................................................................................................................................................119 APPENDIX TO CHAPTER 9 ................................................................................................121 OVERVIEW OF NIHDI FEES ..............................................................................................................................121 A3-B3 FINANCING: ROYAL DECREE OF 25-04-2002...............................................................................122 MINISTERIAL DECREE OF 30 DECEMBER 1996 ON A3 AND B3 FINANCING................................124 MINISTERIAL DECREE OF 30 DECEMBER 1998 ON A3 AND B3 FINANCING................................124 EVOLUTION OF MRI SPECIFIC FEE TARIFFS (€)........................................................................................125 EVOLUTION OF CONSULTANCE AND GENERAL RADIOLOGY FEE TARIFFS .............................125 INDEXATION OF FEES WITHOUT ALGEBRAIC DIFFERENCES...........................................................125 VARIANCE ANALYSIS OF TOTAL FINANCING 2000-2008 ...................................................................126 VARIANCE ANALYSIS OF OPERATIONAL FINANCING PER EXAMINATION 2000-2008 ...........126 APPENDIX TO CHAPTER 10..............................................................................................127 FRENCH FINANCING SYSTEM........................................................................................................................127 13 REFERENCES............................................................................................................134
4 Magnetic Resonance Imaging: cost analysis KCE reports 106
TABLE OF FIGURES Figure 1: Number of accredited and estimated number of non-accredited MRI units in Belgium: 1999-
2008 ................................................................................................................................................................... 15 Figure 2: Total number of MRI examinations invoiced to NIHDI: evolution 1999-2007 ......................... 17 Figure 3: Total number of MRI examinations per operational MRI scanner per year: evolution from
2000 to 2007.................................................................................................................................................... 17 Figure 4: Case mix evolution 1999-2007 (average all hospitals).................................................................... 18 Figure 5: Case mix in terms of body ports for 2007 per hospital................................................................. 19 Figure 6: MRI financing structure as stipulated legally§ with actual financing proportions ....................... 82 Figure 7: Schematic overview of fee-for-service and capitation fees covering MRI activities with actual
financing proportions ..................................................................................................................................... 84 Figure 8: Evolution of MRI specific fee tariffs..................................................................................................... 86 Figure 9: Evolution of consultance and general radiology fee ........................................................................ 87 Figure 10: Evolution of average yearly financing of an MRI unit between 2000 and 2008 ....................... 88 Figure 11: Operational hours per week per MRI scanner in 2007/2008 versus 1999/2000.................... 27 Figure 12: Cost of purchase and installation for MRI units............................................................................. 32 Figure 13: Building adjustment costs (€) for a first/extra versus replacing unit ......................................... 34 Figure 14: Probabilistic simulation results for annual equivalent investment costs for 1.5 Tesla unit
compared to annual A3-financing (2007)................................................................................................... 43 Figure 15: Probabilistic simulation results for annual equivalent investment costs for a 3 Tesla unit
compared to annual A3-financing (2007)................................................................................................... 44 Figure 16: Average annual equivalent investment cost detail for an MRI unit of 1.5 Tesla: 14 years
lifetime and 50% upgrade – 7 years lifetime and 0% upgrade................................................................ 45 Figure 17: Maintenance costs for a 1.5 Tesla unit in 2007 in € and % of purchase price......................... 48 Figure 18: Number of nursing and paramedical FTEs per unit as a function of operational hours per
week per unit................................................................................................................................................... 50 Figure 19: Number of nursing and paramedical FTEs per unit as a function of operational hours per
week per unit – results by respondent type ............................................................................................. 50 Figure 20: Number of nursing and paramedical FTEs per unit as function of opening hours per unit,
used for cost simulation. ............................................................................................................................... 51 Figure 21: Cost of non-reimbursable pharmaceutical and other medical products per scan.................. 53 Figure 22: Other direct costs ratio (see definition in Table 32).................................................................... 60 Figure 23: Indirect amortization cost per m² for full radiology department (2005).................................. 62 Figure 24: Indirect general cost per m² for full radiology department (2005)............................................ 63 Figure 25: Indirect financial cost per m² for full radiology department (2005) .......................................... 64 Figure 26: Indirect general maintenance cost per m² for full radiology department (2005).................... 65 Figure 27: Indirect heating cost per m² for full radiology department (2005)............................................ 66 Figure 28: total indirect costs allocated per m² for full radiology department (2005) ............................. 67 Figure 29: Number of m² per MRI unit (2005).................................................................................................. 67 Figure 30: Indirect administration cost per FTE for full radiology department (2005)............................. 68 Figure 31: Number of radiologist “FTEs” per unit as function of number of operational hours per unit
............................................................................................................................................................................ 69 Figure 32: Regression lines for number of radiologist FTEs per unit as function of number of
operational hours per unit............................................................................................................................ 70 Figure 33: Simulation results for operational costs and balance for 1.5 and 3 Tesla at general hospitals,
excluding the cost of radiologists (€) ......................................................................................................... 73 Figure 34: Simulation results for operational costs, financing and balance for 1.5 and 3 Tesla at
university hospitals, including the cost of radiologists (€) ..................................................................... 74 Figure 35: Detailed simulation results for operational costs, financing and balance for a 1.5 Tesla at
general hospitals with 65 operational hrs per week ............................................................................... 75
KCE Reports 106 Magnetic Resonance Imaging: cost analysis 5
TABLE OF TABLES Table 1: Number of accredited and estimated number of non-accredited MRI scanners in Belgium ... 15 Table 2: Distribution of all MRI units (accredited, non-accredited and research) by magnetic flux
density at end 2005 ........................................................................................................................................ 16 Table 3: Estimated year-averages for number of operational MRI scanners in Belgium........................... 17 Table 4: Total number of MRI examinations per operational MRI scanner per year................................ 18 Table 5: Case mix evolution in terms of body parts: 2000 versus 2007...................................................... 18 Table 6: B3 indexation 2002- 2009 ...................................................................................................................... 83 Table 7: MRI-specific fees and current tariffs (Jan. 2008) ................................................................................ 85 Table 8: Non MRI-specific fees and their current tariffs (Jan. 2008)............................................................. 86 Table 9: Overview of sources used for cost analysis ....................................................................................... 23 Table 10: Summary statistics on number of operational hours per MRI unit ............................................. 26 Table 11: Time required per MRI examination ................................................................................................. 28 Table 12: Average purchase and installation costs: 1999-2000 versus 2007-2008 .................................... 32 Table 13: Installation and purchase cost: average data from 2 manufacturers ........................................... 33 Table 14: Building adjustment costs for a first/extra versus replacing unit (€) .......................................... 34 Table 15: Cost of cage of Faraday........................................................................................................................ 35 Table 16: Upgrades for 1 Tesla MRI units .......................................................................................................... 36 Table 17: Upgrades for 1.5 Tesla MRI units ....................................................................................................... 36 Table 18: Upgrades for 3 Tesla MRI units .......................................................................................................... 38 Table 19: Overview of scenario parameters...................................................................................................... 41 Table 20: Overview of analysed scenarios ......................................................................................................... 41 Table 21: Distribution functions for input variables ......................................................................................... 41 Table 22: Probabilistic simulation results for annual equivalent investment costs (2007) ....................... 44 Table 23: Probabilistic simulation results for annual equivalent investment balance (2007) ................... 45 Table 24: Account code for maintenance of medical equipment .................................................................. 48 Table 25: Maintenance costs for a 1.5 Tesla unit in 2007 ............................................................................... 48 Table 26: Maintenance cost data based on average data from manufacturers ........................................... 49 Table 27: Number of nursing and paramedical FTEs per unit for general and university hospitals with
average opening hours................................................................................................................................... 51 Table 28: Nursing personnel costs at radiology department in 2005 .......................................................... 52 Table 29: Indexation of hospital personnel wages. ........................................................................................... 52 Table 30: Account codes used for non-reimbursable pharmaceutical and medical consumables .......... 52 Table 31: Account codes used for other direct costs ..................................................................................... 54 Table 32: Definition of “other direct costs” ratio ............................................................................................ 59 Table 33: Covered indirect costs (with Finhosta account codes) ................................................................. 60 Table 34: Number of physician “FTEs” per unit for general and university hospitals with average
opening hours.................................................................................................................................................. 70 Table 35: Radiologist cost per “FTE” in 2005, based on 62 accounts of radiology department
(university hospitals) and extrapolation to 2008 ..................................................................................... 71 Table 36: Data on net honoraria per radiologist at general hospitals (2007)............................................. 71 Table 37: Overview of scenario parameters...................................................................................................... 72 Table 38: Distribution functions for input variables ......................................................................................... 72 Table 39: Simulation results for operational costs (remuneration of physicians at excluded for general
hospitals but included for university hospitals) ........................................................................................ 74 Table 40: Simulation results for operational balance per MRI unit (to be distributed to the physicians
and the hospital for general hospitals, and to the hospital only for university hospitals) ............... 75 Table 41: Average total (investment + operational) balance for 1.5 Tesla units........................................ 77 Table 42: Average total (investment + operational) balance for 3 Tesla units........................................... 77 Table 42: Overview of nomenclature created on 13.08.1999 for specific MRI acts ............................... 121 Table 43: Building index for hospitals................................................................................................................ 120
6 Magnetic Resonance Imaging: cost analysis KCE reports 106
1 INTRODUCTION AND SCOPE OF THE STUDY In 2006, the Belgian Health Care Knowledge Centre (KCE) published a Health Technology Assessment report on Magnetic Resonance Imaging (MRI), including a review of the evidence on the diagnostic efficacy of MRI for different indications and an analysis of the current and possible alternative financing systems for MRI in Belgium. Reflections were made with respect to the potential impact of different financing systems on the number of MRI unitsa and the volume of MRI examinations, also in relation to Computed Tomography (CT). CT is a medical imaging technique that can sometimes be substituted by MRI. Substitution of CT by MRI, where possible, is to be preferred because CT, unlike MRI, exposes patients to ionising radiation. The two techniques are, however, financed differently. This might create incentives to using one or the other technique. Moreover, the number of MRI units is limited through governmental programming. This means that hospitals need to have permission to install an MRI unit. In the previous report, the substitution possibilities between CT and MRI have been examined in different indications. Building further on the report, medical guidelines will now be developed at the NIHDI.
In 2008, the Minister of Public Health asked KCE to further examine the issue of programming and financing of MRI. As there is no data available to determine the number of required MRI units or the accreditation criteria on a scientific basis, the focus of this study is on the costs of MRI. To assess the appropriateness of the financing mechanism for MRI, it is important to have insight into the real costs of MRI from the perspective of the hospital.
The present study is conducted to provide an overview of the costs associated with running an MRI facility in a Belgian setting. The selected costing methodology is a historical costing (as opposed to standard costing) in that it is based on historical and actual cost data of the hospitals. The presented costs therefore give an indication of the real costs in the hospitals. In standard costing, the costs are analysed based on standards as could be defined for qualitative, efficient and safe care. Furthermore, the cost approach taken is an integral (or full or absorption) costing, which means that all cost components are analysed, as opposed to a partial cost calculation in which only direct or variable or differential costs may be taken into account. The costing analysis is furthermore characterized by a top-down approach. Total costs or total resources for MRI units were collected and consequently divided by the number of operational hours or examinations to calculate total costs of an MRI service in different operational scenarios. In an ideal cost calculation, this top-down approach would be combined with a bottom-up approach, such as a (time driven) activity based costing in which the time and other resources required to perform one examination are registered on a large sample and for a variety of types of examinations and patients. As such, more information would be gathered on the variety of costs observed in hospitals and the rationale behind the variations.
a Throughout the report, MRI “units” are defined as MRI scanning devices (scanners), and thus not as MRI
services (which may operate multiple MRI units).
KCE Reports 106 Magnetic Resonance Imaging: cost analysis 7
2 MRI TECHNOLOGY Magnetic resonance imaging (MRI), or Nuclear magnetic resonance (NMR) imaging is a medical imaging technique that, unlike CT, does not use ionizing radiation, but a powerful magnetic field to align the nuclear magnetization of (usually) hydrogen atoms in water in the body. MRI is based on the principles of nuclear magnetic resonance (NMR), a spectroscopic technique used by scientists to obtain microscopic chemical and physical information about molecules. The technique was called magnetic resonance imaging rather than nuclear magnetic resonance imaging (NMRI) because of the negative connotations associated with the word nuclear in the late 1970's. 1
The human body is primarily fat and water. Fat and water have many hydrogen atoms which make the human body approximately 63% hydrogen atoms. Hydrogen nuclei have an NMR signal. For these reasons magnetic resonance imaging primarily images the NMR signal from the hydrogen nuclei (or protons).1 When a person goes inside the magnetic field of the scanner these protons align with the direction of the field. A second radiofrequency electromagnetic field is then briefly turned on causing the protons to absorb some of its energy. When this field is turned off the protons release this energy at a radiofrequency which can be detected by the scanner. The position of protons in the body can be determined by applying additional magnetic fields during the scan which allows an image of the body to be built up. These are created by turning gradients coils on and off which creates the familiar knocking sounds during an MR scan. Diseased tissue, such as tumors, can be detected because the protons in different tissues return to their equilibrium state at different rates. By changing the parameters on the scanner this effect is used to create contrast between different types of body tissue. Contrast agents may be injected intravenously to enhance the appearance of blood vessels, tumors or inflammation. Contrast agents may also be directly injected into a joint, in the case of arthrograms, MR images of joints.
As already mentioned, the most important advantage of MRI scanning compared to other techniques such as computed tomography (CT) and digital subtraction angiography (DSA) is the absence of ionising radiation. In addition the superior resolution, multiplanar imaging capability and safer contrast agents are the major advantages of MRI. A disadvantage of MRI is that patients with ferro-magnetic implants cannot be examined by MRI and more co-operation from the patient is generally required, which renders the examination of intensive care patients more difficult. The frequent detection of incidental findings that can be misinterpreted as causing the patient’s symptoms is another disadvantage of MRI that is often underestimated.2
Since the introduction of MRI, more than 25 years ago, remarkable technological advances have been achieved providing better resolution, increased speed of imaging and new applications. In the first decade, the excellent diagnostic performance of MRI has been demonstrated for many neurological and musculoskeletal applications. The imaging of the brain stem, the spinal cord and the cartilage bone are only a few examples. Later abdominal, breast, cardiac and vascular imaging developed rapidly taking advantage of the advances in MR technology. Functional MRI and interventional MRI are now the most important emerging MR applications.
1.5 VERSUS 3 TESLA FIELD STRENGTH
As magnetic field strength is an important factor in determining image quality, higher field strengths have been developed. In Belgium a field strength of 1.5 Tesla is now the standard. Besides that they are more costly, 3 Tesla units also deal with a number of disadvantages compared to 1.5 Tesla units and therefore they are currently only installed at hospitals already having a 1.5 Tesla unit.
What is the difference between a 1.5 and 3 Tesla unit? With a 3 Tesla unit, the time necessary to acquire satisfactory images can be substantially reduced (an examination can be done in approximately half the time) or alternatively, the same acquisition time may deliver images at higher resolution. By bringing the patient in a magnetic field, an MR signal is generated.
8 Magnetic Resonance Imaging: cost analysis KCE reports 106
The strength of this signal is directly proportional to the number of protons that can be activated. The number of protons that can be activated is in turn directly proportional to the external magnetic field in which the patient is brought. A 3 Tesla unit can generate and receive twice as much signal as a 1.5 Tesla. Because the signal-to-noise ratio (SNR) correlates in approximately linear fashion with field strength, it is roughly twice as great at 3 Tesla as at 1.5 Tesla.3
Also, greater contrast is available at higher field strength, a fact already well known from comparisons of images obtained at 0.5 Tesla, 1 Tesla, and 1.5 Tesla.4,, 5 Among other benefits, higher contrast may permit reduction of gadolinium doses and, in some cases, earlier detection of disease, a possible stimulus for more patient referrals.
Furthermore, the field strength is also intrinsically correlated with the frequency spectrum. As the different frequency spectra of the 3 Tesla are at larger distance, a number of applications such as spectroscopy and functional MRI benefit significantly.
Spectroscopy
Spectroscopy offers the possibility to examine the chemical composition of tissue in non-invasive way. The combination of MRI-imaging and MR-spectroscopy enables to differentiate tumoral from normal tissue. Even though spectroscopy is available at nearly all MRI scanners for years, the technique has not been very successful so far. With the 3 Tesla field strength the spectroscopic applications will likely break through in daily clinical practice.
Functional MRI
The largest advantage of the 3 Tesla in neuroradiology is the functional MRI (fMRI). fMRI is a technique based on the BOLD-principle (Blood oxygenation level-dependent contrast studies). This technique is 40% more sensitive on a 3 Tesla than on a 1.5 Tesla scanner. With fMRI it is possible to determine which neurons in the brain cortex are active during a certain activity, such as moving, listening or speaking. This technique can be used in the preoperative evaluation of brain tumors and may influence the treatment technique. Other applications of fMRI are epilepsy-examination and stroke care.
DISADVANTAGES OF 3 TESLA
The 3 Tesla units also deal with some disadvantages. Strong magnetic fields create an energy transfer through electromagnetic waves from the scanner to the patient. This heats the human body. To follow the international standard of energy-input, multiple software adjustments have been developed to deal with this issue. Nevertheless, the energy levels need to be closely monitored on a constant basis.
KCE Reports 106 Magnetic Resonance Imaging: cost analysis 9
3 OVERVIEW OF MRI ACTIVITIES IN BELGIUM
3.1 MRI IN THE CONTEXT OF OTHER MEDICAL IMAGING
3.1.1 MRI versus CT and other medical imaging: expenditures and volume
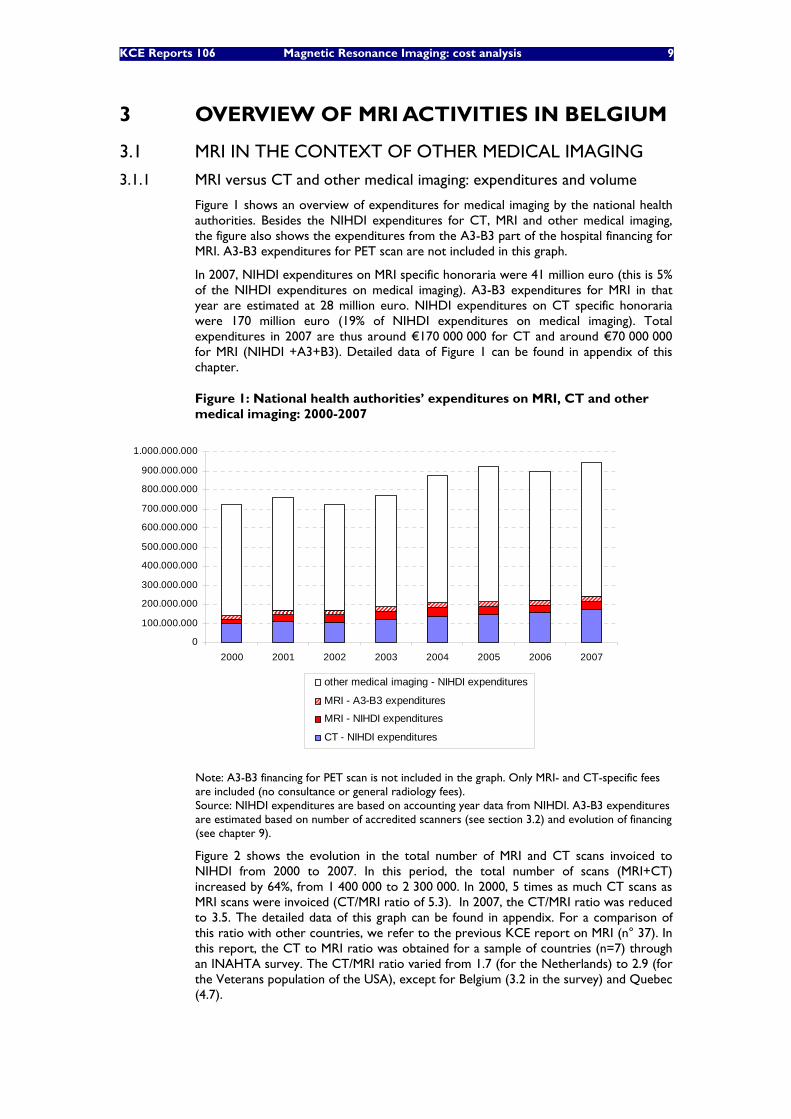
Figure 1 shows an overview of expenditures for medical imaging by the national health authorities. Besides the NIHDI expenditures for CT, MRI and other medical imaging, the figure also shows the expenditures from the A3-B3 part of the hospital financing for MRI. A3-B3 expenditures for PET scan are not included in this graph.
In 2007, NIHDI expenditures on MRI specific honoraria were 41 million euro (this is 5% of the NIHDI expenditures on medical imaging). A3-B3 expenditures for MRI in that year are estimated at 28 million euro. NIHDI expenditures on CT specific honoraria were 170 million euro (19% of NIHDI expenditures on medical imaging). Total expenditures in 2007 are thus around €170 000 000 for CT and around €70 000 000 for MRI (NIHDI +A3+B3). Detailed data of Figure 1 can be found in appendix of this chapter.
Figure 1: National health authorities’ expenditures on MRI, CT and other medical imaging: 2000-2007
0
100.000.000
200.000.000
300.000.000
400.000.000
500.000.000
600.000.000
700.000.000
800.000.000
900.000.000
1.000.000.000
2000 2001 2002 2003 2004 2005 2006 2007
other medical imaging - NIHDI expenditures
MRI - A3-B3 expenditures
MRI - NIHDI expenditures
CT - NIHDI expenditures
Note: A3-B3 financing for PET scan is not included in the graph. Only MRI- and CT-specific fees are included (no consultance or general radiology fees). Source: NIHDI expenditures are based on accounting year data from NIHDI. A3-B3 expenditures are estimated based on number of accredited scanners (see section 3.2) and evolution of financing (see chapter 9).
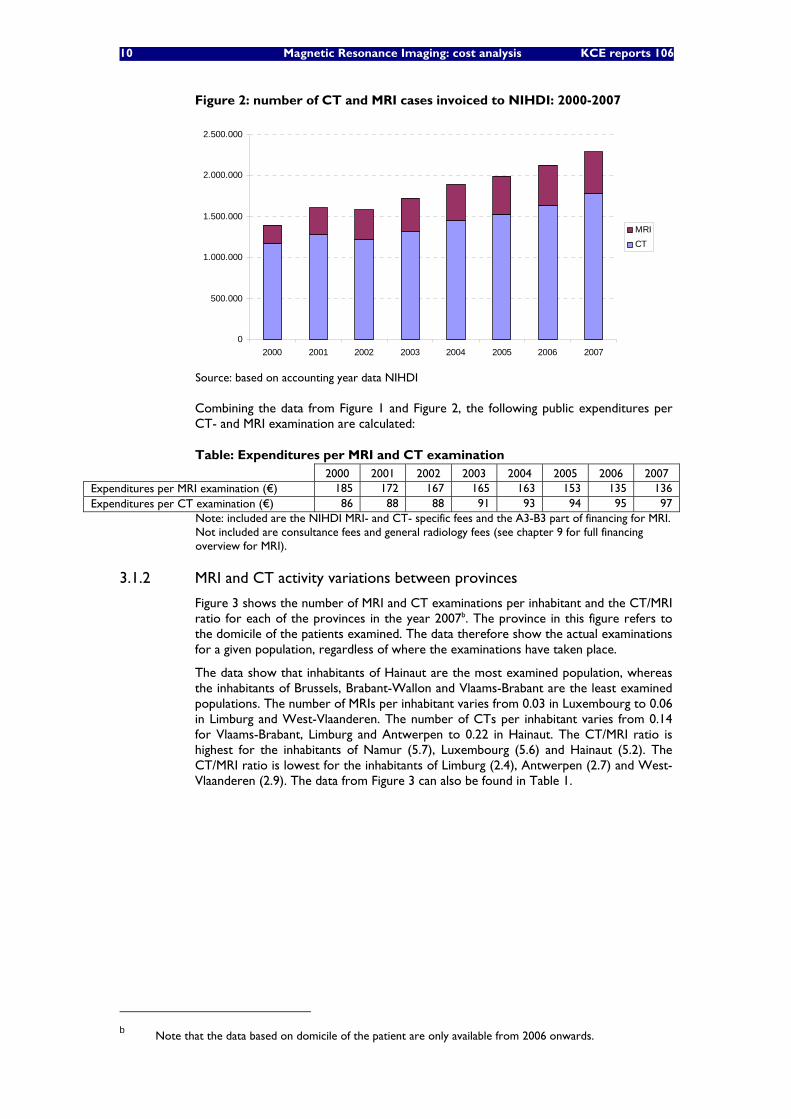
Figure 2 shows the evolution in the total number of MRI and CT scans invoiced to NIHDI from 2000 to 2007. In this period, the total number of scans (MRI+CT) increased by 64%, from 1 400 000 to 2 300 000. In 2000, 5 times as much CT scans as MRI scans were invoiced (CT/MRI ratio of 5.3). In 2007, the CT/MRI ratio was reduced to 3.5. The detailed data of this graph can be found in appendix. For a comparison of this ratio with other countries, we refer to the previous KCE report on MRI (n° 37). In this report, the CT to MRI ratio was obtained for a sample of countries (n=7) through an INAHTA survey. The CT/MRI ratio varied from 1.7 (for the Netherlands) to 2.9 (for the Veterans population of the USA), except for Belgium (3.2 in the survey) and Quebec (4.7).
10 Magnetic Resonance Imaging: cost analysis KCE reports 106
Figure 2: number of CT and MRI cases invoiced to NIHDI: 2000-2007
0
500.000
1.000.000
1.500.000
2.000.000
2.500.000
2000 2001 2002 2003 2004 2005 2006 2007
MRICT
Source: based on accounting year data NIHDI
Combining the data from Figure 1 and Figure 2, the following public expenditures per CT- and MRI examination are calculated:
Table: Expenditures per MRI and CT examination 2000 2001 2002 2003 2004 2005 2006 2007 Expenditures per MRI examination (€) 185 172 167 165 163 153 135 136 Expenditures per CT examination (€) 86 88 88 91 93 94 95 97
Note: included are the NIHDI MRI- and CT- specific fees and the A3-B3 part of financing for MRI. Not included are consultance fees and general radiology fees (see chapter 9 for full financing overview for MRI).
3.1.2 MRI and CT activity variations between provinces
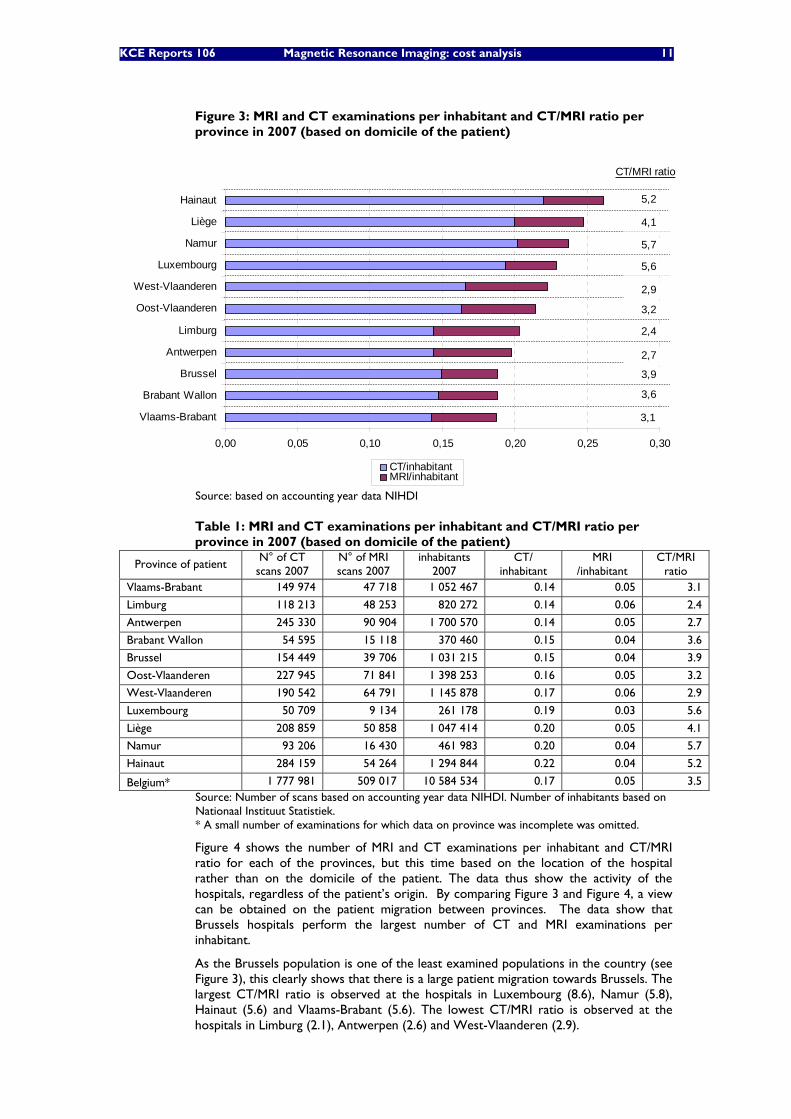
Figure 3 shows the number of MRI and CT examinations per inhabitant and the CT/MRI ratio for each of the provinces in the year 2007b. The province in this figure refers to the domicile of the patients examined. The data therefore show the actual examinations for a given population, regardless of where the examinations have taken place.
The data show that inhabitants of Hainaut are the most examined population, whereas the inhabitants of Brussels, Brabant-Wallon and Vlaams-Brabant are the least examined populations. The number of MRIs per inhabitant varies from 0.03 in Luxembourg to 0.06 in Limburg and West-Vlaanderen. The number of CTs per inhabitant varies from 0.14 for Vlaams-Brabant, Limburg and Antwerpen to 0.22 in Hainaut. The CT/MRI ratio is highest for the inhabitants of Namur (5.7), Luxembourg (5.6) and Hainaut (5.2). The CT/MRI ratio is lowest for the inhabitants of Limburg (2.4), Antwerpen (2.7) and West-Vlaanderen (2.9). The data from Figure 3 can also be found in Table 1.
b Note that the data based on domicile of the patient are only available from 2006 onwards.
KCE Reports 106 Magnetic Resonance Imaging: cost analysis 11
Figure 3: MRI and CT examinations per inhabitant and CT/MRI ratio per province in 2007 (based on domicile of the patient)
0,00 0,05 0,10 0,15 0,20 0,25 0,30
Vlaams-Brabant
Brabant Wallon
Brussel
Antwerpen
Limburg
Oost-Vlaanderen
West-Vlaanderen
Luxembourg
Namur
Liège
Hainaut
CT/inhabitantMRI/inhabitant
CT/MRI ratio
3,1
3,6
3,9
2,7
2,4
3,2
2,9
5,6
5,7
4,1
5,2
Source: based on accounting year data NIHDI
Table 1: MRI and CT examinations per inhabitant and CT/MRI ratio per province in 2007 (based on domicile of the patient)
Province of patient N° of CT
scans 2007 N° of MRI scans 2007
inhabitants 2007
CT/ inhabitant
MRI /inhabitant
CT/MRI ratio
Vlaams-Brabant 149 974 47 718 1 052 467 0.14 0.05 3.1
Limburg 118 213 48 253 820 272 0.14 0.06 2.4
Antwerpen 245 330 90 904 1 700 570 0.14 0.05 2.7
Brabant Wallon 54 595 15 118 370 460 0.15 0.04 3.6
Brussel 154 449 39 706 1 031 215 0.15 0.04 3.9
Oost-Vlaanderen 227 945 71 841 1 398 253 0.16 0.05 3.2
West-Vlaanderen 190 542 64 791 1 145 878 0.17 0.06 2.9
Luxembourg 50 709 9 134 261 178 0.19 0.03 5.6
Liège 208 859 50 858 1 047 414 0.20 0.05 4.1
Namur 93 206 16 430 461 983 0.20 0.04 5.7
Hainaut 284 159 54 264 1 294 844 0.22 0.04 5.2
Belgium* 1 777 981 509 017 10 584 534 0.17 0.05 3.5 Source: Number of scans based on accounting year data NIHDI. Number of inhabitants based on Nationaal Instituut Statistiek. * A small number of examinations for which data on province was incomplete was omitted.
Figure 4 shows the number of MRI and CT examinations per inhabitant and CT/MRI ratio for each of the provinces, but this time based on the location of the hospital rather than on the domicile of the patient. The data thus show the activity of the hospitals, regardless of the patient’s origin. By comparing Figure 3 and Figure 4, a view can be obtained on the patient migration between provinces. The data show that Brussels hospitals perform the largest number of CT and MRI examinations per inhabitant.
As the Brussels population is one of the least examined populations in the country (see Figure 3), this clearly shows that there is a large patient migration towards Brussels. The largest CT/MRI ratio is observed at the hospitals in Luxembourg (8.6), Namur (5.8), Hainaut (5.6) and Vlaams-Brabant (5.6). The lowest CT/MRI ratio is observed at the hospitals in Limburg (2.1), Antwerpen (2.6) and West-Vlaanderen (2.9).
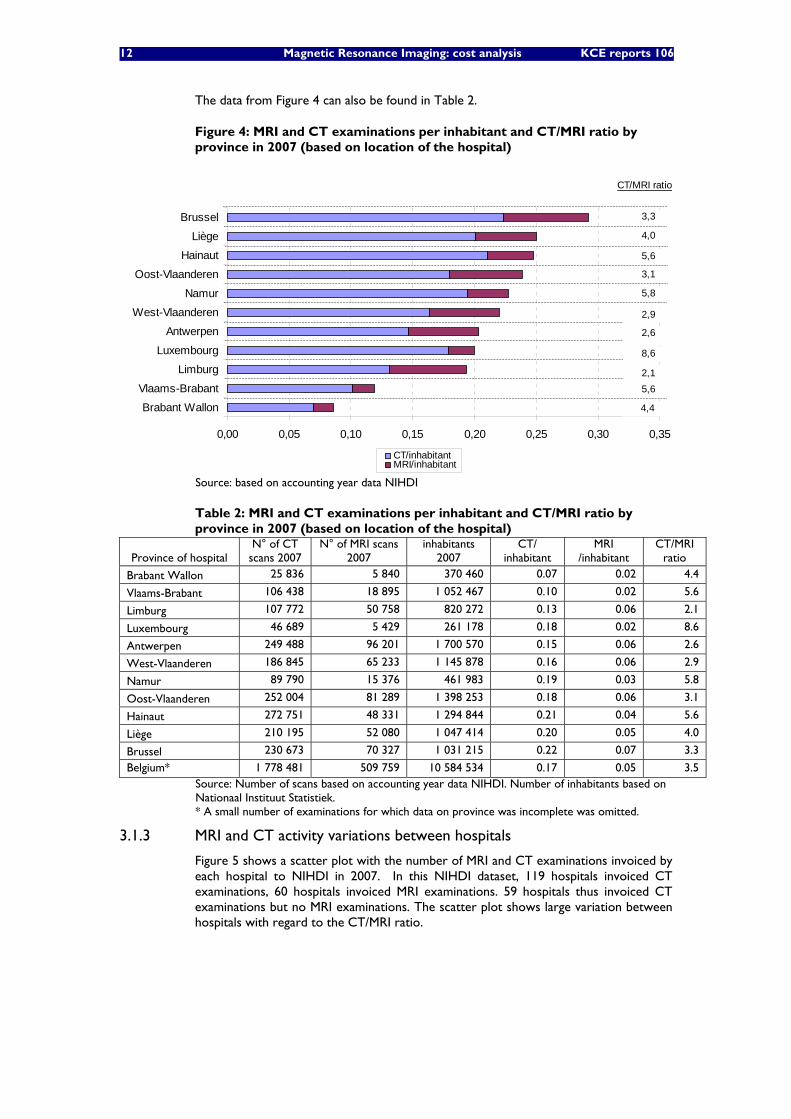
12 Magnetic Resonance Imaging: cost analysis KCE reports 106
The data from Figure 4 can also be found in Table 2.
Figure 4: MRI and CT examinations per inhabitant and CT/MRI ratio by province in 2007 (based on location of the hospital)
0,00 0,05 0,10 0,15 0,20 0,25 0,30 0,35
Brabant Wallon
Vlaams-Brabant
Limburg
Luxembourg
Antwerpen
West-Vlaanderen
Namur
Oost-Vlaanderen
Hainaut
Liège
Brussel
CT/inhabitantMRI/inhabitant
CT/MRI ratio
4,4
5,62,1
8,6
2,6
2,9
5,8
3,1
5,6
4,0
3,3
Source: based on accounting year data NIHDI
Table 2: MRI and CT examinations per inhabitant and CT/MRI ratio by province in 2007 (based on location of the hospital)
Province of hospital N° of CT
scans 2007 N° of MRI scans
2007 inhabitants
2007 CT/
inhabitant MRI
/inhabitant CT/MRI
ratio
Brabant Wallon 25 836 5 840 370 460 0.07 0.02 4.4
Vlaams-Brabant 106 438 18 895 1 052 467 0.10 0.02 5.6
Limburg 107 772 50 758 820 272 0.13 0.06 2.1
Luxembourg 46 689 5 429 261 178 0.18 0.02 8.6
Antwerpen 249 488 96 201 1 700 570 0.15 0.06 2.6
West-Vlaanderen 186 845 65 233 1 145 878 0.16 0.06 2.9
Namur 89 790 15 376 461 983 0.19 0.03 5.8
Oost-Vlaanderen 252 004 81 289 1 398 253 0.18 0.06 3.1
Hainaut 272 751 48 331 1 294 844 0.21 0.04 5.6
Liège 210 195 52 080 1 047 414 0.20 0.05 4.0
Brussel 230 673 70 327 1 031 215 0.22 0.07 3.3
Belgium* 1 778 481 509 759 10 584 534 0.17 0.05 3.5 Source: Number of scans based on accounting year data NIHDI. Number of inhabitants based on Nationaal Instituut Statistiek. * A small number of examinations for which data on province was incomplete was omitted.
3.1.3 MRI and CT activity variations between hospitals
Figure 5 shows a scatter plot with the number of MRI and CT examinations invoiced by each hospital to NIHDI in 2007. In this NIHDI dataset, 119 hospitals invoiced CT examinations, 60 hospitals invoiced MRI examinations. 59 hospitals thus invoiced CT examinations but no MRI examinations. The scatter plot shows large variation between hospitals with regard to the CT/MRI ratio.
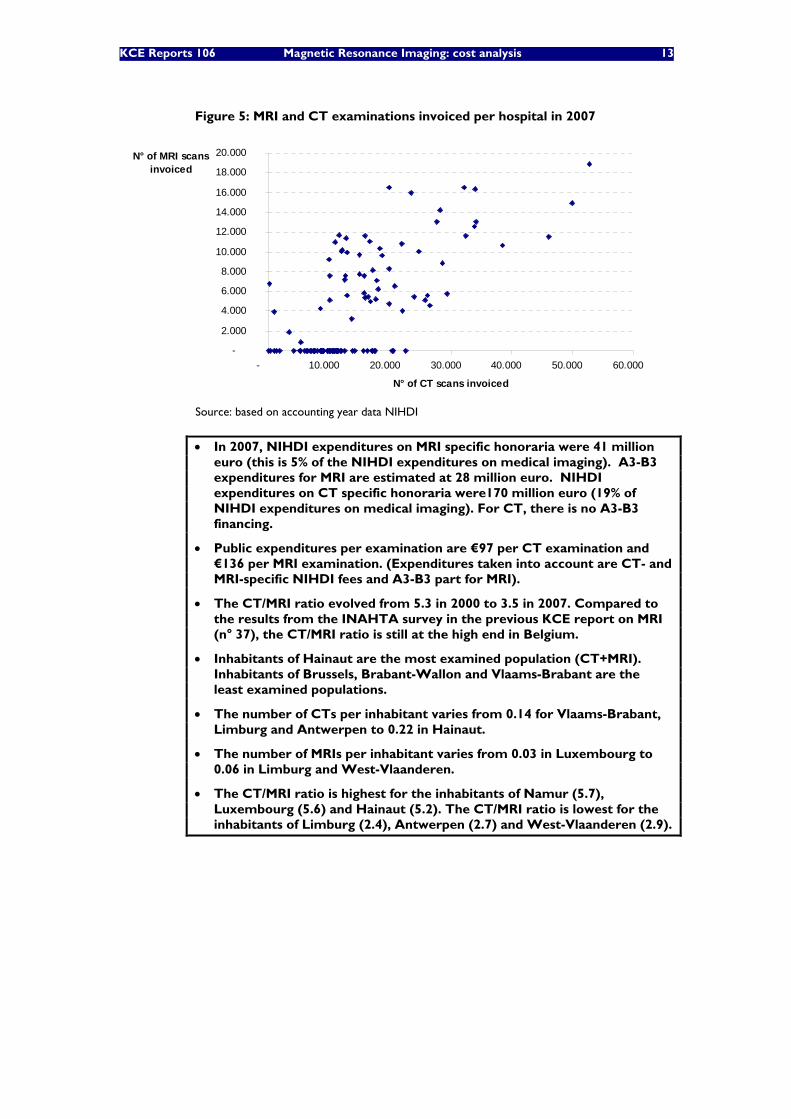
KCE Reports 106 Magnetic Resonance Imaging: cost analysis 13
Figure 5: MRI and CT examinations invoiced per hospital in 2007
-
2.000
4.000
6.000
8.000
10.000
12.000
14.000
16.000
18.000
20.000
- 10.000 20.000 30.000 40.000 50.000 60.000
N° of CT scans invoiced
N° of MRI scans invoiced
Source: based on accounting year data NIHDI
• In 2007, NIHDI expenditures on MRI specific honoraria were 41 million euro (this is 5% of the NIHDI expenditures on medical imaging). A3-B3 expenditures for MRI are estimated at 28 million euro. NIHDI expenditures on CT specific honoraria were170 million euro (19% of NIHDI expenditures on medical imaging). For CT, there is no A3-B3 financing.
• Public expenditures per examination are €97 per CT examination and €136 per MRI examination. (Expenditures taken into account are CT- and MRI-specific NIHDI fees and A3-B3 part for MRI).
• The CT/MRI ratio evolved from 5.3 in 2000 to 3.5 in 2007. Compared to the results from the INAHTA survey in the previous KCE report on MRI (n° 37), the CT/MRI ratio is still at the high end in Belgium.
• Inhabitants of Hainaut are the most examined population (CT+MRI). Inhabitants of Brussels, Brabant-Wallon and Vlaams-Brabant are the least examined populations.
• The number of CTs per inhabitant varies from 0.14 for Vlaams-Brabant, Limburg and Antwerpen to 0.22 in Hainaut.
• The number of MRIs per inhabitant varies from 0.03 in Luxembourg to 0.06 in Limburg and West-Vlaanderen.
• The CT/MRI ratio is highest for the inhabitants of Namur (5.7), Luxembourg (5.6) and Hainaut (5.2). The CT/MRI ratio is lowest for the inhabitants of Limburg (2.4), Antwerpen (2.7) and West-Vlaanderen (2.9).
14 Magnetic Resonance Imaging: cost analysis KCE reports 106
3.2 DIFFUSION OF MRI UNITS IN BELGIUM The number of MRI units in Belgium is restricted by the government. In order to operate an MRI unit, a hospital has to meet accreditation criteria. Once approval is obtained, a hospital yearly receives lump sum payment from the government to operate its MRI unit and its MRI activities are reimbursed by the National Institute for Health and Disability Insurance (NIHDI). Besides accredited MRI units, a number of non-accredited units are operational in Belgium. These are not entitled to the lump sum or to reimbursement of MRI services, but in reality hospitals nonetheless do invoice to NIHDI for examinations on these non-accredited units. In Belgium MRI units can only be installed within a hospital. MRI is not allowed in private practices outside a hospital.
The maximum number of MRI units in Belgium is determined at federal level by royal decrees. In the royal decrees, the total number for Belgium is split by territory (gewest/region). Nevertheless, it is the communities (gemeenschappen/communautés) that grant the accreditationsc.
The first MRI units were accredited following the royal decree of 27 October 1989. In this decree, no fixed number was stipulated yet. Following the royal decree of 26 May 1999, there was an extension of accreditations in the years 1999 to 2002. Following the royal decree of 25 October 2006 (which stipulates 40 extra MRI units), a new flow of accreditations has started. At end 2008, 92 MRI units were accredited in Belgium.
In order to have a complete view on all operational MRI units, also non-official units need to be taken into account. Furthermore, university hospitals might also use their research MRI unit for clinical purposes. As data on the non-accredited MRI units is not easy to obtain, estimates were made, based on a datasource of end 2005 from the “college radiologie” including purchase year information for accredited as well as non-accredited MRI units and based on input from some experts of the expert group for the evolution before and after this date. Table 3 and Figure 1 show the evolution of the number of accredited, non-accredited and research MRI units in Belgium from 31/12/2000 onwards.
See appendix for a complete list of accredited units over time and the royal decrees with regard to the maximum number of MRI units in Belgium.
c According to Article 5, paragraph 1, Iº of the “Bijzondere wet van 8 augustus 1980 tot hervorming van de
instellingen” which stipulates the residual character of the competence of the communities regarding health policy. The communities are responsible for all health policy aspects except what is explicitly assigned to the federal government. (based on http:// www.wvc.vlaanderen.be / juriwel / bestuur / rg / bevoegdheid / bijzwet.htm)
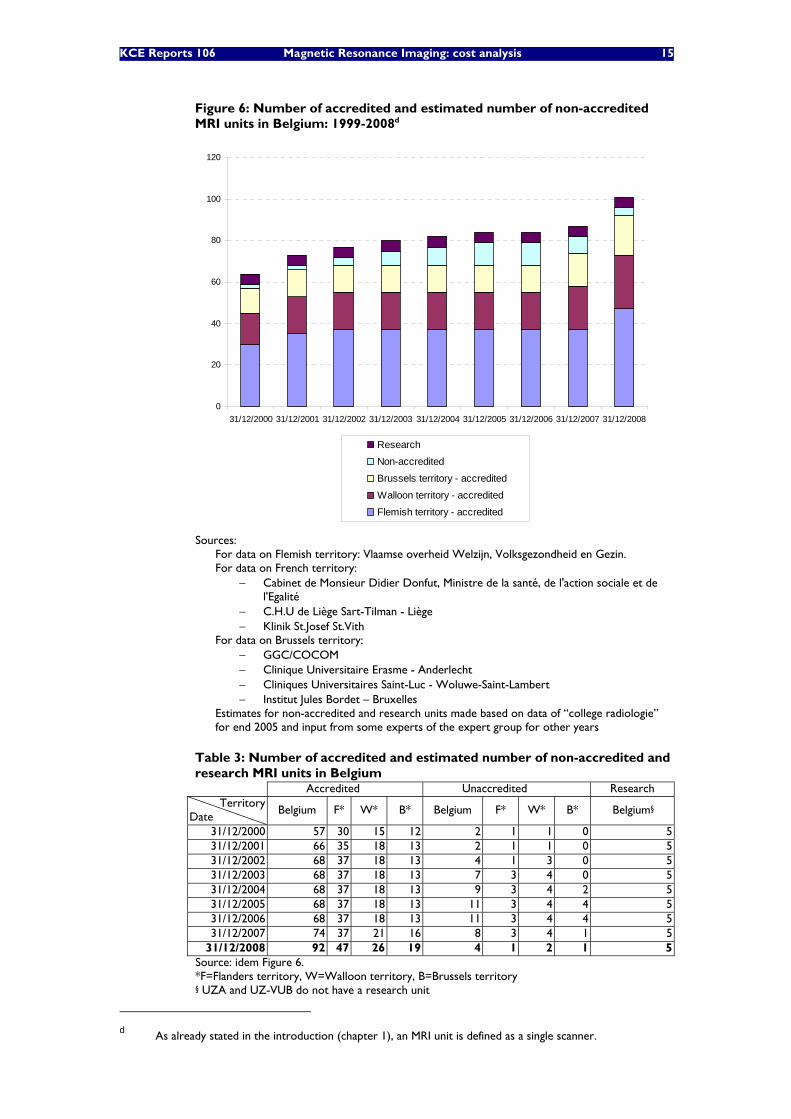
KCE Reports 106 Magnetic Resonance Imaging: cost analysis 15
Figure 6: Number of accredited and estimated number of non-accredited MRI units in Belgium: 1999-2008d
0
20
40
60
80
100
120
31/12/2000 31/12/2001 31/12/2002 31/12/2003 31/12/2004 31/12/2005 31/12/2006 31/12/2007 31/12/2008
Research
Non-accredited
Brussels territory - accredited
Walloon territory - accredited
Flemish territory - accredited
Sources:
For data on Flemish territory: Vlaamse overheid Welzijn, Volksgezondheid en Gezin. For data on French territory:
− Cabinet de Monsieur Didier Donfut, Ministre de la santé, de l'action sociale et de l'Egalité
− C.H.U de Liège Sart-Tilman - Liège − Klinik St.Josef St.Vith
For data on Brussels territory: − GGC/COCOM − Clinique Universitaire Erasme - Anderlecht − Cliniques Universitaires Saint-Luc - Woluwe-Saint-Lambert − Institut Jules Bordet – Bruxelles
Estimates for non-accredited and research units made based on data of “college radiologie” for end 2005 and input from some experts of the expert group for other years
Table 3: Number of accredited and estimated number of non-accredited and research MRI units in Belgium
Accredited Unaccredited Research Territory
Date Belgium F* W* B* Belgium F* W* B* Belgium§
31/12/2000 57 30 15 12 2 1 1 0 5 31/12/2001 66 35 18 13 2 1 1 0 5 31/12/2002 68 37 18 13 4 1 3 0 5 31/12/2003 68 37 18 13 7 3 4 0 5 31/12/2004 68 37 18 13 9 3 4 2 5 31/12/2005 68 37 18 13 11 3 4 4 5 31/12/2006 68 37 18 13 11 3 4 4 5 31/12/2007 74 37 21 16 8 3 4 1 5
31/12/2008 92 47 26 19 4 1 2 1 5 Source: idem Figure 6. *F=Flanders territory, W=Walloon territory, B=Brussels territory § UZA and UZ-VUB do not have a research unit
d As already stated in the introduction (chapter 1), an MRI unit is defined as a single scanner.
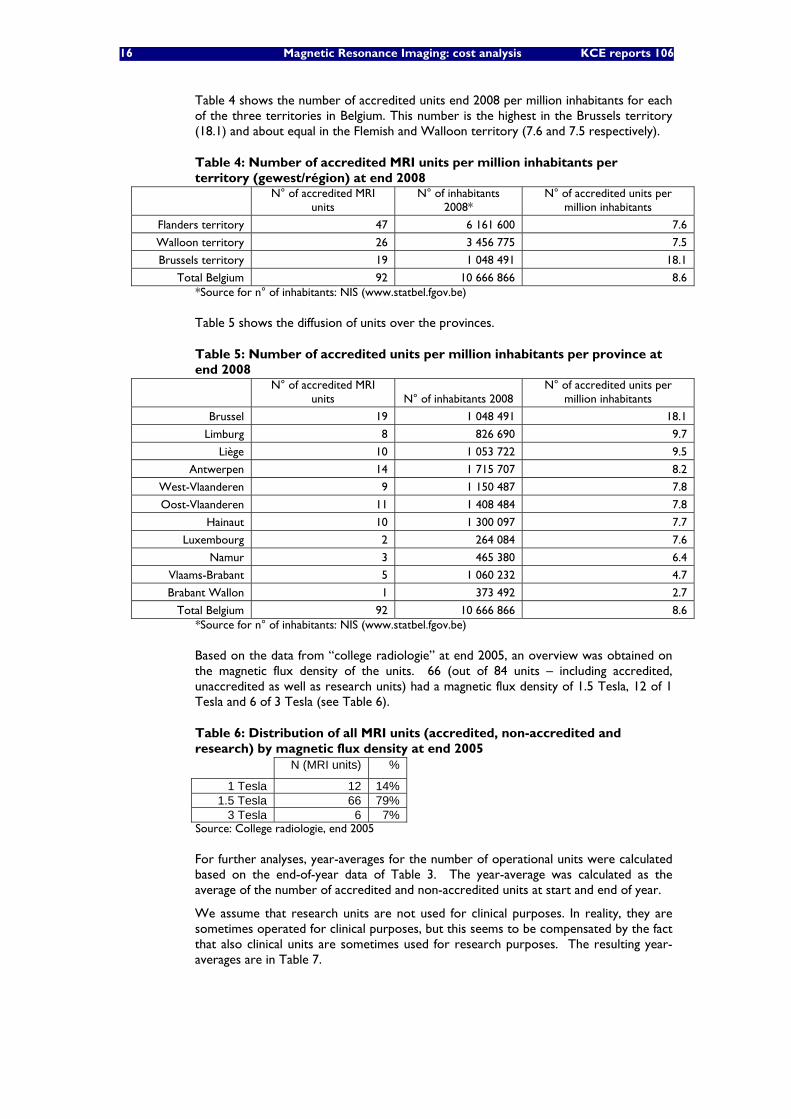
16 Magnetic Resonance Imaging: cost analysis KCE reports 106
Table 4 shows the number of accredited units end 2008 per million inhabitants for each of the three territories in Belgium. This number is the highest in the Brussels territory (18.1) and about equal in the Flemish and Walloon territory (7.6 and 7.5 respectively).
Table 4: Number of accredited MRI units per million inhabitants per territory (gewest/région) at end 2008
N° of accredited MRI
units N° of inhabitants
2008* N° of accredited units per
million inhabitants
Flanders territory 47 6 161 600 7.6
Walloon territory 26 3 456 775 7.5
Brussels territory 19 1 048 491 18.1
Total Belgium 92 10 666 866 8.6 *Source for n° of inhabitants: NIS (www.statbel.fgov.be)
Table 5 shows the diffusion of units over the provinces.
Table 5: Number of accredited units per million inhabitants per province at end 2008
N° of accredited MRI
units N° of inhabitants 2008 N° of accredited units per
million inhabitants
Brussel 19 1 048 491 18.1
Limburg 8 826 690 9.7
Liège 10 1 053 722 9.5
Antwerpen 14 1 715 707 8.2
West-Vlaanderen 9 1 150 487 7.8
Oost-Vlaanderen 11 1 408 484 7.8
Hainaut 10 1 300 097 7.7
Luxembourg 2 264 084 7.6
Namur 3 465 380 6.4
Vlaams-Brabant 5 1 060 232 4.7
Brabant Wallon 1 373 492 2.7
Total Belgium 92 10 666 866 8.6 *Source for n° of inhabitants: NIS (www.statbel.fgov.be)
Based on the data from “college radiologie” at end 2005, an overview was obtained on the magnetic flux density of the units. 66 (out of 84 units – including accredited, unaccredited as well as research units) had a magnetic flux density of 1.5 Tesla, 12 of 1 Tesla and 6 of 3 Tesla (see Table 6).
Table 6: Distribution of all MRI units (accredited, non-accredited and research) by magnetic flux density at end 2005 N (MRI units) %
1 Tesla 12 14% 1.5 Tesla 66 79%
3 Tesla 6 7% Source: College radiologie, end 2005
For further analyses, year-averages for the number of operational units were calculated based on the end-of-year data of Table 3. The year-average was calculated as the average of the number of accredited and non-accredited units at start and end of year.
We assume that research units are not used for clinical purposes. In reality, they are sometimes operated for clinical purposes, but this seems to be compensated by the fact that also clinical units are sometimes used for research purposes. The resulting year-averages are in Table 7.
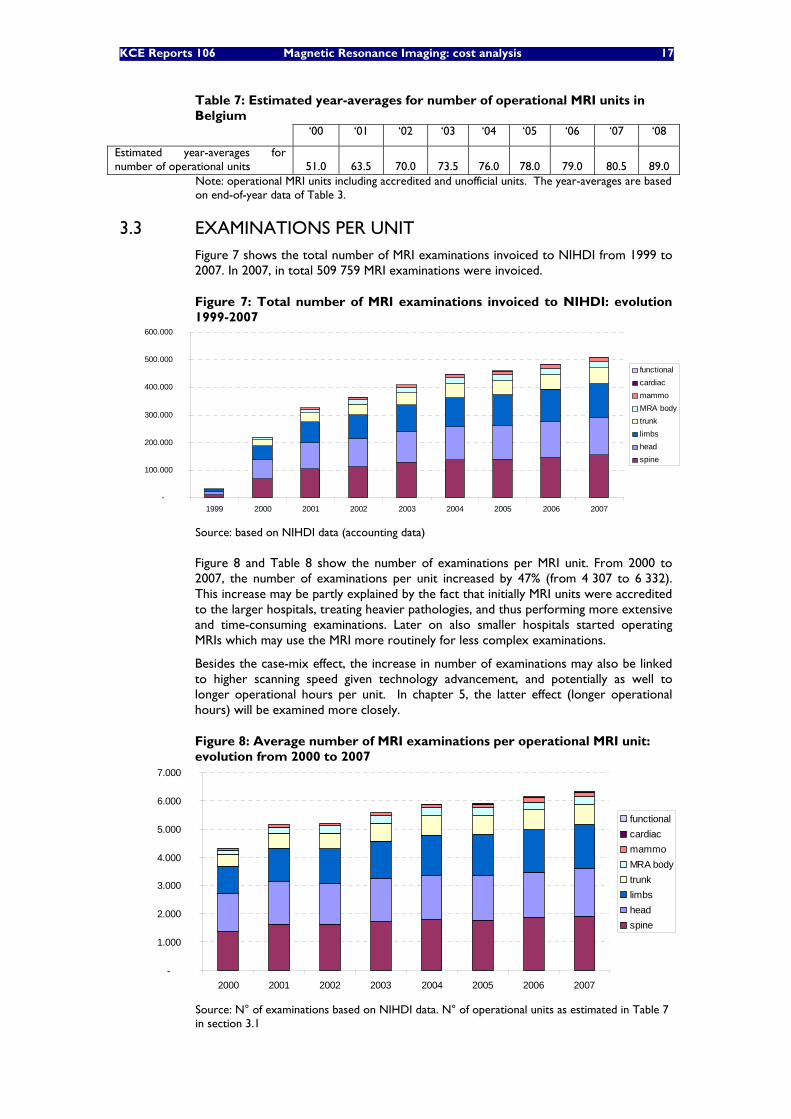
KCE Reports 106 Magnetic Resonance Imaging: cost analysis 17
Table 7: Estimated year-averages for number of operational MRI units in Belgium
‘00 ‘01 ‘02 ‘03 ‘04 ‘05 ‘06 ‘07 ‘08
Estimated year-averages for number of operational units 51.0 63.5 70.0 73.5 76.0 78.0 79.0 80.5 89.0
Note: operational MRI units including accredited and unofficial units. The year-averages are based on end-of-year data of Table 3.
3.3 EXAMINATIONS PER UNIT Figure 7 shows the total number of MRI examinations invoiced to NIHDI from 1999 to 2007. In 2007, in total 509 759 MRI examinations were invoiced.
Figure 7: Total number of MRI examinations invoiced to NIHDI: evolution 1999-2007
-
100.000
200.000
300.000
400.000
500.000
600.000
1999 2000 2001 2002 2003 2004 2005 2006 2007
functionalcardiacmammoMRA bodytrunklimbs headspine
Source: based on NIHDI data (accounting data)
Figure 8 and Table 8 show the number of examinations per MRI unit. From 2000 to 2007, the number of examinations per unit increased by 47% (from 4 307 to 6 332). This increase may be partly explained by the fact that initially MRI units were accredited to the larger hospitals, treating heavier pathologies, and thus performing more extensive and time-consuming examinations. Later on also smaller hospitals started operating MRIs which may use the MRI more routinely for less complex examinations.
Besides the case-mix effect, the increase in number of examinations may also be linked to higher scanning speed given technology advancement, and potentially as well to longer operational hours per unit. In chapter 5, the latter effect (longer operational hours) will be examined more closely.
Figure 8: Average number of MRI examinations per operational MRI unit: evolution from 2000 to 2007
-
1.000
2.000
3.000
4.000
5.000
6.000
7.000
2000 2001 2002 2003 2004 2005 2006 2007
functionalcardiacmammoMRA bodytrunklimbs headspine
Source: N° of examinations based on NIHDI data. N° of operational units as estimated in Table 7 in section 3.1
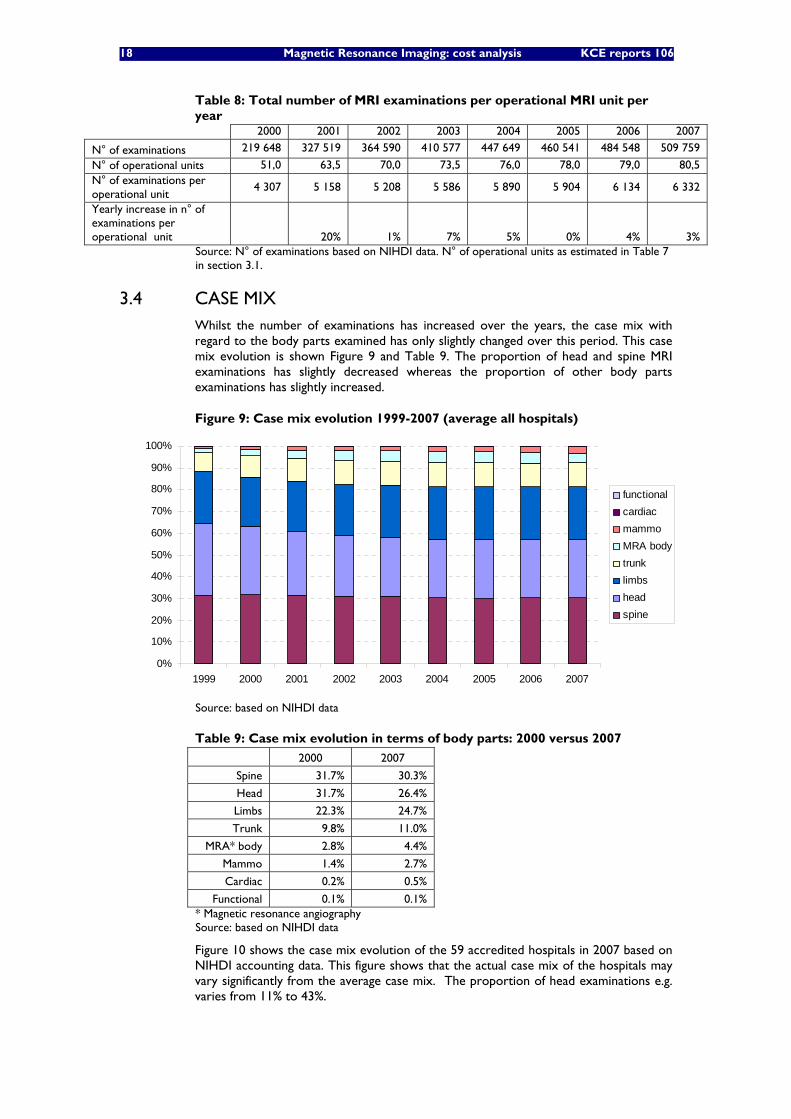
18 Magnetic Resonance Imaging: cost analysis KCE reports 106
Table 8: Total number of MRI examinations per operational MRI unit per year
2000 2001 2002 2003 2004 2005 2006 2007
N° of examinations 219 648 327 519 364 590 410 577 447 649 460 541 484 548 509 759
N° of operational units 51,0 63,5 70,0 73,5 76,0 78,0 79,0 80,5 N° of examinations per operational unit
4 307 5 158 5 208 5 586 5 890 5 904 6 134 6 332
Yearly increase in n° of examinations per operational unit
20% 1% 7% 5% 0% 4% 3%
Source: N° of examinations based on NIHDI data. N° of operational units as estimated in Table 7 in section 3.1.
3.4 CASE MIX Whilst the number of examinations has increased over the years, the case mix with regard to the body parts examined has only slightly changed over this period. This case mix evolution is shown Figure 9 and Table 9. The proportion of head and spine MRI examinations has slightly decreased whereas the proportion of other body parts examinations has slightly increased.
Figure 9: Case mix evolution 1999-2007 (average all hospitals)
0%
10%
20%
30%
40%
50%
60%
70%
80%
90%
100%
1999 2000 2001 2002 2003 2004 2005 2006 2007
functionalcardiacmammoMRA bodytrunklimbs headspine
Source: based on NIHDI data
Table 9: Case mix evolution in terms of body parts: 2000 versus 2007
2000 2007
Spine 31.7% 30.3%
Head 31.7% 26.4%
Limbs 22.3% 24.7%
Trunk 9.8% 11.0%
MRA* body 2.8% 4.4%
Mammo 1.4% 2.7%
Cardiac 0.2% 0.5%
Functional 0.1% 0.1% * Magnetic resonance angiography Source: based on NIHDI data
Figure 10 shows the case mix evolution of the 59 accredited hospitals in 2007 based on NIHDI accounting data. This figure shows that the actual case mix of the hospitals may vary significantly from the average case mix. The proportion of head examinations e.g. varies from 11% to 43%.
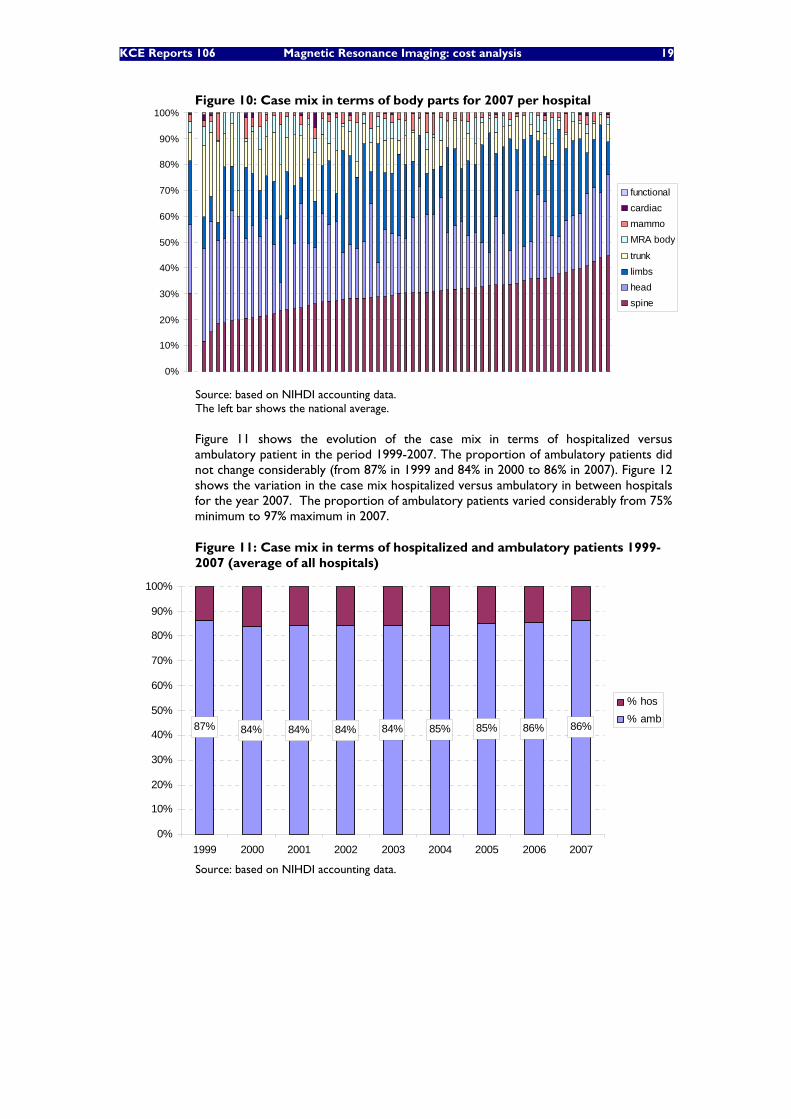
KCE Reports 106 Magnetic Resonance Imaging: cost analysis 19
Figure 10: Case mix in terms of body parts for 2007 per hospital
0%
10%
20%
30%
40%
50%
60%
70%
80%
90%
100%
functionalcardiacmammoMRA body
trunklimbsheadspine
Source: based on NIHDI accounting data. The left bar shows the national average.
Figure 11 shows the evolution of the case mix in terms of hospitalized versus ambulatory patient in the period 1999-2007. The proportion of ambulatory patients did not change considerably (from 87% in 1999 and 84% in 2000 to 86% in 2007). Figure 12 shows the variation in the case mix hospitalized versus ambulatory in between hospitals for the year 2007. The proportion of ambulatory patients varied considerably from 75% minimum to 97% maximum in 2007.
Figure 11: Case mix in terms of hospitalized and ambulatory patients 1999-2007 (average of all hospitals)
87% 84% 84% 84% 84% 85% 85% 86% 86%
0%
10%
20%
30%
40%
50%
60%
70%
80%
90%
100%
1999 2000 2001 2002 2003 2004 2005 2006 2007
% hos% amb
Source: based on NIHDI accounting data.
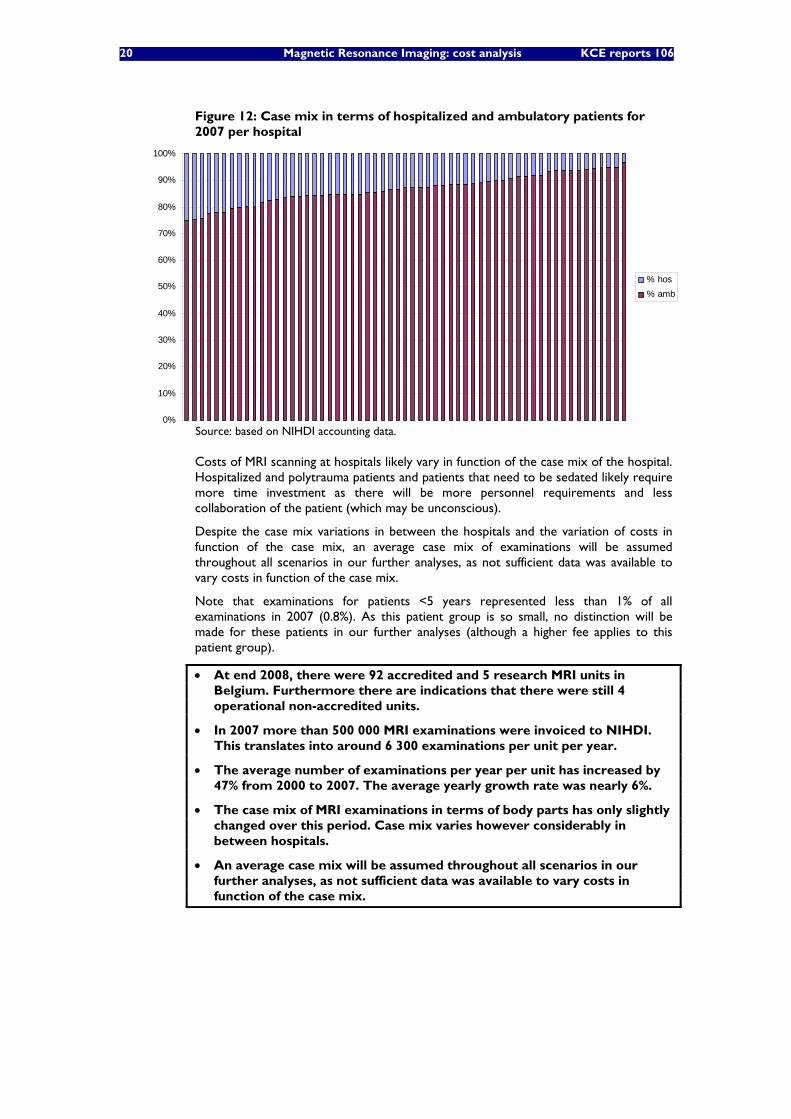
20 Magnetic Resonance Imaging: cost analysis KCE reports 106
Figure 12: Case mix in terms of hospitalized and ambulatory patients for 2007 per hospital
0%
10%
20%
30%
40%
50%
60%
70%
80%
90%
100%
% hos% amb
Source: based on NIHDI accounting data.
Costs of MRI scanning at hospitals likely vary in function of the case mix of the hospital. Hospitalized and polytrauma patients and patients that need to be sedated likely require more time investment as there will be more personnel requirements and less collaboration of the patient (which may be unconscious).
Despite the case mix variations in between the hospitals and the variation of costs in function of the case mix, an average case mix of examinations will be assumed throughout all scenarios in our further analyses, as not sufficient data was available to vary costs in function of the case mix.
Note that examinations for patients <5 years represented less than 1% of all examinations in 2007 (0.8%). As this patient group is so small, no distinction will be made for these patients in our further analyses (although a higher fee applies to this patient group).
• At end 2008, there were 92 accredited and 5 research MRI units in Belgium. Furthermore there are indications that there were still 4 operational non-accredited units.
• In 2007 more than 500 000 MRI examinations were invoiced to NIHDI. This translates into around 6 300 examinations per unit per year.
• The average number of examinations per year per unit has increased by 47% from 2000 to 2007. The average yearly growth rate was nearly 6%.
• The case mix of MRI examinations in terms of body parts has only slightly changed over this period. Case mix varies however considerably in between hospitals.
• An average case mix will be assumed throughout all scenarios in our further analyses, as not sufficient data was available to vary costs in function of the case mix.
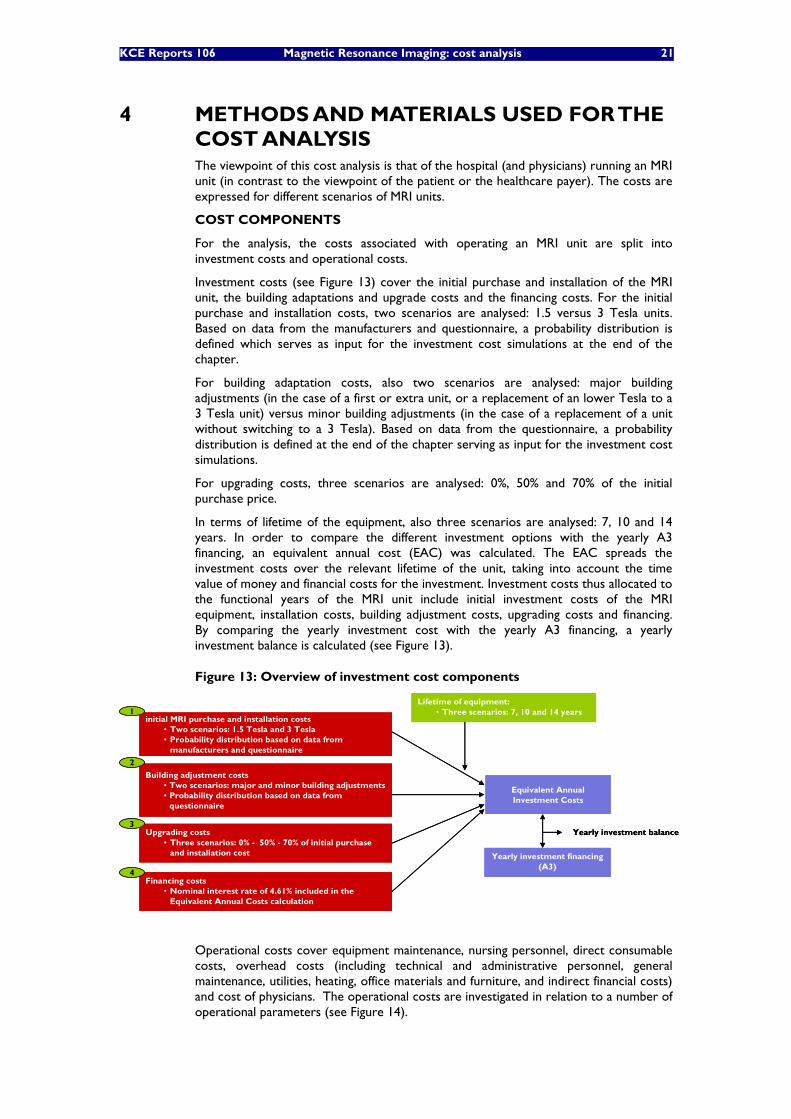
KCE Reports 106 Magnetic Resonance Imaging: cost analysis 21
4 METHODS AND MATERIALS USED FOR THE COST ANALYSIS The viewpoint of this cost analysis is that of the hospital (and physicians) running an MRI unit (in contrast to the viewpoint of the patient or the healthcare payer). The costs are expressed for different scenarios of MRI units.
COST COMPONENTS
For the analysis, the costs associated with operating an MRI unit are split into investment costs and operational costs.
Investment costs (see Figure 13) cover the initial purchase and installation of the MRI unit, the building adaptations and upgrade costs and the financing costs. For the initial purchase and installation costs, two scenarios are analysed: 1.5 versus 3 Tesla units. Based on data from the manufacturers and questionnaire, a probability distribution is defined which serves as input for the investment cost simulations at the end of the chapter.
For building adaptation costs, also two scenarios are analysed: major building adjustments (in the case of a first or extra unit, or a replacement of an lower Tesla to a 3 Tesla unit) versus minor building adjustments (in the case of a replacement of a unit without switching to a 3 Tesla). Based on data from the questionnaire, a probability distribution is defined at the end of the chapter serving as input for the investment cost simulations.
For upgrading costs, three scenarios are analysed: 0%, 50% and 70% of the initial purchase price.
In terms of lifetime of the equipment, also three scenarios are analysed: 7, 10 and 14 years. In order to compare the different investment options with the yearly A3 financing, an equivalent annual cost (EAC) was calculated. The EAC spreads the investment costs over the relevant lifetime of the unit, taking into account the time value of money and financial costs for the investment. Investment costs thus allocated to the functional years of the MRI unit include initial investment costs of the MRI equipment, installation costs, building adjustment costs, upgrading costs and financing. By comparing the yearly investment cost with the yearly A3 financing, a yearly investment balance is calculated (see Figure 13).
Figure 13: Overview of investment cost components
initial MRI purchase and installation costs• Two scenarios: 1.5 Tesla and 3 Tesla• Probability distribution based on data from
manufacturers and questionnaire
Building adjustment costs• Two scenarios: major and minor building adjustments• Probability distribution based on data from
questionnaire
Upgrading costs• Three scenarios: 0% - 50% - 70% of initial purchase
and installation cost
Lifetime of equipment:• Three scenarios: 7, 10 and 14 years
Equivalent Annual Investment Costs
1
2
3
Financing costs• Nominal interest rate of 4.61% included in the
Equivalent Annual Costs calculation
4
Yearly investment financing (A3)
Yearly investment balance
Operational costs cover equipment maintenance, nursing personnel, direct consumable costs, overhead costs (including technical and administrative personnel, general maintenance, utilities, heating, office materials and furniture, and indirect financial costs) and cost of physicians. The operational costs are investigated in relation to a number of operational parameters (see Figure 14).
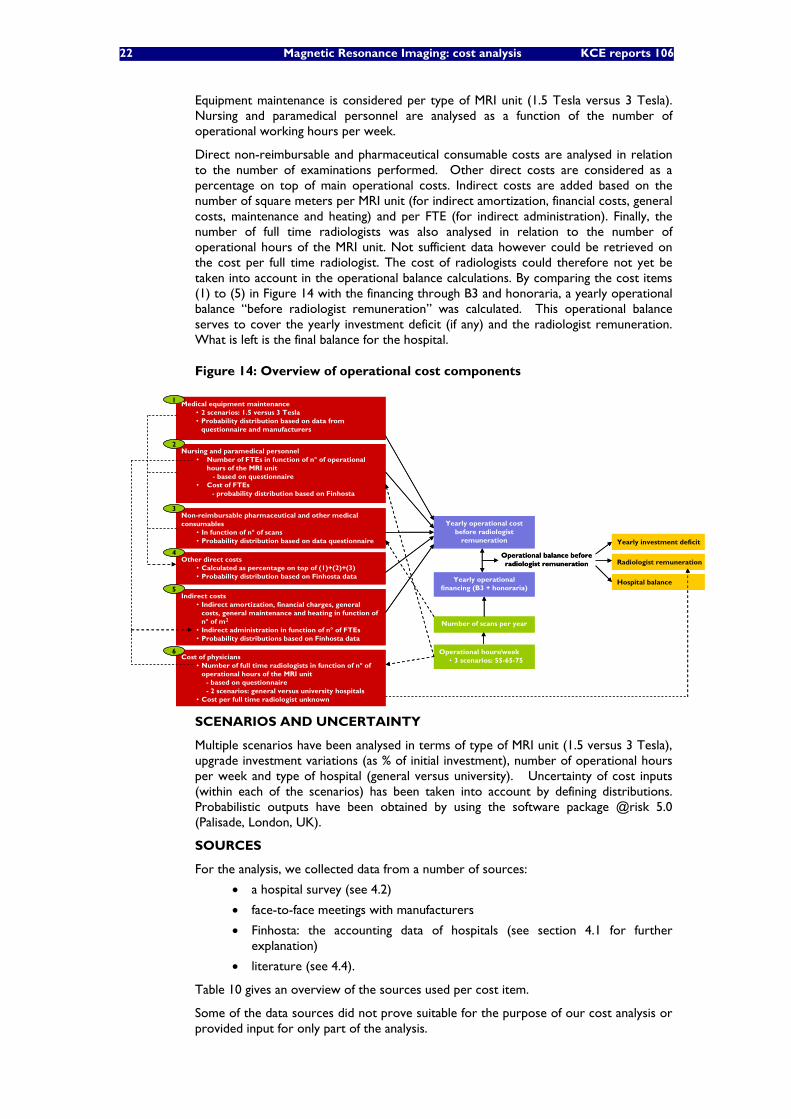
22 Magnetic Resonance Imaging: cost analysis KCE reports 106
Equipment maintenance is considered per type of MRI unit (1.5 Tesla versus 3 Tesla). Nursing and paramedical personnel are analysed as a function of the number of operational working hours per week.
Direct non-reimbursable and pharmaceutical consumable costs are analysed in relation to the number of examinations performed. Other direct costs are considered as a percentage on top of main operational costs. Indirect costs are added based on the number of square meters per MRI unit (for indirect amortization, financial costs, general costs, maintenance and heating) and per FTE (for indirect administration). Finally, the number of full time radiologists was also analysed in relation to the number of operational hours of the MRI unit. Not sufficient data however could be retrieved on the cost per full time radiologist. The cost of radiologists could therefore not yet be taken into account in the operational balance calculations. By comparing the cost items (1) to (5) in Figure 14 with the financing through B3 and honoraria, a yearly operational balance “before radiologist remuneration” was calculated. This operational balance serves to cover the yearly investment deficit (if any) and the radiologist remuneration. What is left is the final balance for the hospital.
Figure 14: Overview of operational cost components
Medical equipment maintenance• 2 scenarios: 1.5 versus 3 Tesla• Probability distribution based on data from
questionnaire and manufacturers
Nursing and paramedical personnel• Number of FTEs in function of n° of operational
hours of the MRI unit- based on questionnaire
• Cost of FTEs- probability distribution based on Finhosta
Non-reimbursable pharmaceutical and other medical consumables
• In function of n° of scans• Probability distribution based on data questionnaire
Yearly operational costbefore radiologist
remuneration
Other direct costs• Calculated as percentage on top of (1)+(2)+(3)• Probability distribution based on Finhosta data
1
2
3
4
Indirect costs• Indirect amortization, financial charges, general
costs, general maintenance and heating in function ofn° of m2
• Indirect administration in function of n° of FTEs• Probability distributions based on Finhosta data
5
Cost of physicians• Number of full time radiologists in function of n° of
operational hours of the MRI unit- based on questionnaire - 2 scenarios: general versus university hospitals
• Cost per full time radiologist unknown
6
Yearly investment deficit
Radiologist remuneration
Hospital balance
Operational hours/week • 3 scenarios: 55-65-75
Number of scans per year
Yearly operational financing (B3 + honoraria)
Operational balance beforeradiologist remuneration
SCENARIOS AND UNCERTAINTY
Multiple scenarios have been analysed in terms of type of MRI unit (1.5 versus 3 Tesla), upgrade investment variations (as % of initial investment), number of operational hours per week and type of hospital (general versus university). Uncertainty of cost inputs (within each of the scenarios) has been taken into account by defining distributions. Probabilistic outputs have been obtained by using the software package @risk 5.0 (Palisade, London, UK).
SOURCES
For the analysis, we collected data from a number of sources:
• a hospital survey (see 4.2)
• face-to-face meetings with manufacturers
• Finhosta: the accounting data of hospitals (see section 4.1 for further explanation)
• literature (see 4.4).
Table 10 gives an overview of the sources used per cost item.
Some of the data sources did not prove suitable for the purpose of our cost analysis or provided input for only part of the analysis.
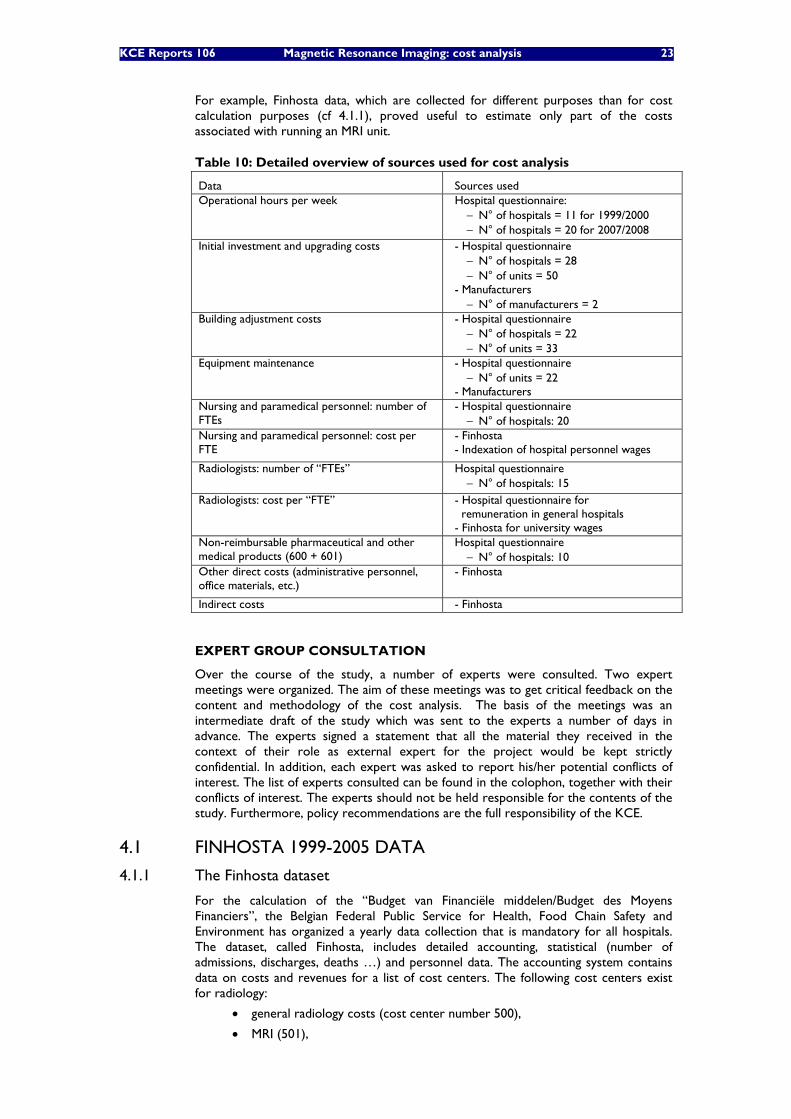
KCE Reports 106 Magnetic Resonance Imaging: cost analysis 23
For example, Finhosta data, which are collected for different purposes than for cost calculation purposes (cf 4.1.1), proved useful to estimate only part of the costs associated with running an MRI unit.
Table 10: Detailed overview of sources used for cost analysis
Data Sources used Operational hours per week Hospital questionnaire:
− N° of hospitals = 11 for 1999/2000 − N° of hospitals = 20 for 2007/2008
Initial investment and upgrading costs - Hospital questionnaire − N° of hospitals = 28 − N° of units = 50
- Manufacturers − N° of manufacturers = 2
Building adjustment costs - Hospital questionnaire − N° of hospitals = 22 − N° of units = 33
Equipment maintenance - Hospital questionnaire − N° of units = 22
- Manufacturers Nursing and paramedical personnel: number of FTEs
- Hospital questionnaire − N° of hospitals: 20
Nursing and paramedical personnel: cost per FTE
- Finhosta - Indexation of hospital personnel wages
Radiologists: number of “FTEs” Hospital questionnaire − N° of hospitals: 15
Radiologists: cost per “FTE” - Hospital questionnaire for remuneration in general hospitals - Finhosta for university wages
Non-reimbursable pharmaceutical and other medical products (600 + 601)
Hospital questionnaire − N° of hospitals: 10
Other direct costs (administrative personnel, office materials, etc.)
- Finhosta
Indirect costs - Finhosta
EXPERT GROUP CONSULTATION
Over the course of the study, a number of experts were consulted. Two expert meetings were organized. The aim of these meetings was to get critical feedback on the content and methodology of the cost analysis. The basis of the meetings was an intermediate draft of the study which was sent to the experts a number of days in advance. The experts signed a statement that all the material they received in the context of their role as external expert for the project would be kept strictly confidential. In addition, each expert was asked to report his/her potential conflicts of interest. The list of experts consulted can be found in the colophon, together with their conflicts of interest. The experts should not be held responsible for the contents of the study. Furthermore, policy recommendations are the full responsibility of the KCE.
4.1 FINHOSTA 1999-2005 DATA
4.1.1 The Finhosta dataset
For the calculation of the “Budget van Financiële middelen/Budget des Moyens Financiers”, the Belgian Federal Public Service for Health, Food Chain Safety and Environment has organized a yearly data collection that is mandatory for all hospitals. The dataset, called Finhosta, includes detailed accounting, statistical (number of admissions, discharges, deaths …) and personnel data. The accounting system contains data on costs and revenues for a list of cost centers. The following cost centers exist for radiology:
• general radiology costs (cost center number 500),
• MRI (501),
24 Magnetic Resonance Imaging: cost analysis KCE reports 106
• scanner (502)e,
• other radiology services (503 to 509).
4.1.2 Limitations of Finhosta
In many hospitals, the MRI scanner is fully integrated in the Medical Imaging department. As a consequence, the accurate allocation of the costs of the department to the MRI scanner is difficult to achieve and rarely done. Therefore, the Finhosta data booked on cost centre MRI (501) are not a realistic representation of the real cost to the hospital of running the MRI unit. Generally, only a limited number of costs are allocated directly (such as the MRI maintenance invoice) but most other costs are allocated to the general radiology cost center (500). In appendix an overview is given of how the hospitals allocate the radiology costs to the 4 cost centers (500/501/502/503-9).
It is furthermore unclear for which hospitals and for which cost items the Finhosta data may be reliable. Therefore, this data source could not be directly used for the cost calculation as it could lead to a considerable underestimation of the costs for the MRI service.
Nevertheless, reliable data could be obtained on cost per FTE for the full radiology cost center to calculate the cost of nursing personnel for running an MRI unit. This information had to be combined with information on the number of FTE nursing personnel required per MRI unit. Also an estimate could be calculated for “other direct costs” as percentage on top of “main direct costs” for the full radiology cost center as well as for indirect costs per m² and FTE.
The Finhosta dataset was available for the period 2000-2005.
• Finhosta data as such are insufficient to calculate the full cost of operating an MRI unit, because most costs are entered in the general radiology cost center and are not allocated specifically to the different imaging activities of the radiology department. Therefore, Finhosta data should be handled with caution when used for cost analysis. It is unclear for which hospitals and for which cost items the Finhosta data may be a reliable source for costs.
• In this study, Finhosta data was used for estimating the cost of nursing personnel per FTE and to calculate an estimate of other direct and indirect costs.
4.2 HOSPITAL QUESTIONNAIRE In search of MRI cost data, an initial questionnaire was sent (at the end of September/start October) by e-mail to the financial managers of the 56 hospitals that were listed to have an MRI scanner in March 2007, based on data from the SPF. If the financial manager could not be identified, the e-mail was sent either to the general manager or the general e-mail address of the hospital. The list of contacted hospitals and the questionnaire can be found in appendix.
In addition to this general questionnaire, a number of hospitals that recently bought an MRI unit, were (re)contacted with specific questions related to their latest purchase.
As the response on the initial questionnaire was rather limited (only sixteen hospitals responded), two modified questionnaires were relaunched (at the end of December) via e-mail, one directed to the head of the radiology department and one to the general and financial managers of all those hospitals that had not responded yet to the initial questionnairef. Both questionnaires can be found in appendix.
e No further explanation is available in the Finhosta manual on which type of scanner, but supposedly it
concerns the CT scanner. f In January, all non responding persons were recontacted to check whether their e-mail address was
correct. For one hospital, e-mail addresses appeared not correct. The questionnaire was resent to the correct e-mail addresses in January. Furthermore, one head of radiology had not received the
KCE Reports 106 Magnetic Resonance Imaging: cost analysis 25
Eventually, investment cost data was obtained from 28 hospitals. Data on operational parameters was obtained from 20 hospitals. For more detailed statistics on response rates on the different items, see Table 10 at the beginning of this chapter.
As most hospitals do not have a complete cost allocation to the MRI cost center, only a limited set of accounting data was used as input for this analysis:
• Even though for some hospitals depreciation costs were directly allocated to the MRI cost center, we did not base our investment cost analysis on depreciation data as they do not spread the costs over the actual lifetime of the equipment. Instead actual investment cost data was used.
• For the cost of personnel and physicians, cost data of most responding hospitals appeared not to be reliable. Therefore, the cost of personnel was calculated through multiplying the number of FTEs (as responded by the radiologists or financial/general direction) with an average cost per FTE (as based on Finhosta data) instead.
• For most responding hospitals, the cost account 6135 appeared to be a reliable source for the cost of the maintenance contract.
• The cost of non-reimbursable pharmaceutical and other medical products appeared reliable for a limited number of hospitals in the cost accounts 600 and 601 (whether the data were reliable or not was checked with the hospitals). When the accounts also included the cost of reimbursable products (mainly contrast fluids), these costs were excluded as they are reimbursed by NIHDI separately.
• For other direct and indirect costs, most hospital MRI-accounts did not provide a full picture. Therefore MRI-hospital accounts were not used in this analysis. Instead the analysis was based on the direct costs and indirect costs of the full radiology department as reported in Finhosta.
• Through the hospital questionnaire, investment cost data was obtained from 28 hospitals. Data on operational parameters was obtained from 20 hospitals.
• As most hospitals do not have a complete cost allocation to the MRI cost center, only a limited set of accounting data was used as input for this analysis.
4.3 MANUFACTURERS The following three main manufacturers were contacted:
• Philips
• Siemens
• GE Medical
Questions posed related to the technical evolution in MRI since 1999, evolutions in the scanning technology and scanning speed, the investment and maintenance costs and the lifetime of the equipment. Two of the mentioned manufacturers provided usable information.
4.4 LITERATURE As many cost items are not easily transferable from one country to another, a quick literature search was done. Only 2 cost analyses on MRI were identified, but as both studies are rather outdated, they did not contain material that could be of use to this study. The first study concerns a cost analysis of MRI at St. Joseph’s Health Centre of London, Ontario, in 19876. The other study describes the changes in MRI costs from 1989 to 1996 of one NHS hospital in the UK. 7
questionnaire. As it concerned the head of radiology of a hospital in association with another hospital, which had received the questionnaire, this person was not contacted anymore.
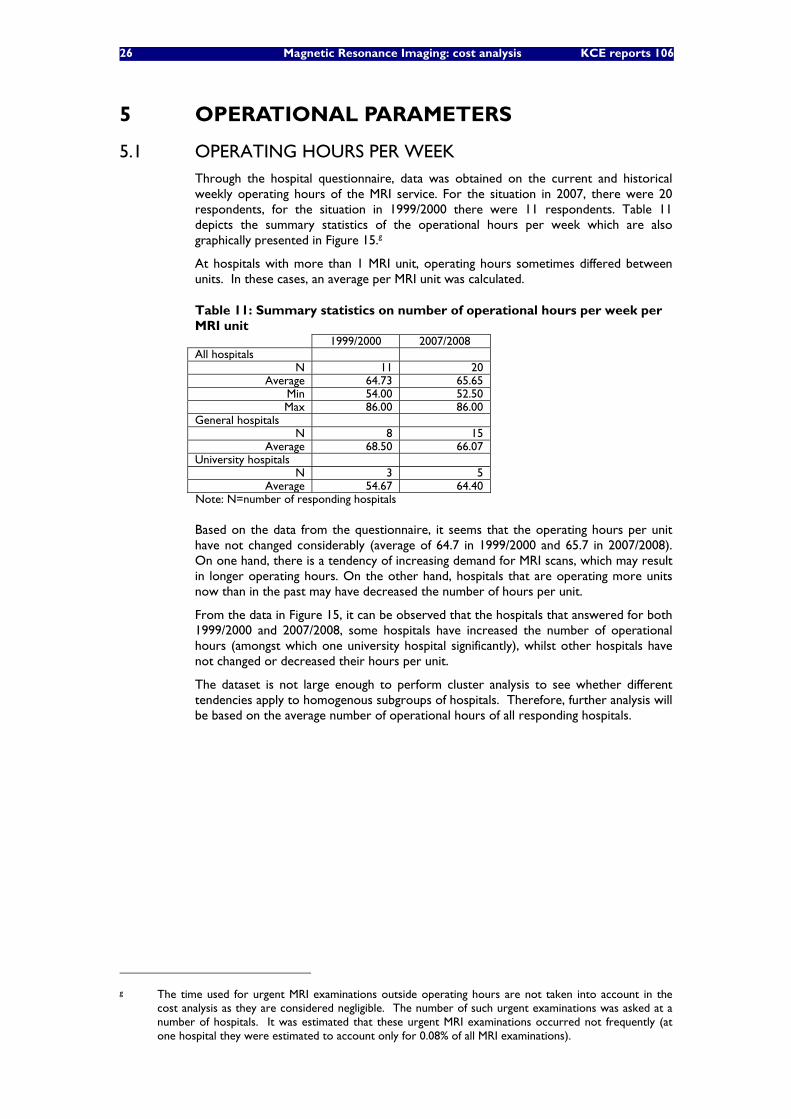
26 Magnetic Resonance Imaging: cost analysis KCE reports 106
5 OPERATIONAL PARAMETERS
5.1 OPERATING HOURS PER WEEK Through the hospital questionnaire, data was obtained on the current and historical weekly operating hours of the MRI service. For the situation in 2007, there were 20 respondents, for the situation in 1999/2000 there were 11 respondents. Table 11 depicts the summary statistics of the operational hours per week which are also graphically presented in Figure 15.g
At hospitals with more than 1 MRI unit, operating hours sometimes differed between units. In these cases, an average per MRI unit was calculated.
Table 11: Summary statistics on number of operational hours per week per MRI unit 1999/2000 2007/2008 All hospitals
N 11 20 Average 64.73 65.65
Min 54.00 52.50 Max 86.00 86.00
General hospitals N 8 15
Average 68.50 66.07 University hospitals
N 3 5 Average 54.67 64.40
Note: N=number of responding hospitals
Based on the data from the questionnaire, it seems that the operating hours per unit have not changed considerably (average of 64.7 in 1999/2000 and 65.7 in 2007/2008). On one hand, there is a tendency of increasing demand for MRI scans, which may result in longer operating hours. On the other hand, hospitals that are operating more units now than in the past may have decreased the number of hours per unit.
From the data in Figure 15, it can be observed that the hospitals that answered for both 1999/2000 and 2007/2008, some hospitals have increased the number of operational hours (amongst which one university hospital significantly), whilst other hospitals have not changed or decreased their hours per unit.
The dataset is not large enough to perform cluster analysis to see whether different tendencies apply to homogenous subgroups of hospitals. Therefore, further analysis will be based on the average number of operational hours of all responding hospitals.
g The time used for urgent MRI examinations outside operating hours are not taken into account in the
cost analysis as they are considered negligible. The number of such urgent examinations was asked at a number of hospitals. It was estimated that these urgent MRI examinations occurred not frequently (at one hospital they were estimated to account only for 0.08% of all MRI examinations).
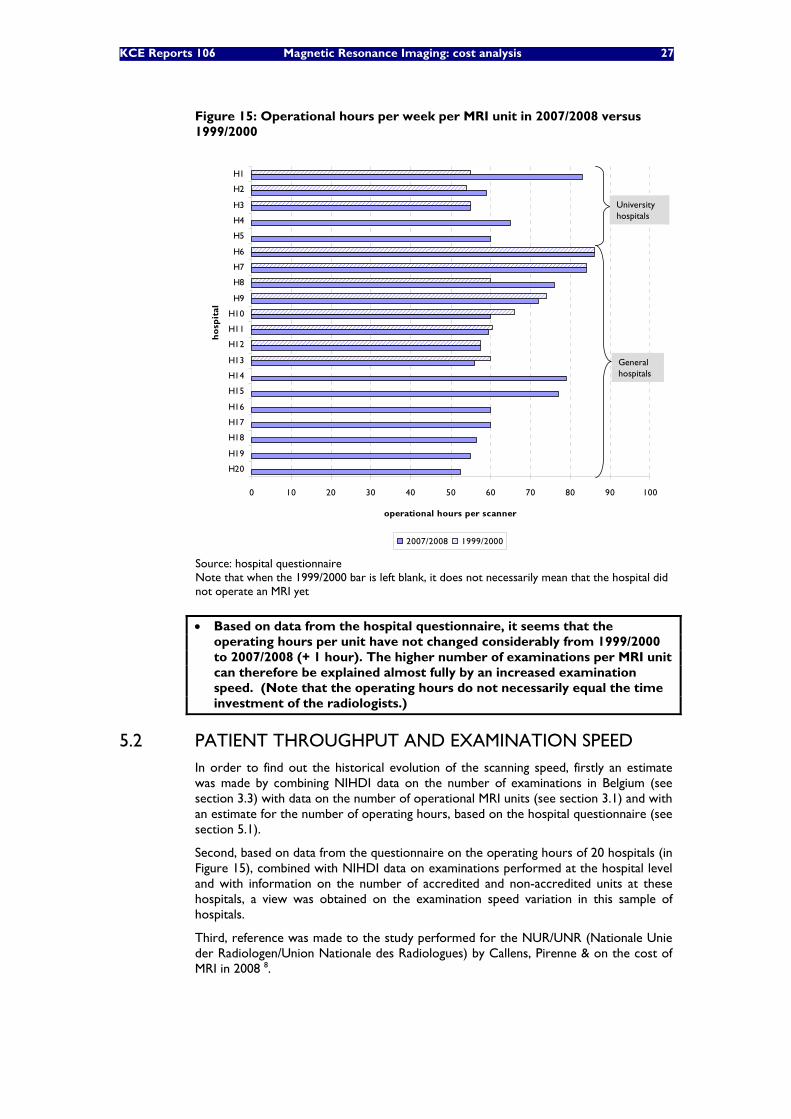
KCE Reports 106 Magnetic Resonance Imaging: cost analysis 27
Figure 15: Operational hours per week per MRI unit in 2007/2008 versus 1999/2000
0 10 20 30 40 50 60 70 80 90 100
H20
H19
H18
H17
H16
H15
H14
H13
H12
H11
H10
H9
H8
H7
H6
H5
H4
H3
H2
H1
ho
spit
al
operational hours per scanner
2007/2008 1999/2000
Universityhospitals
Generalhospitals
0 10 20 30 40 50 60 70 80 90 100
H20
H19
H18
H17
H16
H15
H14
H13
H12
H11
H10
H9
H8
H7
H6
H5
H4
H3
H2
H1
ho
spit
al
operational hours per scanner
2007/2008 1999/2000
Universityhospitals
Generalhospitals
Source: hospital questionnaire Note that when the 1999/2000 bar is left blank, it does not necessarily mean that the hospital did not operate an MRI yet
• Based on data from the hospital questionnaire, it seems that the operating hours per unit have not changed considerably from 1999/2000 to 2007/2008 (+ 1 hour). The higher number of examinations per MRI unit can therefore be explained almost fully by an increased examination speed. (Note that the operating hours do not necessarily equal the time investment of the radiologists.)
5.2 PATIENT THROUGHPUT AND EXAMINATION SPEED In order to find out the historical evolution of the scanning speed, firstly an estimate was made by combining NIHDI data on the number of examinations in Belgium (see section 3.3) with data on the number of operational MRI units (see section 3.1) and with an estimate for the number of operating hours, based on the hospital questionnaire (see section 5.1).
Second, based on data from the questionnaire on the operating hours of 20 hospitals (in Figure 15), combined with NIHDI data on examinations performed at the hospital level and with information on the number of accredited and non-accredited units at these hospitals, a view was obtained on the examination speed variation in this sample of hospitals.
Third, reference was made to the study performed for the NUR/UNR (Nationale Unie der Radiologen/Union Nationale des Radiologues) by Callens, Pirenne & on the cost of MRI in 2008 8.
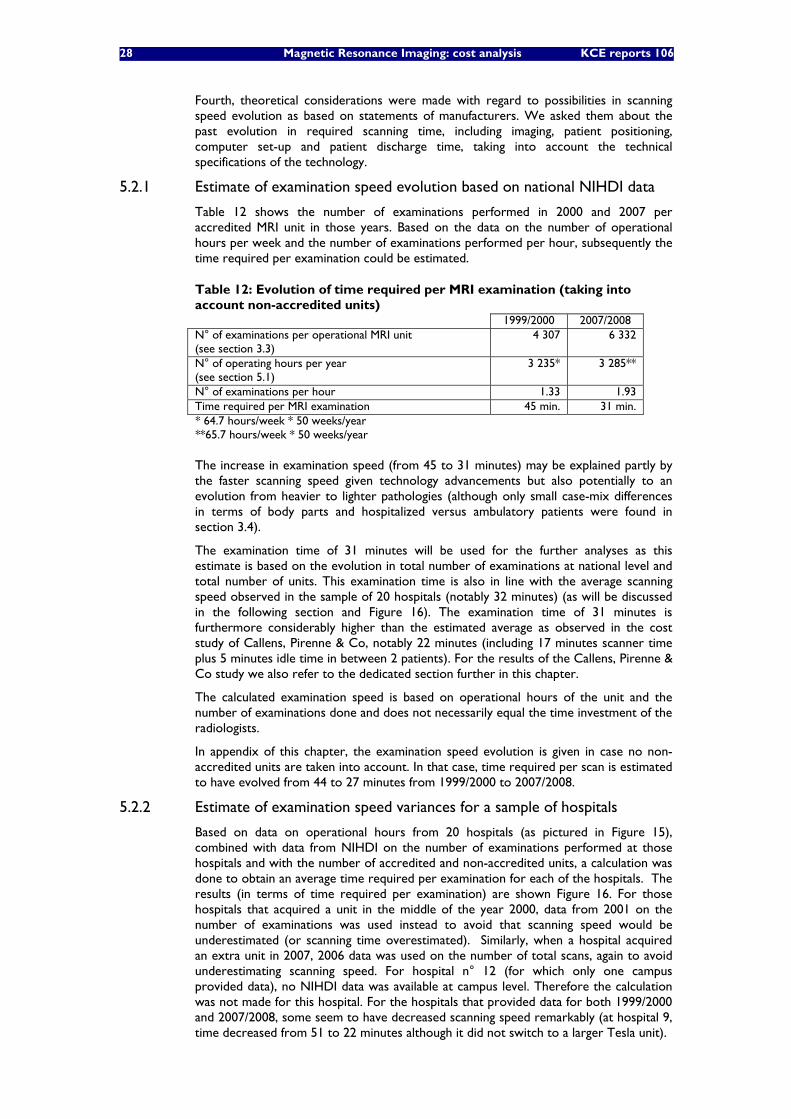
28 Magnetic Resonance Imaging: cost analysis KCE reports 106
Fourth, theoretical considerations were made with regard to possibilities in scanning speed evolution as based on statements of manufacturers. We asked them about the past evolution in required scanning time, including imaging, patient positioning, computer set-up and patient discharge time, taking into account the technical specifications of the technology.
5.2.1 Estimate of examination speed evolution based on national NIHDI data
Table 12 shows the number of examinations performed in 2000 and 2007 per accredited MRI unit in those years. Based on the data on the number of operational hours per week and the number of examinations performed per hour, subsequently the time required per examination could be estimated.
Table 12: Evolution of time required per MRI examination (taking into account non-accredited units) 1999/2000 2007/2008 N° of examinations per operational MRI unit (see section 3.3)
4 307
6 332
N° of operating hours per year (see section 5.1)
3 235* 3 285**
N° of examinations per hour 1.33 1.93 Time required per MRI examination 45 min. 31 min. * 64.7 hours/week * 50 weeks/year **65.7 hours/week * 50 weeks/year
The increase in examination speed (from 45 to 31 minutes) may be explained partly by the faster scanning speed given technology advancements but also potentially to an evolution from heavier to lighter pathologies (although only small case-mix differences in terms of body parts and hospitalized versus ambulatory patients were found in section 3.4).
The examination time of 31 minutes will be used for the further analyses as this estimate is based on the evolution in total number of examinations at national level and total number of units. This examination time is also in line with the average scanning speed observed in the sample of 20 hospitals (notably 32 minutes) (as will be discussed in the following section and Figure 16). The examination time of 31 minutes is furthermore considerably higher than the estimated average as observed in the cost study of Callens, Pirenne & Co, notably 22 minutes (including 17 minutes scanner time plus 5 minutes idle time in between 2 patients). For the results of the Callens, Pirenne & Co study we also refer to the dedicated section further in this chapter.
The calculated examination speed is based on operational hours of the unit and the number of examinations done and does not necessarily equal the time investment of the radiologists.
In appendix of this chapter, the examination speed evolution is given in case no non-accredited units are taken into account. In that case, time required per scan is estimated to have evolved from 44 to 27 minutes from 1999/2000 to 2007/2008.
5.2.2 Estimate of examination speed variances for a sample of hospitals
Based on data on operational hours from 20 hospitals (as pictured in Figure 15), combined with data from NIHDI on the number of examinations performed at those hospitals and with the number of accredited and non-accredited units, a calculation was done to obtain an average time required per examination for each of the hospitals. The results (in terms of time required per examination) are shown Figure 16. For those hospitals that acquired a unit in the middle of the year 2000, data from 2001 on the number of examinations was used instead to avoid that scanning speed would be underestimated (or scanning time overestimated). Similarly, when a hospital acquired an extra unit in 2007, 2006 data was used on the number of total scans, again to avoid underestimating scanning speed. For hospital n° 12 (for which only one campus provided data), no NIHDI data was available at campus level. Therefore the calculation was not made for this hospital. For the hospitals that provided data for both 1999/2000 and 2007/2008, some seem to have decreased scanning speed remarkably (at hospital 9, time decreased from 51 to 22 minutes although it did not switch to a larger Tesla unit).
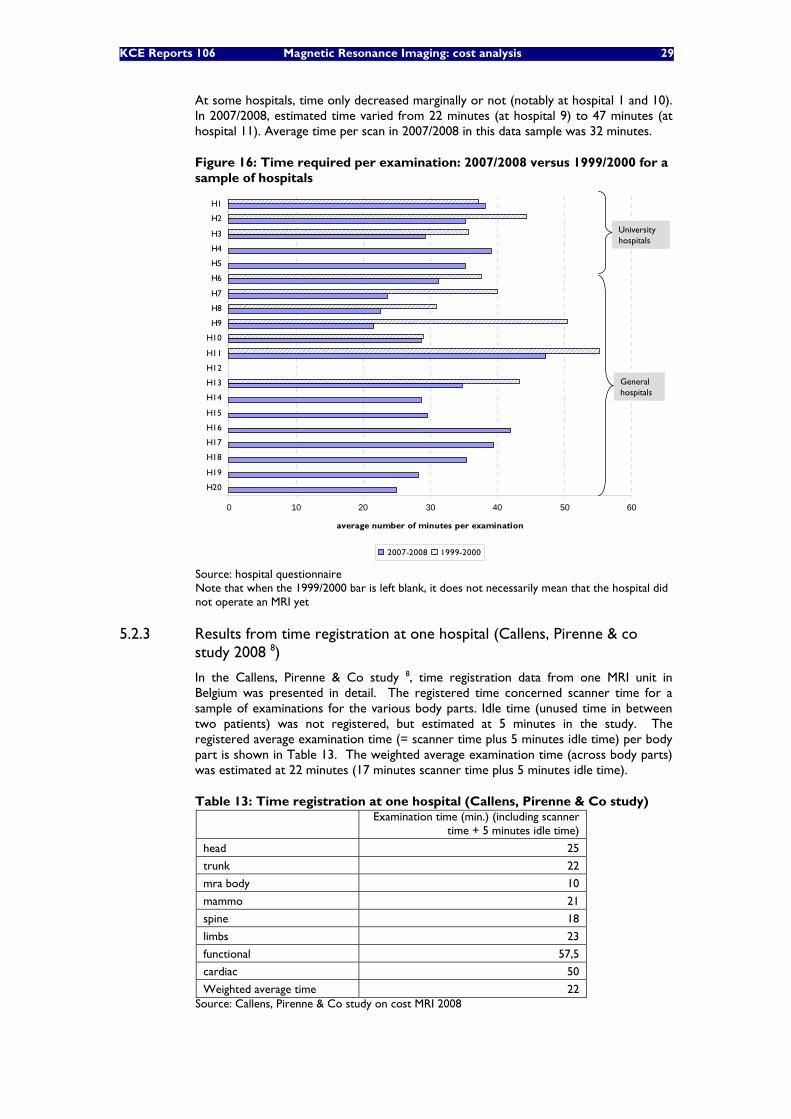
KCE Reports 106 Magnetic Resonance Imaging: cost analysis 29
At some hospitals, time only decreased marginally or not (notably at hospital 1 and 10). In 2007/2008, estimated time varied from 22 minutes (at hospital 9) to 47 minutes (at hospital 11). Average time per scan in 2007/2008 in this data sample was 32 minutes.
Figure 16: Time required per examination: 2007/2008 versus 1999/2000 for a sample of hospitals
0 10 20 30 40 50 60
H20
H19
H18
H17
H16
H15
H14
H13
H12
H11
H10
H9
H8
H7
H6
H5
H4
H3
H2
H1
average number of minutes per examination
2007-2008 1999-2000
Universityhospitals
Generalhospitals
0 10 20 30 40 50 60
H20
H19
H18
H17
H16
H15
H14
H13
H12
H11
H10
H9
H8
H7
H6
H5
H4
H3
H2
H1
average number of minutes per examination
2007-2008 1999-2000
Universityhospitals
Generalhospitals
Source: hospital questionnaire Note that when the 1999/2000 bar is left blank, it does not necessarily mean that the hospital did not operate an MRI yet
5.2.3 Results from time registration at one hospital (Callens, Pirenne & co study 2008 8)
In the Callens, Pirenne & Co study 8, time registration data from one MRI unit in Belgium was presented in detail. The registered time concerned scanner time for a sample of examinations for the various body parts. Idle time (unused time in between two patients) was not registered, but estimated at 5 minutes in the study. The registered average examination time (= scanner time plus 5 minutes idle time) per body part is shown in Table 13. The weighted average examination time (across body parts) was estimated at 22 minutes (17 minutes scanner time plus 5 minutes idle time).
Table 13: Time registration at one hospital (Callens, Pirenne & Co study)
Examination time (min.) (including scanner
time + 5 minutes idle time)
head 25
trunk 22
mra body 10
mammo 21
spine 18
limbs 23
functional 57,5
cardiac 50
Weighted average time 22 Source: Callens, Pirenne & Co study on cost MRI 2008
30 Magnetic Resonance Imaging: cost analysis KCE reports 106
5.2.4 Theoretical considerations on evolution in examination speed
The manufacturers agreed that there is a clear evolution towards a decrease in examination time given the improvements in software (pulse sequences) and hardware (better coils). However, given that it is up to the radiologists using the equipment to make a personal compromise between scanning time, signal-noise ratio and sharpness of the images, the manufacturers had no idea of the actual examination speed evolution. Besides the faster scanning time for 1.5 Tesla units, there is also the impact of the 3 Tesla units, which, on average, have a double scanning speed compared to a 1.5 Tesla assuming equal imaging quality. Again, to what extent the 3 Tesla units are used for improved imaging quality versus increased scanning speed, was not known by the manufacturers.
• From 1999/2000 to 2007/2008, average time required per examination, across body parts, is estimated to have decreased from around 45 to 30 minutes.
KCE Reports 106 Magnetic Resonance Imaging: cost analysis 31
6 INVESTMENT COSTS Investment costs cover the following items:
• initial purchase and installation of the MRI (section 6.1)
• building adaptations (section 6.2)
• upgrade costs (section 6.3)
• financing costs associated with these investments (section 6.4).
First, an overview is given of the data collected from the different sources for the different investment cost items. Afterwards, cost simulations are done combining all the investment cost items for different investment scenarios (section 6.5).
6.1 INITIAL MRI PURCHASE AND INSTALLATION COSTS Data was collected from hospitals and manufacturers. As the investment costs depend on the level of sophistication, a distinction was made in the price for a 1, a 1.5 and a 3 Tesla MRI with a focus on the 1,5 Tesla MRI which is the most frequently bought unit (see Table 6 in section 3.1). This distinction between number of Tesla however does not fully capture all investment differences as according to some experts of the expert group, a fully equipped 1.5 Tesla unit may be more expensive than a basic 3 Tesla unit.
6.1.1 Data from the Federal Public Service Health, Food chain safety and Environment
If a replacement or upgrade investment of at least 50% of the new value of the scanner takes place within 10 years after the purchase of the unit, the yearly financing continues for a new period of 7 years. To obtain the additional reimbursement, proves of the replacement or upgrade investments as well as of the initial purchase have to be submitted to the Federal Public Service (FPS). In principle data on initial investment and upgrade costs could therefore be obtained from the FPS. However, given that this upgrade rule was only introduced in 1999, and that the FPS is currently reviewing year 2002, no data on investment and upgrading costs was available yet at the time of this analysis. Hospital data for government inspection purposes until 2006 was available at the FPS, but the data after 2002 had not been processed yet and could therefore not be exploited.h
6.1.2 Hospital questionnaire data
Because no data on initial investment costs could be obtained from the FPS, we posed this question in the hospital survey. Initial investment costs include purchase of the MRI equipment and costs of installation of the equipment.
Figure 17 shows the data from 28 hospitals on 50 MRI units. The figure shows that most responding hospitals have a 1.5 Tesla MRI unit, which has a lower initial investment cost than the 3 Tesla units acquired by some hospitals more recently. None of the responding hospitals acquired a 1 tesla MRI unit after 2004.
h Personnal communication Koen Schoonjans, FPS for Health, Food Chain Safety and Environment - DG1 -
Boekhouding en Beheer der Ziekenhuizen/Service Comptabilité et gestion des hôpitaux
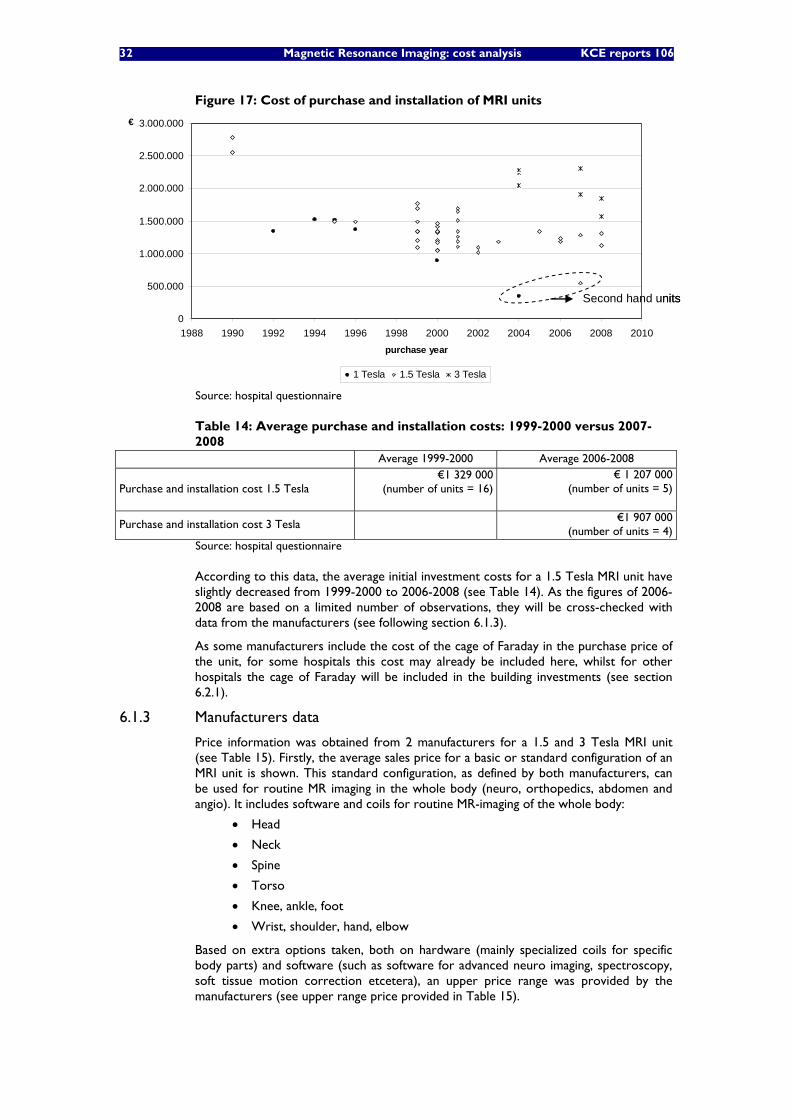
32 Magnetic Resonance Imaging: cost analysis KCE reports 106
Figure 17: Cost of purchase and installation of MRI units
0
500.000
1.000.000
1.500.000
2.000.000
2.500.000
3.000.000
1988 1990 1992 1994 1996 1998 2000 2002 2004 2006 2008 2010purchase year
€
1 Tesla 1.5 Tesla 3 Tesla
Second hand units
0
500.000
1.000.000
1.500.000
2.000.000
2.500.000
3.000.000
1988 1990 1992 1994 1996 1998 2000 2002 2004 2006 2008 2010purchase year
€
1 Tesla 1.5 Tesla 3 Tesla
Second hand units
Source: hospital questionnaire
Table 14: Average purchase and installation costs: 1999-2000 versus 2007-2008
Average 1999-2000 Average 2006-2008
Purchase and installation cost 1.5 Tesla €1 329 000 (number of units = 16)
€ 1 207 000 (number of units = 5)
Purchase and installation cost 3 Tesla
€1 907 000 (number of units = 4)
Source: hospital questionnaire
According to this data, the average initial investment costs for a 1.5 Tesla MRI unit have slightly decreased from 1999-2000 to 2006-2008 (see Table 14). As the figures of 2006-2008 are based on a limited number of observations, they will be cross-checked with data from the manufacturers (see following section 6.1.3).
As some manufacturers include the cost of the cage of Faraday in the purchase price of the unit, for some hospitals this cost may already be included here, whilst for other hospitals the cage of Faraday will be included in the building investments (see section 6.2.1).
6.1.3 Manufacturers data
Price information was obtained from 2 manufacturers for a 1.5 and 3 Tesla MRI unit (see Table 15). Firstly, the average sales price for a basic or standard configuration of an MRI unit is shown. This standard configuration, as defined by both manufacturers, can be used for routine MR imaging in the whole body (neuro, orthopedics, abdomen and angio). It includes software and coils for routine MR-imaging of the whole body:
• Head
• Neck
• Spine
• Torso
• Knee, ankle, foot
• Wrist, shoulder, hand, elbow
Based on extra options taken, both on hardware (mainly specialized coils for specific body parts) and software (such as software for advanced neuro imaging, spectroscopy, soft tissue motion correction etcetera), an upper price range was provided by the manufacturers (see upper range price provided in Table 15).
KCE Reports 106 Magnetic Resonance Imaging: cost analysis 33
Both manufacturers indicated a catalogue price and a discounted price (which was 20% to 30% lower than the catalogue price). In Table 15 the discounted prices as provided by the manufacturers are mentioned.
Installation of the unit is included, but changes to the building, such as the cage of Faraday, provisions for ice water, electricity and airconditioning, floor strengthening and changing rooms are excluded.
There were only small price differences between the prices of the two manufacturers.
Table 15: Installation and purchase cost: average data from 2 manufacturers
1.5 Tesla 3 Tesla
NMR unit
-standard configuration: minimum price
-configuration with a large variety of options (coils and software): upper range price
Including first year maintenance and training of nursing personnel and physicians.
€1 027 000 -
€1 378 000
€ 1 581 000 -
€1 945 000
All prices VAT inclusive.
As the price information from the manufacturers is in line with the information obtained from the questionnaire (for the purchases in the last years 2006-2008), the data from the manufacturers will be used for further analyses.
6.2 BUILDING ADJUSTMENT COSTS Building adjustment costs may depend largely on whether it concerns a first, an extra or a switch to a higher Tesla unit, in which cases a new place needs to be prepared, or whether it concerns a replacement of an old MRI unit by a new one with the same Tesla level, in which case some limited refurbishment of an existing place may be sufficient. Data on building adjustment costs was obtained through the hospital questionnaire. Some information was also obtained through consultation of the manufacturers.
6.2.1 Hospital questionnaire data
Data on building adjustment costs for a first or extra versus replacing unit was obtained from 24 hospitals through the hospital survey on 33 MRI units (in fact 36 units as in three cases an average has been calculated of 2 units, given that the building adjustment cost covered two units) (See Figure 18). Regional subsidies were excluded when this data was available (1 hospital).
When it concerns a first or an extra unit or a conversion from a lower field to a 3 Tesla unit, building adjustment costs varied from €43 000 to €701 000. Summary statistics can be found in Table 16.
In case of the replacement of a unit, costs per unit varied from €0 to €364 000.
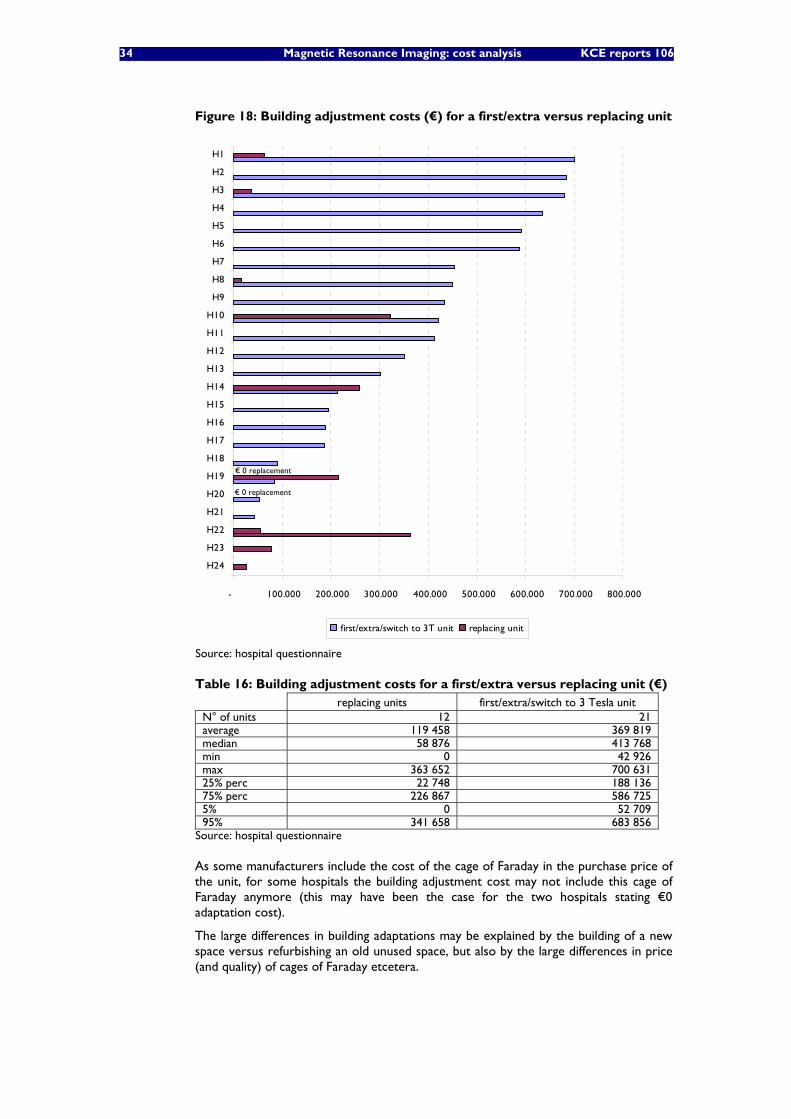
34 Magnetic Resonance Imaging: cost analysis KCE reports 106
Figure 18: Building adjustment costs (€) for a first/extra versus replacing unit
- 100.000 200.000 300.000 400.000 500.000 600.000 700.000 800.000
H24
H23
H22
H21
H20
H19
H18
H17
H16
H15
H14
H13
H12
H11
H10
H9
H8
H7
H6
H5
H4
H3
H2
H1
first/extra/switch to 3T unit replacing unit
€ 0 replacement
€ 0 replacement
- 100.000 200.000 300.000 400.000 500.000 600.000 700.000 800.000
H24
H23
H22
H21
H20
H19
H18
H17
H16
H15
H14
H13
H12
H11
H10
H9
H8
H7
H6
H5
H4
H3
H2
H1
first/extra/switch to 3T unit replacing unit
€ 0 replacement
€ 0 replacement
Source: hospital questionnaire
Table 16: Building adjustment costs for a first/extra versus replacing unit (€) replacing units first/extra/switch to 3 Tesla unit N° of units 12 21 average 119 458 369 819 median 58 876 413 768 min 0 42 926 max 363 652 700 631 25% perc 22 748 188 136 75% perc 226 867 586 725 5% 0 52 709 95% 341 658 683 856
Source: hospital questionnaire
As some manufacturers include the cost of the cage of Faraday in the purchase price of the unit, for some hospitals the building adjustment cost may not include this cage of Faraday anymore (this may have been the case for the two hospitals stating €0 adaptation cost).
The large differences in building adaptations may be explained by the building of a new space versus refurbishing an old unused space, but also by the large differences in price (and quality) of cages of Faraday etcetera.
KCE Reports 106 Magnetic Resonance Imaging: cost analysis 35
6.2.2 Manufacturers data
Manufacturers provided information on the cost of the cage of Faraday (which is included in the building adjustment costs provided by the hospitals in the previous section 6.2.1).
Besides for a new or extra unit, a new cage of Faraday may be needed in case of a replacement unit, when there is a switch to a higher magnetic field density or when the previous cage is too old or not of the type required for the new scanner.
Table 17: Cost of cage of Faraday
1.5 Tesla 3 Tesla
Cost of cage of Faraday
min. €45 000 – max. €116 000
Cost depends, amongst other elements, on size, materials, how suitable the location is and the number of walls that need extra shielding.
Source: based on information from two manufacturers.
6.3 UPGRADING COSTS AND LIFETIME OF EQUIPMENT As the MRI technology continues to advance, machines that are up-to-date at the time of purchase and installation may be considered obsolete within a number of years. Regular upgrades of software and hardware are therefore desired. By upgrading an MRI unit, scanning speed and consequently operating efficiency can be increased, image quality can be enhanced and clinical capabilities may be expanded.
6.3.1 Hospital questionnaire data Upgrading costs were obtained from the hospital survey. Data was obtained for 36 1.5 Tesla MRI units, 6 1 Tesla MRI units and 8 3 Tesla Units. Results for 1, 1.5 and 3 Tesla MRI units are shown in the following tables.
The data show that upgrades vary largely from unit to unit. As most of the units are still operational, no conclusions can be drawn with regard to the actual lifetime of the equipment and total upgrade costs.
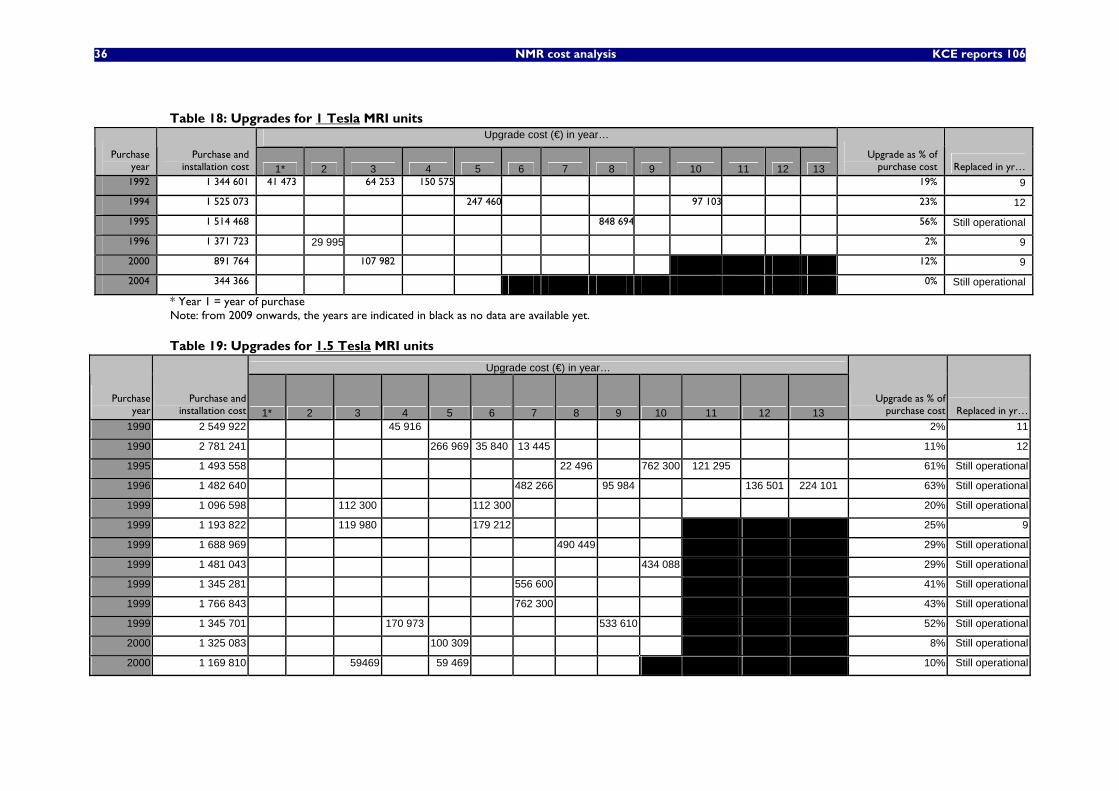
36 NMR cost analysis KCE reports 106
Table 18: Upgrades for 1 Tesla MRI units Upgrade cost (€) in year…
Purchase year
Purchase and installation cost 1* 2 3 4 5 6 7 8 9 10 11 12 13
Upgrade as % of purchase cost Replaced in yr…
1992 1 344 601 41 473 64 253 150 575 19% 9
1994 1 525 073 247 460 97 103 23% 12
1995 1 514 468 848 694 56% Still operational
1996 1 371 723 29 995 2% 9
2000 891 764 107 982 12% 9
2004 344 366 0% Still operational
* Year 1 = year of purchase Note: from 2009 onwards, the years are indicated in black as no data are available yet.
Table 19: Upgrades for 1.5 Tesla MRI units
Upgrade cost (€) in year…
Purchase year
Purchase and installation cost 1* 2 3 4 5 6 7 8 9 10 11 12 13
Upgrade as % of purchase cost Replaced in yr…
1990 2 549 922 45 916 2% 11
1990 2 781 241 266 969 35 840 13 445 11% 12
1995 1 493 558 22 496 762 300 121 295 61% Still operational
1996 1 482 640 482 266 95 984 136 501 224 101 63% Still operational
1999 1 096 598 112 300 112 300 20% Still operational
1999 1 193 822 119 980 179 212 25% 9
1999 1 688 969 490 449 29% Still operational
1999 1 481 043 434 088 29% Still operational
1999 1 345 281 556 600 41% Still operational
1999 1 766 843 762 300 43% Still operational
1999 1 345 701 170 973 533 610 52% Still operational
2000 1 325 083 100 309 8% Still operational
2000 1 169 810 59469 59 469 10% Still operational
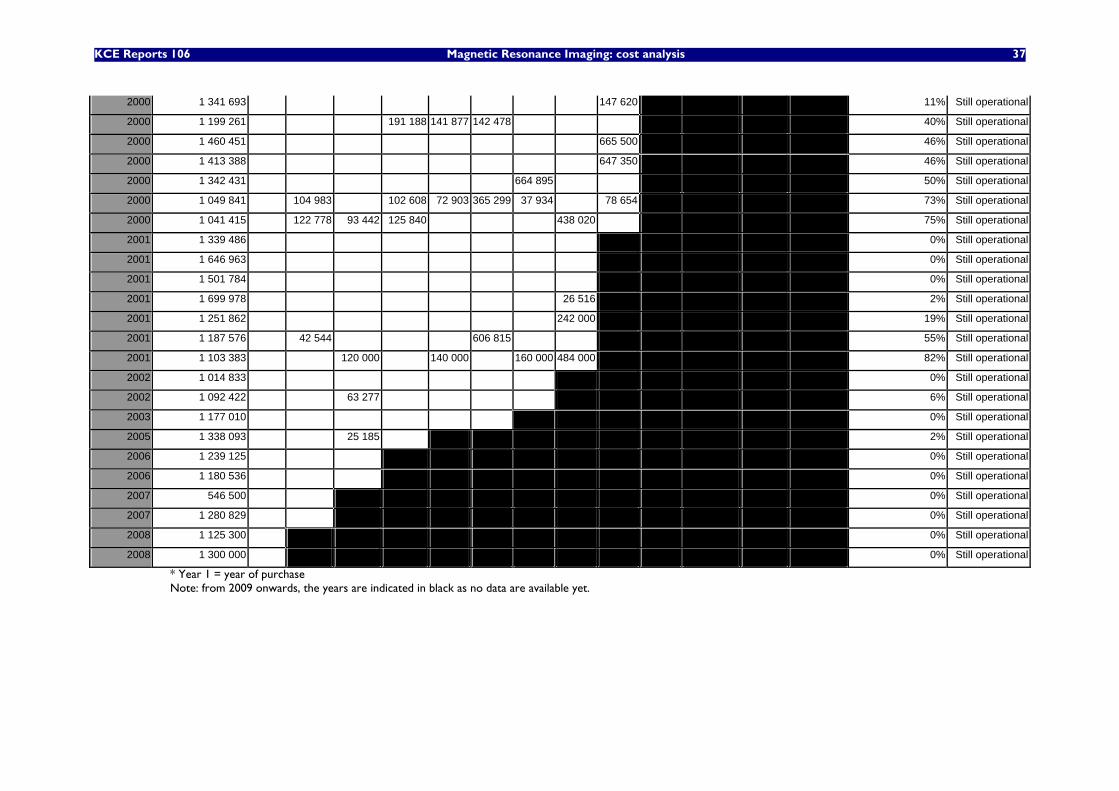
KCE Reports 106 Magnetic Resonance Imaging: cost analysis 37
2000 1 341 693 147 620 11% Still operational
2000 1 199 261 191 188 141 877 142 478 40% Still operational
2000 1 460 451 665 500 46% Still operational
2000 1 413 388 647 350 46% Still operational
2000 1 342 431 664 895 50% Still operational
2000 1 049 841 104 983 102 608 72 903 365 299 37 934 78 654 73% Still operational
2000 1 041 415 122 778 93 442 125 840 438 020 75% Still operational
2001 1 339 486 0% Still operational
2001 1 646 963 0% Still operational
2001 1 501 784 0% Still operational
2001 1 699 978 26 516 2% Still operational
2001 1 251 862 242 000 19% Still operational
2001 1 187 576 42 544 606 815 55% Still operational
2001 1 103 383 120 000 140 000 160 000 484 000 82% Still operational
2002 1 014 833 0% Still operational
2002 1 092 422 63 277 6% Still operational
2003 1 177 010 0% Still operational
2005 1 338 093 25 185 2% Still operational
2006 1 239 125 0% Still operational
2006 1 180 536 0% Still operational
2007 546 500 0% Still operational
2007 1 280 829 0% Still operational
2008 1 125 300 0% Still operational
2008 1 300 000 0% Still operational
* Year 1 = year of purchase Note: from 2009 onwards, the years are indicated in black as no data are available yet.
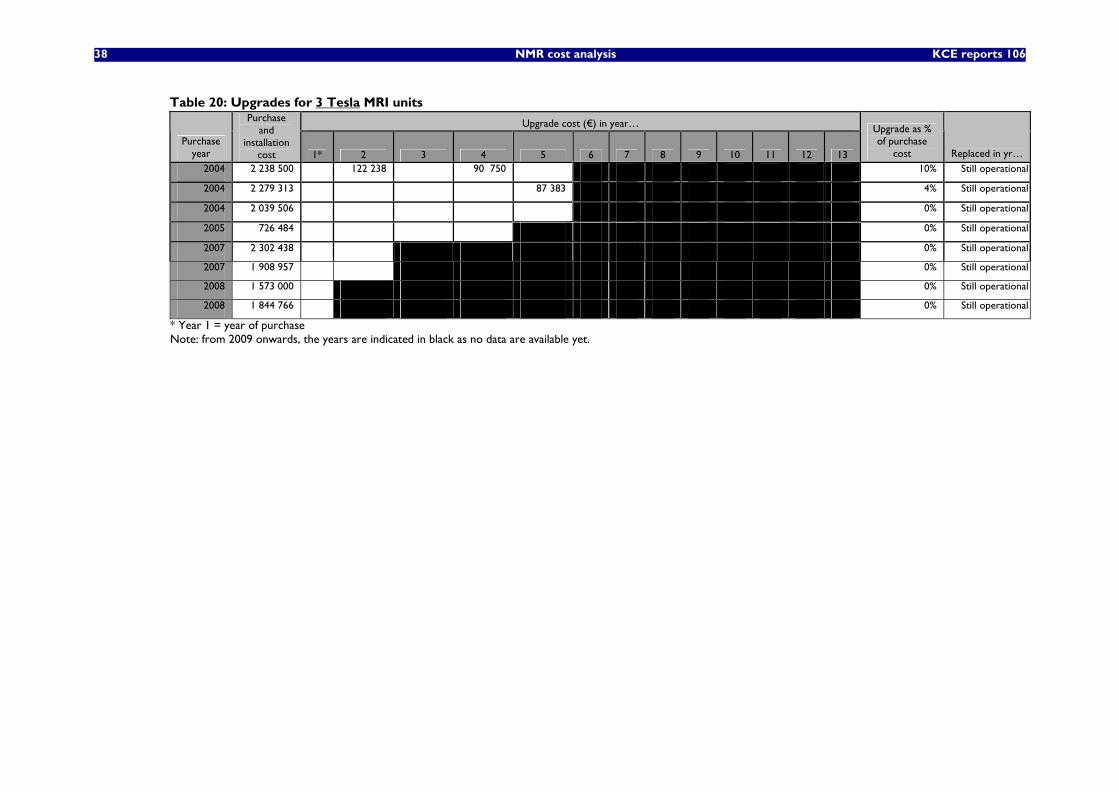
38 NMR cost analysis KCE reports 106
Table 20: Upgrades for 3 Tesla MRI units
Upgrade cost (€) in year…
Purchase year
Purchase and
installation cost 1* 2 3 4 5 6 7 8 9 10 11 12 13
Upgrade as % of purchase
cost Replaced in yr… 2004 2 238 500 122 238 90 750 10% Still operational
2004 2 279 313 87 383 4% Still operational
2004 2 039 506 0% Still operational
2005 726 484 0% Still operational
2007 2 302 438 0% Still operational
2007 1 908 957 0% Still operational
2008 1 573 000 0% Still operational
2008 1 844 766 0% Still operational
* Year 1 = year of purchase Note: from 2009 onwards, the years are indicated in black as no data are available yet.
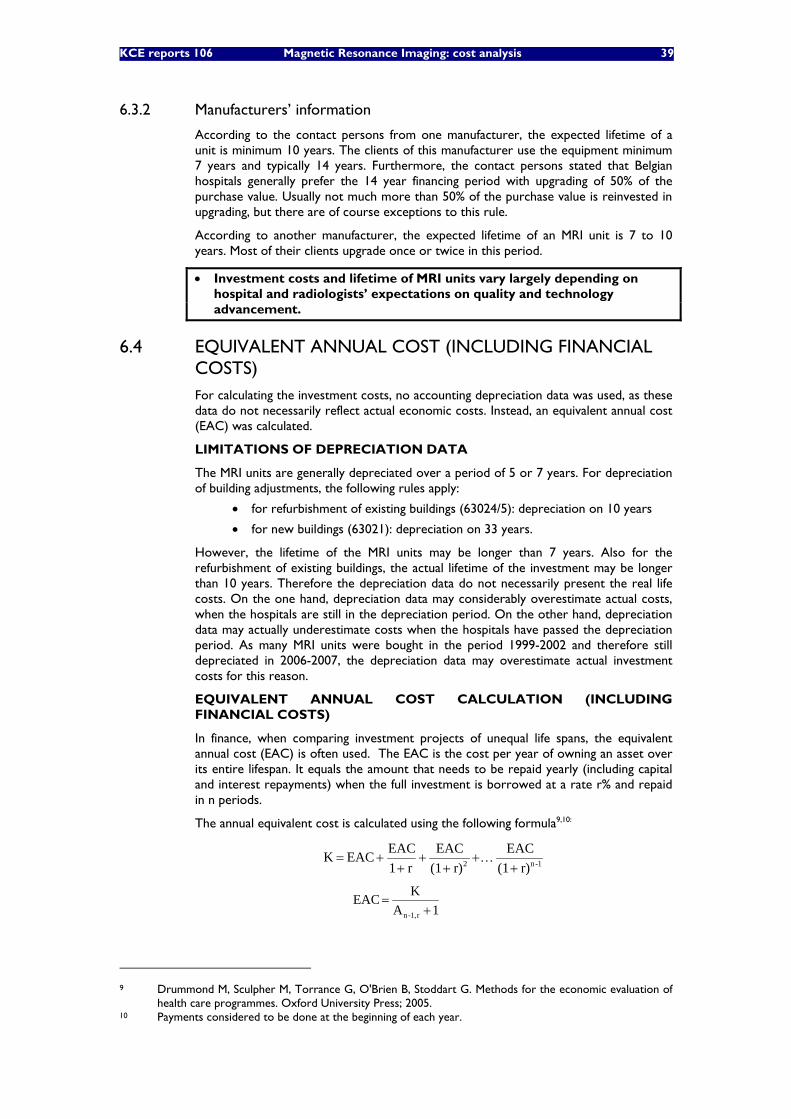
KCE reports 106 Magnetic Resonance Imaging: cost analysis 39
6.3.2 Manufacturers’ information
According to the contact persons from one manufacturer, the expected lifetime of a unit is minimum 10 years. The clients of this manufacturer use the equipment minimum 7 years and typically 14 years. Furthermore, the contact persons stated that Belgian hospitals generally prefer the 14 year financing period with upgrading of 50% of the purchase value. Usually not much more than 50% of the purchase value is reinvested in upgrading, but there are of course exceptions to this rule.
According to another manufacturer, the expected lifetime of an MRI unit is 7 to 10 years. Most of their clients upgrade once or twice in this period.
• Investment costs and lifetime of MRI units vary largely depending on hospital and radiologists’ expectations on quality and technology advancement.
6.4 EQUIVALENT ANNUAL COST (INCLUDING FINANCIAL COSTS) For calculating the investment costs, no accounting depreciation data was used, as these data do not necessarily reflect actual economic costs. Instead, an equivalent annual cost (EAC) was calculated.
LIMITATIONS OF DEPRECIATION DATA
The MRI units are generally depreciated over a period of 5 or 7 years. For depreciation of building adjustments, the following rules apply:
• for refurbishment of existing buildings (63024/5): depreciation on 10 years
• for new buildings (63021): depreciation on 33 years.
However, the lifetime of the MRI units may be longer than 7 years. Also for the refurbishment of existing buildings, the actual lifetime of the investment may be longer than 10 years. Therefore the depreciation data do not necessarily present the real life costs. On the one hand, depreciation data may considerably overestimate actual costs, when the hospitals are still in the depreciation period. On the other hand, depreciation data may actually underestimate costs when the hospitals have passed the depreciation period. As many MRI units were bought in the period 1999-2002 and therefore still depreciated in 2006-2007, the depreciation data may overestimate actual investment costs for this reason.
EQUIVALENT ANNUAL COST CALCULATION (INCLUDING FINANCIAL COSTS)
In finance, when comparing investment projects of unequal life spans, the equivalent annual cost (EAC) is often used. The EAC is the cost per year of owning an asset over its entire lifespan. It equals the amount that needs to be repaid yearly (including capital and interest repayments) when the full investment is borrowed at a rate r% and repaid in n periods.
The annual equivalent cost is calculated using the following formula9,10:
1-n2 r)(1EAC
r)(1EAC
r1EAC EAC K
+…+
++
++=
1AK EAC
r1,-n +=
9 Drummond M, Sculpher M, Torrance G, O'Brien B, Stoddart G. Methods for the economic evaluation of
health care programmes. Oxford University Press; 2005. 10 Payments considered to be done at the beginning of each year.
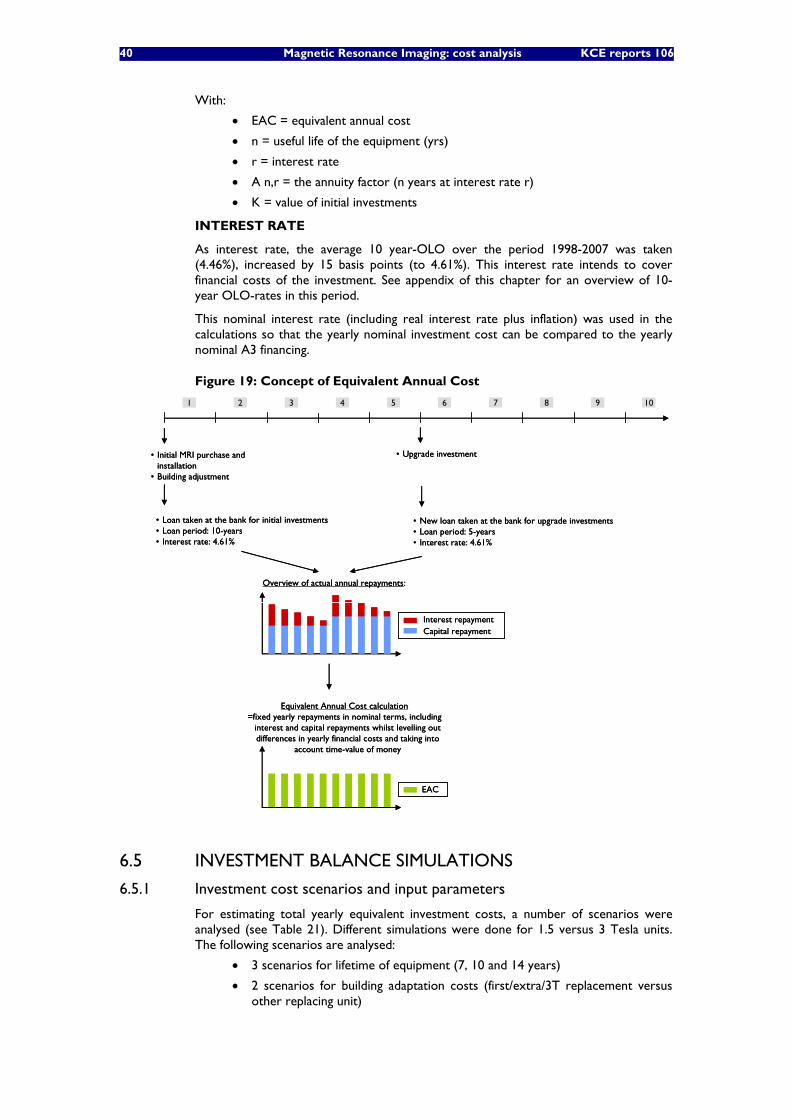
40 Magnetic Resonance Imaging: cost analysis KCE reports 106
With:
• EAC = equivalent annual cost
• n = useful life of the equipment (yrs)
• r = interest rate
• A n,r = the annuity factor (n years at interest rate r)
• K = value of initial investments
INTEREST RATE
As interest rate, the average 10 year-OLO over the period 1998-2007 was taken (4.46%), increased by 15 basis points (to 4.61%). This interest rate intends to cover financial costs of the investment. See appendix of this chapter for an overview of 10-year OLO-rates in this period.
This nominal interest rate (including real interest rate plus inflation) was used in the calculations so that the yearly nominal investment cost can be compared to the yearly nominal A3 financing.
Figure 19: Concept of Equivalent Annual Cost
• Initial MRI purchase and installation
• Building adjustment
• Upgrade investment
1 2 3 4 5 6 7 8 9 10
• Loan taken at the bank for initial investments• Loan period: 10-years• Interest rate: 4.61%
• New loan taken at the bank for upgrade investments • Loan period: 5-years• Interest rate: 4.61%
Equivalent Annual Cost calculation=fixed yearly repayments in nominal terms, including
interest and capital repayments whilst levelling out differences in yearly financial costs and taking into
account time-value of money
Capital repaymentInterest repayment
EAC
Overview of actual annual repayments:
6.5 INVESTMENT BALANCE SIMULATIONS
6.5.1 Investment cost scenarios and input parameters
For estimating total yearly equivalent investment costs, a number of scenarios were analysed (see Table 21). Different simulations were done for 1.5 versus 3 Tesla units. The following scenarios are analysed:
• 3 scenarios for lifetime of equipment (7, 10 and 14 years)
• 2 scenarios for building adaptation costs (first/extra/3T replacement versus other replacing unit)
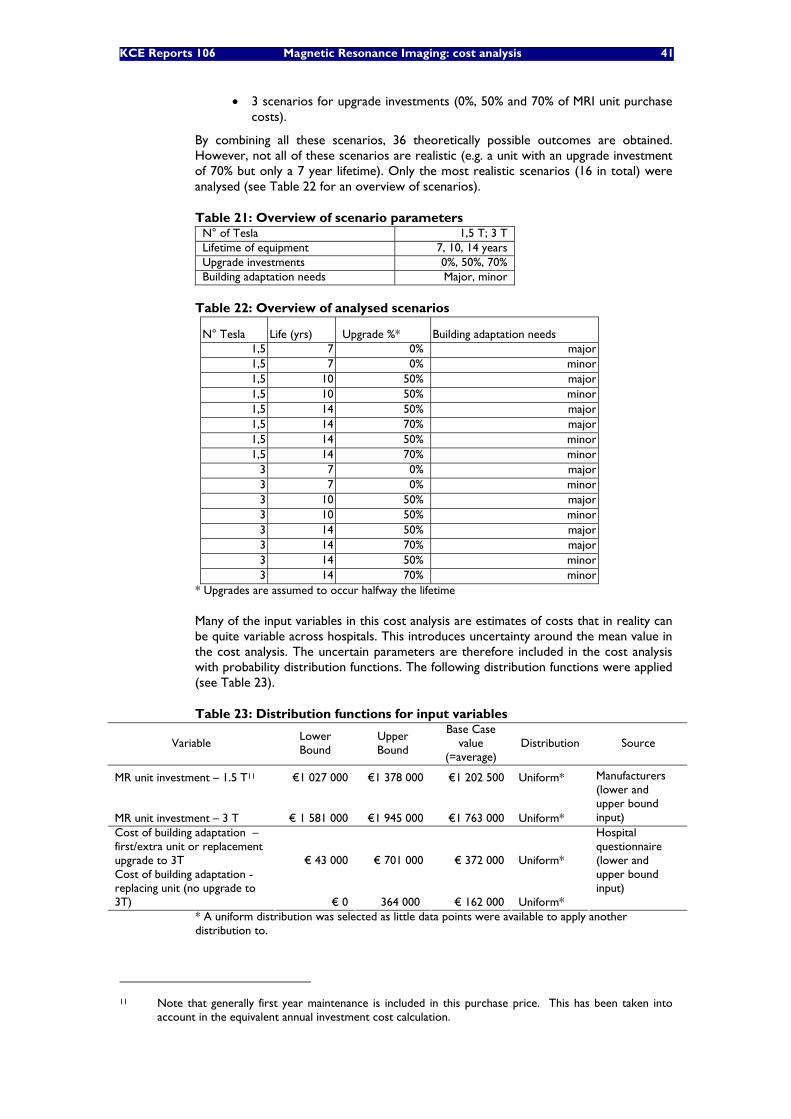
KCE Reports 106 Magnetic Resonance Imaging: cost analysis 41
• 3 scenarios for upgrade investments (0%, 50% and 70% of MRI unit purchase
costs).
By combining all these scenarios, 36 theoretically possible outcomes are obtained. However, not all of these scenarios are realistic (e.g. a unit with an upgrade investment of 70% but only a 7 year lifetime). Only the most realistic scenarios (16 in total) were analysed (see Table 22 for an overview of scenarios).
Table 21: Overview of scenario parameters N° of Tesla 1,5 T; 3 T Lifetime of equipment 7, 10, 14 years Upgrade investments 0%, 50%, 70% Building adaptation needs Major, minor
Table 22: Overview of analysed scenarios
N° Tesla Life (yrs) Upgrade %* Building adaptation needs 1,5 7 0% major 1,5 7 0% minor 1,5 10 50% major 1,5 10 50% minor 1,5 14 50% major 1,5 14 70% major 1,5 14 50% minor 1,5 14 70% minor
3 7 0% major 3 7 0% minor 3 10 50% major 3 10 50% minor 3 14 50% major 3 14 70% major 3 14 50% minor 3 14 70% minor
* Upgrades are assumed to occur halfway the lifetime
Many of the input variables in this cost analysis are estimates of costs that in reality can be quite variable across hospitals. This introduces uncertainty around the mean value in the cost analysis. The uncertain parameters are therefore included in the cost analysis with probability distribution functions. The following distribution functions were applied (see Table 23).
Table 23: Distribution functions for input variables
Variable Lower Bound
Upper Bound
Base Case value
(=average) Distribution Source
MR unit investment – 1.5 T11 €1 027 000 €1 378 000 €1 202 500 Uniform*
MR unit investment – 3 T € 1 581 000 €1 945 000 €1 763 000 Uniform*
Manufacturers (lower and upper bound input)
Cost of building adaptation – first/extra unit or replacement upgrade to 3T € 43 000 € 701 000 € 372 000 Uniform* Cost of building adaptation - replacing unit (no upgrade to 3T) € 0 364 000 € 162 000 Uniform*
Hospital questionnaire (lower and upper bound input)
* A uniform distribution was selected as little data points were available to apply another distribution to.
11 Note that generally first year maintenance is included in this purchase price. This has been taken into
account in the equivalent annual investment cost calculation.
42 Magnetic Resonance Imaging: cost analysis KCE reports 106
6.5.2 Investment cost simulation results
By applying probabilistic modelling and running 1000 Monte Carlo simulations, the uncertainty of the input variables was translated into a probability distribution for the total annual investment cost (see box plots in Figure 20 for 1.5 Tesla scenarios, Figure 21 for 3 Tesla scenarios and descriptive data in Table 24 for all scenarios). During the Monte Carlo simulation, values are sampled at random from the input probability distributions (as defined in Table 23). Each set of samples is called an iteration, and the resulting outcome from that sample is recorded. Monte Carlo simulation does this thousand times, and the result is a probability distribution of possible investment cost outcomes.
Figure 20 shows that the least negative scenario from the hospital’s point of view –obviously - is using a 1.5 Tesla MRI unit for 14 years, with a 50% upgrade and replacing the unit afterwards, as full A3 financing is obtained for 14 years. The annual investment cost in this scenario is on average €163 000 and €181 000 in case of minor and major building adaptations respectively (see Table 24), whilst yearly A3 financing is set at nearly €149 00012. The resulting yearly investment deficit (A3 financing – investment costs) is estimated on average €14 000 and €32 000 in case of minor and major building adaptations respectively. For 5% of the cases in this scenario with the lowest costs (the 5% percentile), costs are estimated at €137 000 and €145 000 (for minor and major building adaptations) which means that for these hospitals, A3 financing is sufficient. For 5% of the cases in this scenario with the highest costs (the 95% percentile), costs are estimated at €190 000 and €217 000.
Of all analysed 1.5 Tesla scenarios, the investment deficit is largest when the unit is only used for 7 years (even without any upgrade investment) or in case of 10 years lifetime with 50% upgrades.
12 Financing of MRI is explained in more detail in chapter 9.
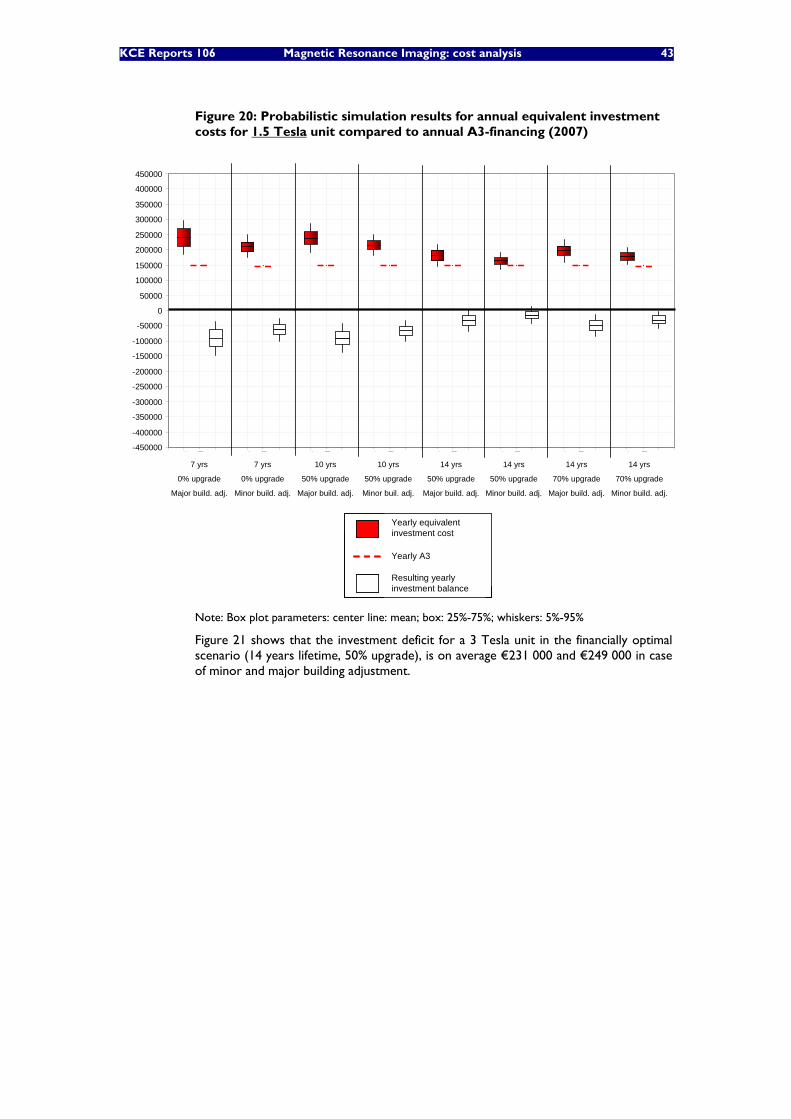
KCE Reports 106 Magnetic Resonance Imaging: cost analysis 43
Figure 20: Probabilistic simulation results for annual equivalent investment costs for 1.5 Tesla unit compared to annual A3-financing (2007)
-450000
-400000
-350000
-300000
-250000
-200000
-150000
-100000
-50000
0
50000
100000
150000
200000
250000
300000
350000
400000
450000A
EC o
f in
vest
men
ts
Ann
ual f
inan
cing
Bal
ance
AEC
of
inve
stm
ents
Ann
ual f
inan
cing
Bal
ance
AEC
of
inve
stm
ents
Ann
ual f
inan
cing
Bal
ance
AEC
of
inve
stm
ents
Ann
ual f
inan
cing
Bal
ance
AEC
of
inve
stm
ents
Ann
ual f
inan
cing
Bal
ance
AEC
of
inve
stm
ents
Ann
ual f
inan
cing
Bal
ance
AEC
of
inve
stm
ents
Ann
ual f
inan
cing
Bal
ance
AEC
of
inve
stm
ents
Ann
ual f
inan
cing
Bal
ance
7 yrs
0% upgrade
Major build. adj.
7 yrs
0% upgrade
Minor build. adj.
10 yrs
50% upgrade
Major build. adj.
10 yrs
50% upgrade
Minor buil. adj.
14 yrs
50% upgrade
Major build. adj.
14 yrs
50% upgrade
Minor build. adj.
14 yrs
70% upgrade
Major build. adj.
14 yrs
70% upgrade
Minor build. adj.
Yearly equivalentinvestment cost
Resulting yearlyinvestment balance
Yearly A3
Yearly equivalentinvestment cost
Resulting yearlyinvestment balance
Yearly A3
Note: Box plot parameters: center line: mean; box: 25%-75%; whiskers: 5%-95%
Figure 21 shows that the investment deficit for a 3 Tesla unit in the financially optimal scenario (14 years lifetime, 50% upgrade), is on average €231 000 and €249 000 in case of minor and major building adjustment.
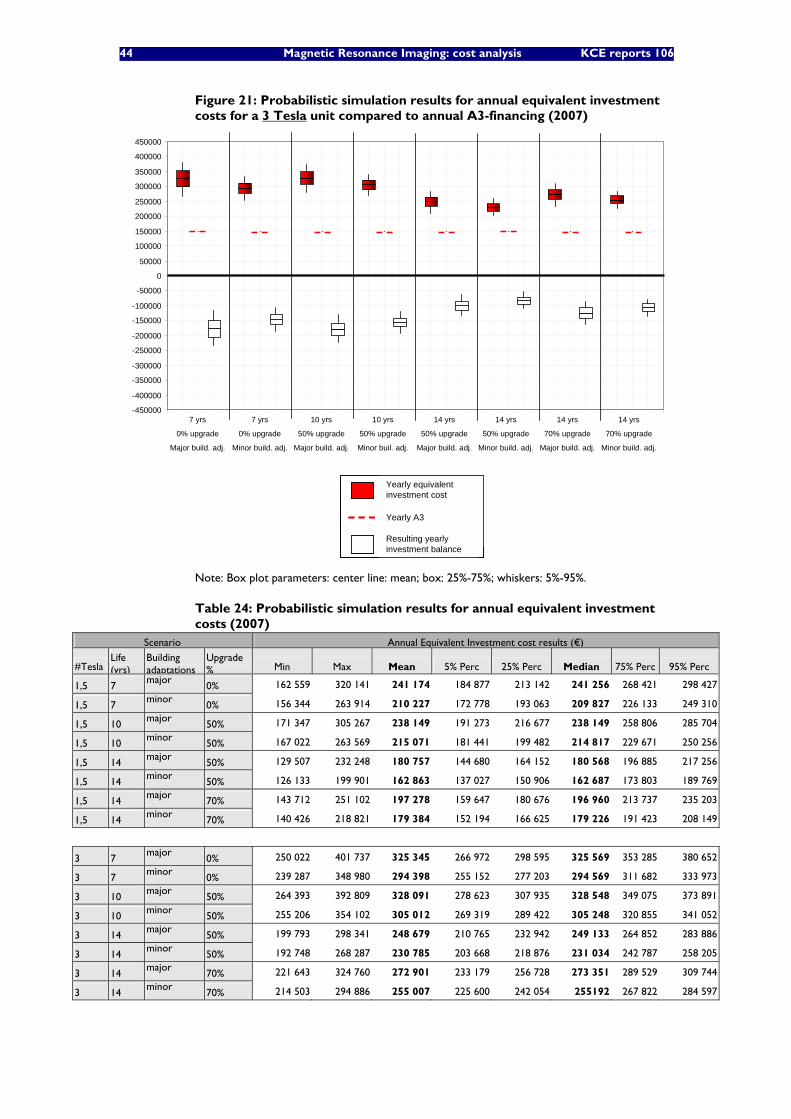
44 Magnetic Resonance Imaging: cost analysis KCE reports 106
Figure 21: Probabilistic simulation results for annual equivalent investment costs for a 3 Tesla unit compared to annual A3-financing (2007)
-450000
-400000
-350000
-300000
-250000
-200000
-150000
-100000
-50000
0
50000
100000
150000
200000
250000
300000
350000
400000
450000
AEC
of
inve
stm
ents
Ann
ual f
inan
cing
Bal
ance
AEC
of
inve
stm
ents
Ann
ual f
inan
cing
Bal
ance
AEC
of
inve
stm
ents
Ann
ual f
inan
cing
Bal
ance
AEC
of
inve
stm
ents
Ann
ual f
inan
cing
Bal
ance
AEC
of
inve
stm
ents
Ann
ual f
inan
cing
Bal
ance
AEC
of
inve
stm
ents
Ann
ual f
inan
cing
Bal
ance
AEC
of
inve
stm
ents
Ann
ual f
inan
cing
Bal
ance
AEC
of
inve
stm
ents
Ann
ual f
inan
cing
Bal
ance7 yrs
0% upgrade
Major build. adj.
7 yrs
0% upgrade
Minor build. adj.
10 yrs
50% upgrade
Major build. adj.
10 yrs
50% upgrade
Minor buil. adj.
14 yrs
50% upgrade
Major build. adj.
14 yrs
50% upgrade
Minor build. adj.
14 yrs
70% upgrade
Major build. adj.
14 yrs
70% upgrade
Minor build. adj.
Yearly equivalentinvestment cost
Resulting yearlyinvestment balance
Yearly A3
Yearly equivalentinvestment cost
Resulting yearlyinvestment balance
Yearly A3
Note: Box plot parameters: center line: mean; box: 25%-75%; whiskers: 5%-95%.
Table 24: Probabilistic simulation results for annual equivalent investment costs (2007)
Scenario Annual Equivalent Investment cost results (€)
#Tesla Life (yrs)
Building adaptations
Upgrade % Min Max Mean 5% Perc 25% Perc Median 75% Perc 95% Perc
1,5 7 major
0% 162 559 320 141 241 174 184 877 213 142 241 256 268 421 298 427
1,5 7 minor
0% 156 344 263 914 210 227 172 778 193 063 209 827 226 133 249 310
1,5 10 major
50% 171 347 305 267 238 149 191 273 216 677 238 149 258 806 285 704
1,5 10 minor
50% 167 022 263 569 215 071 181 441 199 482 214 817 229 671 250 256
1,5 14 major
50% 129 507 232 248 180 757 144 680 164 152 180 568 196 885 217 256
1,5 14 minor
50% 126 133 199 901 162 863 137 027 150 906 162 687 173 803 189 769
1,5 14 major
70% 143 712 251 102 197 278 159 647 180 676 196 960 213 737 235 203
1,5 14 minor
70% 140 426 218 821 179 384 152 194 166 625 179 226 191 423 208 149
3 7 major
0% 250 022 401 737 325 345 266 972 298 595 325 569 353 285 380 652
3 7 minor
0% 239 287 348 980 294 398 255 152 277 203 294 569 311 682 333 973
3 10 major
50% 264 393 392 809 328 091 278 623 307 935 328 548 349 075 373 891
3 10 minor
50% 255 206 354 102 305 012 269 319 289 422 305 248 320 855 341 052
3 14 major
50% 199 793 298 341 248 679 210 765 232 942 249 133 264 852 283 886
3 14 minor
50% 192 748 268 287 230 785 203 668 218 876 231 034 242 787 258 205
3 14 major
70% 221 643 324 760 272 901 233 179 256 728 273 351 289 529 309 744
3 14 minor
70% 214 503 294 886 255 007 225 600 242 054 255192 267 822 284 597
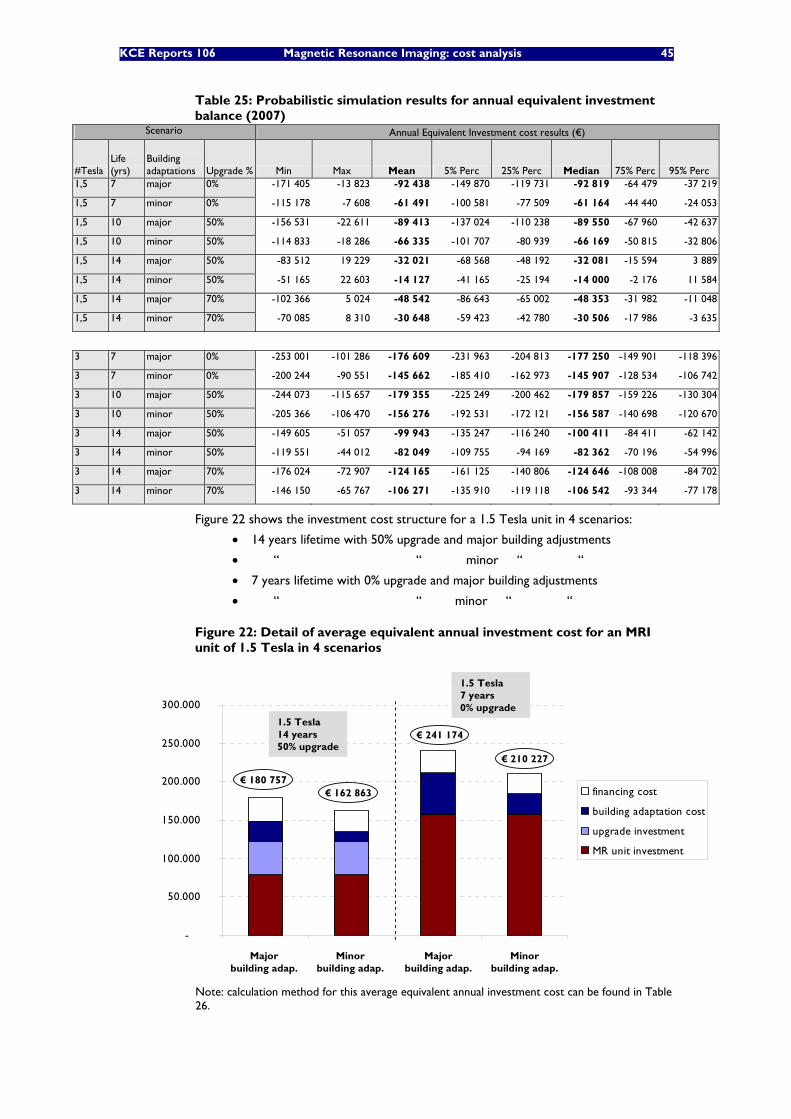
KCE Reports 106 Magnetic Resonance Imaging: cost analysis 45
Table 25: Probabilistic simulation results for annual equivalent investment balance (2007)
Scenario Annual Equivalent Investment cost results (€)
#Tesla Life (yrs)
Building adaptations Upgrade % Min Max Mean 5% Perc 25% Perc Median 75% Perc 95% Perc
1,5 7 major 0% -171 405 -13 823 -92 438 -149 870 -119 731 -92 819 -64 479 -37 219
1,5 7 minor 0% -115 178 -7 608 -61 491 -100 581 -77 509 -61 164 -44 440 -24 053
1,5 10 major 50% -156 531 -22 611 -89 413 -137 024 -110 238 -89 550 -67 960 -42 637
1,5 10 minor 50% -114 833 -18 286 -66 335 -101 707 -80 939 -66 169 -50 815 -32 806
1,5 14 major 50% -83 512 19 229 -32 021 -68 568 -48 192 -32 081 -15 594 3 889
1,5 14 minor 50% -51 165 22 603 -14 127 -41 165 -25 194 -14 000 -2 176 11 584
1,5 14 major 70% -102 366 5 024 -48 542 -86 643 -65 002 -48 353 -31 982 -11 048
1,5 14 minor 70% -70 085 8 310 -30 648 -59 423 -42 780 -30 506 -17 986 -3 635
3 7 major 0% -253 001 -101 286 -176 609 -231 963 -204 813 -177 250 -149 901 -118 396
3 7 minor 0% -200 244 -90 551 -145 662 -185 410 -162 973 -145 907 -128 534 -106 742
3 10 major 50% -244 073 -115 657 -179 355 -225 249 -200 462 -179 857 -159 226 -130 304
3 10 minor 50% -205 366 -106 470 -156 276 -192 531 -172 121 -156 587 -140 698 -120 670
3 14 major 50% -149 605 -51 057 -99 943 -135 247 -116 240 -100 411 -84 411 -62 142
3 14 minor 50% -119 551 -44 012 -82 049 -109 755 -94 169 -82 362 -70 196 -54 996
3 14 major 70% -176 024 -72 907 -124 165 -161 125 -140 806 -124 646 -108 008 -84 702
3 14 minor 70% -146 150 -65 767 -106 271 -135 910 -119 118 -106 542 -93 344 -77 178
Figure 22 shows the investment cost structure for a 1.5 Tesla unit in 4 scenarios:
• 14 years lifetime with 50% upgrade and major building adjustments
• “ “ minor “ “
• 7 years lifetime with 0% upgrade and major building adjustments
• “ “ minor “ “
Figure 22: Detail of average equivalent annual investment cost for an MRI unit of 1.5 Tesla in 4 scenarios
-
50.000
100.000
150.000
200.000
250.000
300.000
1 2 3 4
financing cost
building adaptation cost
upgrade investment
MR unit investment
€ 180 757€ 162 863
€ 241 174
€ 210 227
1.5 Tesla14 years50% upgrade
1.5 Tesla7 years0% upgrade
Major building adap.
Minorbuilding adap.
Major building adap.
Minorbuilding adap.
Note: calculation method for this average equivalent annual investment cost can be found in Table 26.
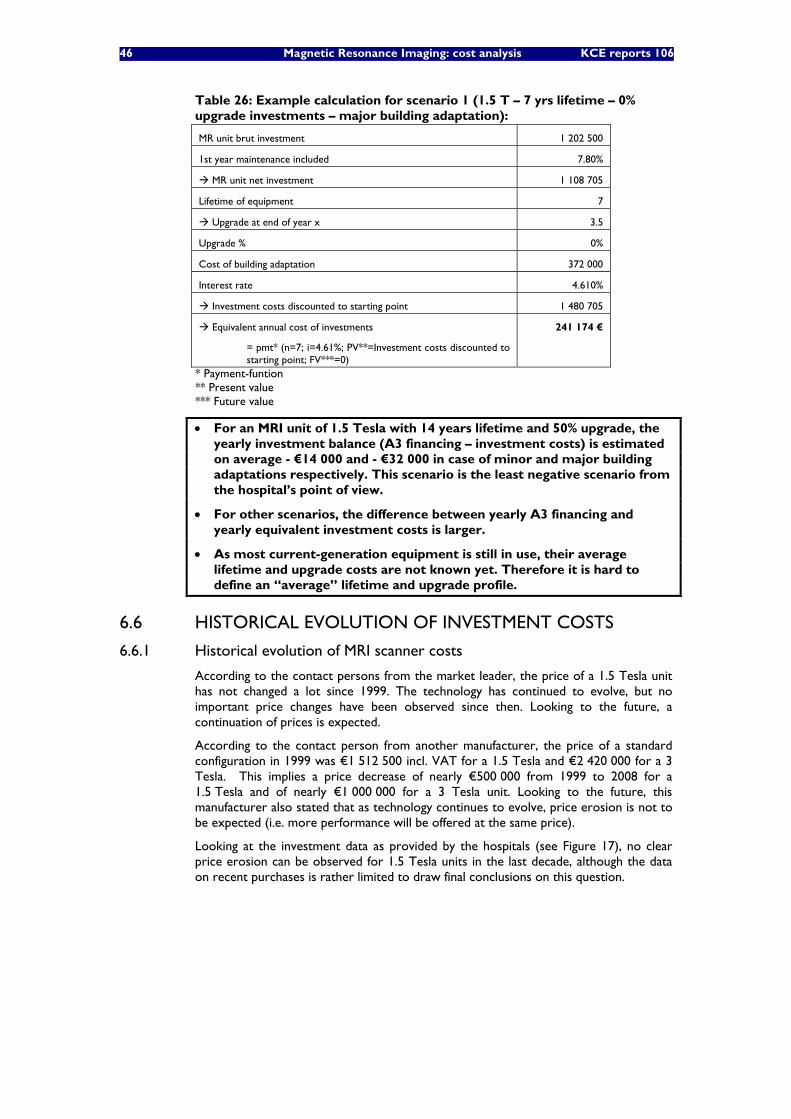
46 Magnetic Resonance Imaging: cost analysis KCE reports 106
Table 26: Example calculation for scenario 1 (1.5 T – 7 yrs lifetime – 0% upgrade investments – major building adaptation):
MR unit brut investment 1 202 500
1st year maintenance included 7.80%
MR unit net investment 1 108 705
Lifetime of equipment 7
Upgrade at end of year x 3.5
Upgrade % 0%
Cost of building adaptation 372 000
Interest rate 4.610%
Investment costs discounted to starting point 1 480 705
Equivalent annual cost of investments
= pmt* (n=7; i=4.61%; PV**=Investment costs discounted to starting point; FV***=0)
241 174 €
* Payment-funtion ** Present value *** Future value
• For an MRI unit of 1.5 Tesla with 14 years lifetime and 50% upgrade, the yearly investment balance (A3 financing – investment costs) is estimated on average - €14 000 and - €32 000 in case of minor and major building adaptations respectively. This scenario is the least negative scenario from the hospital’s point of view.
• For other scenarios, the difference between yearly A3 financing and yearly equivalent investment costs is larger.
• As most current-generation equipment is still in use, their average lifetime and upgrade costs are not known yet. Therefore it is hard to define an “average” lifetime and upgrade profile.
6.6 HISTORICAL EVOLUTION OF INVESTMENT COSTS
6.6.1 Historical evolution of MRI scanner costs
According to the contact persons from the market leader, the price of a 1.5 Tesla unit has not changed a lot since 1999. The technology has continued to evolve, but no important price changes have been observed since then. Looking to the future, a continuation of prices is expected.
According to the contact person from another manufacturer, the price of a standard configuration in 1999 was €1 512 500 incl. VAT for a 1.5 Tesla and €2 420 000 for a 3 Tesla. This implies a price decrease of nearly €500 000 from 1999 to 2008 for a 1.5 Tesla and of nearly €1 000 000 for a 3 Tesla unit. Looking to the future, this manufacturer also stated that as technology continues to evolve, price erosion is not to be expected (i.e. more performance will be offered at the same price).
Looking at the investment data as provided by the hospitals (see Figure 17), no clear price erosion can be observed for 1.5 Tesla units in the last decade, although the data on recent purchases is rather limited to draw final conclusions on this question.
KCE Reports 106 Magnetic Resonance Imaging: cost analysis 47
• Looking at the price evolution 1999-2008, one manufacturer states a price decrease of € 500 000 for a 1.5 Tesla, whereas another manufacturer states a stable price evolution.
• Based on hospital data, there is no clear indication for considerable price erosion since 1999. The major trend seems that more performing MRI technology has been bought at roughly the same price level, at least this is the case for 1.5 Tesla units. The investment cost of 3 Tesla units is considerably higher.
6.6.2 Historical evolution of building adjustment costs
For estimating the evolution of the building adjustment costs as such, the building index formula for the hospital sector, as used by “Vlaams Infrastructuurfonds voor Persoonsgebonden Aangelegenheden” (VIPA), could be applied. This index shows an increase by 38% from 1/01/2000 to 1/01/2008. Details of this index can be found in appendix of this chapter.
Furthermore, as already mentioned (see Figure 18), although building adjustment costs for a regular replacement can be quite large, they are in general smaller than in case of a first/extra unit or an upgrade replacement by a 3 Tesla unit.
• Investment costs for building adaptations in general can be estimated to have increased by 38% from end 1999 to 2008. However, when it concerns a replacement (without conversion to a 3 Tesla), building costs are typically lower than for a first or extra unit.
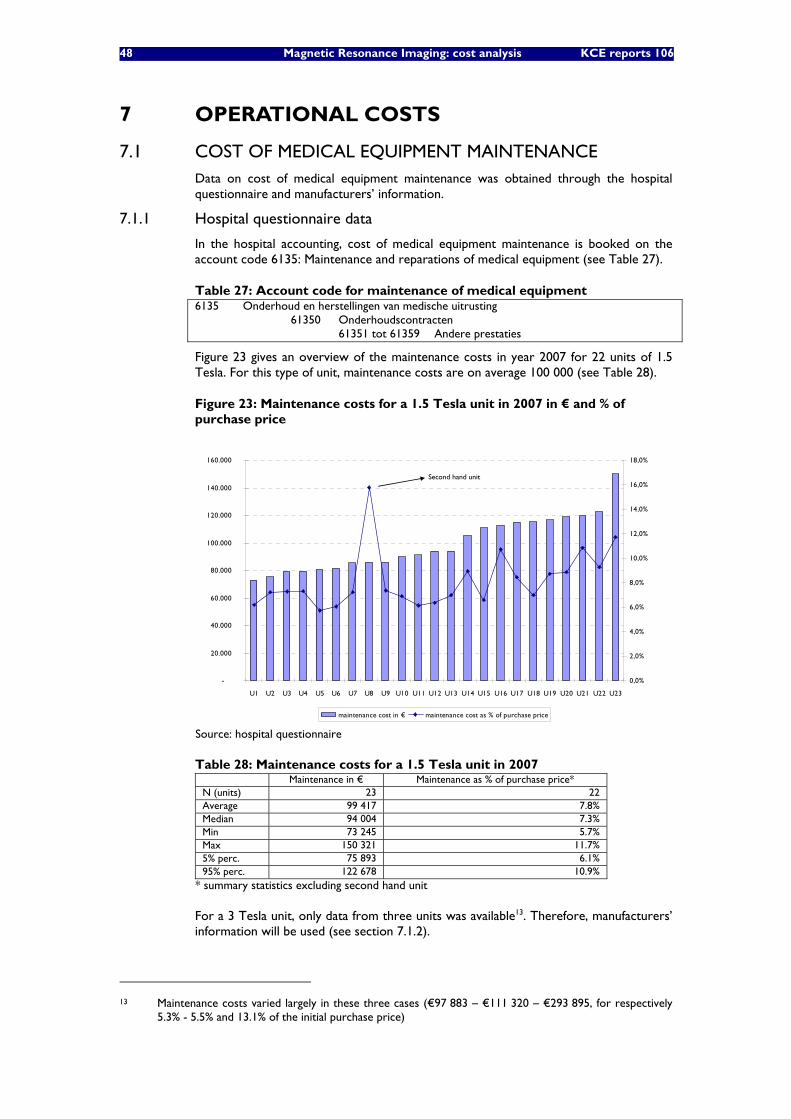
48 Magnetic Resonance Imaging: cost analysis KCE reports 106
7 OPERATIONAL COSTS
7.1 COST OF MEDICAL EQUIPMENT MAINTENANCE Data on cost of medical equipment maintenance was obtained through the hospital questionnaire and manufacturers’ information.
7.1.1 Hospital questionnaire data
In the hospital accounting, cost of medical equipment maintenance is booked on the account code 6135: Maintenance and reparations of medical equipment (see Table 27).
Table 27: Account code for maintenance of medical equipment 6135 Onderhoud en herstellingen van medische uitrusting 61350 Onderhoudscontracten
61351 tot 61359 Andere prestaties
Figure 23 gives an overview of the maintenance costs in year 2007 for 22 units of 1.5 Tesla. For this type of unit, maintenance costs are on average 100 000 (see Table 28).
Figure 23: Maintenance costs for a 1.5 Tesla unit in 2007 in € and % of purchase price
-
20.000
40.000
60.000
80.000
100.000
120.000
140.000
160.000
U1 U2 U3 U4 U5 U6 U7 U8 U9 U10 U11 U12 U13 U14 U15 U16 U17 U18 U19 U20 U21 U22 U23
0,0%
2,0%
4,0%
6,0%
8,0%
10,0%
12,0%
14,0%
16,0%
18,0%
maintenance cost in € maintenance cost as % of purchase price
Second hand unit
-
20.000
40.000
60.000
80.000
100.000
120.000
140.000
160.000
U1 U2 U3 U4 U5 U6 U7 U8 U9 U10 U11 U12 U13 U14 U15 U16 U17 U18 U19 U20 U21 U22 U23
0,0%
2,0%
4,0%
6,0%
8,0%
10,0%
12,0%
14,0%
16,0%
18,0%
maintenance cost in € maintenance cost as % of purchase price
Second hand unit
Source: hospital questionnaire
Table 28: Maintenance costs for a 1.5 Tesla unit in 2007 Maintenance in € Maintenance as % of purchase price* N (units) 23 22 Average 99 417 7.8% Median 94 004 7.3% Min 73 245 5.7% Max 150 321 11.7% 5% perc. 75 893 6.1% 95% perc. 122 678 10.9%
* summary statistics excluding second hand unit
For a 3 Tesla unit, only data from three units was available13. Therefore, manufacturers’ information will be used (see section 7.1.2).
13 Maintenance costs varied largely in these three cases (€97 883 – €111 320 – €293 895, for respectively
5.3% - 5.5% and 13.1% of the initial purchase price)
KCE Reports 106 Magnetic Resonance Imaging: cost analysis 49
7.1.2 Manufacturers’ data
Table 29 shows the maintenance cost data as provided by salesmen from the two manufacturers. The average maintenance cost for a 1.5 Tesla provided by the manufacturers (of €110 000) is 10% higher than the average maintenance cost observed in the hospital questionnaire. We assumed the same 10% discount on the maintenance costs reported by the manufacturers for the actual 3 Tesla maintenance cost in our analysis.
Table 29: Maintenance cost data based on average data from manufacturers Average maintenance cost
figures (€) in 2008 given by manufacturers
Average actual maintenance cost paid by hospitals
1.5 Tesla 110 000 100 000 3 Tesla 151 000 137 000
Data including VAT
The estimated average actual maintenance cost of a 3 Tesla MRI unit equals 7.8% of the initial investment cost of a 3 Tesla unit. Applying this 7.8% for a 3 Tesla unit respectively on the lower and upper purchase price (see section 6.1.3), we obtain the following price ranges for equipment maintenance. (Note that for 1.5 Tesla units, hospital questionnaire data will be used as there were sufficient observations).
Lower maintenance cost (€) Upper maintenance cost (€) Average maintenance cost (€)
3 Tesla 123 000 151 000 137 000
7.2 COST OF NURSING/PARAMEDICAL PERSONNEL The execution of radiology examinations and procedures, along with accurate and timely interpretation of radiology procedure results, is accomplished by a team of various healthcare professionals. The radiology team generally includes physicians (radiologists), radiology and general nurses or technologists (paramedical personnel) and clinical physicists.
Primarily, radiology nurses or technologists are responsible for executing the MRI examination. This involves explaining procedures to reassure the patient and obtain his/her cooperation, positioning the patient on the examining table, and adjusting immobilization devices to obtain optimal views of specific body areas. The technologist moves the imaging equipment into position and adjusts the equipment controls to set exposure based on knowledge of the procedure and on established guidelines.
General nurses are often used for radiology procedures requiring sedation of the patient, or intravenous (IV) administration of medications, and/or contrast substances. Nurses may be responsible for assessing and documenting patient status, conferring with the radiologist for specific patient care needs, and providing educational information to patients related to their radiology procedure.
7.2.1 Number of FTEs: hospital questionnaire data
Obviously, the number of nursing FTEs required varies in function of the opening hours of the MRI unit. Data from the questionnaire are presented in Figure 24.
Data was retrieved for 20 hospitals. 15 of the answers originate directly from the head of the radiology department. 5 answers originate from administrative or financial management/employees (which may as well have consulted the head of radiology department). In Figure 25, the results are shown by respondent type.
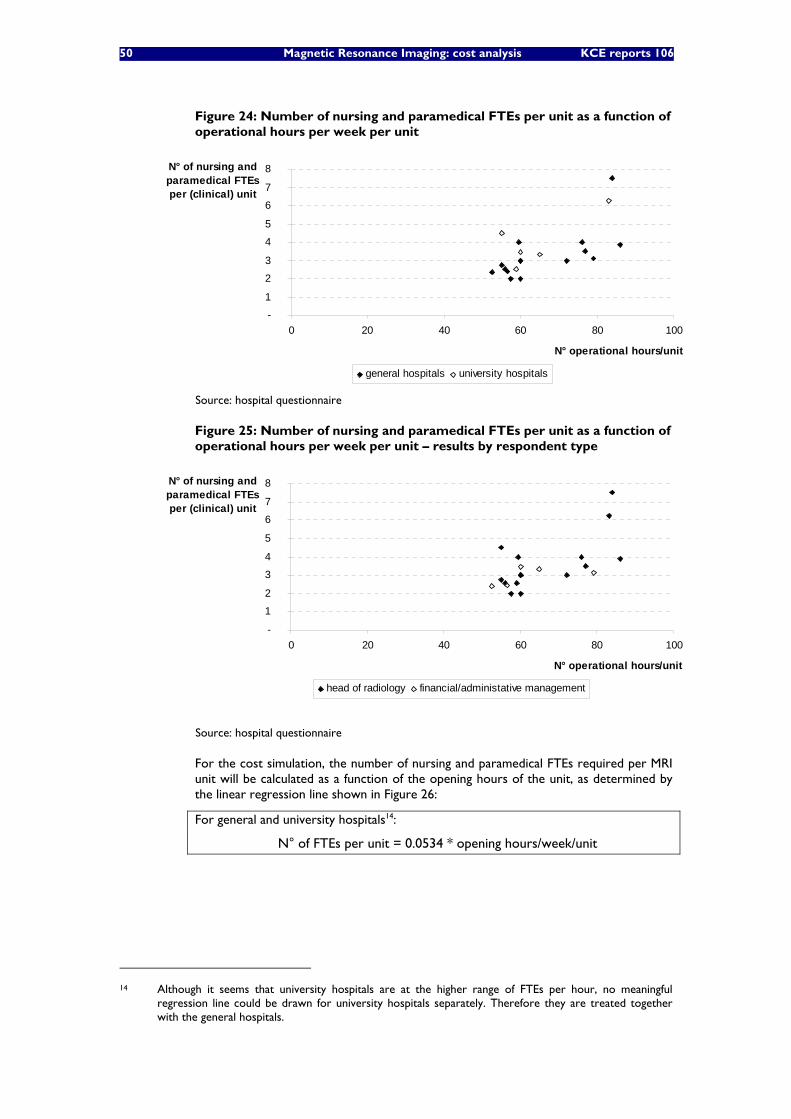
50 Magnetic Resonance Imaging: cost analysis KCE reports 106
Figure 24: Number of nursing and paramedical FTEs per unit as a function of operational hours per week per unit
-
1
2
3
4
5
6
7
8
0 20 40 60 80 100
N° operational hours/unit
N° of nursing and paramedical FTEs per (clinical) unit
general hospitals university hospitals
Source: hospital questionnaire
Figure 25: Number of nursing and paramedical FTEs per unit as a function of operational hours per week per unit – results by respondent type
-
1
2
3
4
5
6
7
8
0 20 40 60 80 100
N° operational hours/unit
N° of nursing and paramedical FTEs per (clinical) unit
head of radiology financial/administative management
Source: hospital questionnaire
For the cost simulation, the number of nursing and paramedical FTEs required per MRI unit will be calculated as a function of the opening hours of the unit, as determined by the linear regression line shown in Figure 26:
For general and university hospitals14:
N° of FTEs per unit = 0.0534 * opening hours/week/unit
14 Although it seems that university hospitals are at the higher range of FTEs per hour, no meaningful
regression line could be drawn for university hospitals separately. Therefore they are treated together with the general hospitals.
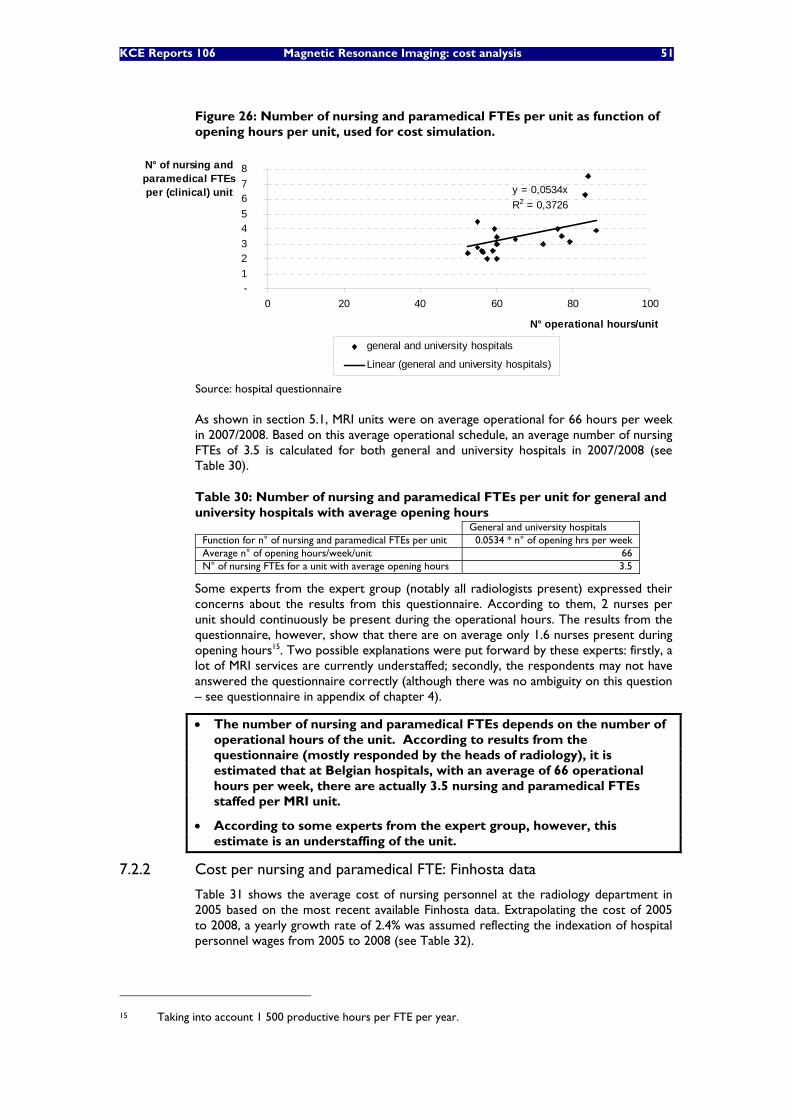
KCE Reports 106 Magnetic Resonance Imaging: cost analysis 51
Figure 26: Number of nursing and paramedical FTEs per unit as function of opening hours per unit, used for cost simulation.
y = 0,0534xR2 = 0,3726
- 1 2 3 4 5 6 7 8
0 20 40 60 80 100
N° operational hours/unit
N° of nursing and paramedical FTEs per (clinical) unit
general and university hospitals
Linear (general and university hospitals)
Source: hospital questionnaire
As shown in section 5.1, MRI units were on average operational for 66 hours per week in 2007/2008. Based on this average operational schedule, an average number of nursing FTEs of 3.5 is calculated for both general and university hospitals in 2007/2008 (see Table 30).
Table 30: Number of nursing and paramedical FTEs per unit for general and university hospitals with average opening hours
General and university hospitals Function for n° of nursing and paramedical FTEs per unit 0.0534 * n° of opening hrs per week Average n° of opening hours/week/unit 66 N° of nursing FTEs for a unit with average opening hours 3.5
Some experts from the expert group (notably all radiologists present) expressed their concerns about the results from this questionnaire. According to them, 2 nurses per unit should continuously be present during the operational hours. The results from the questionnaire, however, show that there are on average only 1.6 nurses present during opening hours15. Two possible explanations were put forward by these experts: firstly, a lot of MRI services are currently understaffed; secondly, the respondents may not have answered the questionnaire correctly (although there was no ambiguity on this question – see questionnaire in appendix of chapter 4).
• The number of nursing and paramedical FTEs depends on the number of operational hours of the unit. According to results from the questionnaire (mostly responded by the heads of radiology), it is estimated that at Belgian hospitals, with an average of 66 operational hours per week, there are actually 3.5 nursing and paramedical FTEs staffed per MRI unit.
• According to some experts from the expert group, however, this estimate is an understaffing of the unit.
7.2.2 Cost per nursing and paramedical FTE: Finhosta data
Table 31 shows the average cost of nursing personnel at the radiology department in 2005 based on the most recent available Finhosta data. Extrapolating the cost of 2005 to 2008, a yearly growth rate of 2.4% was assumed reflecting the indexation of hospital personnel wages from 2005 to 2008 (see Table 32).
15 Taking into account 1 500 productive hours per FTE per year.
52 Magnetic Resonance Imaging: cost analysis KCE reports 106
Figures from a number of hospitals approached the resulting average cost of nearly €60 000. Furthermore, the cost of technologists (paramedical personnel) is assumed to be equal to the cost of nursing personnel.
Table 31: Nursing personnel costs at radiology department in 2005
2005 Extrapolation to 2008 (assuming yearly
growth rate of 2.4% - see Table 32)
Infirmière graduée hospitalière/ Gegradueerd verpleger - A1 (graad 06210)
€ 53 732 € 57 686
Source: Finhosta Note: cost of personnel as sum of gross wage, “patronale bijdragen”, diverse costs, “extra legale voordelen” and payment for irregular (evening and weekend) working hours
Table 32: Indexation of hospital personnel wages 2005 2008 Yearly growth rate
Index
1/1/05-31/7/05: 134.59% 1/8/05-31/12/05: 137.28%
year average: 135.71%
1/1/08-30/4/08: 142.82% 1/5/08-31/8/08: 145.68% 1/9/08-31/12/08: 148.59%
year average: 145.70%
‘05-‘08: 2.4%
Source: Nationaal Verbond van Medisch-sociale voorzieningen
• For 2008, cost per nursing and paramedical FTE is estimated at €60 000 per year.
7.3 COST OF NON-REIMBURSABLE PHARMACEUTICAL AND OTHER MEDICAL CONSUMABLES This item captures pharmaceutical and other medical products that are not reimbursed separately as pharmaceuticals. As we aim to compare the A3, B3 and honoraria financing with the actual costs they intend to cover, these drugs that are financed separately (through drug reimbursement and out-of-pocket payments) are not considered in this analysis. Contrast fluids, for instance, are not included in this cost analysis, as they are reimbursed drugs. They fall under reimbursement category B and are thus for 75% reimbursed by the NIHDI and for 25% paid out-of-pocket by the patient.
Consumables included in this item thus cover non-reimbursable pharmaceutical and other medical products used for the MRI examinations. In terms of cost accounts, it concerns the items as mentioned in Table 33. Data on this item was obtained from the hospital survey.
Table 33: Account codes used for non-reimbursable pharmaceutical and medical consumables 600 Inkopen van farmaceutische producten 6000 Farmaceutische specialiteiten (6001 Moedermelk) n.a. 6002 Courante producten 6003 Steriele producten 6004 Producten voor magistrale voorschriften (6005 Bloed, plasma, derivaten) n.a. (6006 Gipsen en andere gipsverbanden) n.a. 6007 Synthesemateriaal 6009 Diversen 601 Inkopen van andere medische producten 6010 Disposables en klein medisch materieel (6011 Medische gassen) n.a. (6012 Niet-steriele verbanden) n.a. (6013 Hechtingsmateriaal) n.a. (6014 Afnamemateriaal) n.a. (6015 Reagentia) n.a. (6016 Radioactief materiaal en isotopen) n.a.
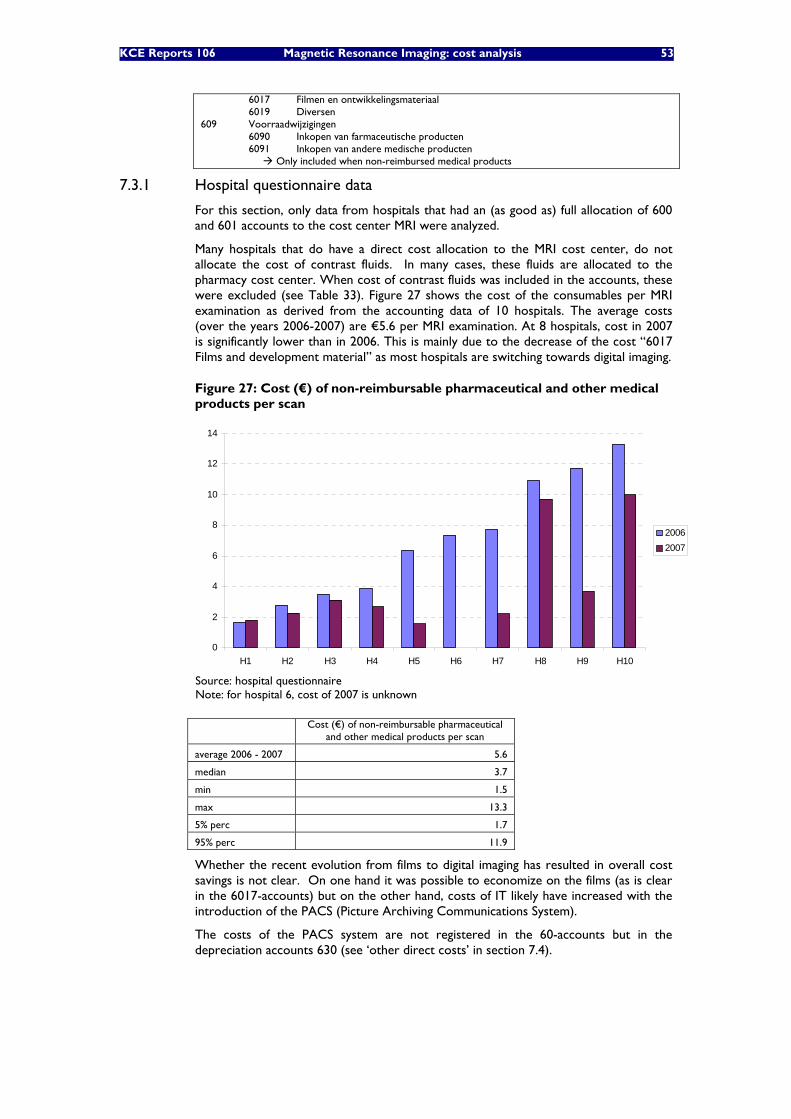
KCE Reports 106 Magnetic Resonance Imaging: cost analysis 53
6017 Filmen en ontwikkelingsmateriaal 6019 Diversen 609 Voorraadwijzigingen 6090 Inkopen van farmaceutische producten 6091 Inkopen van andere medische producten Only included when non-reimbursed medical products
7.3.1 Hospital questionnaire data
For this section, only data from hospitals that had an (as good as) full allocation of 600 and 601 accounts to the cost center MRI were analyzed.
Many hospitals that do have a direct cost allocation to the MRI cost center, do not allocate the cost of contrast fluids. In many cases, these fluids are allocated to the pharmacy cost center. When cost of contrast fluids was included in the accounts, these were excluded (see Table 33). Figure 27 shows the cost of the consumables per MRI examination as derived from the accounting data of 10 hospitals. The average costs (over the years 2006-2007) are €5.6 per MRI examination. At 8 hospitals, cost in 2007 is significantly lower than in 2006. This is mainly due to the decrease of the cost “6017 Films and development material” as most hospitals are switching towards digital imaging.
Figure 27: Cost (€) of non-reimbursable pharmaceutical and other medical products per scan
0
2
4
6
8
10
12
14
H1 H2 H3 H4 H5 H6 H7 H8 H9 H10
20062007
Source: hospital questionnaire Note: for hospital 6, cost of 2007 is unknown
Cost (€) of non-reimbursable pharmaceutical
and other medical products per scan
average 2006 - 2007 5.6
median 3.7
min 1.5
max 13.3
5% perc 1.7
95% perc 11.9
Whether the recent evolution from films to digital imaging has resulted in overall cost savings is not clear. On one hand it was possible to economize on the films (as is clear in the 6017-accounts) but on the other hand, costs of IT likely have increased with the introduction of the PACS (Picture Archiving Communications System).
The costs of the PACS system are not registered in the 60-accounts but in the depreciation accounts 630 (see ‘other direct costs’ in section 7.4).
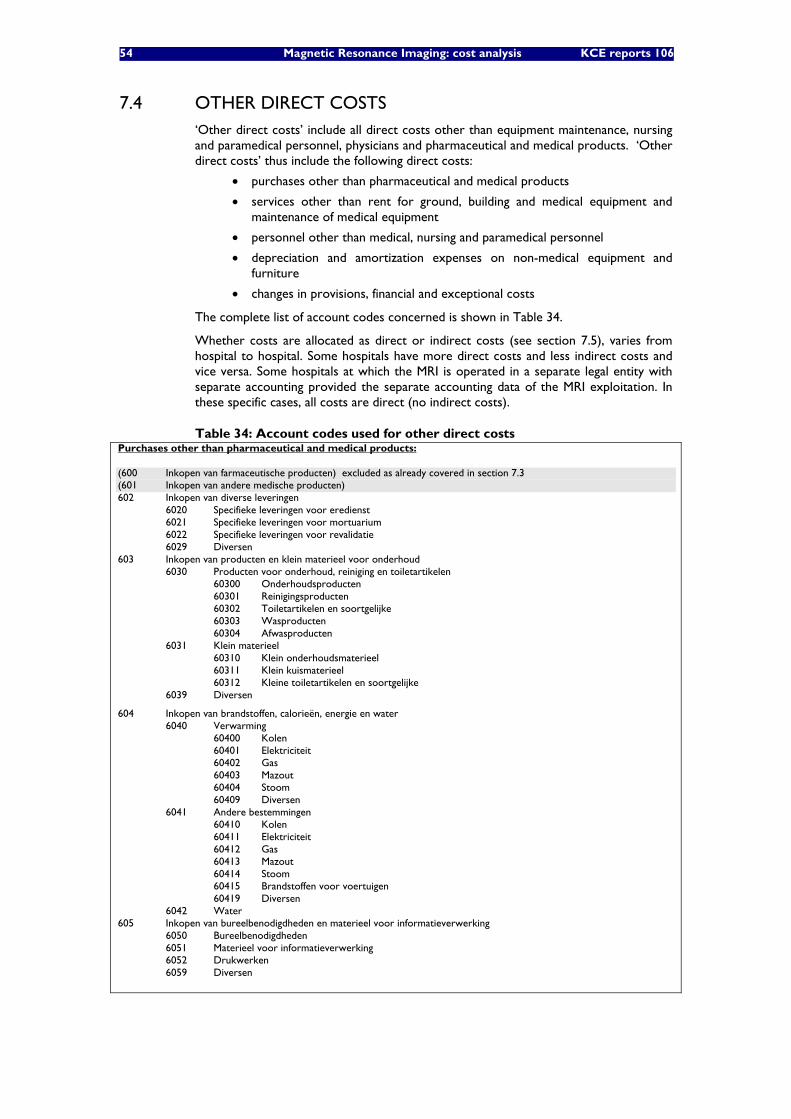
54 Magnetic Resonance Imaging: cost analysis KCE reports 106
7.4 OTHER DIRECT COSTS ‘Other direct costs’ include all direct costs other than equipment maintenance, nursing and paramedical personnel, physicians and pharmaceutical and medical products. ‘Other direct costs’ thus include the following direct costs:
• purchases other than pharmaceutical and medical products
• services other than rent for ground, building and medical equipment and maintenance of medical equipment
• personnel other than medical, nursing and paramedical personnel
• depreciation and amortization expenses on non-medical equipment and furniture
• changes in provisions, financial and exceptional costs
The complete list of account codes concerned is shown in Table 34.
Whether costs are allocated as direct or indirect costs (see section 7.5), varies from hospital to hospital. Some hospitals have more direct costs and less indirect costs and vice versa. Some hospitals at which the MRI is operated in a separate legal entity with separate accounting provided the separate accounting data of the MRI exploitation. In these specific cases, all costs are direct (no indirect costs).
Table 34: Account codes used for other direct costs Purchases other than pharmaceutical and medical products: (600 Inkopen van farmaceutische producten) excluded as already covered in section 7.3 (601 Inkopen van andere medische producten) 602 Inkopen van diverse leveringen 6020 Specifieke leveringen voor eredienst 6021 Specifieke leveringen voor mortuarium 6022 Specifieke leveringen voor revalidatie 6029 Diversen 603 Inkopen van producten en klein materieel voor onderhoud 6030 Producten voor onderhoud, reiniging en toiletartikelen 60300 Onderhoudsproducten 60301 Reinigingsproducten 60302 Toiletartikelen en soortgelijke 60303 Wasproducten 60304 Afwasproducten 6031 Klein materieel 60310 Klein onderhoudsmaterieel 60311 Klein kuismaterieel 60312 Kleine toiletartikelen en soortgelijke 6039 Diversen
604 Inkopen van brandstoffen, calorieën, energie en water 6040 Verwarming 60400 Kolen 60401 Elektriciteit 60402 Gas 60403 Mazout 60404 Stoom 60409 Diversen 6041 Andere bestemmingen 60410 Kolen 60411 Elektriciteit 60412 Gas 60413 Mazout 60414 Stoom 60415 Brandstoffen voor voertuigen 60419 Diversen 6042 Water 605 Inkopen van bureelbenodigdheden en materieel voor informatieverwerking 6050 Bureelbenodigdheden 6051 Materieel voor informatieverwerking 6052 Drukwerken 6059 Diversen
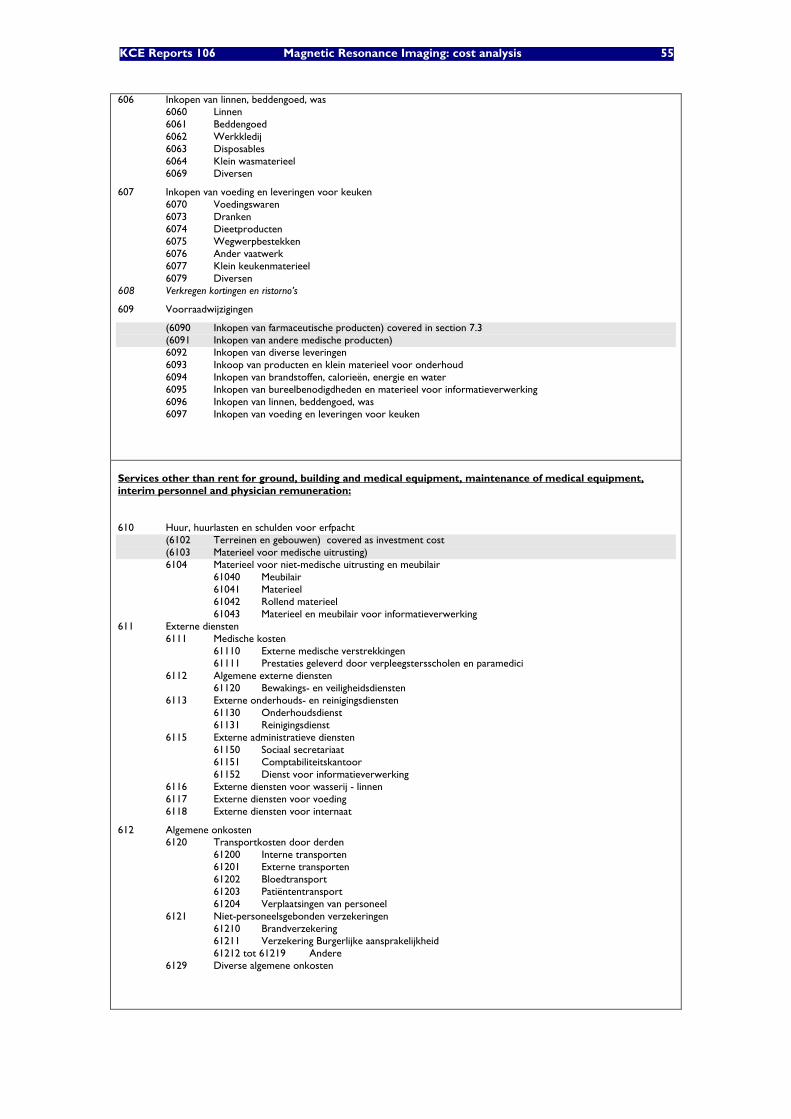
KCE Reports 106 Magnetic Resonance Imaging: cost analysis 55
606 Inkopen van linnen, beddengoed, was 6060 Linnen 6061 Beddengoed 6062 Werkkledij 6063 Disposables 6064 Klein wasmaterieel 6069 Diversen
607 Inkopen van voeding en leveringen voor keuken 6070 Voedingswaren 6073 Dranken 6074 Dieetproducten 6075 Wegwerpbestekken 6076 Ander vaatwerk 6077 Klein keukenmaterieel 6079 Diversen 608 Verkregen kortingen en ristorno’s
609 Voorraadwijzigingen
(6090 Inkopen van farmaceutische producten) covered in section 7.3 (6091 Inkopen van andere medische producten) 6092 Inkopen van diverse leveringen 6093 Inkoop van producten en klein materieel voor onderhoud 6094 Inkopen van brandstoffen, calorieën, energie en water 6095 Inkopen van bureelbenodigdheden en materieel voor informatieverwerking 6096 Inkopen van linnen, beddengoed, was 6097 Inkopen van voeding en leveringen voor keuken
Services other than rent for ground, building and medical equipment, maintenance of medical equipment, interim personnel and physician remuneration:
610 Huur, huurlasten en schulden voor erfpacht (6102 Terreinen en gebouwen) covered as investment cost (6103 Materieel voor medische uitrusting) 6104 Materieel voor niet-medische uitrusting en meubilair 61040 Meubilair 61041 Materieel 61042 Rollend materieel 61043 Materieel en meubilair voor informatieverwerking
611 Externe diensten 6111 Medische kosten 61110 Externe medische verstrekkingen 61111 Prestaties geleverd door verpleegstersscholen en paramedici 6112 Algemene externe diensten 61120 Bewakings- en veiligheidsdiensten 6113 Externe onderhouds- en reinigingsdiensten 61130 Onderhoudsdienst 61131 Reinigingsdienst 6115 Externe administratieve diensten 61150 Sociaal secretariaat 61151 Comptabiliteitskantoor 61152 Dienst voor informatieverwerking 6116 Externe diensten voor wasserij - linnen 6117 Externe diensten voor voeding 6118 Externe diensten voor internaat
612 Algemene onkosten 6120 Transportkosten door derden 61200 Interne transporten 61201 Externe transporten 61202 Bloedtransport 61203 Patiëntentransport 61204 Verplaatsingen van personeel 6121 Niet-personeelsgebonden verzekeringen 61210 Brandverzekering 61211 Verzekering Burgerlijke aansprakelijkheid 61212 tot 61219 Andere 6129 Diverse algemene onkosten
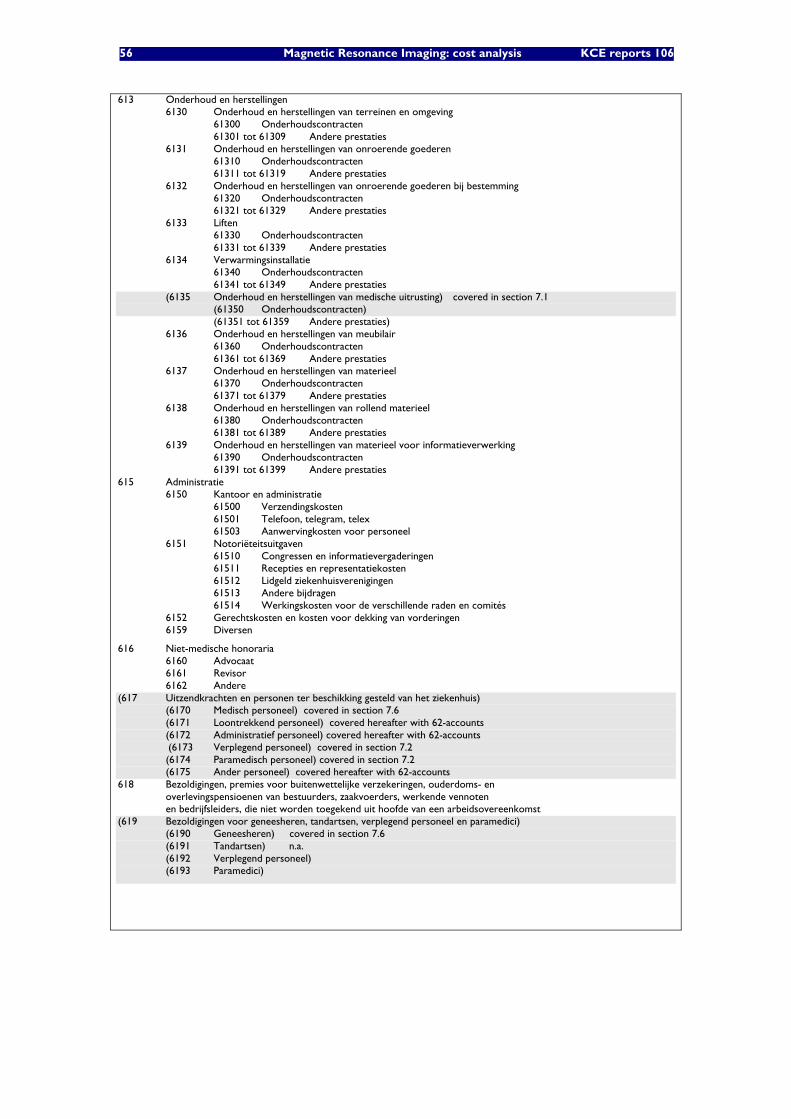
56 Magnetic Resonance Imaging: cost analysis KCE reports 106
613 Onderhoud en herstellingen 6130 Onderhoud en herstellingen van terreinen en omgeving 61300 Onderhoudscontracten 61301 tot 61309 Andere prestaties 6131 Onderhoud en herstellingen van onroerende goederen 61310 Onderhoudscontracten 61311 tot 61319 Andere prestaties 6132 Onderhoud en herstellingen van onroerende goederen bij bestemming 61320 Onderhoudscontracten 61321 tot 61329 Andere prestaties 6133 Liften 61330 Onderhoudscontracten 61331 tot 61339 Andere prestaties 6134 Verwarmingsinstallatie 61340 Onderhoudscontracten 61341 tot 61349 Andere prestaties (6135 Onderhoud en herstellingen van medische uitrusting) covered in section 7.1 (61350 Onderhoudscontracten) (61351 tot 61359 Andere prestaties) 6136 Onderhoud en herstellingen van meubilair 61360 Onderhoudscontracten 61361 tot 61369 Andere prestaties 6137 Onderhoud en herstellingen van materieel 61370 Onderhoudscontracten 61371 tot 61379 Andere prestaties 6138 Onderhoud en herstellingen van rollend materieel 61380 Onderhoudscontracten 61381 tot 61389 Andere prestaties 6139 Onderhoud en herstellingen van materieel voor informatieverwerking 61390 Onderhoudscontracten 61391 tot 61399 Andere prestaties
615 Administratie 6150 Kantoor en administratie 61500 Verzendingskosten 61501 Telefoon, telegram, telex 61503 Aanwervingkosten voor personeel 6151 Notoriëteitsuitgaven 61510 Congressen en informatievergaderingen 61511 Recepties en representatiekosten 61512 Lidgeld ziekenhuisverenigingen 61513 Andere bijdragen 61514 Werkingskosten voor de verschillende raden en comités 6152 Gerechtskosten en kosten voor dekking van vorderingen 6159 Diversen
616 Niet-medische honoraria 6160 Advocaat 6161 Revisor 6162 Andere
(617 Uitzendkrachten en personen ter beschikking gesteld van het ziekenhuis) (6170 Medisch personeel) covered in section 7.6 (6171 Loontrekkend personeel) covered hereafter with 62-accounts (6172 Administratief personeel) covered hereafter with 62-accounts
(6173 Verplegend personeel) covered in section 7.2 (6174 Paramedisch personeel) covered in section 7.2 (6175 Ander personeel) covered hereafter with 62-accounts
618 Bezoldigingen, premies voor buitenwettelijke verzekeringen, ouderdoms- en overlevingspensioenen van bestuurders, zaakvoerders, werkende vennoten en bedrijfsleiders, die niet worden toegekend uit hoofde van een arbeidsovereenkomst
(619 Bezoldigingen voor geneesheren, tandartsen, verplegend personeel en paramedici) (6190 Geneesheren) covered in section 7.6 (6191 Tandartsen) n.a. (6192 Verplegend personeel) (6193 Paramedici)
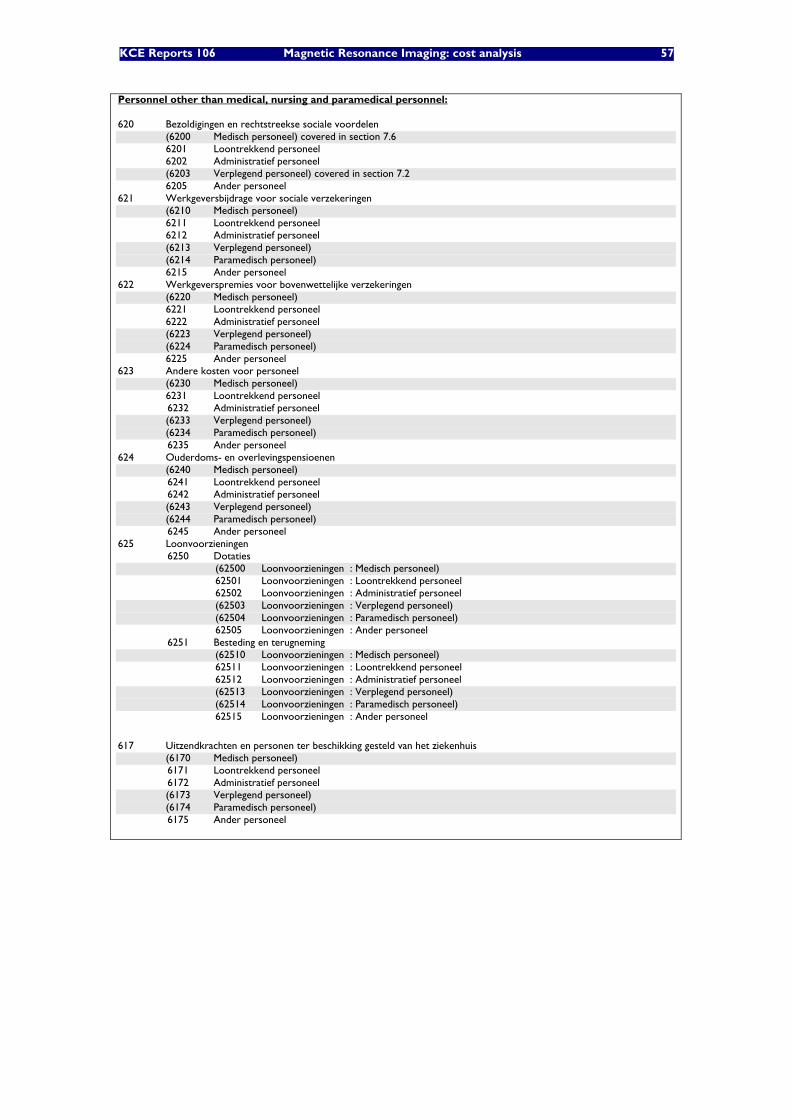
KCE Reports 106 Magnetic Resonance Imaging: cost analysis 57
Personnel other than medical, nursing and paramedical personnel: 620 Bezoldigingen en rechtstreekse sociale voordelen (6200 Medisch personeel) covered in section 7.6 6201 Loontrekkend personeel 6202 Administratief personeel (6203 Verplegend personeel) covered in section 7.2 6205 Ander personeel 621 Werkgeversbijdrage voor sociale verzekeringen (6210 Medisch personeel) 6211 Loontrekkend personeel 6212 Administratief personeel (6213 Verplegend personeel) (6214 Paramedisch personeel) 6215 Ander personeel 622 Werkgeverspremies voor bovenwettelijke verzekeringen (6220 Medisch personeel) 6221 Loontrekkend personeel 6222 Administratief personeel (6223 Verplegend personeel) (6224 Paramedisch personeel) 6225 Ander personeel 623 Andere kosten voor personeel (6230 Medisch personeel) 6231 Loontrekkend personeel
6232 Administratief personeel (6233 Verplegend personeel) (6234 Paramedisch personeel)
6235 Ander personeel 624 Ouderdoms- en overlevingspensioenen (6240 Medisch personeel)
6241 Loontrekkend personeel 6242 Administratief personeel
(6243 Verplegend personeel) (6244 Paramedisch personeel)
6245 Ander personeel 625 Loonvoorzieningen
6250 Dotaties (62500 Loonvoorzieningen : Medisch personeel) 62501 Loonvoorzieningen : Loontrekkend personeel 62502 Loonvoorzieningen : Administratief personeel (62503 Loonvoorzieningen : Verplegend personeel) (62504 Loonvoorzieningen : Paramedisch personeel) 62505 Loonvoorzieningen : Ander personeel
6251 Besteding en terugneming (62510 Loonvoorzieningen : Medisch personeel) 62511 Loonvoorzieningen : Loontrekkend personeel 62512 Loonvoorzieningen : Administratief personeel (62513 Loonvoorzieningen : Verplegend personeel) (62514 Loonvoorzieningen : Paramedisch personeel) 62515 Loonvoorzieningen : Ander personeel
617 Uitzendkrachten en personen ter beschikking gesteld van het ziekenhuis (6170 Medisch personeel)
6171 Loontrekkend personeel 6172 Administratief personeel
(6173 Verplegend personeel) (6174 Paramedisch personeel)
6175 Ander personeel
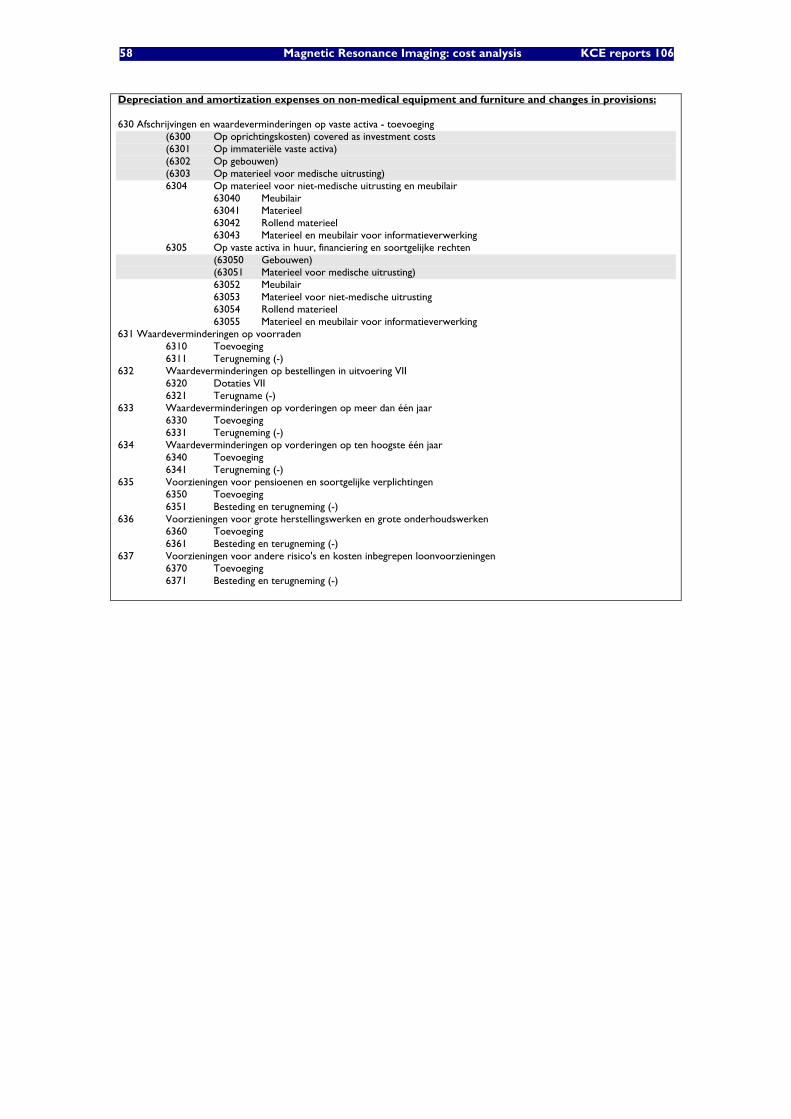
58 Magnetic Resonance Imaging: cost analysis KCE reports 106
Depreciation and amortization expenses on non-medical equipment and furniture and changes in provisions:
630 Afschrijvingen en waardeverminderingen op vaste activa - toevoeging (6300 Op oprichtingskosten) covered as investment costs (6301 Op immateriële vaste activa) (6302 Op gebouwen) (6303 Op materieel voor medische uitrusting) 6304 Op materieel voor niet-medische uitrusting en meubilair 63040 Meubilair 63041 Materieel 63042 Rollend materieel 63043 Materieel en meubilair voor informatieverwerking 6305 Op vaste activa in huur, financiering en soortgelijke rechten (63050 Gebouwen) (63051 Materieel voor medische uitrusting) 63052 Meubilair 63053 Materieel voor niet-medische uitrusting 63054 Rollend materieel 63055 Materieel en meubilair voor informatieverwerking 631 Waardeverminderingen op voorraden 6310 Toevoeging 6311 Terugneming (-) 632 Waardeverminderingen op bestellingen in uitvoering VII
6320 Dotaties VII 6321 Terugname (-)
633 Waardeverminderingen op vorderingen op meer dan één jaar 6330 Toevoeging 6331 Terugneming (-)
634 Waardeverminderingen op vorderingen op ten hoogste één jaar 6340 Toevoeging 6341 Terugneming (-)
635 Voorzieningen voor pensioenen en soortgelijke verplichtingen 6350 Toevoeging 6351 Besteding en terugneming (-)
636 Voorzieningen voor grote herstellingswerken en grote onderhoudswerken 6360 Toevoeging 6361 Besteding en terugneming (-)
637 Voorzieningen voor andere risico's en kosten inbegrepen loonvoorzieningen 6370 Toevoeging 6371 Besteding en terugneming (-)
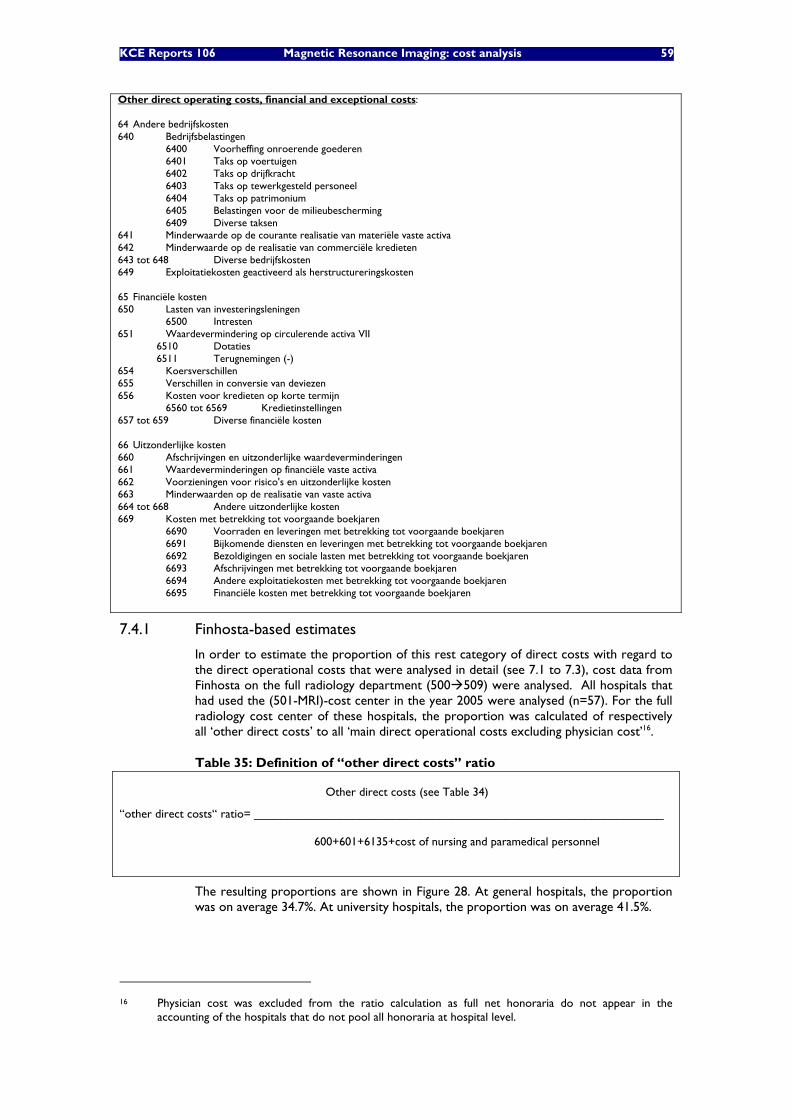
KCE Reports 106 Magnetic Resonance Imaging: cost analysis 59
Other direct operating costs, financial and exceptional costs:
64 Andere bedrijfskosten 640 Bedrijfsbelastingen 6400 Voorheffing onroerende goederen 6401 Taks op voertuigen 6402 Taks op drijfkracht 6403 Taks op tewerkgesteld personeel 6404 Taks op patrimonium 6405 Belastingen voor de milieubescherming 6409 Diverse taksen 641 Minderwaarde op de courante realisatie van materiële vaste activa 642 Minderwaarde op de realisatie van commerciële kredieten 643 tot 648 Diverse bedrijfskosten 649 Exploitatiekosten geactiveerd als herstructureringskosten 65 Financiële kosten 650 Lasten van investeringsleningen 6500 Intresten 651 Waardevermindering op circulerende activa VII 6510 Dotaties 6511 Terugnemingen (-) 654 Koersverschillen 655 Verschillen in conversie van deviezen 656 Kosten voor kredieten op korte termijn 6560 tot 6569 Kredietinstellingen 657 tot 659 Diverse financiële kosten 66 Uitzonderlijke kosten 660 Afschrijvingen en uitzonderlijke waardeverminderingen 661 Waardeverminderingen op financiële vaste activa 662 Voorzieningen voor risico's en uitzonderlijke kosten 663 Minderwaarden op de realisatie van vaste activa 664 tot 668 Andere uitzonderlijke kosten 669 Kosten met betrekking tot voorgaande boekjaren 6690 Voorraden en leveringen met betrekking tot voorgaande boekjaren 6691 Bijkomende diensten en leveringen met betrekking tot voorgaande boekjaren 6692 Bezoldigingen en sociale lasten met betrekking tot voorgaande boekjaren 6693 Afschrijvingen met betrekking tot voorgaande boekjaren 6694 Andere exploitatiekosten met betrekking tot voorgaande boekjaren 6695 Financiële kosten met betrekking tot voorgaande boekjaren
7.4.1 Finhosta-based estimates
In order to estimate the proportion of this rest category of direct costs with regard to the direct operational costs that were analysed in detail (see 7.1 to 7.3), cost data from Finhosta on the full radiology department (500 509) were analysed. All hospitals that had used the (501-MRI)-cost center in the year 2005 were analysed (n=57). For the full radiology cost center of these hospitals, the proportion was calculated of respectively all ‘other direct costs’ to all ‘main direct operational costs excluding physician cost’16.
Table 35: Definition of “other direct costs” ratio
Other direct costs (see Table 34)
“other direct costs“ ratio= ______________________________________________________________
600+601+6135+cost of nursing and paramedical personnel
The resulting proportions are shown in Figure 28. At general hospitals, the proportion was on average 34.7%. At university hospitals, the proportion was on average 41.5%.
16 Physician cost was excluded from the ratio calculation as full net honoraria do not appear in the
accounting of the hospitals that do not pool all honoraria at hospital level.
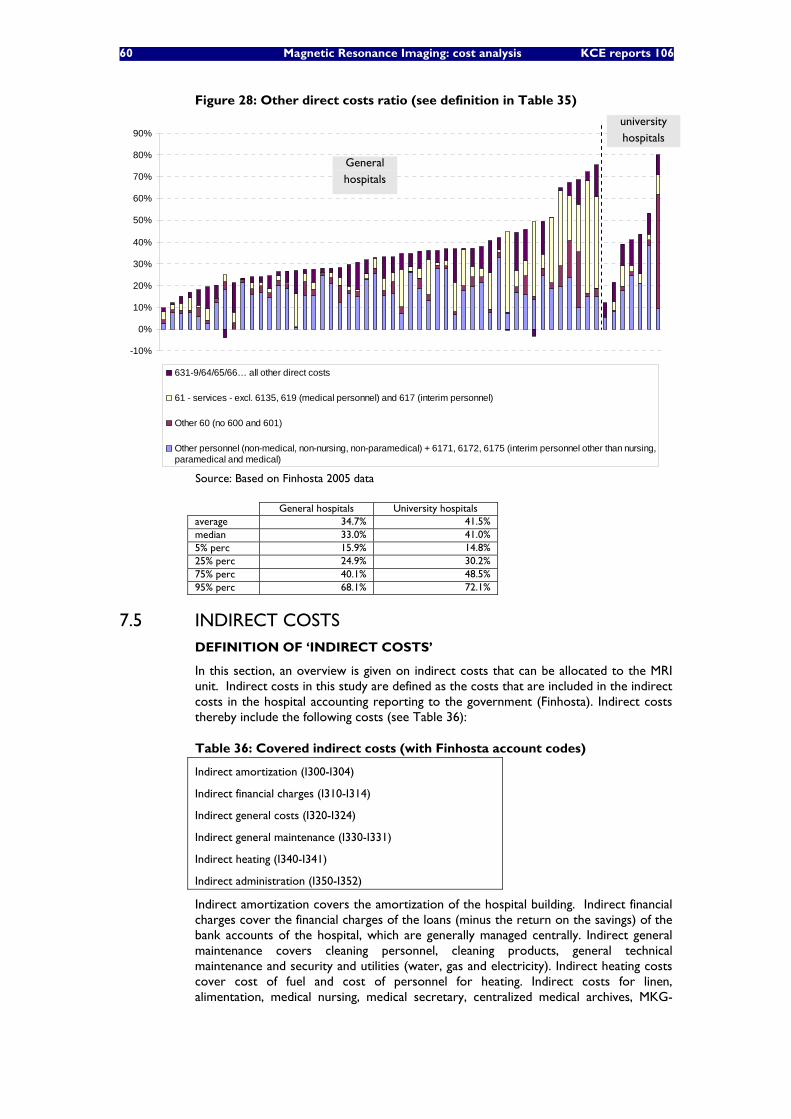
60 Magnetic Resonance Imaging: cost analysis KCE reports 106
Figure 28: Other direct costs ratio (see definition in Table 35)
-10%
0%
10%
20%
30%
40%
50%
60%
70%
80%
90%
631-9/64/65/66… all other direct costs
61 - services - excl. 6135, 619 (medical personnel) and 617 (interim personnel)
Other 60 (no 600 and 601)
Other personnel (non-medical, non-nursing, non-paramedical) + 6171, 6172, 6175 (interim personnel other than nursing,paramedical and medical)
Source: Based on Finhosta 2005 data
General hospitals University hospitals average 34.7% 41.5% median 33.0% 41.0% 5% perc 15.9% 14.8% 25% perc 24.9% 30.2% 75% perc 40.1% 48.5% 95% perc 68.1% 72.1%
7.5 INDIRECT COSTS DEFINITION OF ‘INDIRECT COSTS’
In this section, an overview is given on indirect costs that can be allocated to the MRI unit. Indirect costs in this study are defined as the costs that are included in the indirect costs in the hospital accounting reporting to the government (Finhosta). Indirect costs thereby include the following costs (see Table 36):
Table 36: Covered indirect costs (with Finhosta account codes)
Indirect amortization (I300-I304)
Indirect financial charges (I310-I314)
Indirect general costs (I320-I324)
Indirect general maintenance (I330-I331)
Indirect heating (I340-I341)
Indirect administration (I350-I352)
Indirect amortization covers the amortization of the hospital building. Indirect financial charges cover the financial charges of the loans (minus the return on the savings) of the bank accounts of the hospital, which are generally managed centrally. Indirect general maintenance covers cleaning personnel, cleaning products, general technical maintenance and security and utilities (water, gas and electricity). Indirect heating costs cover cost of fuel and cost of personnel for heating. Indirect costs for linen, alimentation, medical nursing, medical secretary, centralized medical archives, MKG-
General hospitals
university hospitals
KCE Reports 106 Magnetic Resonance Imaging: cost analysis 61
RCM data and sterilization costs have not been considered as they are considered marginal.
ALLOCATION OF ‘INDIRECT COSTS’
In the Finhosta data, indirect costs are allocated using the following allocation keys:
• number of m² for indirect amortization, financial charges, general costs, general maintenance (including electricity, water etc.), and heating;
• number of FTEs for indirect administration
In spite of their limitations (as described in the next section), these allocation keys will also be used in this cost analysis.
LIMITATIONS OF INDIRECT COST ESTIMATES
It can be argued that allocation of indirect costs in the Finhosta (and general) accounting data does not necessarily reflect a rational allocation of costs. Indeed, the use of predefined allocation keys will never perfectly fit reality. Furthermore, hospitals may vary the value of the allocation keys (and thus the cost apportionment) in function of the financial strength and cost bearing capacity of the service. For an ideal cost analysis, all indirect costs are split up and regrouped in homogenous groups of costs for which a collective allocation key can be defined which has a clear causal relationship to the cost items. However, in the real world, an unambiguous causal relationship is often missing and therefore, cost allocation can only be arbitrary for those items The approach in this study was therefore based on Finhosta data as it was considered the most time-efficient source for providing estimates on this large and heterogenous rest category of costs.
Indirect financial charges generally comprise the loans for the hospital building, central services and central activities but also for the different services within the hospital, amongst which radiology and MRI. As it is not possible to split the reported indirect financial charges into central financial charges versus financial charges which are directly linked to specific services (but which are nevertheless reported under indirect costs in the accounting), it was decided to include all of the indirect financial charges, although the financial charges for MRI and building adaptations have already been included separately in the yearly investment cost in section 6.4. By doing so, there may thus be some double counting of financial charges. Another limitation of the reported indirect financial charges is that they only take into account the cost of debts but not the cost of equity. The possibility to include the notional interest (cost of equity) in the accounting was only possible in Belgium from the year 2006 onwards. In fact a weighted average cost of capital (WACC) for hospitals could be calculated to include both costs of equity and debt.
Although electricity consumption of the MRI unit is expected to be higher than the average of other hospital services, this has not been taken into account in this analysis as it could not be calculated what proportion of the actual electricity consumption is already covered in the indirect costs allocated per m2.
This section is structured as follows. Firstly, an overview is given of the indirect costs that are allocated by m² (in section 7.5.1). Secondly, an overview is given of indirect costs that are allocated by number of FTEs (in section 7.5.2).
7.5.1 Indirect costs allocated by m²
Indirect amortization, financial charges, general costs, general maintenance (including electricity, water etc.), and heating are allocated to the different cost centers based on the number of m².
In Figure 29 to Figure 34, the indirect costs per m² are shown as deducted from Finhosta 2005 figures of those hospitals that had used the (501)-MRI-cost center in that year (n=57).
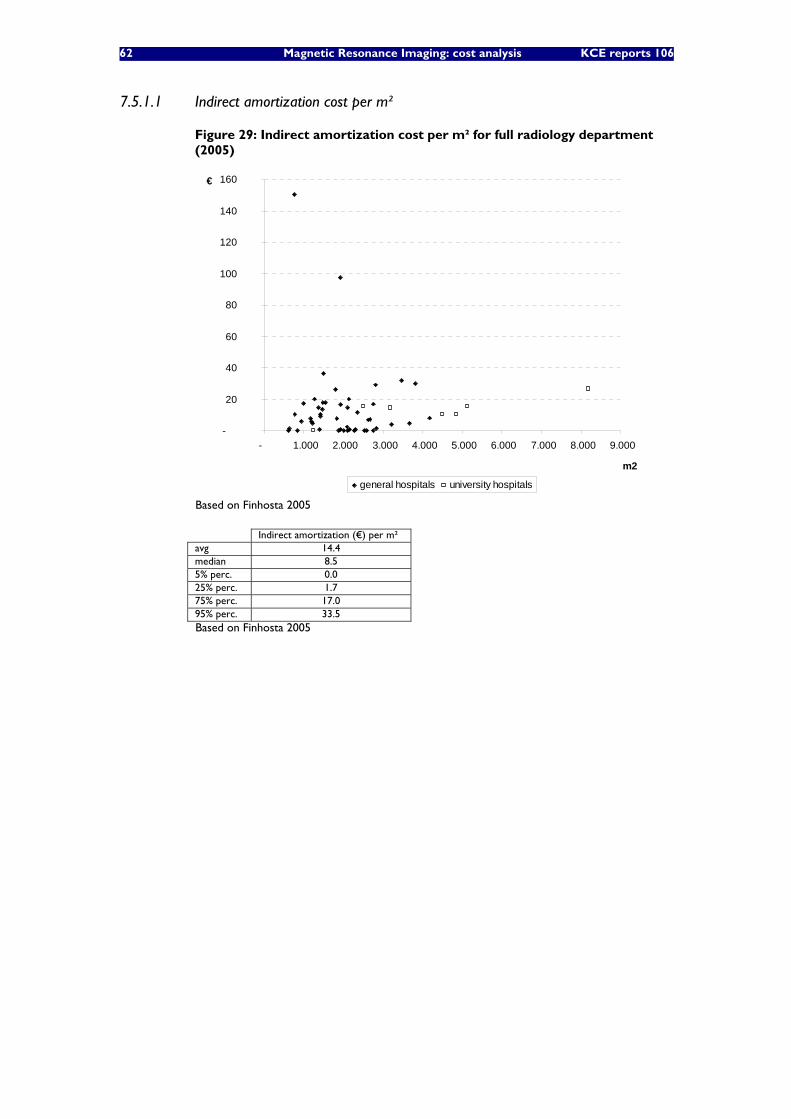
62 Magnetic Resonance Imaging: cost analysis KCE reports 106
7.5.1.1 Indirect amortization cost per m²
Figure 29: Indirect amortization cost per m² for full radiology department (2005)
-
20
40
60
80
100
120
140
160
- 1.000 2.000 3.000 4.000 5.000 6.000 7.000 8.000 9.000
m2
€
general hospitals university hospitals
Based on Finhosta 2005
Indirect amortization (€) per m² avg 14.4 median 8.5 5% perc. 0.0 25% perc. 1.7 75% perc. 17.0 95% perc. 33.5 Based on Finhosta 2005
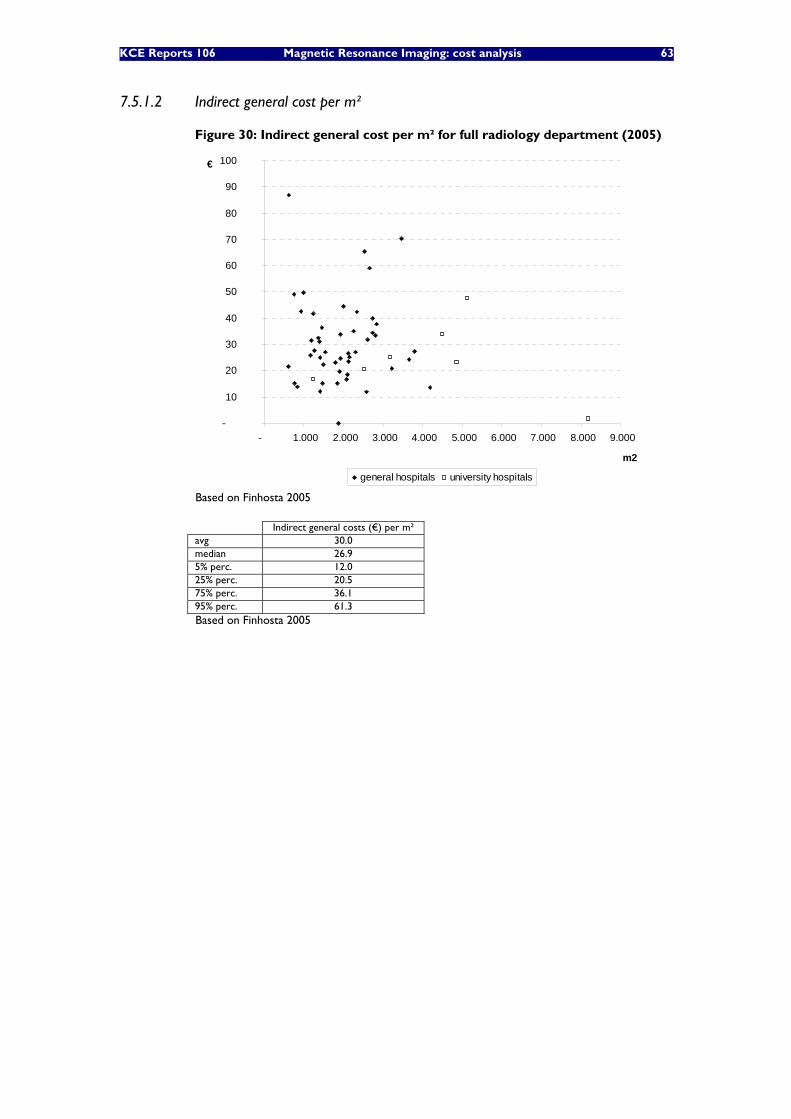
KCE Reports 106 Magnetic Resonance Imaging: cost analysis 63
7.5.1.2 Indirect general cost per m²
Figure 30: Indirect general cost per m² for full radiology department (2005)
-
10
20
30
40
50
60
70
80
90
100
- 1.000 2.000 3.000 4.000 5.000 6.000 7.000 8.000 9.000
m2
€
general hospitals university hospitals
Based on Finhosta 2005
Indirect general costs (€) per m² avg 30.0 median 26.9 5% perc. 12.0 25% perc. 20.5 75% perc. 36.1 95% perc. 61.3 Based on Finhosta 2005
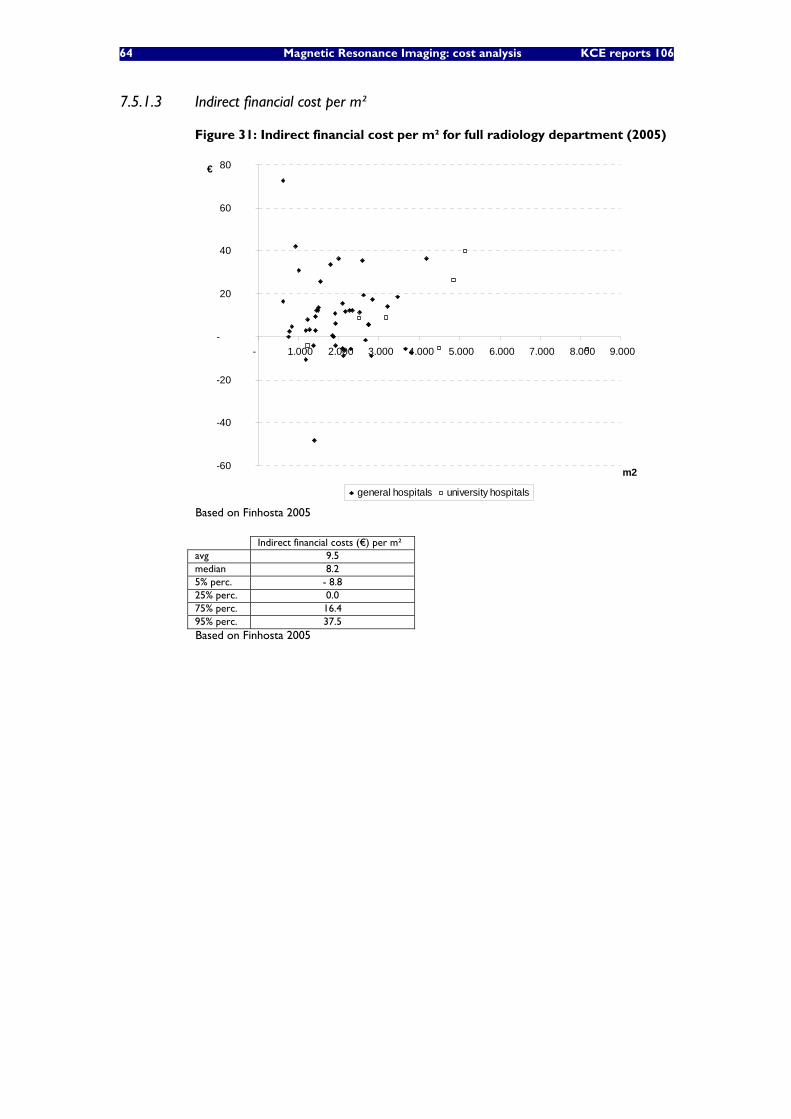
64 Magnetic Resonance Imaging: cost analysis KCE reports 106
7.5.1.3 Indirect financial cost per m²
Figure 31: Indirect financial cost per m² for full radiology department (2005)
-60
-40
-20
-
20
40
60
80
- 1.000 2.000 3.000 4.000 5.000 6.000 7.000 8.000 9.000
m2
€
general hospitals university hospitals
Based on Finhosta 2005
Indirect financial costs (€) per m² avg 9.5 median 8.2 5% perc. - 8.8 25% perc. 0.0 75% perc. 16.4 95% perc. 37.5 Based on Finhosta 2005
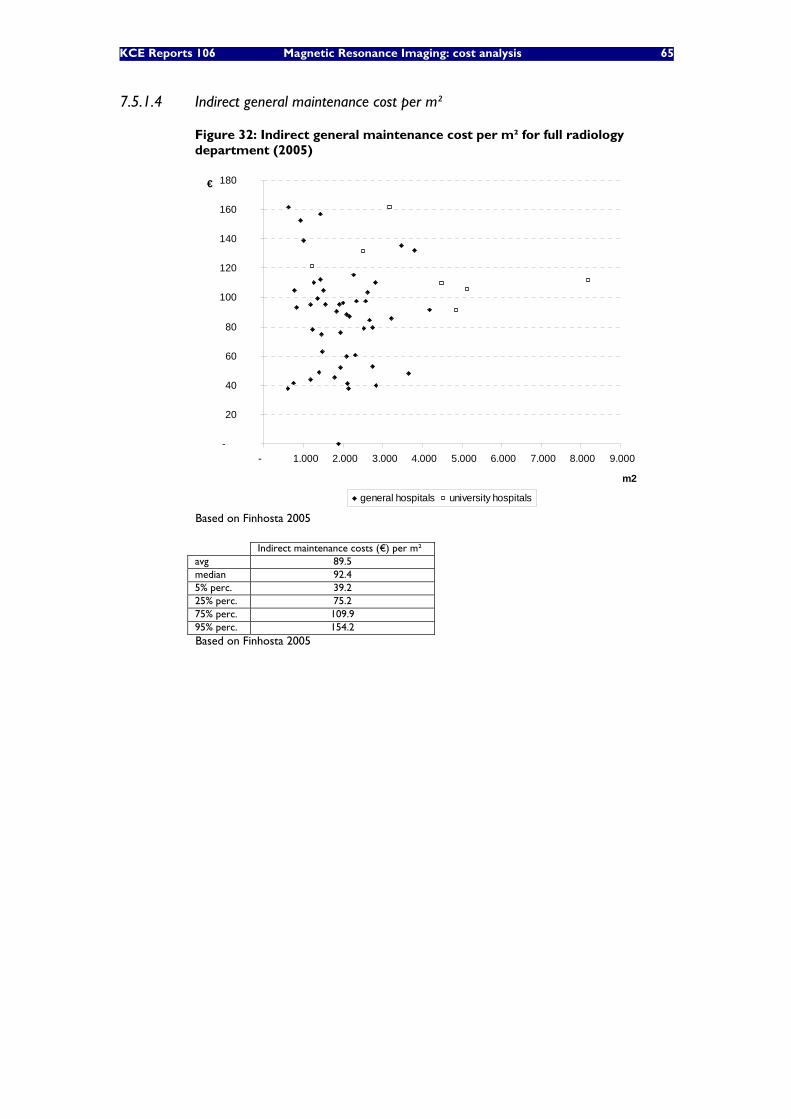
KCE Reports 106 Magnetic Resonance Imaging: cost analysis 65
7.5.1.4 Indirect general maintenance cost per m²
Figure 32: Indirect general maintenance cost per m² for full radiology department (2005)
-
20
40
60
80
100
120
140
160
180
- 1.000 2.000 3.000 4.000 5.000 6.000 7.000 8.000 9.000
m2
€
general hospitals university hospitals
Based on Finhosta 2005
Indirect maintenance costs (€) per m² avg 89.5 median 92.4 5% perc. 39.2 25% perc. 75.2 75% perc. 109.9 95% perc. 154.2 Based on Finhosta 2005
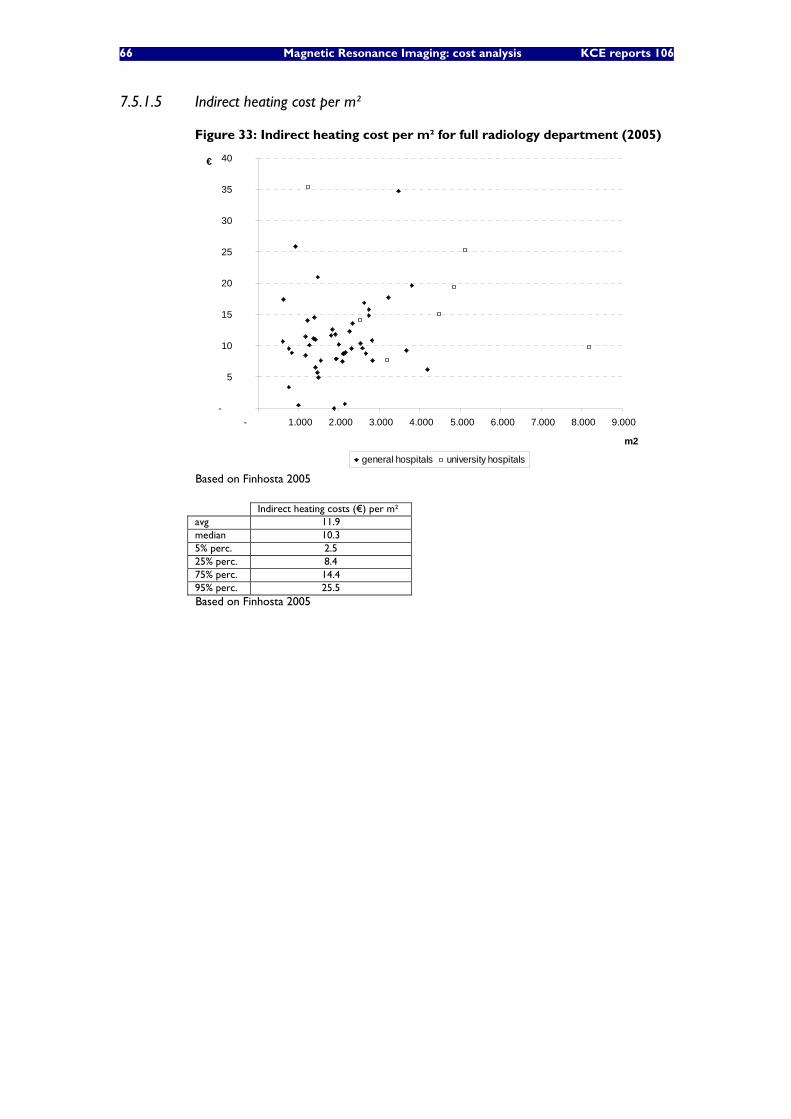
66 Magnetic Resonance Imaging: cost analysis KCE reports 106
7.5.1.5 Indirect heating cost per m²
Figure 33: Indirect heating cost per m² for full radiology department (2005)
-
5
10
15
20
25
30
35
40
- 1.000 2.000 3.000 4.000 5.000 6.000 7.000 8.000 9.000
m2
€
general hospitals university hospitals
Based on Finhosta 2005
Indirect heating costs (€) per m² avg 11.9 median 10.3 5% perc. 2.5 25% perc. 8.4 75% perc. 14.4 95% perc. 25.5 Based on Finhosta 2005
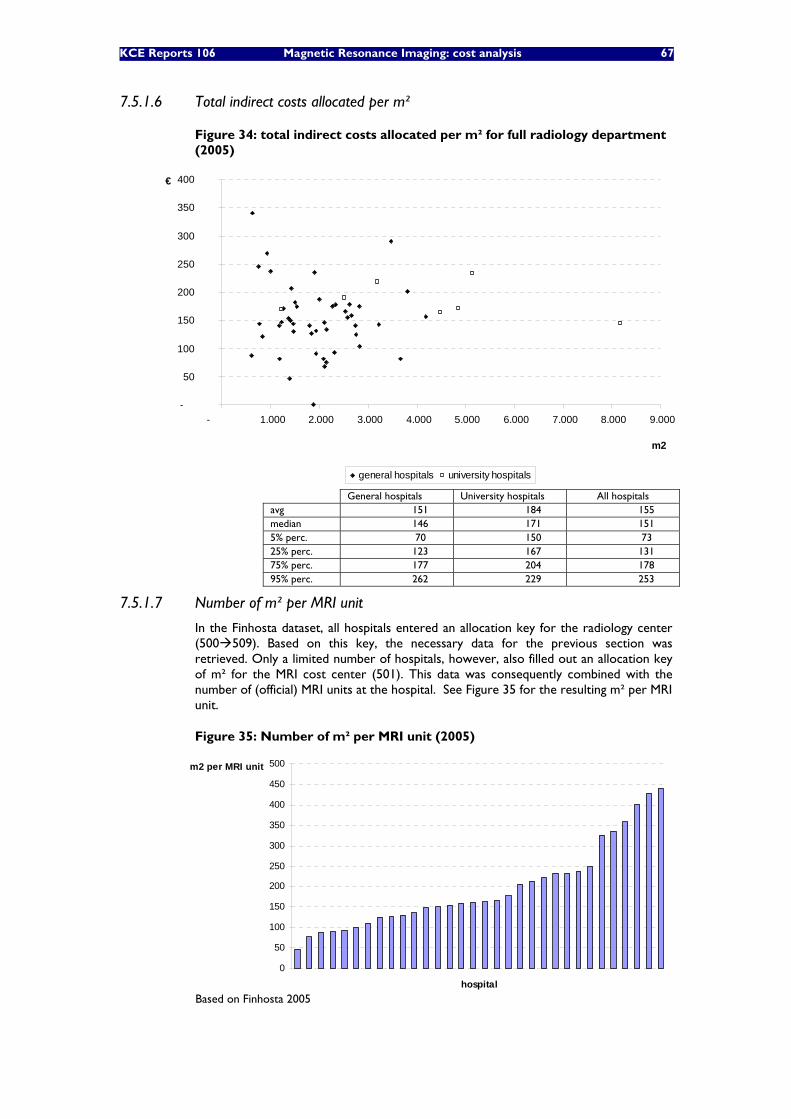
KCE Reports 106 Magnetic Resonance Imaging: cost analysis 67
7.5.1.6 Total indirect costs allocated per m²
Figure 34: total indirect costs allocated per m² for full radiology department (2005)
-
50
100
150
200
250
300
350
400
- 1.000 2.000 3.000 4.000 5.000 6.000 7.000 8.000 9.000
m2
€
general hospitals university hospitals
General hospitals University hospitals All hospitals avg 151 184 155 median 146 171 151 5% perc. 70 150 73 25% perc. 123 167 131 75% perc. 177 204 178 95% perc. 262 229 253
7.5.1.7 Number of m² per MRI unit
In the Finhosta dataset, all hospitals entered an allocation key for the radiology center (500 509). Based on this key, the necessary data for the previous section was retrieved. Only a limited number of hospitals, however, also filled out an allocation key of m² for the MRI cost center (501). This data was consequently combined with the number of (official) MRI units at the hospital. See Figure 35 for the resulting m² per MRI unit.
Figure 35: Number of m² per MRI unit (2005)
0
50
100
150
200
250
300
350
400
450
500
hospital
m2 per MRI unit
Based on Finhosta 2005
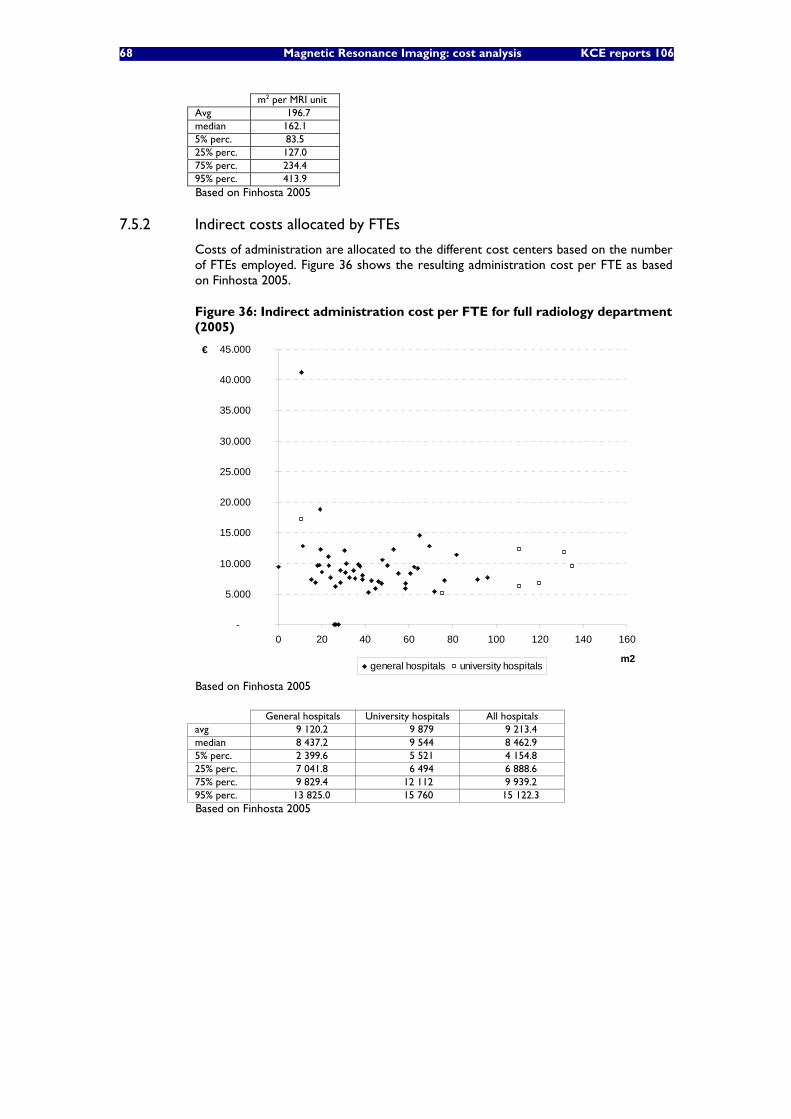
68 Magnetic Resonance Imaging: cost analysis KCE reports 106
m2 per MRI unit Avg 196.7 median 162.1 5% perc. 83.5 25% perc. 127.0 75% perc. 234.4 95% perc. 413.9 Based on Finhosta 2005
7.5.2 Indirect costs allocated by FTEs
Costs of administration are allocated to the different cost centers based on the number of FTEs employed. Figure 36 shows the resulting administration cost per FTE as based on Finhosta 2005.
Figure 36: Indirect administration cost per FTE for full radiology department (2005)
-
5.000
10.000
15.000
20.000
25.000
30.000
35.000
40.000
45.000
0 20 40 60 80 100 120 140 160
m2
€
general hospitals university hospitals
Based on Finhosta 2005
General hospitals University hospitals All hospitals avg 9 120.2 9 879 9 213.4 median 8 437.2 9 544 8 462.9 5% perc. 2 399.6 5 521 4 154.8 25% perc. 7 041.8 6 494 6 888.6 75% perc. 9 829.4 12 112 9 939.2 95% perc. 13 825.0 15 760 15 122.3 Based on Finhosta 2005
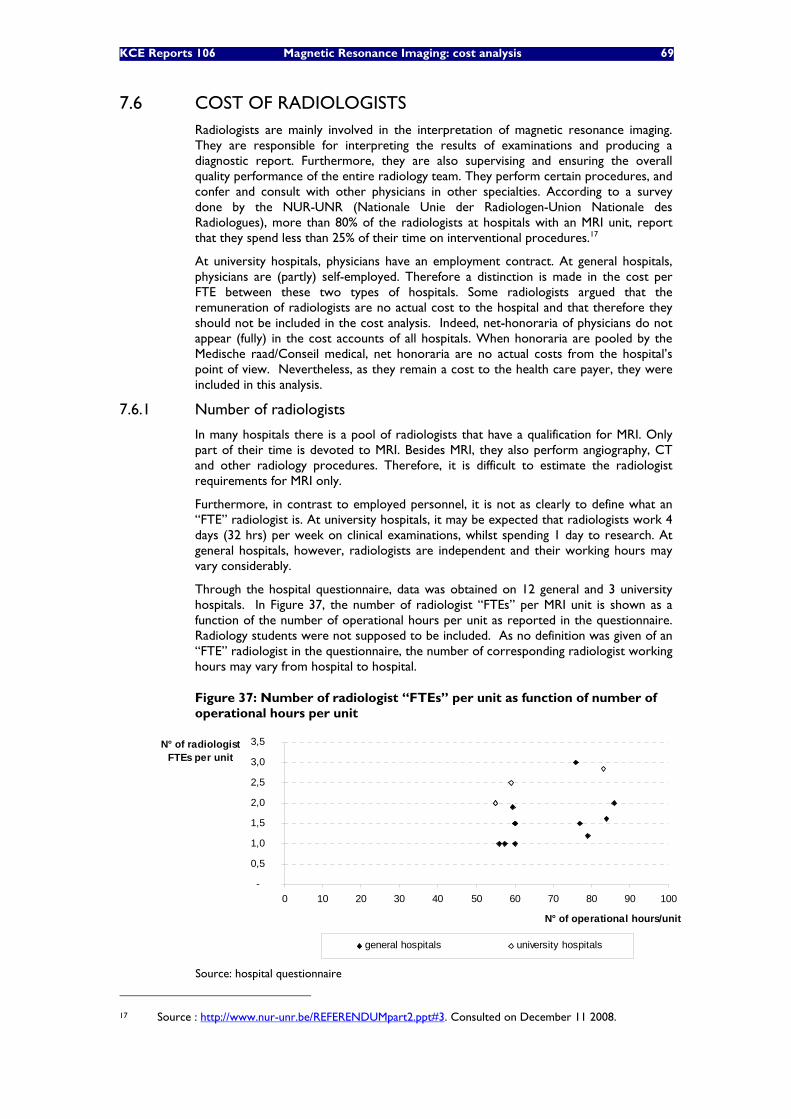
KCE Reports 106 Magnetic Resonance Imaging: cost analysis 69
7.6 COST OF RADIOLOGISTS Radiologists are mainly involved in the interpretation of magnetic resonance imaging. They are responsible for interpreting the results of examinations and producing a diagnostic report. Furthermore, they are also supervising and ensuring the overall quality performance of the entire radiology team. They perform certain procedures, and confer and consult with other physicians in other specialties. According to a survey done by the NUR-UNR (Nationale Unie der Radiologen-Union Nationale des Radiologues), more than 80% of the radiologists at hospitals with an MRI unit, report that they spend less than 25% of their time on interventional procedures.17
At university hospitals, physicians have an employment contract. At general hospitals, physicians are (partly) self-employed. Therefore a distinction is made in the cost per FTE between these two types of hospitals. Some radiologists argued that the remuneration of radiologists are no actual cost to the hospital and that therefore they should not be included in the cost analysis. Indeed, net-honoraria of physicians do not appear (fully) in the cost accounts of all hospitals. When honoraria are pooled by the Medische raad/Conseil medical, net honoraria are no actual costs from the hospital’s point of view. Nevertheless, as they remain a cost to the health care payer, they were included in this analysis.
7.6.1 Number of radiologists
In many hospitals there is a pool of radiologists that have a qualification for MRI. Only part of their time is devoted to MRI. Besides MRI, they also perform angiography, CT and other radiology procedures. Therefore, it is difficult to estimate the radiologist requirements for MRI only.
Furthermore, in contrast to employed personnel, it is not as clearly to define what an “FTE” radiologist is. At university hospitals, it may be expected that radiologists work 4 days (32 hrs) per week on clinical examinations, whilst spending 1 day to research. At general hospitals, however, radiologists are independent and their working hours may vary considerably.
Through the hospital questionnaire, data was obtained on 12 general and 3 university hospitals. In Figure 37, the number of radiologist “FTEs” per MRI unit is shown as a function of the number of operational hours per unit as reported in the questionnaire. Radiology students were not supposed to be included. As no definition was given of an “FTE” radiologist in the questionnaire, the number of corresponding radiologist working hours may vary from hospital to hospital.
Figure 37: Number of radiologist “FTEs” per unit as function of number of operational hours per unit
-
0,5
1,0
1,5
2,0
2,5
3,0
3,5
0 10 20 30 40 50 60 70 80 90 100
N° of operational hours/unit
N° of radiologist FTEs per unit
general hospitals university hospitals
Source: hospital questionnaire
17 Source : http://www.nur-unr.be/REFERENDUMpart2.ppt#3. Consulted on December 11 2008.
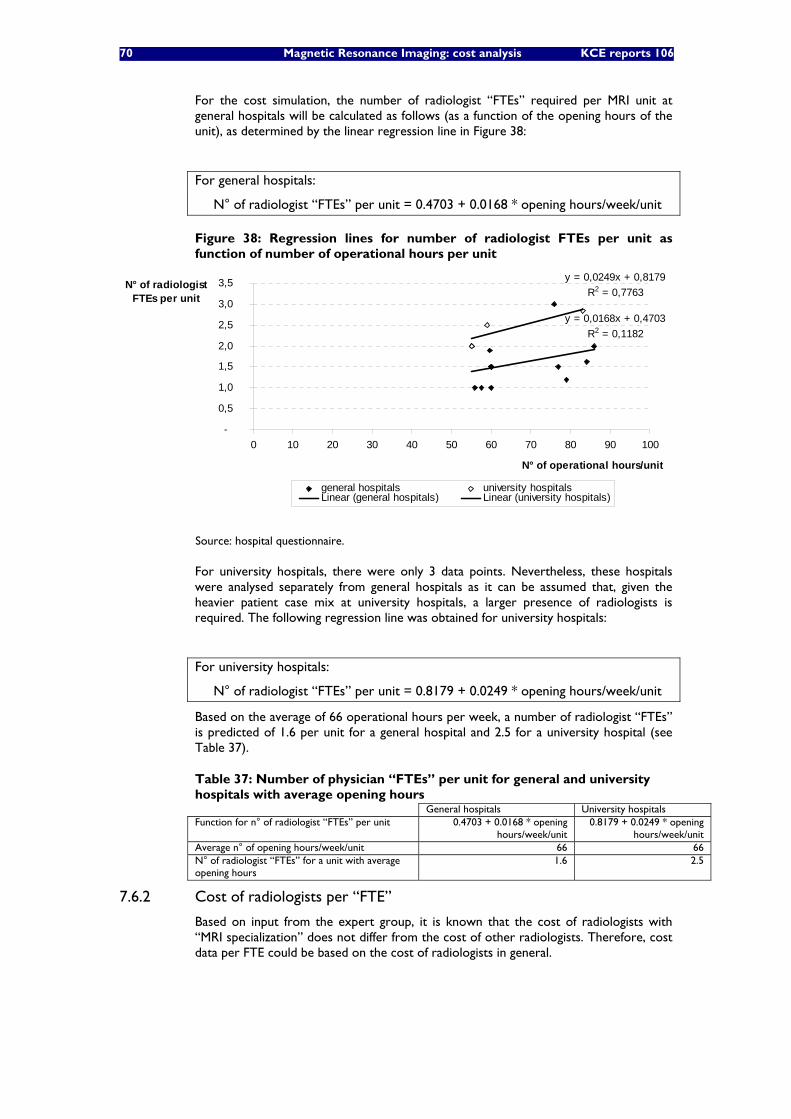
70 Magnetic Resonance Imaging: cost analysis KCE reports 106
For the cost simulation, the number of radiologist “FTEs” required per MRI unit at general hospitals will be calculated as follows (as a function of the opening hours of the unit), as determined by the linear regression line in Figure 38:
For general hospitals:
N° of radiologist “FTEs” per unit = 0.4703 + 0.0168 * opening hours/week/unit
Figure 38: Regression lines for number of radiologist FTEs per unit as function of number of operational hours per unit
y = 0,0168x + 0,4703R2 = 0,1182
y = 0,0249x + 0,8179R2 = 0,7763
-
0,5
1,0
1,5
2,0
2,5
3,0
3,5
0 10 20 30 40 50 60 70 80 90 100
N° of operational hours/unit
N° of radiologist FTEs per unit
general hospitals university hospitalsLinear (general hospitals) Linear (university hospitals)
Source: hospital questionnaire.
For university hospitals, there were only 3 data points. Nevertheless, these hospitals were analysed separately from general hospitals as it can be assumed that, given the heavier patient case mix at university hospitals, a larger presence of radiologists is required. The following regression line was obtained for university hospitals:
For university hospitals:
N° of radiologist “FTEs” per unit = 0.8179 + 0.0249 * opening hours/week/unit
Based on the average of 66 operational hours per week, a number of radiologist “FTEs” is predicted of 1.6 per unit for a general hospital and 2.5 for a university hospital (see Table 37).
Table 37: Number of physician “FTEs” per unit for general and university hospitals with average opening hours General hospitals University hospitals Function for n° of radiologist “FTEs” per unit 0.4703 + 0.0168 * opening
hours/week/unit 0.8179 + 0.0249 * opening
hours/week/unit Average n° of opening hours/week/unit 66 66 N° of radiologist “FTEs” for a unit with average opening hours
1.6 2.5
7.6.2 Cost of radiologists per “FTE”
Based on input from the expert group, it is known that the cost of radiologists with “MRI specialization” does not differ from the cost of other radiologists. Therefore, cost data per FTE could be based on the cost of radiologists in general.
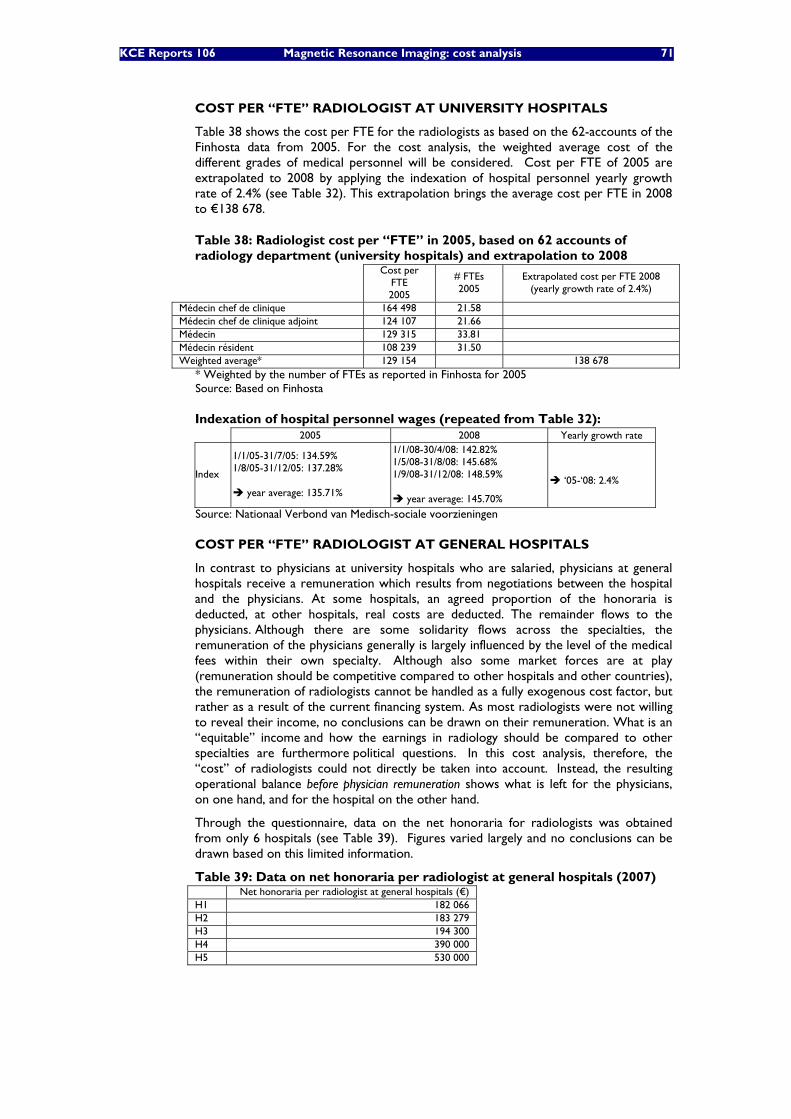
KCE Reports 106 Magnetic Resonance Imaging: cost analysis 71
COST PER “FTE” RADIOLOGIST AT UNIVERSITY HOSPITALS
Table 38 shows the cost per FTE for the radiologists as based on the 62-accounts of the Finhosta data from 2005. For the cost analysis, the weighted average cost of the different grades of medical personnel will be considered. Cost per FTE of 2005 are extrapolated to 2008 by applying the indexation of hospital personnel yearly growth rate of 2.4% (see Table 32). This extrapolation brings the average cost per FTE in 2008 to €138 678.
Table 38: Radiologist cost per “FTE” in 2005, based on 62 accounts of radiology department (university hospitals) and extrapolation to 2008
Cost per
FTE 2005
# FTEs 2005
Extrapolated cost per FTE 2008 (yearly growth rate of 2.4%)
Médecin chef de clinique 164 498 21.58 Médecin chef de clinique adjoint 124 107 21.66 Médecin 129 315 33.81 Médecin résident 108 239 31.50 Weighted average* 129 154 138 678
* Weighted by the number of FTEs as reported in Finhosta for 2005 Source: Based on Finhosta
Indexation of hospital personnel wages (repeated from Table 32): 2005 2008 Yearly growth rate
Index
1/1/05-31/7/05: 134.59% 1/8/05-31/12/05: 137.28%
year average: 135.71%
1/1/08-30/4/08: 142.82% 1/5/08-31/8/08: 145.68% 1/9/08-31/12/08: 148.59%
year average: 145.70%
‘05-‘08: 2.4%
Source: Nationaal Verbond van Medisch-sociale voorzieningen
COST PER “FTE” RADIOLOGIST AT GENERAL HOSPITALS
In contrast to physicians at university hospitals who are salaried, physicians at general hospitals receive a remuneration which results from negotiations between the hospital and the physicians. At some hospitals, an agreed proportion of the honoraria is deducted, at other hospitals, real costs are deducted. The remainder flows to the physicians. Although there are some solidarity flows across the specialties, the remuneration of the physicians generally is largely influenced by the level of the medical fees within their own specialty. Although also some market forces are at play (remuneration should be competitive compared to other hospitals and other countries), the remuneration of radiologists cannot be handled as a fully exogenous cost factor, but rather as a result of the current financing system. As most radiologists were not willing to reveal their income, no conclusions can be drawn on their remuneration. What is an “equitable” income and how the earnings in radiology should be compared to other specialties are furthermore political questions. In this cost analysis, therefore, the “cost” of radiologists could not directly be taken into account. Instead, the resulting operational balance before physician remuneration shows what is left for the physicians, on one hand, and for the hospital on the other hand.
Through the questionnaire, data on the net honoraria for radiologists was obtained from only 6 hospitals (see Table 39). Figures varied largely and no conclusions can be drawn based on this limited information.
Table 39: Data on net honoraria per radiologist at general hospitals (2007) Net honoraria per radiologist at general hospitals (€) H1 182 066 H2 183 279 H3 194 300 H4 390 000 H5 530 000
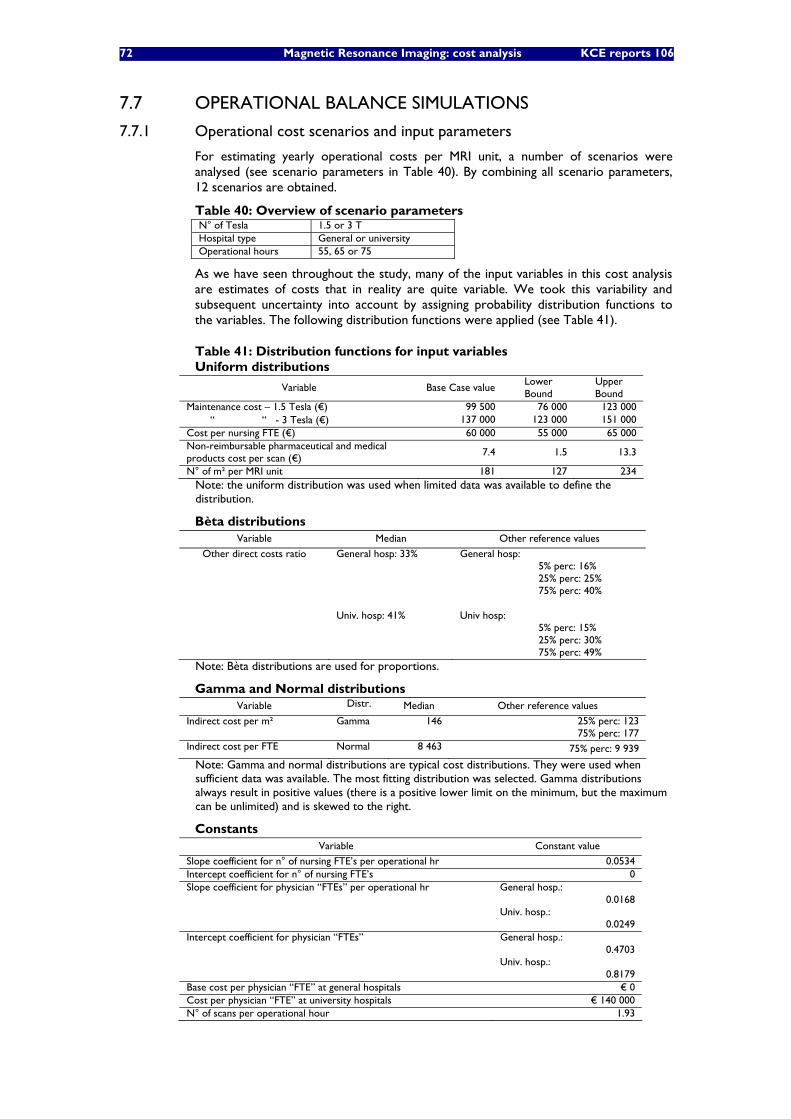
72 Magnetic Resonance Imaging: cost analysis KCE reports 106
7.7 OPERATIONAL BALANCE SIMULATIONS
7.7.1 Operational cost scenarios and input parameters
For estimating yearly operational costs per MRI unit, a number of scenarios were analysed (see scenario parameters in Table 40). By combining all scenario parameters, 12 scenarios are obtained.
Table 40: Overview of scenario parameters N° of Tesla 1.5 or 3 T Hospital type General or university Operational hours 55, 65 or 75
As we have seen throughout the study, many of the input variables in this cost analysis are estimates of costs that in reality are quite variable. We took this variability and subsequent uncertainty into account by assigning probability distribution functions to the variables. The following distribution functions were applied (see Table 41).
Table 41: Distribution functions for input variables Uniform distributions
Variable Base Case value Lower Bound
Upper Bound
Maintenance cost – 1.5 Tesla (€) 99 500 76 000 123 000 “ “ - 3 Tesla (€) 137 000 123 000 151 000 Cost per nursing FTE (€) 60 000 55 000 65 000 Non-reimbursable pharmaceutical and medical products cost per scan (€)
7.4 1.5 13.3
N° of m² per MRI unit 181 127 234 Note: the uniform distribution was used when limited data was available to define the distribution.
Bèta distributions Variable Median Other reference values
Other direct costs ratio General hosp: 33% Univ. hosp: 41%
General hosp: 5% perc: 16% 25% perc: 25% 75% perc: 40%
Univ hosp:
5% perc: 15% 25% perc: 30% 75% perc: 49%
Note: Bèta distributions are used for proportions.
Gamma and Normal distributions Variable Distr. Median Other reference values
Indirect cost per m² Gamma 146 25% perc: 123 75% perc: 177
Indirect cost per FTE Normal 8 463 75% perc: 9 939
Note: Gamma and normal distributions are typical cost distributions. They were used when sufficient data was available. The most fitting distribution was selected. Gamma distributions always result in positive values (there is a positive lower limit on the minimum, but the maximum can be unlimited) and is skewed to the right.
Constants Variable Constant value
Slope coefficient for n° of nursing FTE’s per operational hr 0.0534 Intercept coefficient for n° of nursing FTE’s 0 Slope coefficient for physician “FTEs” per operational hr General hosp.:
0.0168 Univ. hosp.:
0.0249 Intercept coefficient for physician “FTEs” General hosp.:
0.4703 Univ. hosp.:
0.8179 Base cost per physician “FTE” at general hospitals € 0 Cost per physician “FTE” at university hospitals € 140 000 N° of scans per operational hour 1.93
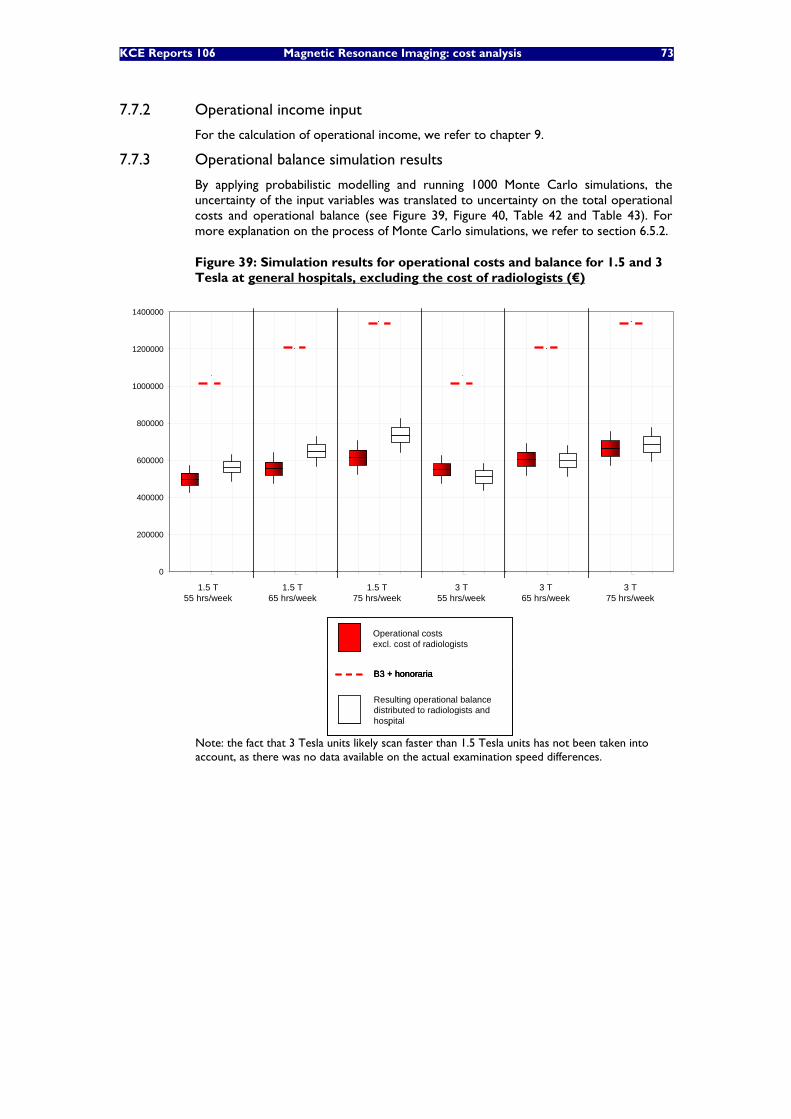
KCE Reports 106 Magnetic Resonance Imaging: cost analysis 73
7.7.2 Operational income input
For the calculation of operational income, we refer to chapter 9.
7.7.3 Operational balance simulation results
By applying probabilistic modelling and running 1000 Monte Carlo simulations, the uncertainty of the input variables was translated to uncertainty on the total operational costs and operational balance (see Figure 39, Figure 40, Table 42 and Table 43). For more explanation on the process of Monte Carlo simulations, we refer to section 6.5.2.
Figure 39: Simulation results for operational costs and balance for 1.5 and 3 Tesla at general hospitals, excluding the cost of radiologists (€)
0
200000
400000
600000
800000
1000000
1200000
1400000
oper
atio
nal c
osts
B3+
hono
rari
a fi
nanc
ing
Ope
rati
onal
bal
ance
oper
atio
nal c
osts
B3+
hono
rari
a fi
nanc
ing
Ope
rati
onal
bal
ance
oper
atio
nal c
osts
B3+
hono
rari
a fi
nanc
ing
Ope
rati
onal
bal
ance
oper
atio
nal c
osts
B3+
hono
rari
a fi
nanc
ing
Ope
rati
onal
bal
ance
oper
atio
nal c
osts
B3+
hono
rari
a fi
nanc
ing
Ope
rati
onal
bal
ance
oper
atio
nal c
osts
B3+
hono
rari
a fi
nanc
ing
Ope
rati
onal
bal
ance
1.5 T55 hrs/week
1.5 T65 hrs/week
1.5 T75 hrs/week
3 T55 hrs/week
3 T65 hrs/week
3 T75 hrs/week
Operational costsexcl. cost of radiologists
Resulting operational balance distributed to radiologists andhospital
B3 + honoraria
Operational costsexcl. cost of radiologists
Resulting operational balance distributed to radiologists andhospital
B3 + honoraria
Note: the fact that 3 Tesla units likely scan faster than 1.5 Tesla units has not been taken into account, as there was no data available on the actual examination speed differences.
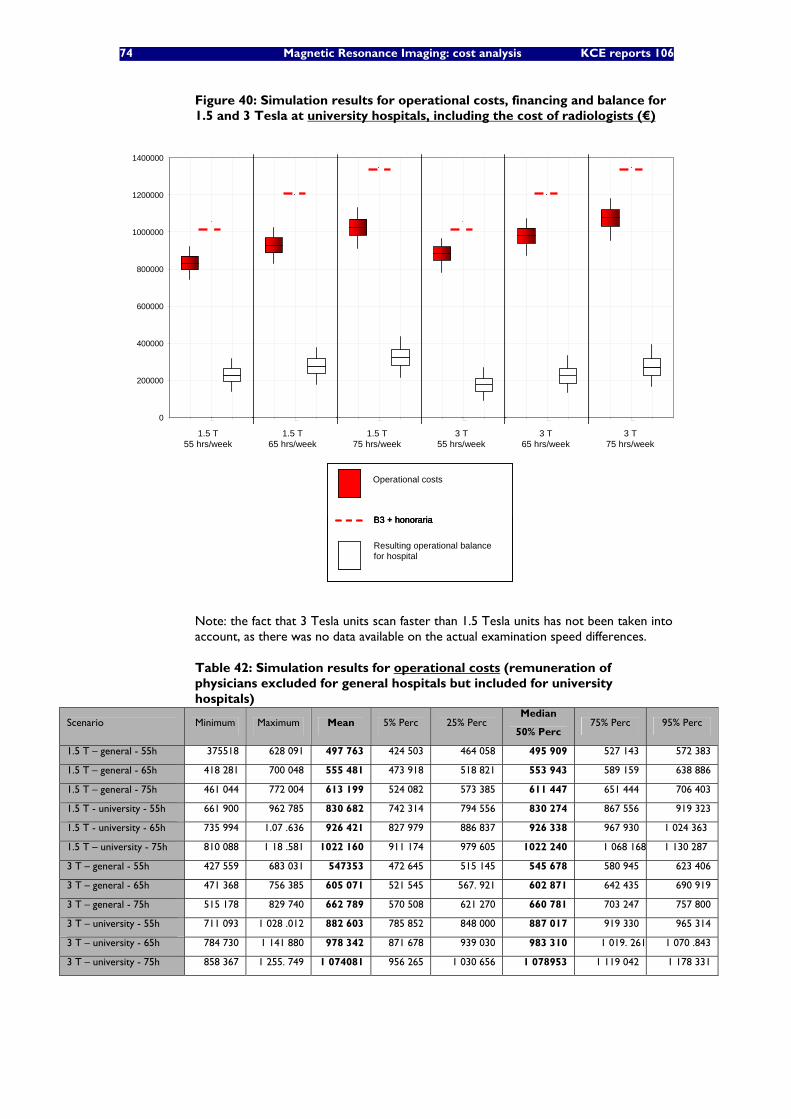
74 Magnetic Resonance Imaging: cost analysis KCE reports 106
Figure 40: Simulation results for operational costs, financing and balance for 1.5 and 3 Tesla at university hospitals, including the cost of radiologists (€)
0
200000
400000
600000
800000
1000000
1200000
1400000
oper
atio
nal c
osts
B3+
hono
rari
a fi
nanc
ing
Ope
rati
onal
bal
ance
oper
atio
nal c
osts
B3+
hono
rari
a fi
nanc
ing
Ope
rati
onal
bal
ance
oper
atio
nal c
osts
B3+
hono
rari
a fi
nanc
ing
Ope
rati
onal
bal
ance
oper
atio
nal c
osts
B3+
hono
rari
a fi
nanc
ing
Ope
rati
onal
bal
ance
oper
atio
nal c
osts
B3+
hono
rari
a fi
nanc
ing
Ope
rati
onal
bal
ance
oper
atio
nal c
osts
B3+
hono
rari
a fi
nanc
ing
Ope
rati
onal
bal
ance
1.5 T65 hrs/week
1.5 T75 hrs/week
3 T55 hrs/week
3 T65 hrs/week
3 T75 hrs/week
Operational costs
Resulting operational balance for hospital
B3 + honoraria
1.5 T55 hrs/week
0
200000
400000
600000
800000
1000000
1200000
1400000
oper
atio
nal c
osts
B3+
hono
rari
a fi
nanc
ing
Ope
rati
onal
bal
ance
oper
atio
nal c
osts
B3+
hono
rari
a fi
nanc
ing
Ope
rati
onal
bal
ance
oper
atio
nal c
osts
B3+
hono
rari
a fi
nanc
ing
Ope
rati
onal
bal
ance
oper
atio
nal c
osts
B3+
hono
rari
a fi
nanc
ing
Ope
rati
onal
bal
ance
oper
atio
nal c
osts
B3+
hono
rari
a fi
nanc
ing
Ope
rati
onal
bal
ance
oper
atio
nal c
osts
B3+
hono
rari
a fi
nanc
ing
Ope
rati
onal
bal
ance
1.5 T65 hrs/week
1.5 T75 hrs/week
3 T55 hrs/week
3 T65 hrs/week
3 T75 hrs/week
Operational costs
Resulting operational balance for hospital
B3 + honoraria
Operational costs
Resulting operational balance for hospital
B3 + honoraria
1.5 T55 hrs/week
Note: the fact that 3 Tesla units scan faster than 1.5 Tesla units has not been taken into account, as there was no data available on the actual examination speed differences.
Table 42: Simulation results for operational costs (remuneration of physicians excluded for general hospitals but included for university hospitals)
Scenario Minimum Maximum Mean 5% Perc 25% Perc Median
50% Perc 75% Perc 95% Perc
1.5 T – general - 55h 375518 628 091 497 763 424 503 464 058 495 909 527 143 572 383
1.5 T – general - 65h 418 281 700 048 555 481 473 918 518 821 553 943 589 159 638 886
1.5 T – general - 75h 461 044 772 004 613 199 524 082 573 385 611 447 651 444 706 403
1.5 T - university - 55h 661 900 962 785 830 682 742 314 794 556 830 274 867 556 919 323
1.5 T - university - 65h 735 994 1.07 .636 926 421 827 979 886 837 926 338 967 930 1 024 363
1.5 T – university - 75h 810 088 1 18 .581 1022 160 911 174 979 605 1022 240 1 068 168 1 130 287
3 T – general - 55h 427 559 683 031 547353 472 645 515 145 545 678 580 945 623 406
3 T – general - 65h 471 368 756 385 605 071 521 545 567. 921 602 871 642 435 690 919
3 T – general - 75h 515 178 829 740 662 789 570 508 621 270 660 781 703 247 757 800
3 T – university - 55h 711 093 1 028 .012 882 603 785 852 848 000 887 017 919 330 965 314
3 T – university - 65h 784 730 1 141 880 978 342 871 678 939 030 983 310 1 019. 261 1 070 .843
3 T – university - 75h 858 367 1 255. 749 1 074081 956 265 1 030 656 1 078953 1 119 042 1 178 331
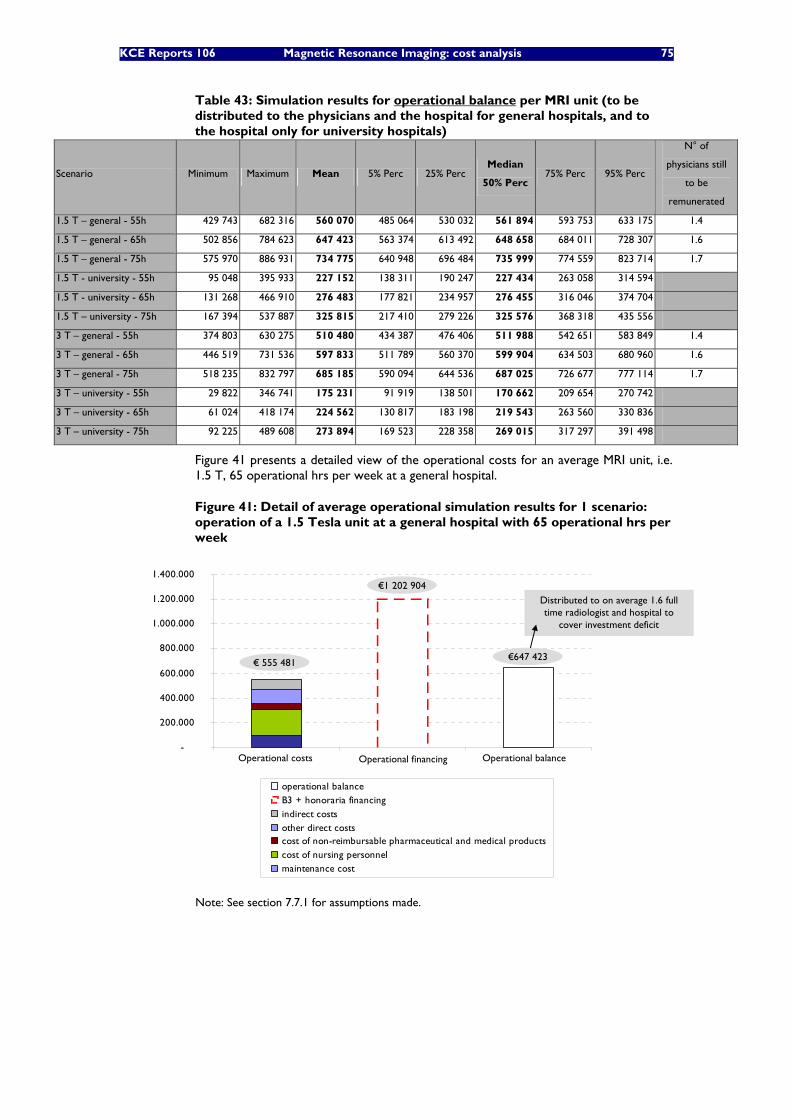
KCE Reports 106 Magnetic Resonance Imaging: cost analysis 75
Table 43: Simulation results for operational balance per MRI unit (to be distributed to the physicians and the hospital for general hospitals, and to the hospital only for university hospitals)
Scenario Minimum Maximum Mean 5% Perc 25% Perc Median
50% Perc 75% Perc 95% Perc
N° of
physicians still
to be
remunerated
1.5 T – general - 55h 429 743 682 316 560 070 485 064 530 032 561 894 593 753 633 175 1.4
1.5 T – general - 65h 502 856 784 623 647 423 563 374 613 492 648 658 684 011 728 307 1.6
1.5 T – general - 75h 575 970 886 931 734 775 640 948 696 484 735 999 774 559 823 714 1.7
1.5 T - university - 55h 95 048 395 933 227 152 138 311 190 247 227 434 263 058 314 594
1.5 T - university - 65h 131 268 466 910 276 483 177 821 234 957 276 455 316 046 374 704
1.5 T – university - 75h 167 394 537 887 325 815 217 410 279 226 325 576 368 318 435 556
3 T – general - 55h 374 803 630 275 510 480 434 387 476 406 511 988 542 651 583 849 1.4
3 T – general - 65h 446 519 731 536 597 833 511 789 560 370 599 904 634 503 680 960 1.6
3 T – general - 75h 518 235 832 797 685 185 590 094 644 536 687 025 726 677 777 114 1.7
3 T – university - 55h 29 822 346 741 175 231 91 919 138 501 170 662 209 654 270 742
3 T – university - 65h 61 024 418 174 224 562 130 817 183 198 219 543 263 560 330 836
3 T – university - 75h 92 225 489 608 273 894 169 523 228 358 269 015 317 297 391 498
Figure 41 presents a detailed view of the operational costs for an average MRI unit, i.e. 1.5 T, 65 operational hrs per week at a general hospital.
Figure 41: Detail of average operational simulation results for 1 scenario: operation of a 1.5 Tesla unit at a general hospital with 65 operational hrs per week
-
200.000
400.000
600.000
800.000
1.000.000
1.200.000
1.400.000
1 2 3
operational balanceB3 + honoraria financingindirect costsother direct costscost of non-reimbursable pharmaceutical and medical productscost of nursing personnelmaintenance cost
Operational costs Operational balanceOperational financing
€ 555 481€647 423
€1 202 904
Distributed to on average 1.6 full time radiologist and hospital to
cover investment deficit
Note: See section 7.7.1 for assumptions made.
76 Magnetic Resonance Imaging: cost analysis KCE reports 106
• For a 1.5 Tesla MRI unit with average operational schedule at a general hospital, operational costs (excluding cost of radiologists) is estimated at on average € 555 481.
• Operational financing (B3 + honoraria) for this average unit is calculated at €1 202 904.
• The resulting operational balance for this average unit is estimated at €647 423. This balance is what is left to pay the (on average) 1.6 FTE radiologists (as net honoraria) for MRI services on the one hand, and to cover the deficit from A3 being insufficient to cover the investment costs on the other hand.
7.8 HISTORICAL EVOLUTION OF OPERATIONAL BALANCE From 2000 to 2008, the number of scans per unit has increased by 47%. Looking at operational financing (B3+fees) per examination, there was a decrease of €22 per examination, from €214 to €191 (a decrease of 10%). It is known that the operational hours per unit remained largely the same. This means that it can be expected that the nursing requirements have not changed considerably. Furthermore also the yearly maintenance cost can be considered fixed, and thus independent from the number of examinations done. To what extent, however, other costs and time requirements of radiologists has evolved, is not known. Therefore there is no complete view on the total operational cost evolution, or the efficiency gains in this period, so no conclusions can be drawn on the evolution of the operational balance.
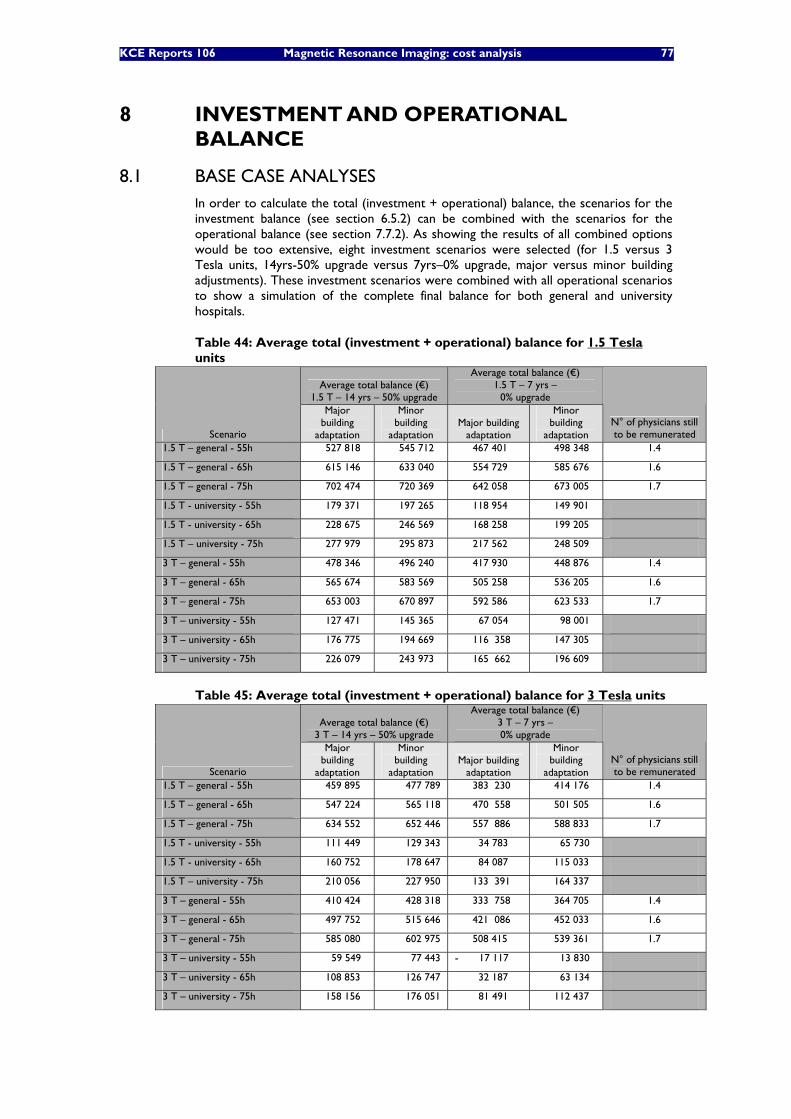
KCE Reports 106 Magnetic Resonance Imaging: cost analysis 77
8 INVESTMENT AND OPERATIONAL BALANCE
8.1 BASE CASE ANALYSES In order to calculate the total (investment + operational) balance, the scenarios for the investment balance (see section 6.5.2) can be combined with the scenarios for the operational balance (see section 7.7.2). As showing the results of all combined options would be too extensive, eight investment scenarios were selected (for 1.5 versus 3 Tesla units, 14yrs-50% upgrade versus 7yrs–0% upgrade, major versus minor building adjustments). These investment scenarios were combined with all operational scenarios to show a simulation of the complete final balance for both general and university hospitals.
Table 44: Average total (investment + operational) balance for 1.5 Tesla units
Average total balance (€) 1.5 T – 14 yrs – 50% upgrade
Average total balance (€) 1.5 T – 7 yrs –
0% upgrade
Scenario
Major building
adaptation
Minor building
adaptation Major building
adaptation
Minor building
adaptation N° of physicians still to be remunerated
1.5 T – general - 55h 527 818 545 712 467 401 498 348 1.4
1.5 T – general - 65h 615 146 633 040 554 729 585 676 1.6
1.5 T – general - 75h 702 474 720 369 642 058 673 005 1.7
1.5 T - university - 55h 179 371 197 265 118 954 149 901
1.5 T - university - 65h 228 675 246 569 168 258 199 205
1.5 T – university - 75h 277 979 295 873 217 562 248 509
3 T – general - 55h 478 346 496 240 417 930 448 876 1.4
3 T – general - 65h 565 674 583 569 505 258 536 205 1.6
3 T – general - 75h 653 003 670 897 592 586 623 533 1.7
3 T – university - 55h 127 471 145 365 67 054 98 001
3 T – university - 65h 176 775 194 669 116 358 147 305
3 T – university - 75h 226 079 243 973 165 662 196 609
Table 45: Average total (investment + operational) balance for 3 Tesla units
Average total balance (€) 3 T – 14 yrs – 50% upgrade
Average total balance (€) 3 T – 7 yrs – 0% upgrade
Scenario
Major building
adaptation
Minor building
adaptation Major building
adaptation
Minor building
adaptation N° of physicians still to be remunerated
1.5 T – general - 55h 459 895 477 789 383 230 414 176 1.4
1.5 T – general - 65h 547 224 565 118 470 558 501 505 1.6
1.5 T – general - 75h 634 552 652 446 557 886 588 833 1.7
1.5 T - university - 55h 111 449 129 343 34 783 65 730
1.5 T - university - 65h 160 752 178 647 84 087 115 033
1.5 T – university - 75h 210 056 227 950 133 391 164 337
3 T – general - 55h 410 424 428 318 333 758 364 705 1.4
3 T – general - 65h 497 752 515 646 421 086 452 033 1.6
3 T – general - 75h 585 080 602 975 508 415 539 361 1.7
3 T – university - 55h 59 549 77 443 - 17 117 13 830
3 T – university - 65h 108 853 126 747 32 187 63 134
3 T – university - 75h 158 156 176 051 81 491 112 437
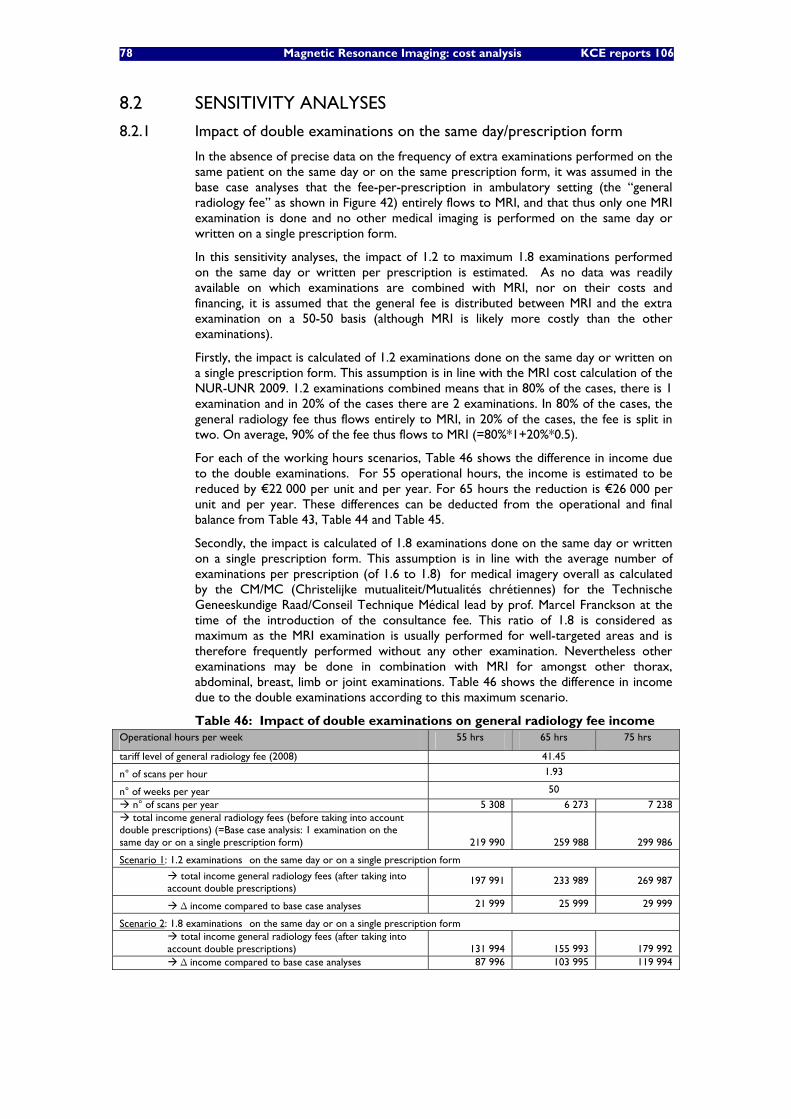
78 Magnetic Resonance Imaging: cost analysis KCE reports 106
8.2 SENSITIVITY ANALYSES
8.2.1 Impact of double examinations on the same day/prescription form
In the absence of precise data on the frequency of extra examinations performed on the same patient on the same day or on the same prescription form, it was assumed in the base case analyses that the fee-per-prescription in ambulatory setting (the “general radiology fee” as shown in Figure 42) entirely flows to MRI, and that thus only one MRI examination is done and no other medical imaging is performed on the same day or written on a single prescription form.
In this sensitivity analyses, the impact of 1.2 to maximum 1.8 examinations performed on the same day or written per prescription is estimated. As no data was readily available on which examinations are combined with MRI, nor on their costs and financing, it is assumed that the general fee is distributed between MRI and the extra examination on a 50-50 basis (although MRI is likely more costly than the other examinations).
Firstly, the impact is calculated of 1.2 examinations done on the same day or written on a single prescription form. This assumption is in line with the MRI cost calculation of the NUR-UNR 2009. 1.2 examinations combined means that in 80% of the cases, there is 1 examination and in 20% of the cases there are 2 examinations. In 80% of the cases, the general radiology fee thus flows entirely to MRI, in 20% of the cases, the fee is split in two. On average, 90% of the fee thus flows to MRI (=80%*1+20%*0.5).
For each of the working hours scenarios, Table 46 shows the difference in income due to the double examinations. For 55 operational hours, the income is estimated to be reduced by €22 000 per unit and per year. For 65 hours the reduction is €26 000 per unit and per year. These differences can be deducted from the operational and final balance from Table 43, Table 44 and Table 45.
Secondly, the impact is calculated of 1.8 examinations done on the same day or written on a single prescription form. This assumption is in line with the average number of examinations per prescription (of 1.6 to 1.8) for medical imagery overall as calculated by the CM/MC (Christelijke mutualiteit/Mutualités chrétiennes) for the Technische Geneeskundige Raad/Conseil Technique Médical lead by prof. Marcel Franckson at the time of the introduction of the consultance fee. This ratio of 1.8 is considered as maximum as the MRI examination is usually performed for well-targeted areas and is therefore frequently performed without any other examination. Nevertheless other examinations may be done in combination with MRI for amongst other thorax, abdominal, breast, limb or joint examinations. Table 46 shows the difference in income due to the double examinations according to this maximum scenario.
Table 46: Impact of double examinations on general radiology fee income Operational hours per week 55 hrs 65 hrs 75 hrs
tariff level of general radiology fee (2008) 41.45
n° of scans per hour 1.93
n° of weeks per year 50
n° of scans per year 5 308 6 273 7 238 total income general radiology fees (before taking into account
double prescriptions) (=Base case analysis: 1 examination on the same day or on a single prescription form) 219 990 259 988 299 986
Scenario 1: 1.2 examinations on the same day or on a single prescription form
total income general radiology fees (after taking into account double prescriptions)
197 991 233 989 269 987
Δ income compared to base case analyses 21 999 25 999 29 999
Scenario 2: 1.8 examinations on the same day or on a single prescription form total income general radiology fees (after taking into
account double prescriptions)
131 994
155 993 179 992 Δ income compared to base case analyses 87 996 103 995 119 994
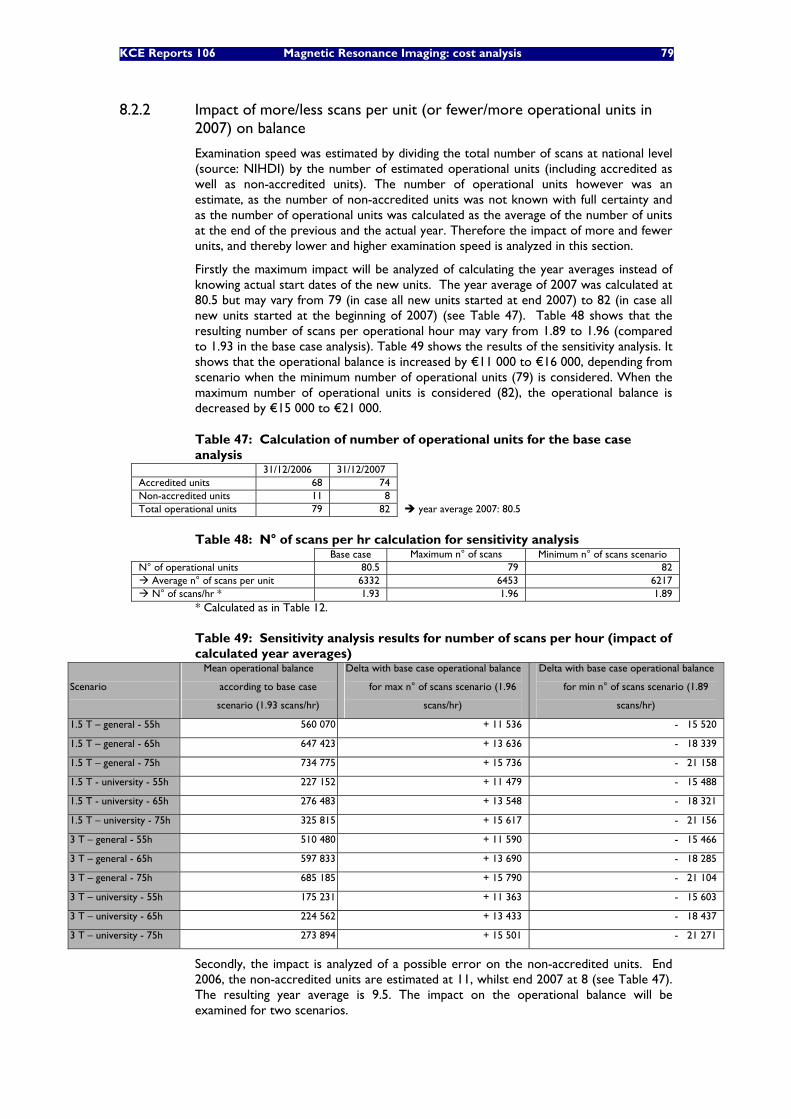
KCE Reports 106 Magnetic Resonance Imaging: cost analysis 79
8.2.2 Impact of more/less scans per unit (or fewer/more operational units in 2007) on balance
Examination speed was estimated by dividing the total number of scans at national level (source: NIHDI) by the number of estimated operational units (including accredited as well as non-accredited units). The number of operational units however was an estimate, as the number of non-accredited units was not known with full certainty and as the number of operational units was calculated as the average of the number of units at the end of the previous and the actual year. Therefore the impact of more and fewer units, and thereby lower and higher examination speed is analyzed in this section.
Firstly the maximum impact will be analyzed of calculating the year averages instead of knowing actual start dates of the new units. The year average of 2007 was calculated at 80.5 but may vary from 79 (in case all new units started at end 2007) to 82 (in case all new units started at the beginning of 2007) (see Table 47). Table 48 shows that the resulting number of scans per operational hour may vary from 1.89 to 1.96 (compared to 1.93 in the base case analysis). Table 49 shows the results of the sensitivity analysis. It shows that the operational balance is increased by €11 000 to €16 000, depending from scenario when the minimum number of operational units (79) is considered. When the maximum number of operational units is considered (82), the operational balance is decreased by €15 000 to €21 000.
Table 47: Calculation of number of operational units for the base case analysis
31/12/2006 31/12/2007 Accredited units 68 74 Non-accredited units 11 8 Total operational units 79 82 year average 2007: 80.5
Table 48: N° of scans per hr calculation for sensitivity analysis Base case Maximum n° of scans Minimum n° of scans scenario
N° of operational units 80.5 79 82 Average n° of scans per unit 6332 6453 6217 N° of scans/hr * 1.93 1.96 1.89
* Calculated as in Table 12.
Table 49: Sensitivity analysis results for number of scans per hour (impact of calculated year averages)
Scenario
Mean operational balance
according to base case
scenario (1.93 scans/hr)
Delta with base case operational balance
for max n° of scans scenario (1.96
scans/hr)
Delta with base case operational balance
for min n° of scans scenario (1.89
scans/hr)
1.5 T – general - 55h 560 070 + 11 536 - 15 520
1.5 T – general - 65h 647 423 + 13 636 - 18 339
1.5 T – general - 75h 734 775 + 15 736 - 21 158
1.5 T - university - 55h 227 152 + 11 479 - 15 488
1.5 T - university - 65h 276 483 + 13 548 - 18 321
1.5 T – university - 75h 325 815 + 15 617 - 21 156
3 T – general - 55h 510 480 + 11 590 - 15 466
3 T – general - 65h 597 833 + 13 690 - 18 285
3 T – general - 75h 685 185 + 15 790 - 21 104
3 T – university - 55h 175 231 + 11 363 - 15 603
3 T – university - 65h 224 562 + 13 433 - 18 437
3 T – university - 75h 273 894 + 15 501 - 21 271
Secondly, the impact is analyzed of a possible error on the non-accredited units. End 2006, the non-accredited units are estimated at 11, whilst end 2007 at 8 (see Table 47). The resulting year average is 9.5. The impact on the operational balance will be examined for two scenarios.
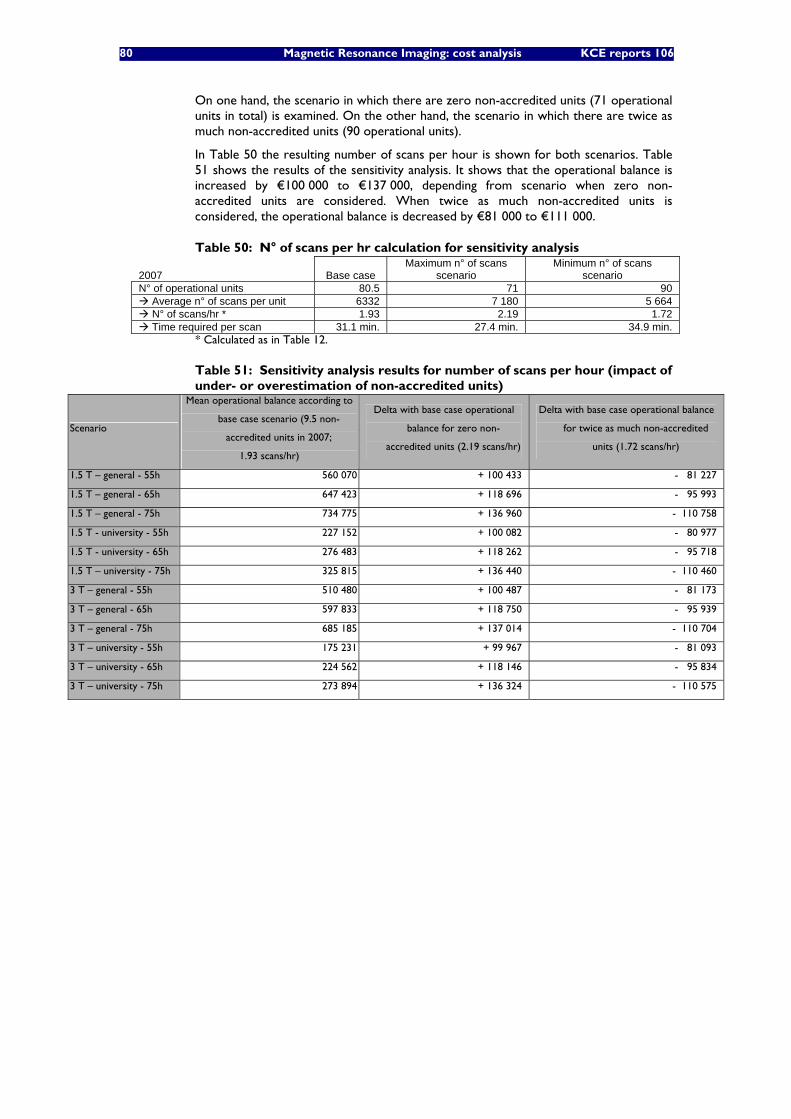
80 Magnetic Resonance Imaging: cost analysis KCE reports 106
On one hand, the scenario in which there are zero non-accredited units (71 operational units in total) is examined. On the other hand, the scenario in which there are twice as much non-accredited units (90 operational units).
In Table 50 the resulting number of scans per hour is shown for both scenarios. Table 51 shows the results of the sensitivity analysis. It shows that the operational balance is increased by €100 000 to €137 000, depending from scenario when zero non-accredited units are considered. When twice as much non-accredited units is considered, the operational balance is decreased by €81 000 to €111 000.
Table 50: N° of scans per hr calculation for sensitivity analysis
2007 Base case Maximum n° of scans
scenario Minimum n° of scans
scenario N° of operational units 80.5 71 90
Average n° of scans per unit 6332 7 180 5 664 N° of scans/hr * 1.93 2.19 1.72 Time required per scan 31.1 min. 27.4 min. 34.9 min.
* Calculated as in Table 12.
Table 51: Sensitivity analysis results for number of scans per hour (impact of under- or overestimation of non-accredited units)
Scenario
Mean operational balance according to
base case scenario (9.5 non-
accredited units in 2007;
1.93 scans/hr)
Delta with base case operational
balance for zero non-
accredited units (2.19 scans/hr)
Delta with base case operational balance
for twice as much non-accredited
units (1.72 scans/hr)
1.5 T – general - 55h 560 070 + 100 433 - 81 227
1.5 T – general - 65h 647 423 + 118 696 - 95 993
1.5 T – general - 75h 734 775 + 136 960 - 110 758
1.5 T - university - 55h 227 152 + 100 082 - 80 977
1.5 T - university - 65h 276 483 + 118 262 - 95 718
1.5 T – university - 75h 325 815 + 136 440 - 110 460
3 T – general - 55h 510 480 + 100 487 - 81 173
3 T – general - 65h 597 833 + 118 750 - 95 939
3 T – general - 75h 685 185 + 137 014 - 110 704
3 T – university - 55h 175 231 + 99 967 - 81 093
3 T – university - 65h 224 562 + 118 146 - 95 834
3 T – university - 75h 273 894 + 136 324 - 110 575
KCE Reports 106 Magnetic Resonance Imaging: cost analysis 81
9 CURRENT FINANCING OF MRI
9.1 CURRENT FINANCING STRUCTURE An overview of the different finance elements, and the costs they intend to cover, is given in Figure 8. Each of these finance elements is discussed more in detail further in this chapter. The financing of MRI can be split into two broad categories. On one hand there is fixed yearly financing, for the investment and operational costs (excluding cost of radiologists). On the other hand there is variable financing, through fees (“honoraria”), for the time investment of the radiologists.
At non-university hospitals, the fees and in some cases also the fixed financing, are pooled by the central collector at the hospital (which may be either the hospital itself or an organism within the hospital representing the physicians). In order to cover all central costs18, the central collector then deducts a certain % which is agreed upfront by the Administrator and the Medical Board (“Medische raad/Conseil Médical”), of the income of the hospital or may alternatively deduct actual costs from the ‘honarium pool’. The pooling of the financing may be done either per service or for a group of services. The resulting remuneration pool can then be divided between the physicians in different ways, depending on the agreements made between the management and physicians working in the hospital.
Figure 42 shows the MRI-specific financing elements (intending to cover only MRI activities) versus non-specific financing elements (intending to cover not only MRI but also other medical imaging activities). The fixed A3 and B3 financing and the fee per MRI examination are MRI-specific. In contrast, the consultance and general (“forfaitaire”) fees for medical imaging are not MRI-specific, they can also be invoiced for other medical imaging activities.
As legally stipulated, A3 and B3 are supposed to cover almost all MRI related costs except for the radiologist costs. The honoraria (fee per MRI examination, consultance fee and general radiology fee) intend to cover the cost of radiologists and part of the other costs (where A3 and B3 should be insufficient). In the following paragraph we explain more extensively which costs the different financing elements are supposed to cover.
18 Which costs are deducted depend on which income is pooled (only fees or also fixed financing?) and on
the agreements between the Administrator and the Medical Board on e.g. payments for hospital investment funds or for solidarity flows between hospital services.
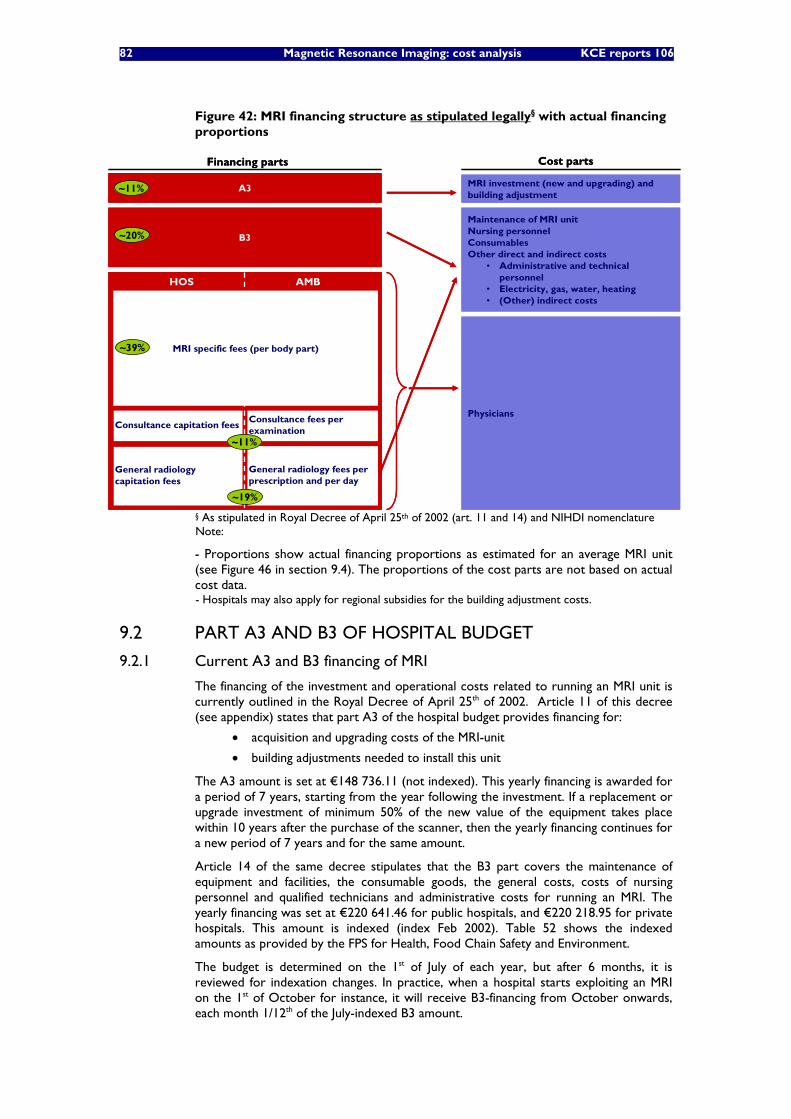
82 Magnetic Resonance Imaging: cost analysis KCE reports 106
Figure 42: MRI financing structure as stipulated legally§ with actual financing proportions
A3
Financing parts
B3
MRI investment (new and upgrading) andbuilding adjustment
Physicians
HOS AMB
General radiology fees perprescription and per day
Consultance fees perexamination
General radiologycapitation fees
Consultance capitation fees
Cost parts
Maintenance of MRI unitNursing personnelConsumablesOther direct and indirect costs
• Administrative and technicalpersonnel
• Electricity, gas, water, heating• (Other) indirect costs
~11%
~20%
~11%
~19%
MRI specific fees (per body part)~39%
§ As stipulated in Royal Decree of April 25th of 2002 (art. 11 and 14) and NIHDI nomenclature Note:
- Proportions show actual financing proportions as estimated for an average MRI unit (see Figure 46 in section 9.4). The proportions of the cost parts are not based on actual cost data. - Hospitals may also apply for regional subsidies for the building adjustment costs.
9.2 PART A3 AND B3 OF HOSPITAL BUDGET
9.2.1 Current A3 and B3 financing of MRI
The financing of the investment and operational costs related to running an MRI unit is currently outlined in the Royal Decree of April 25th of 2002. Article 11 of this decree (see appendix) states that part A3 of the hospital budget provides financing for:
• acquisition and upgrading costs of the MRI-unit
• building adjustments needed to install this unit
The A3 amount is set at €148 736.11 (not indexed). This yearly financing is awarded for a period of 7 years, starting from the year following the investment. If a replacement or upgrade investment of minimum 50% of the new value of the equipment takes place within 10 years after the purchase of the scanner, then the yearly financing continues for a new period of 7 years and for the same amount.
Article 14 of the same decree stipulates that the B3 part covers the maintenance of equipment and facilities, the consumable goods, the general costs, costs of nursing personnel and qualified technicians and administrative costs for running an MRI. The yearly financing was set at €220 641.46 for public hospitals, and €220 218.95 for private hospitals. This amount is indexed (index Feb 2002). Table 52 shows the indexed amounts as provided by the FPS for Health, Food Chain Safety and Environment.
The budget is determined on the 1st of July of each year, but after 6 months, it is reviewed for indexation changes. In practice, when a hospital starts exploiting an MRI on the 1st of October for instance, it will receive B3-financing from October onwards, each month 1/12th of the July-indexed B3 amount.
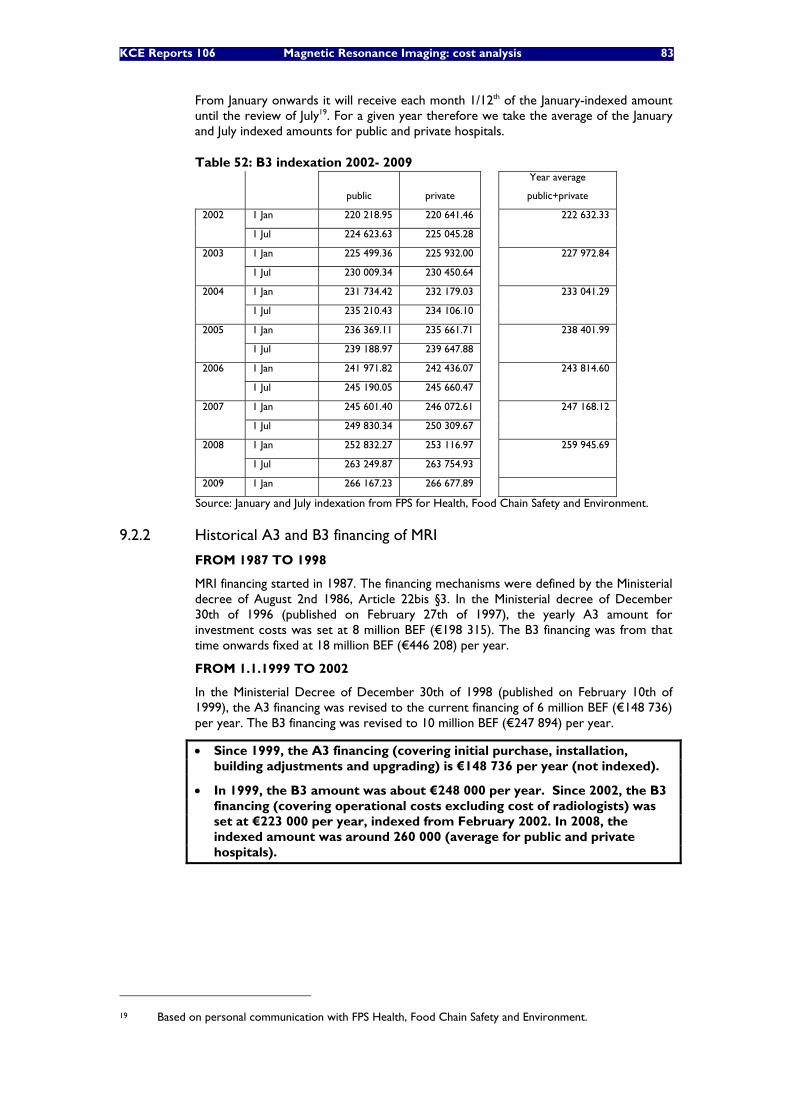
KCE Reports 106 Magnetic Resonance Imaging: cost analysis 83
From January onwards it will receive each month 1/12th of the January-indexed amount until the review of July19. For a given year therefore we take the average of the January and July indexed amounts for public and private hospitals.
Table 52: B3 indexation 2002- 2009
public private
Year average
public+private
1 Jan 220 218.95 220 641.46 2002
1 Jul 224 623.63 225 045.28
222 632.33
1 Jan 225 499.36 225 932.00 2003
1 Jul 230 009.34 230 450.64
227 972.84
1 Jan 231 734.42 232 179.03 2004
1 Jul 235 210.43 234 106.10
233 041.29
1 Jan 236 369.11 235 661.71 2005
1 Jul 239 188.97 239 647.88
238 401.99
1 Jan 241 971.82 242 436.07 2006
1 Jul 245 190.05 245 660.47
243 814.60
1 Jan 245 601.40 246 072.61 2007
1 Jul 249 830.34 250 309.67
247 168.12
1 Jan 252 832.27 253 116.97 2008
1 Jul 263 249.87 263 754.93
259 945.69
2009 1 Jan 266 167.23 266 677.89
Source: January and July indexation from FPS for Health, Food Chain Safety and Environment.
9.2.2 Historical A3 and B3 financing of MRI
FROM 1987 TO 1998
MRI financing started in 1987. The financing mechanisms were defined by the Ministerial decree of August 2nd 1986, Article 22bis §3. In the Ministerial decree of December 30th of 1996 (published on February 27th of 1997), the yearly A3 amount for investment costs was set at 8 million BEF (€198 315). The B3 financing was from that time onwards fixed at 18 million BEF (€446 208) per year.
FROM 1.1.1999 TO 2002
In the Ministerial Decree of December 30th of 1998 (published on February 10th of 1999), the A3 financing was revised to the current financing of 6 million BEF (€148 736) per year. The B3 financing was revised to 10 million BEF (€247 894) per year.
• Since 1999, the A3 financing (covering initial purchase, installation, building adjustments and upgrading) is €148 736 per year (not indexed).
• In 1999, the B3 amount was about €248 000 per year. Since 2002, the B3 financing (covering operational costs excluding cost of radiologists) was set at €223 000 per year, indexed from February 2002. In 2008, the indexed amount was around 260 000 (average for public and private hospitals).
19 Based on personal communication with FPS Health, Food Chain Safety and Environment.
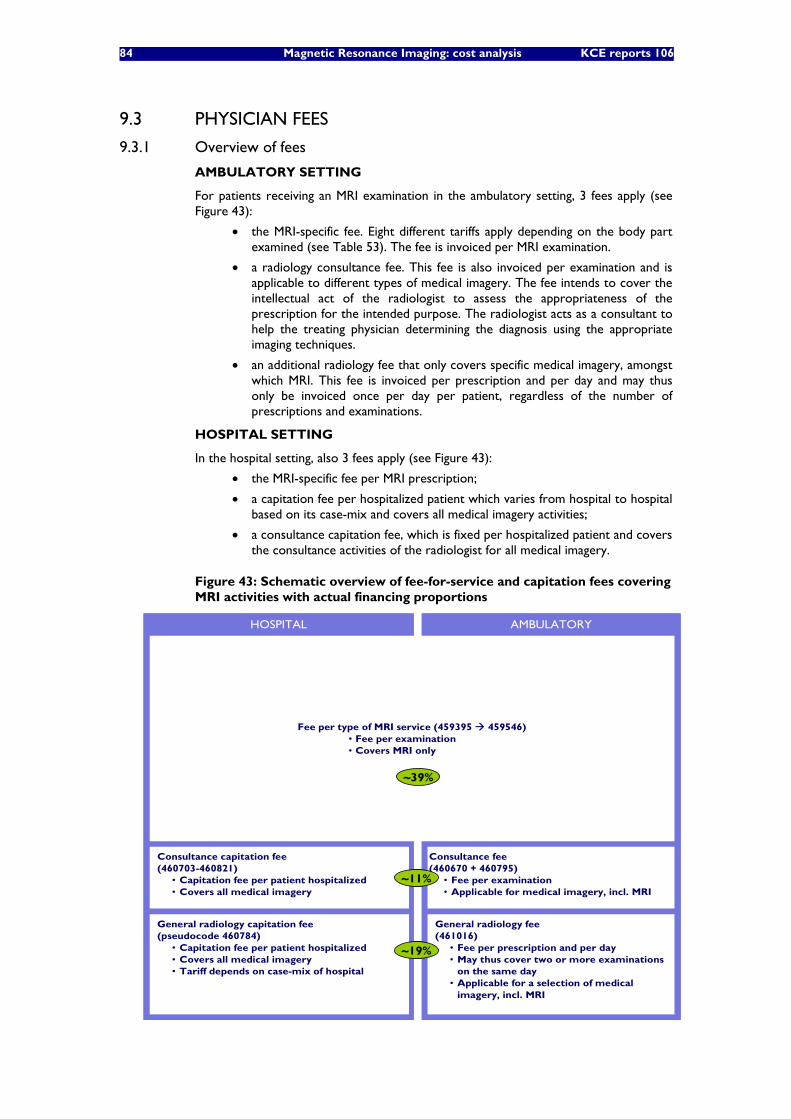
84 Magnetic Resonance Imaging: cost analysis KCE reports 106
9.3 PHYSICIAN FEES
9.3.1 Overview of fees
AMBULATORY SETTING
For patients receiving an MRI examination in the ambulatory setting, 3 fees apply (see Figure 43):
• the MRI-specific fee. Eight different tariffs apply depending on the body part examined (see Table 53). The fee is invoiced per MRI examination.
• a radiology consultance fee. This fee is also invoiced per examination and is applicable to different types of medical imagery. The fee intends to cover the intellectual act of the radiologist to assess the appropriateness of the prescription for the intended purpose. The radiologist acts as a consultant to help the treating physician determining the diagnosis using the appropriate imaging techniques.
• an additional radiology fee that only covers specific medical imagery, amongst which MRI. This fee is invoiced per prescription and per day and may thus only be invoiced once per day per patient, regardless of the number of prescriptions and examinations.
HOSPITAL SETTING
In the hospital setting, also 3 fees apply (see Figure 43):
• the MRI-specific fee per MRI prescription;
• a capitation fee per hospitalized patient which varies from hospital to hospital based on its case-mix and covers all medical imagery activities;
• a consultance capitation fee, which is fixed per hospitalized patient and covers the consultance activities of the radiologist for all medical imagery.
Figure 43: Schematic overview of fee-for-service and capitation fees covering MRI activities with actual financing proportions
AMBULATORYHOSPITAL
Consultance capitation fee(460703-460821)
• Capitation fee per patient hospitalized• Covers all medical imagery
General radiology fee(461016)
• Fee per prescription and per day• May thus cover two or more examinations
on the same day• Applicable for a selection of medical
imagery, incl. MRI
Consultance fee(460670 + 460795)
• Fee per examination• Applicable for medical imagery, incl. MRI
Fee per type of MRI service (459395 459546)• Fee per examination• Covers MRI only
General radiology capitation fee(pseudocode 460784)
• Capitation fee per patient hospitalized• Covers all medical imagery• Tariff depends on case-mix of hospital
~11%
~19%
~39%
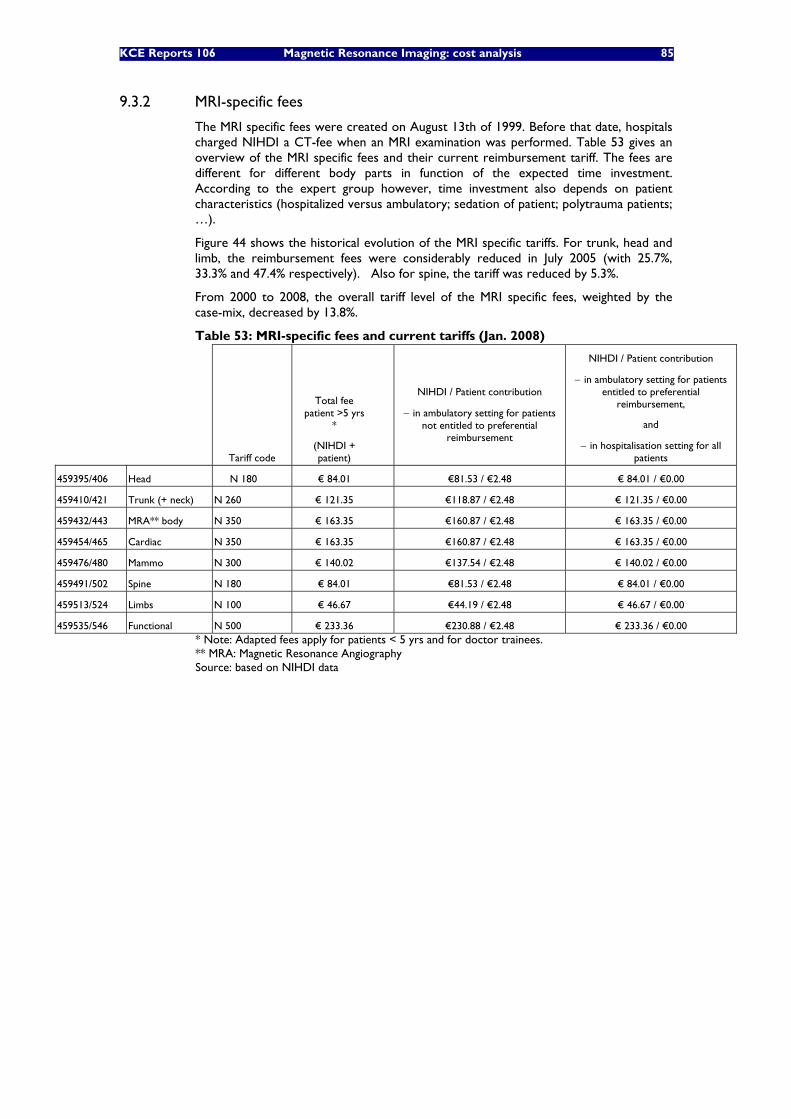
KCE Reports 106 Magnetic Resonance Imaging: cost analysis 85
9.3.2 MRI-specific fees
The MRI specific fees were created on August 13th of 1999. Before that date, hospitals charged NIHDI a CT-fee when an MRI examination was performed. Table 53 gives an overview of the MRI specific fees and their current reimbursement tariff. The fees are different for different body parts in function of the expected time investment. According to the expert group however, time investment also depends on patient characteristics (hospitalized versus ambulatory; sedation of patient; polytrauma patients; …).
Figure 44 shows the historical evolution of the MRI specific tariffs. For trunk, head and limb, the reimbursement fees were considerably reduced in July 2005 (with 25.7%, 33.3% and 47.4% respectively). Also for spine, the tariff was reduced by 5.3%.
From 2000 to 2008, the overall tariff level of the MRI specific fees, weighted by the case-mix, decreased by 13.8%.
Table 53: MRI-specific fees and current tariffs (Jan. 2008)
Tariff code
Total fee patient >5 yrs
*
(NIHDI + patient)
NIHDI / Patient contribution
− in ambulatory setting for patients not entitled to preferential
reimbursement
NIHDI / Patient contribution
− in ambulatory setting for patients entitled to preferential
reimbursement,
and
− in hospitalisation setting for all patients
459395/406 Head N 180 € 84.01 €81.53 / €2.48 € 84.01 / €0.00
459410/421 Trunk (+ neck) N 260 € 121.35 €118.87 / €2.48 € 121.35 / €0.00
459432/443 MRA** body N 350 € 163.35 €160.87 / €2.48 € 163.35 / €0.00
459454/465 Cardiac N 350 € 163.35 €160.87 / €2.48 € 163.35 / €0.00
459476/480 Mammo N 300 € 140.02 €137.54 / €2.48 € 140.02 / €0.00
459491/502 Spine N 180 € 84.01 €81.53 / €2.48 € 84.01 / €0.00
459513/524 Limbs N 100 € 46.67 €44.19 / €2.48 € 46.67 / €0.00
459535/546 Functional N 500 € 233.36 €230.88 / €2.48 € 233.36 / €0.00 * Note: Adapted fees apply for patients < 5 yrs and for doctor trainees. ** MRA: Magnetic Resonance Angiography Source: based on NIHDI data
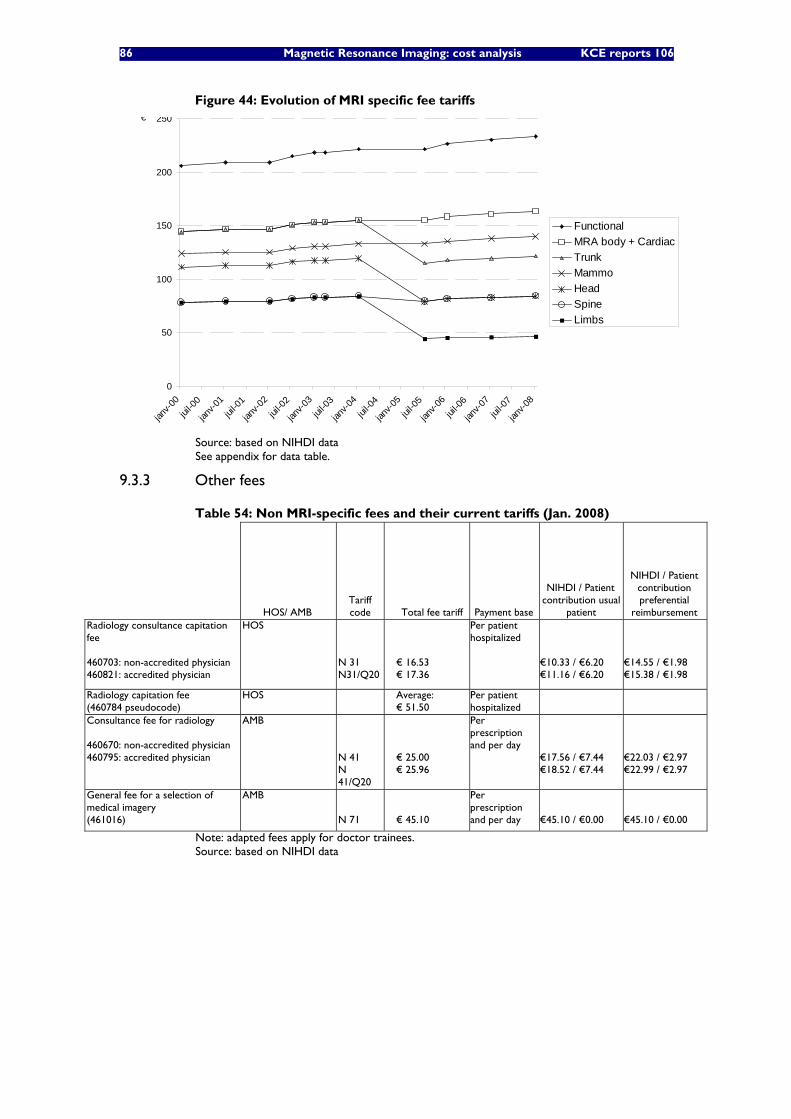
86 Magnetic Resonance Imaging: cost analysis KCE reports 106
Figure 44: Evolution of MRI specific fee tariffs
0
50
100
150
200
250
janv-0
0jui
l-00
janv-0
1jui
l-01
janv-0
2jui
l-02
janv-0
3jui
l-03
janv-0
4jui
l-04
janv-0
5jui
l-05
janv-0
6jui
l-06
janv-0
7jui
l-07
janv-0
8
€
Functional MRA body + CardiacTrunkMammoHeadSpineLimbs
Source: based on NIHDI data See appendix for data table.
9.3.3 Other fees
Table 54: Non MRI-specific fees and their current tariffs (Jan. 2008)
HOS/ AMB Tariff code Total fee tariff Payment base
NIHDI / Patient contribution usual
patient
NIHDI / Patient contribution preferential
reimbursement Radiology consultance capitation fee 460703: non-accredited physician 460821: accredited physician
HOS N 31 N31/Q20
€ 16.53 € 17.36
Per patient hospitalized
€10.33 / €6.20 €11.16 / €6.20
€14.55 / €1.98 €15.38 / €1.98
Radiology capitation fee (460784 pseudocode)
HOS Average: € 51.50
Per patient hospitalized
Consultance fee for radiology 460670: non-accredited physician 460795: accredited physician
AMB N 41 N 41/Q20
€ 25.00 € 25.96
Per prescription and per day
€17.56 / €7.44 €18.52 / €7.44
€22.03 / €2.97 €22.99 / €2.97
General fee for a selection of medical imagery (461016)
AMB N 71
€ 45.10
Per prescription and per day
€45.10 / €0.00
€45.10 / €0.00
Note: adapted fees apply for doctor trainees. Source: based on NIHDI data
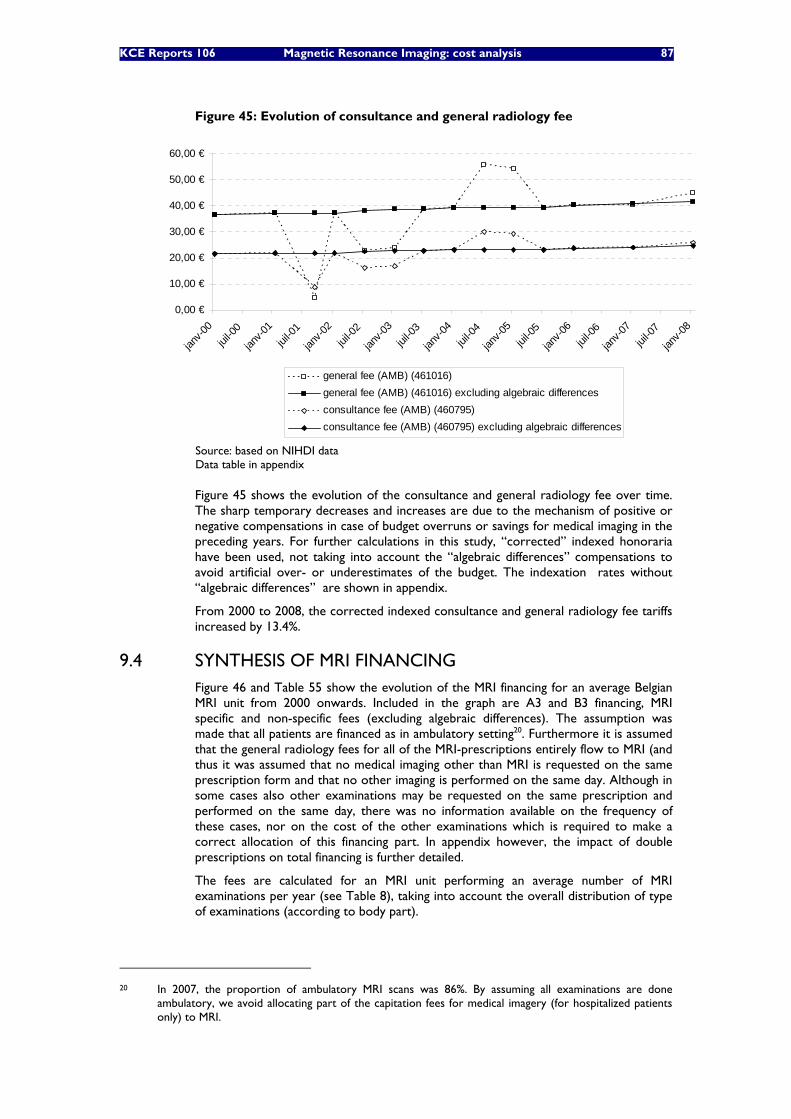
KCE Reports 106 Magnetic Resonance Imaging: cost analysis 87
Figure 45: Evolution of consultance and general radiology fee
0,00 €
10,00 €
20,00 €
30,00 €
40,00 €
50,00 €
60,00 €
janv-0
0jui
l-00
janv-0
1jui
l-01
janv-0
2jui
l-02
janv-0
3jui
l-03
janv-0
4jui
l-04
janv-0
5jui
l-05
janv-0
6jui
l-06
janv-0
7jui
l-07
janv-0
8
general fee (AMB) (461016)general fee (AMB) (461016) excluding algebraic differencesconsultance fee (AMB) (460795)consultance fee (AMB) (460795) excluding algebraic differences
Source: based on NIHDI data Data table in appendix
Figure 45 shows the evolution of the consultance and general radiology fee over time. The sharp temporary decreases and increases are due to the mechanism of positive or negative compensations in case of budget overruns or savings for medical imaging in the preceding years. For further calculations in this study, “corrected” indexed honoraria have been used, not taking into account the “algebraic differences” compensations to avoid artificial over- or underestimates of the budget. The indexation rates without “algebraic differences” are shown in appendix.
From 2000 to 2008, the corrected indexed consultance and general radiology fee tariffs increased by 13.4%.
9.4 SYNTHESIS OF MRI FINANCING Figure 46 and Table 55 show the evolution of the MRI financing for an average Belgian MRI unit from 2000 onwards. Included in the graph are A3 and B3 financing, MRI specific and non-specific fees (excluding algebraic differences). The assumption was made that all patients are financed as in ambulatory setting20. Furthermore it is assumed that the general radiology fees for all of the MRI-prescriptions entirely flow to MRI (and thus it was assumed that no medical imaging other than MRI is requested on the same prescription form and that no other imaging is performed on the same day. Although in some cases also other examinations may be requested on the same prescription and performed on the same day, there was no information available on the frequency of these cases, nor on the cost of the other examinations which is required to make a correct allocation of this financing part. In appendix however, the impact of double prescriptions on total financing is further detailed.
The fees are calculated for an MRI unit performing an average number of MRI examinations per year (see Table 8), taking into account the overall distribution of type of examinations (according to body part).
20 In 2007, the proportion of ambulatory MRI scans was 86%. By assuming all examinations are done
ambulatory, we avoid allocating part of the capitation fees for medical imagery (for hospitalized patients only) to MRI.
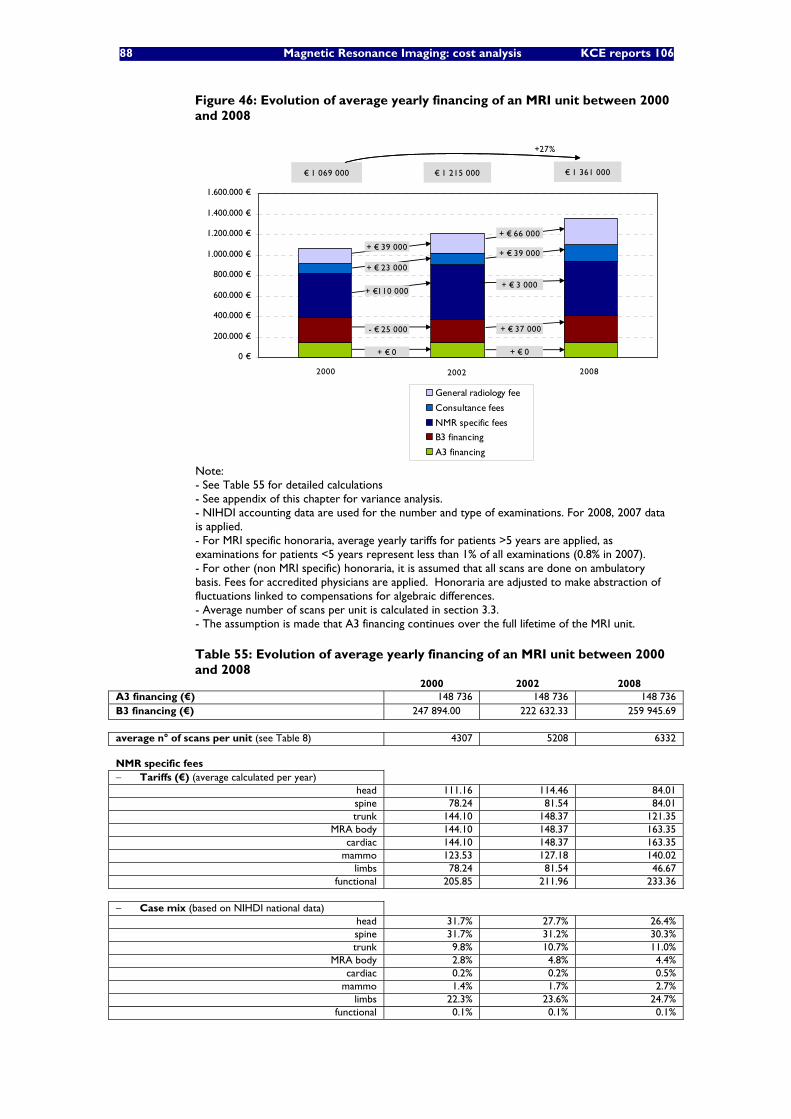
88 Magnetic Resonance Imaging: cost analysis KCE reports 106
Figure 46: Evolution of average yearly financing of an MRI unit between 2000 and 2008
0 €
200.000 €
400.000 €
600.000 €
800.000 €
1.000.000 €
1.200.000 €
1.400.000 €
1.600.000 €
1
General radiology fee
Consultance fees
NMR specific fees
B3 financing
A3 financing
- € 25 000
€ 1 069 000 € 1 215 000 € 1 361 000
+27%
+ € 0
+ €110 000
+ € 23 000
+ € 39 000
+ € 0
+ € 37 000
+ € 3 000
+ € 39 000
+ € 66 000
2000 2002 2008
Note: - See Table 55 for detailed calculations - See appendix of this chapter for variance analysis. - NIHDI accounting data are used for the number and type of examinations. For 2008, 2007 data is applied. - For MRI specific honoraria, average yearly tariffs for patients >5 years are applied, as examinations for patients <5 years represent less than 1% of all examinations (0.8% in 2007). - For other (non MRI specific) honoraria, it is assumed that all scans are done on ambulatory basis. Fees for accredited physicians are applied. Honoraria are adjusted to make abstraction of fluctuations linked to compensations for algebraic differences. - Average number of scans per unit is calculated in section 3.3. - The assumption is made that A3 financing continues over the full lifetime of the MRI unit.
Table 55: Evolution of average yearly financing of an MRI unit between 2000 and 2008
2000 2002 2008 A3 financing (€) 148 736 148 736 148 736 B3 financing (€) 247 894.00 222 632.33 259 945.69 average n° of scans per unit (see Table 8) 4307 5208 6332 NMR specific fees − Tariffs (€) (average calculated per year)
head 111.16 114.46 84.01 spine 78.24 81.54 84.01 trunk 144.10 148.37 121.35
MRA body 144.10 148.37 163.35 cardiac 144.10 148.37 163.35
mammo 123.53 127.18 140.02 limbs 78.24 81.54 46.67
functional 205.85 211.96 233.36
− Case mix (based on NIHDI national data) head 31.7% 27.7% 26.4% spine 31.7% 31.2% 30.3% trunk 9.8% 10.7% 11.0%
MRA body 2.8% 4.8% 4.4% cardiac 0.2% 0.2% 0.5%
mammo 1.4% 1.7% 2.7% limbs 22.3% 23.6% 24.7%
functional 0.1% 0.1% 0.1%
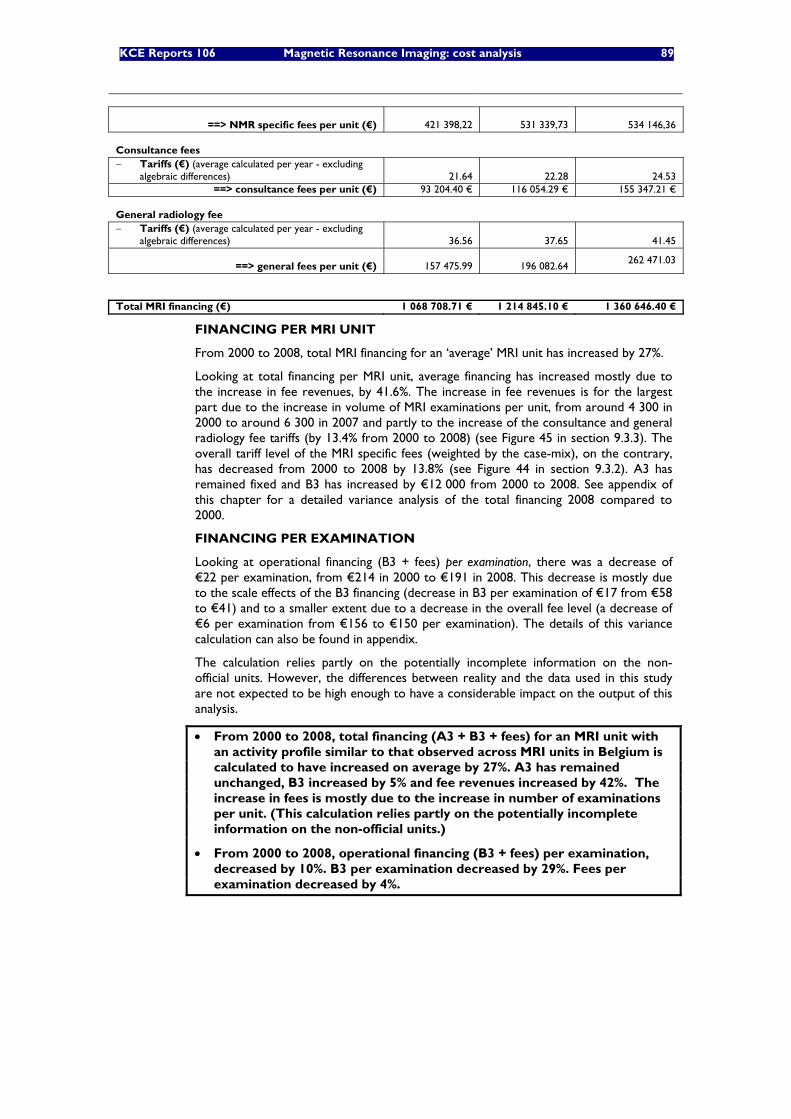
KCE Reports 106 Magnetic Resonance Imaging: cost analysis 89
==> NMR specific fees per unit (€)
421 398,22
531 339,73 534 146,36 Consultance fees − Tariffs (€) (average calculated per year - excluding
algebraic differences) 21.64 22.28 24.53 ==> consultance fees per unit (€) 93 204.40 € 116 054.29 € 155 347.21 €
General radiology fee − Tariffs (€) (average calculated per year - excluding
algebraic differences)
36.56
37.65 41.45
==> general fees per unit (€)
157 475.99
196 082.64 262 471.03
Total MRI financing (€) 1 068 708.71 € 1 214 845.10 € 1 360 646.40 €
FINANCING PER MRI UNIT
From 2000 to 2008, total MRI financing for an ‘average’ MRI unit has increased by 27%.
Looking at total financing per MRI unit, average financing has increased mostly due to the increase in fee revenues, by 41.6%. The increase in fee revenues is for the largest part due to the increase in volume of MRI examinations per unit, from around 4 300 in 2000 to around 6 300 in 2007 and partly to the increase of the consultance and general radiology fee tariffs (by 13.4% from 2000 to 2008) (see Figure 45 in section 9.3.3). The overall tariff level of the MRI specific fees (weighted by the case-mix), on the contrary, has decreased from 2000 to 2008 by 13.8% (see Figure 44 in section 9.3.2). A3 has remained fixed and B3 has increased by €12 000 from 2000 to 2008. See appendix of this chapter for a detailed variance analysis of the total financing 2008 compared to 2000.
FINANCING PER EXAMINATION
Looking at operational financing (B3 + fees) per examination, there was a decrease of €22 per examination, from €214 in 2000 to €191 in 2008. This decrease is mostly due to the scale effects of the B3 financing (decrease in B3 per examination of €17 from €58 to €41) and to a smaller extent due to a decrease in the overall fee level (a decrease of €6 per examination from €156 to €150 per examination). The details of this variance calculation can also be found in appendix.
The calculation relies partly on the potentially incomplete information on the non-official units. However, the differences between reality and the data used in this study are not expected to be high enough to have a considerable impact on the output of this analysis.
• From 2000 to 2008, total financing (A3 + B3 + fees) for an MRI unit with an activity profile similar to that observed across MRI units in Belgium is calculated to have increased on average by 27%. A3 has remained unchanged, B3 increased by 5% and fee revenues increased by 42%. The increase in fees is mostly due to the increase in number of examinations per unit. (This calculation relies partly on the potentially incomplete information on the non-official units.)
• From 2000 to 2008, operational financing (B3 + fees) per examination, decreased by 10%. B3 per examination decreased by 29%. Fees per examination decreased by 4%.
90 Magnetic Resonance Imaging: cost analysis KCE reports 106
9.5 REGIONAL SUBSIDIES FOR BUILDING INVESTMENT For the building investment, it needs to be mentioned that the hospitals may also be eligible for subsidies from the regional subsidizing bodies. The subsidies of hospital infrastructure are regulated in the national law of 23 December 1963 on hospitals, article 46. It stipulates that the regions can subsidize the costs for the building or reconditioning of a hospital or a service.21 The subsidy percentage is determined at 60% of the total investment costs by the royal decree of 13 December 1968.
Depending on the region, there is a different subsidizing body for the health care sector. For Flanders and the Flemish (monolingual) institutes in the Brussels region, there is the Flemish Infrastructure Fund VIPA (“Vlaams Infrastructuurfonds voor Persoonsgebonden Aangelegenheden”). For Wallonia, the division of Health and Infrastructures at the Ministry of the Walloon region is responsible. For the bilingual institutes in the Brussels region, the COCOM (“Commission Communautaire Commune”/”Gemeenschappelijke Gemeenschapscomissie”) is in charge. For the monolingual French institutes in the Brussels region, the COCOF (“Commission Communautaire Française”) is responsible. For the university hospitals in the French community, the French community intervenes. Each of these subsidizing bodies follows the 60% rule of the royal decree of 1968. The VIPA has recently introduced the ‘alternative’ finance system, which implies the possibility to spread the subsidies over 20 years. The settlement of the future subsidy payments is then linked to the fulfilment of certain utilization standards.
For being eligible for these subsidies, the hospital needs to be accredited for an MRI unit and the building infrastructure costs need to be in line with the number of accredited units. The subsidized surface is not constrained by the maximum subsidizable surface per bed. Both new buildings and refurbishment of old buildings may be eligible for subsidies.22
Receiving subsidies for the MRI building seems however more the exception than the rule. According to data from our questionnaire, only 1 out of 11 hospitals for which data on this subject was retrieved explicitly, received regional subsidies. This can likely be explained by the fact the subsidy request needs to be part of a health care strategic plan. In this plan, the hospital needs to formulate its long-term vision with regard to the planned health care services in its region and the role the hospital plays in it. As the accreditation of MRI, however, was not easy to predict for the hospitals, this may have hampered the introduction of subsidy requests for MRI.
• Receiving regional subsidies for the MRI building seems more the exception than the rule.
21 The law also stipulates that the regions can subsidize the costs of the first equipment and the first
purchase of apparatus and heavy medical equipment, but this does not account for MRI. 22 Personal communication from Stefaan Pottie, VIPA.
KCE Reports 106 Magnetic Resonance Imaging: cost analysis 91
10 REFLECTIONS ON FINANCING OPTIONS FOR MRI The aim of this report was to provide an overview of the costs associated with running an MRI facility in a Belgian setting. In this chapter we will briefly reflect on how the financing system for MRI could be changed given the evolution of costs. Different financing options for MRI can be considered. No ‘ideal’ financing system, however, can be designed. Each option has its advantages and disadvantages.
10.1 FULLY VARIABLE FINANCING A completely variable financing system has the risk to create an incentive to produce more (at least if the variable financing exceeds the marginal costs), as higher output volumes imply higher revenues. Each procedure gives rise to a revenue that should cover all variable costs and part of the fixed costs. As the volume increases, more of the fixed costs are covered and beyond the break-even volume, profits will be generated if more procedures are performed.
In order to better fit the cost structure, it can therefore be considered to vary the fee depending on the activity level of the MRI unit. Above a certain threshold of scans (the break-even volume), the fee could be reduced. This is the case in France for the “forfait technique” for MRI (which is used for all patients at public hospitals and ambulatory patients at public hospitals). See appendix of this chapter for details on the French financing system.
Furthermore, this fully variable financing may also depend on the class of the equipment (number of Tesla), in order to better fit the investment costs. However, this adapted financing should take into account the balance of the higher investment costs (in most cases) on one hand, and the potentially higher patient turnover, on the other hand. At this stage it is not known to what extent 3 Tesla units are used for increasing examination rather than for improving imaging quality.
10.2 COMBINATION OF FIXED OR SEMI-VARIABLE AND VARIABLE FINANCING Provided that the fixed financing equals the actual fixed costs and the variable fee equals the variable costs, a combined fixed-variable financing system creates no incentives for more or less procedures. In order to better reflect the cost structure, one can introduce a semi-variable financing instead of a fixed financing to discourage underutilization. This would be the case if the A3 and B3 would be differentiated in function of the activity level of the unit (e.g. full A3-B3 financing is only provided in case of 80% utilization)
10.3 JOINT FINANCING OF MRI AND CT Another financing option is to provide financing which covers both CT and MRI. The financing could be individualised for each hospital in function of a number of patient parameters. As such, the current A3 and B3 financing for MRI could be extended to cover the investment and operational costs of CT as well. Obviously, the variable fee for CT should be reduced accordingly. As such, the hospitals would decide on the number and type of units they invest in, whilst optimizing resource allocation. In order to ensure that the hospitals do not underprovide services or provide low quality care, the level of care provided should be supervised.
92 Magnetic Resonance Imaging: cost analysis KCE reports 106
10.4 FINANCING OF MEDICAL IMAGING BASED ON ICPC’S
Another financing option is an ICPC-based financing for medical imaging. In this system, the current capitation fee for hospitalized patients is extended to a single capitation fee, absorbing all other fees and providing full coverage of all medical imaging acts. This single capitation fee, covering all medical imaging for a specific indication, would reduce specific financial incentives to use one procedure over another (although when the prescriber is a general practitioner, no financial incentives can be at play).
An adequate quality control mechanism is necessary, however, to avoid the systematic use of cheaper imaging procedures or ‘managed underconsumption’. A DRG-based financing is currently used for hospitalized patients in public hospitals in France. Also in Belgium, a DRG-based financing would only be possible for hospitalized (and one-day hospitalisation) patients as no DRG data are recorded for ambulatory patients. Therefore, it can be recommended to register ICPC data instead.
KCE Reports 106 Magnetic Resonance Imaging: cost analysis 93
11 CONCLUSIONS AND DISCUSSION
11.1 LIMITATIONS OF THE COST ANALYSIS Only a limited number of hospitals provided data although all hospitals with an MRI unit were invited to participate. This might cause a selection bias that can work in two directions: either hospitals with a general higher interest in efficient resource use, with a specific interest in the study or with more precise data readily available are more likely to participate or, on the contrary, hospital with inefficient resource are more likely to participate if they want to demonstrate that current financing is insufficient to cover the costs. The sample of hospitals from which data were drawn is therefore not necessarily representative for all MRI services.
Furthermore, the cost analysis relies on actual cost data from the hospitals. These costs do not necessarily reflect the costs of good quality care. The costs of personnel for instance have been calculated based on the resource use as responded by the radiologists and hospitals, instead of on what would be considered as minimum staffing for good quality care.
Furthermore, accounting data from different hospitals are not always readily comparable. Especially with respect to overhead costs there is an important lack of standard approach between hospitals. The type of costs put under the heading “overhead costs” and the allocation basis for overhead costs to different services within a hospital vary largely between hospitals. It is unclear to what extent the differences are due to real differences in the costs of services or to differences in accounting practices. This jeopardizes an accurate cost analysis. The problem of guaranteeing the validity and reliability of the existing financial databases such as Finhosta have already been discussed in a KCE report in 20049 KCE recommended at that time to develop clearer accounting instructions (especially for the honorarium fees) and better control mechanisms to make the data more reliable and useful.
Furthermore, multiple scenarios were analyzed, but these do not cover all variations between hospitals yet. The operational cost analysis aimed at distinguishing the cost of a 1.5 versus 3 Tesla unit and for general versus university hospitals. Given the limited data input, however, not all differences could be captured. For 3 Tesla units, only different input was used for the cost of maintenance, compared to 1.5 Tesla units. In reality, the patient throughput with a 3 Tesla unit is likely higher than with a 1.5 Tesla unit. As, however, no data was available on this difference in throughput, this was not taken into account in the analysis. For university hospitals, only different input parameters were used for the number of physician FTEs, compared to general hospitals. Furthermore costs also depend on the patient mix of the hospital. Hospitalised or polytrauma patients or patients that need to be sedated, for instance, likely require larger time and personnel investment. Not sufficient data was available, however, to model the costs as function of this case mix.
The financing of MRI services for hospitalized patients is not only based on fees-for-service that are specific to MRI. Financing is partly also based on (consultance and general radiology) capitation fees for all medical imaging procedures for hospitalized patients on one hand, and on a general radiology fee-per-prescription which may cover other examinations performed on the same day for ambulatory patients, on the other hand. To get a full picture of the financing of MRI, these capitation fees and fees-per-prescription, should be allocated to MRI. This allocation, however, is cumbersome as it requires considering the costs and financing of all medical imaging procedures and developing appropriate allocation bases to the different procedures. In order to estimate the financing of MRI, it was therefore assumed that all patients were treated and financed in ambulatory setting (in reality 86% of MRI examinations are ambulatory). Furthermore, in the absence of precise data, it was assumed in the base case analyses that the fees-per-prescription in ambulatory setting should cover MRI, regardless of any other medical imaging performed on the same day on the same patient.
94 Magnetic Resonance Imaging: cost analysis KCE reports 106
In sensitivity analyses, the impact of 1.2 to maximum 1.8 examinations per prescription has been examined. For a full assessment of the appropriateness of the financing of medical imaging, a cost analysis should ideally consider all medical imaging.
Financial charges were included in two ways in this analysis. First, the financial charges for MRI and building adaptations were included separately in the yearly investment cost in section 6.4. Second, indirect financial charges were included in the indirect costs section. The indirect financial charges cover the financial charges of the bank accounts of the hospital, which are generally managed centrally. These indirect charges generally comprise the loans for the hospital’s central investments, services and activities but also for the different services within the hospital, amongst which radiology and MRI. As it was not possible to split these indirect charges into central financial charges versus other financial charges, it was decided to include all of the indirect financial charges, although MRI-specific financial charges were already included. By doing so, there may thus be some double counting of financial charges.
Although electricity consumption of the MRI unit is expected to be higher than the average of other hospital services, this has not been taken into account in this analysis as it could not be calculated what proportion of the actual electricity consumption was already covered in the indirect costs allocated per m2. There may thus have been an underestimation of electricity charges.
11.2 A3 FINANCING VERSUS INVESTMENT COSTS The results of the cost analysis show that the fixed investment costs for an MRI unit (of the current generation) and building adaptations are not entirely covered by the current A3 financing. How big the difference is, depends largely on the type of unit (1.5 or 3T), the life length of the unit, the upgrade costs and the cost of building adaptations. Therefore different scenarios were analysed in this report. As most current-generation equipment is still in use, their average lifetime and upgrade costs are not known yet. Therefore it is hard to define an “average” lifetime and upgrade profile. Nevertheless, it cannot be ignored that upgrading for 50% whilst maintaining 100% financing for 7 extra years creates a financial incentive for the hospitals to follow this scenario. The yearly “investment deficit” varies -14 000 tot -92 000 euro for 1.5 Tesla units and from -82 000 to -179 000 euro for 3 Tesla units.
Furthermore, investment costs do not seem to have decreased considerably between 1999 and 2008. Instead, the major trend appears to be that more performing MRI technology is bought at roughly the same price, at least when it concerns 1.5 Tesla MRI units. The investment cost of 3 Tesla units is significantly higher than for 1.5 Tesla units.
11.3 GENERAL REMARK ON A3 FINANCING It is sometimes argued that the A3 financing for MRI, as for other heavy medical technology, fits in a more general financing strategy for hospitals and should therefore not be considered as an earmarked reimbursement for specific investment costs only. It fits into the idea that A3, as part of the so-called “budget of financial means” (Budget Financiële Middelen/Budget des Moyens Financiers), is a contribution to the investment cost of MRI and is not supposed to correspond exactly to the real investment costs of MRI. If the allocated A3 financing is insufficient, the difference might be compensated by other elements within the Budget of Financial Means for which there is an over-financing. Two remarks can be made with respect to this reasoning.
First, in an ideal world the financing of hospital services should equal the costs to the hospital of these services, at least for hospitals that work efficiently (i.e. provide services of good quality at a minimal cost and provide services only where appropriate).{rapport 7 KCE} In practice, however, the financing system is largely based upon negotiations. In as far as these negotiated tariffs or budgets are based on real cost data, as the current study tried to provide for MRI, there is in principle no fundamental problem with this approach. A condition is that appropriate cost data are available for all health services provided within the hospital.
KCE Reports 106 Magnetic Resonance Imaging: cost analysis 95
Such data are not yet available but need to be built up in order to improve the accuracy of the financing system in terms of covering actual costs of hospitals.
Hospital participation and methodological rigour and standardisation are a necessary condition for the success of such exercises. For the costs of physicians at non-university hospitals, we are faced with an additional problem. Although also some market forces are at play (remuneration should be competitive compared to other hospitals and other countries), the remuneration of physicians cannot be handled as a fully exogenous cost factor, but rather as a result of the current financing system.
Second, the collection of cost data will not solve all problems. As any prospective financing system is based on averages, with some corrections for hospitals with a justified higher cost structure, the convergence between financing and real costs of one particular hospital will never be perfect. In practice, hospitals might have a lower cost than the estimated average for some services but a higher cost than the estimated average for other services. In that sense, cross-subsidies of one service to another will always occur to some extent. It cannot be, however, the starting point of the financing system. If the financing fits the average costs, corrected for justified cost differences, hospitals as a group should in principle break even. This does not mean that some hospitals will not make deficits or profits. Deficits can be attributable to inefficient use of resources or imperfect consideration of justifiable cost differences in the financing system (the correction for case-mix will never be perfect).
Third, the current financing is the result of a historical and progressive process. To avoid systematic built-in cross-subsidies and inadequate financing policy makers should ideally start from a ‘tabula rasa’ situation.
11.4 B3 AND HONORARIA FINANCING VERSUS OPERATIONAL COSTS From 2000 to 2007, the number of examinations per MRI unit (including the non-accredited units) has increased by nearly 50% whilst operational hours per unit have remained roughly unchanged. In that period, the average total operational income per unit has increased by nearly 32% (increase of B3 by 5% and of fees by 42%). The operational income per examination has decreased by 10% (from from €214 to €191). This decrease is mostly due to the decrease of the B3 financing per examination (decrease from €58 to €41 per examination) and partly to the decrease in overall fee tariff (decrease from €156 to €150 per examination).
In this cost analysis it was not possible to have a clear view on the financial balance of running an MRI. The main reason for this is that most radiologists were not prepared to reveal their income. This analysis therefore can only give an indication on the operational balance “before physician remuneration” which is to be distributed between the physicians on one hand, as net honoraria, and the hospital on the other hand, to counterbalance the MRI investment deficit and, in practice, also potentially to cross-subsidize other hospital services or to cover the investment costs of a non-accredited MRI unit. How much of the operational surplus is distributed to the radiologists versus to the hospital is not known, and therefore no firm statements can be done on the final profit or loss to the hospitals. For university hospitals, however, where physicians are salaried, data were available. Furthermore, no conclusions can be drawn on the income of radiologists, as they are not known in the first place but also as no “equitable” income could be defined within the scope of this project to compare their actual income with.
For a general hospital with 65 operational hours per week (which is considered as average operational schedule), the average yearly operational balance before physician remuneration is estimated at €650 000 per unit (min. 500 000 euro – max. 780 000 euro). For a 3 Tesla unit (for which a higher maintenance cost was taken into account, but no faster scanning speed), this balance is estimated at €600 000 (min. €450 000– max. €730 000) per unit. Based on data from the questionnaire, on average 1.6 full time physicians are staffed on a unit with 65 operational hours per week at a general hospital.
96 Magnetic Resonance Imaging: cost analysis KCE reports 106
11.5 THE ISSUE OF NON-ACCREDITED MRI UNITS The continuing existence of non-accredited MRI units deserves discussion. Hospitals may decide to install an additional MRI unit for different reasons: reducing waiting times, improving patient services (e.g. MRI is a safer procedure than CT because the patient is not exposed to radiation and therefore more appropriate than CT for some indications), and improving diagnostic quality. Improvement of services to patients will indeed often be one of the arguments but it is naïve to assume that the financial component will be completely neglected in the decision. In case of a non-accredited MRI, the fixed costs need to be covered by other sources than the A3 and B3 financing. Systematic compensation of non-accredited MRIs by other financial means deserves attention, as it cannot be the incentive of the hospital financing system to build in cross-subsidies to services for which the hospital has not received accreditation in a systematic manner. At least the system should not be based on them.
11.6 ALIGNMENT OF MRI WITH CT As there is no data available on the appropriateness of current prescriptions and the adequacy of the examinations compared to the clinical guidelines, it was impossible to calculate the number of MRI units needed in Belgium that could be scientifically justified. Nevertheless, we found in a previous report2 that the current CT to MRI ratio in Belgium is high compared to that in other European countries. Given the possibility to substitute CT by MRI in some indications and given the absence of harmful radiation in case of MRI, the system should not be such that CT is provided instead of MRI for other than medical reasons (i.e. programming or financial reasons).
As the optimum level of MRI services is not known, programming has the drawback that when the number of accreditations is set too low, sufficient and timely access to MRI services may not be guaranteed to the patient. On the other hand, when the number of accreditations is set too high, there is a risk of overprovision of services or underutilisation of equipment. As the current number of MRI units still seems relatively low compared to other countries, the problem of underutilization does not seem actually to occur.
On the condition that the financing system does not encourage over- or underutilisation, abandoning the programming has the advantage that the number of MRI units will be determined by the patient needs in each hospital. In case of abandoning the programming, fixed financing should be stopped in order to avoid underutilization. Options for variable or semi-variable financing and the mechanisms for avoiding over- and underutilization are discussed further in this section.
When programming of MRI is continued, it may be considered to base the accreditations on ambulatory rather than on hospitalisation parameters, as the bulk of MRI scans is done in ambulatory setting.
In case of programming, appropriate consideration should also be made of the availability of the technical, nursing, paramedical and medical staff required to operate an MRI unit. There is no use in planning additional MRI units in the absence of people capable of running the unit.
Given the lack of data on justification of current examinations, the appropriateness of use of CT and MRI should be adequately controlled especially in case of a completely variable financing system. One way to do this is through the definition of non-accumulation rules for MRI versus CT in the nomenclature. Furthermore, professional organisations can provide feedback to the radiology services on their profile of use of CT versus MRI for different indications, as well as their relative position compared to other radiology services. Another alternative is to close contractual agreements with hospitals in which a certain substitution from CT by MRI is agreed in exchange for installation of an (extra) MRI unit.

KCE Reports 106 Magnetic Resonance Imaging: cost analysis 97
Furthermore, besides the programming issue, also the financing system should avoid that CT is preferred to MRI for other than medical reasons. In the absence of a cost analysis of CT, it is unclear whether specific financial incentives are currently created to prefer CT over MRI, besides the programming constraints. CT is currently almost entirely financed on a fee-for-service basis, while for MRI a combination of fixed and variable financing is provided.
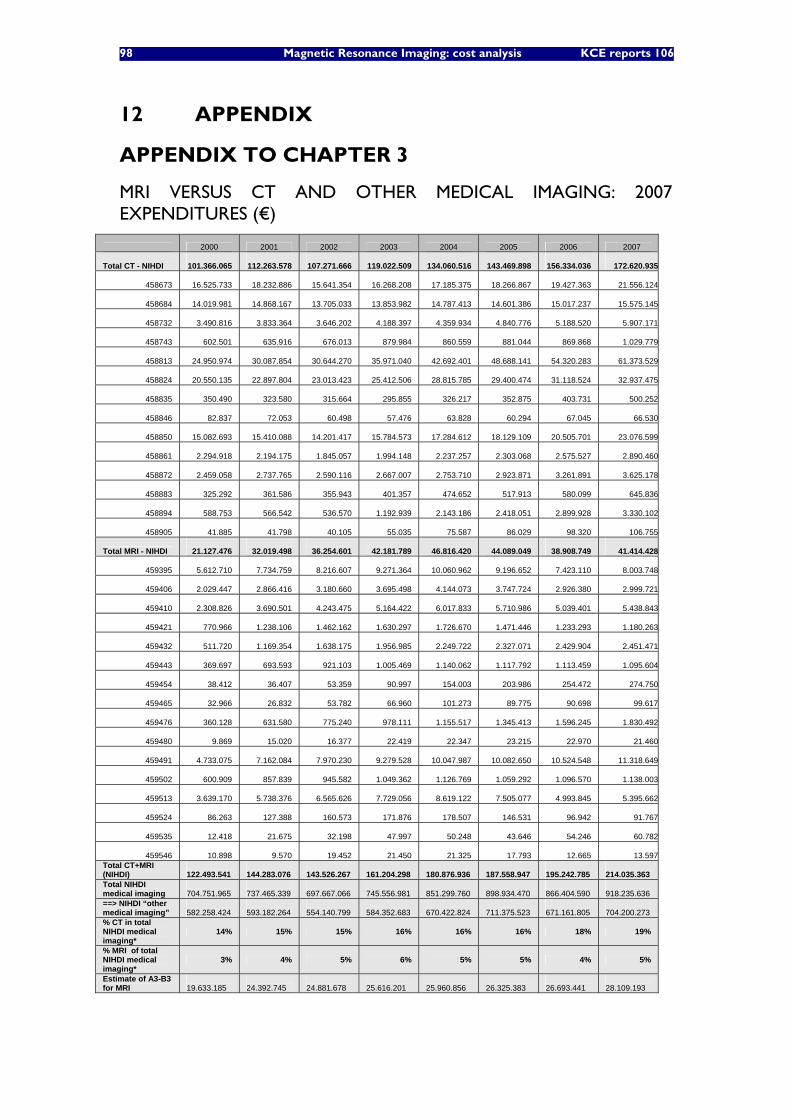
98 Magnetic Resonance Imaging: cost analysis KCE reports 106
12 APPENDIX
APPENDIX TO CHAPTER 3
MRI VERSUS CT AND OTHER MEDICAL IMAGING: 2007 EXPENDITURES (€)
2000 2001 2002 2003 2004 2005 2006 2007
Total CT - NIHDI
101.366.065
112.263.578
107.271.666
119.022.509
134.060.516
143.469.898
156.334.036 172.620.935
458673
16.525.733
18.232.886
15.641.354
16.268.208
17.185.375
18.266.867
19.427.363 21.556.124
458684
14.019.981
14.868.167
13.705.033
13.853.982
14.787.413
14.601.386
15.017.237 15.575.145
458732
3.490.816
3.833.364
3.646.202
4.188.397
4.359.934
4.840.776
5.188.520 5.907.171
458743
602.501
635.916
676.013
879.984
860.559
881.044
869.868 1.029.779
458813
24.950.974
30.087.854
30.644.270
35.971.040
42.692.401
48.688.141
54.320.283 61.373.529
458824
20.550.135
22.897.804
23.013.423
25.412.506
28.815.785
29.400.474
31.118.524 32.937.475
458835
350.490
323.580
315.664
295.855
326.217
352.875
403.731 500.252
458846
82.837
72.053
60.498
57.476
63.828
60.294
67.045 66.530
458850
15.082.693
15.410.088
14.201.417
15.784.573
17.284.612
18.129.109
20.505.701 23.076.599
458861
2.294.918
2.194.175
1.845.057
1.994.148
2.237.257
2.303.068
2.575.527 2.890.460
458872
2.459.058
2.737.765
2.590.116
2.667.007
2.753.710
2.923.871
3.261.891 3.625.178
458883
325.292
361.586
355.943
401.357
474.652
517.913
580.099 645.836
458894
588.753
566.542
536.570
1.192.939
2.143.186
2.418.051
2.899.928 3.330.102
458905
41.885
41.798
40.105
55.035
75.587
86.029
98.320 106.755
Total MRI - NIHDI
21.127.476
32.019.498
36.254.601
42.181.789
46.816.420
44.089.049
38.908.749 41.414.428
459395
5.612.710
7.734.759
8.216.607
9.271.364
10.060.962
9.196.652
7.423.110 8.003.748
459406
2.029.447
2.866.416
3.180.660
3.695.498
4.144.073
3.747.724
2.926.380 2.999.721
459410
2.308.826
3.690.501
4.243.475
5.164.422
6.017.833
5.710.986
5.039.401 5.438.843
459421
770.966
1.238.106
1.462.162
1.630.297
1.726.670
1.471.446
1.233.293 1.180.263
459432
511.720
1.169.354
1.638.175
1.956.985
2.249.722
2.327.071
2.429.904 2.451.471
459443
369.697
693.593
921.103
1.005.469
1.140.062
1.117.792
1.113.459 1.095.604
459454
38.412
36.407
53.359
90.997
154.003
203.986
254.472 274.750
459465
32.966
26.832
53.782
66.960
101.273
89.775
90.698 99.617
459476
360.128
631.580
775.240
978.111
1.155.517
1.345.413
1.596.245 1.830.492
459480
9.869
15.020
16.377
22.419
22.347
23.215
22.970 21.460
459491
4.733.075
7.162.084
7.970.230
9.279.528
10.047.987
10.082.650
10.524.548 11.318.649
459502
600.909
857.839
945.582
1.049.362
1.126.769
1.059.292
1.096.570 1.138.003
459513
3.639.170
5.738.376
6.565.626
7.729.056
8.619.122
7.505.077
4.993.845 5.395.662
459524
86.263
127.388
160.573
171.876
178.507
146.531
96.942 91.767
459535
12.418
21.675
32.198
47.997
50.248
43.646
54.246 60.782
459546
10.898
9.570
19.452
21.450
21.325
17.793
12.665 13.597Total CT+MRI (NIHDI)
122.493.541
144.283.076
143.526.267
161.204.298
180.876.936
187.558.947
195.242.785
214.035.363
Total NIHDI medical imaging
704.751.965
737.465.339
697.667.066
745.556.981
851.299.760
898.934.470
866.404.590
918.235.636
==> NIHDI “other medical imaging”
582.258.424
593.182.264
554.140.799
584.352.683
670.422.824
711.375.523
671.161.805
704.200.273
% CT in total NIHDI medical imaging*
14% 15% 15% 16% 16% 16% 18% 19%
% MRI of total NIHDI medical imaging*
3% 4% 5% 6% 5% 5% 4% 5%
Estimate of A3-B3 for MRI
19.633.185
24.392.745
24.881.678
25.616.201
25.960.856
26.325.383
26.693.441
28.109.193
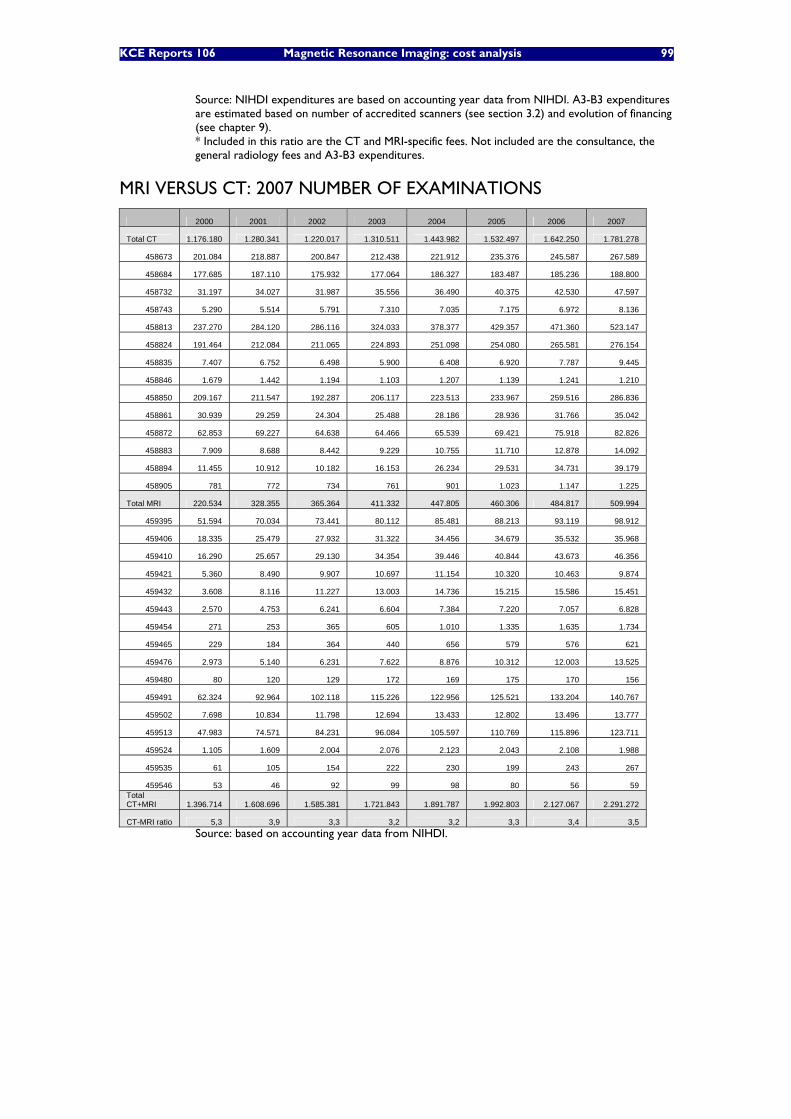
KCE Reports 106 Magnetic Resonance Imaging: cost analysis 99
Source: NIHDI expenditures are based on accounting year data from NIHDI. A3-B3 expenditures are estimated based on number of accredited scanners (see section 3.2) and evolution of financing (see chapter 9). * Included in this ratio are the CT and MRI-specific fees. Not included are the consultance, the general radiology fees and A3-B3 expenditures.
MRI VERSUS CT: 2007 NUMBER OF EXAMINATIONS
2000 2001 2002 2003 2004 2005 2006 2007
Total CT 1.176.180 1.280.341 1.220.017 1.310.511 1.443.982 1.532.497 1.642.250 1.781.278
458673 201.084 218.887 200.847 212.438 221.912 235.376 245.587 267.589
458684 177.685 187.110 175.932 177.064 186.327 183.487 185.236 188.800
458732 31.197 34.027 31.987 35.556 36.490 40.375 42.530 47.597
458743 5.290 5.514 5.791 7.310 7.035 7.175 6.972 8.136
458813 237.270 284.120 286.116 324.033 378.377 429.357 471.360 523.147
458824 191.464 212.084 211.065 224.893 251.098 254.080 265.581 276.154
458835 7.407 6.752 6.498 5.900 6.408 6.920 7.787 9.445
458846 1.679 1.442 1.194 1.103 1.207 1.139 1.241 1.210
458850 209.167 211.547 192.287 206.117 223.513 233.967 259.516 286.836
458861 30.939 29.259 24.304 25.488 28.186 28.936 31.766 35.042
458872 62.853 69.227 64.638 64.466 65.539 69.421 75.918 82.826
458883 7.909 8.688 8.442 9.229 10.755 11.710 12.878 14.092
458894 11.455 10.912 10.182 16.153 26.234 29.531 34.731 39.179
458905 781 772 734 761 901 1.023 1.147 1.225
Total MRI 220.534 328.355 365.364 411.332 447.805 460.306 484.817 509.994
459395 51.594 70.034 73.441 80.112 85.481 88.213 93.119 98.912
459406 18.335 25.479 27.932 31.322 34.456 34.679 35.532 35.968
459410 16.290 25.657 29.130 34.354 39.446 40.844 43.673 46.356
459421 5.360 8.490 9.907 10.697 11.154 10.320 10.463 9.874
459432 3.608 8.116 11.227 13.003 14.736 15.215 15.586 15.451
459443 2.570 4.753 6.241 6.604 7.384 7.220 7.057 6.828
459454 271 253 365 605 1.010 1.335 1.635 1.734
459465 229 184 364 440 656 579 576 621
459476 2.973 5.140 6.231 7.622 8.876 10.312 12.003 13.525
459480 80 120 129 172 169 175 170 156
459491 62.324 92.964 102.118 115.226 122.956 125.521 133.204 140.767
459502 7.698 10.834 11.798 12.694 13.433 12.802 13.496 13.777
459513 47.983 74.571 84.231 96.084 105.597 110.769 115.896 123.711
459524 1.105 1.609 2.004 2.076 2.123 2.043 2.108 1.988
459535 61 105 154 222 230 199 243 267
459546 53 46 92 99 98 80 56 59 Total CT+MRI 1.396.714 1.608.696 1.585.381 1.721.843 1.891.787 1.992.803 2.127.067 2.291.272
CT-MRI ratio 5,3 3,9 3,3 3,2 3,2 3,3 3,4 3,5 Source: based on accounting year data from NIHDI.
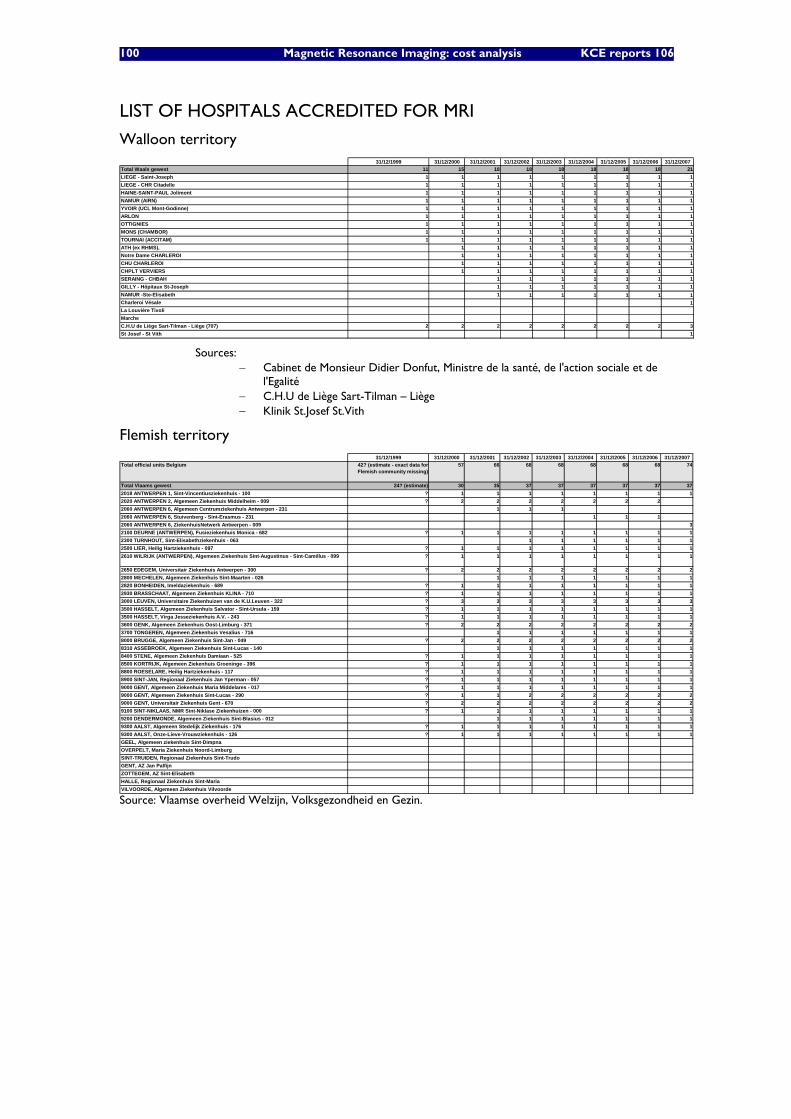
100 Magnetic Resonance Imaging: cost analysis KCE reports 106
LIST OF HOSPITALS ACCREDITED FOR MRI
Walloon territory 31/12/1999 31/12/2000 31/12/2001 31/12/2002 31/12/2003 31/12/2004 31/12/2005 31/12/2006 31/12/2007
Total Waals gewest 11 15 18 18 18 18 18 18 21LIEGE - Saint-Joseph 1 1 1 1 1 1 1 1 1LIEGE - CHR Citadelle 1 1 1 1 1 1 1 1 1HAINE-SAINT-PAUL Jolimont 1 1 1 1 1 1 1 1 1NAMUR (AIRN) 1 1 1 1 1 1 1 1 1YVOIR (UCL Mont-Godinne) 1 1 1 1 1 1 1 1 1ARLON 1 1 1 1 1 1 1 1 1OTTIGNIES 1 1 1 1 1 1 1 1 1MONS (CHAMBOR) 1 1 1 1 1 1 1 1 1TOURNAI (ACCITAM) 1 1 1 1 1 1 1 1 1ATH (ex RHMS), 1 1 1 1 1 1 1 1Notre Dame CHARLEROI 1 1 1 1 1 1 1 1CHU CHARLEROI 1 1 1 1 1 1 1 1CHPLT VERVIERS 1 1 1 1 1 1 1 1SERAING - CHBAH 1 1 1 1 1 1 1GILLY - Hôpitaux St-Joseph 1 1 1 1 1 1 1NAMUR -Ste-Elisabeth 1 1 1 1 1 1 1Charleroi Vésale 1La Louvière TivoliMarcheC.H.U de Liège Sart-Tilman - Liège (707) 2 2 2 2 2 2 2 2 3St Josef - St Vith 1
Sources: − Cabinet de Monsieur Didier Donfut, Ministre de la santé, de l'action sociale et de
l'Egalité − C.H.U de Liège Sart-Tilman – Liège − Klinik St.Josef St.Vith
Flemish territory 31/12/1999 31/12/2000 31/12/2001 31/12/2002 31/12/2003 31/12/2004 31/12/2005 31/12/2006 31/12/2007
Total official units Belgium 42? (estimate - exact data for Flemish community missing)
57 66 68 68 68 68 68 74
Total Vlaams gewest 24? (estimate) 30 35 37 37 37 37 37 372018 ANTWERPEN 1, Sint-Vincentiusziekenhuis - 100 ? 1 1 1 1 1 1 1 12020 ANTWERPEN 2, Algemeen Ziekenhuis Middelheim - 009 ? 2 2 2 2 2 2 22060 ANTWERPEN 6, Algemeen Centrumziekenhuis Antwerpen - 231 1 1 12060 ANTWERPEN 6, Stuivenberg - Sint-Erasmus - 231 1 1 12060 ANTWERPEN 6, ZiekenhuisNetwerk Antwerpen - 009 32100 DEURNE (ANTWERPEN), Fusieziekenhuis Monica - 682 ? 1 1 1 1 1 1 1 12300 TURNHOUT, Sint-Elisabethziekenhuis - 063 1 1 1 1 1 12500 LIER, Heilig Hartziekenhuis - 097 ? 1 1 1 1 1 1 1 12610 WILRIJK (ANTWERPEN), Algemeen Ziekenhuis Sint-Augustinus - Sint-Camillus - 099 ? 1 1 1 1 1 1 1 1
2650 EDEGEM, Universitair Ziekenhuis Antwerpen - 300 ? 2 2 2 2 2 2 2 22800 MECHELEN, Algemeen Ziekenhuis Sint-Maarten - 026 1 1 1 1 1 1 12820 BONHEIDEN, Imeldaziekenhuis - 689 ? 1 1 1 1 1 1 1 12930 BRASSCHAAT, Algemeen Ziekenhuis KLINA - 710 ? 1 1 1 1 1 1 1 13000 LEUVEN, Universitaire Ziekenhuizen van de K.U.Leuven - 322 ? 3 3 3 3 3 3 3 33500 HASSELT, Algemeen Ziekenhuis Salvator - Sint-Ursula - 159 ? 1 1 1 1 1 1 1 13500 HASSELT, Virga Jesseziekenhuis A.V. - 243 ? 1 1 1 1 1 1 1 13600 GENK, Algemeen Ziekenhuis Oost-Limburg - 371 ? 2 2 2 2 2 2 2 23700 TONGEREN, Algemeen Ziekenhuis Vesalius - 716 1 1 1 1 1 1 18000 BRUGGE, Algemeen Ziekenhuis Sint-Jan - 049 ? 2 2 2 2 2 2 2 28310 ASSEBROEK, Algemeen Ziekenhuis Sint-Lucas - 140 1 1 1 1 1 1 18400 STENE, Algemeen Ziekenhuis Damiaan - 525 ? 1 1 1 1 1 1 1 18500 KORTRIJK, Algemeen Ziekenhuis Groeninge - 396 ? 1 1 1 1 1 1 1 18800 ROESELARE, Heilig Hartziekenhuis - 117 ? 1 1 1 1 1 1 1 18900 SINT-JAN, Regionaal Ziekenhuis Jan Yperman - 057 ? 1 1 1 1 1 1 1 19000 GENT, Algemeen Ziekenhuis Maria Middelares - 017 ? 1 1 1 1 1 1 1 19000 GENT, Algemeen Ziekenhuis Sint-Lucas - 290 ? 1 1 2 2 2 2 2 29000 GENT, Universitair Ziekenhuis Gent - 670 ? 2 2 2 2 2 2 2 29100 SINT-NIKLAAS, NMR Sint-Niklase Ziekenhuizen - 000 ? 1 1 1 1 1 1 1 19200 DENDERMONDE, Algemeen Ziekenhuis Sint-Blasius - 012 1 1 1 1 1 1 19300 AALST, Algemeen Stedelijk Ziekenhuis - 176 ? 1 1 1 1 1 1 1 19300 AALST, Onze-Lieve-Vrouwziekenhuis - 126 ? 1 1 1 1 1 1 1 1GEEL, Algemeen ziekenhuis Sint-DimpnaOVERPELT, Maria Ziekenhuis Noord-LimburgSINT-TRUIDEN, Regionaal Ziekenhuis Sint-TrudoGENT, AZ Jan PalfijnZOTTEGEM, AZ Sint-ElisabethHALLE, Regionaal Ziekenhuis Sint-MariaVILVOORDE, Algemeen Ziekenhuis Vilvoorde
Source: Vlaamse overheid Welzijn, Volksgezondheid en Gezin.
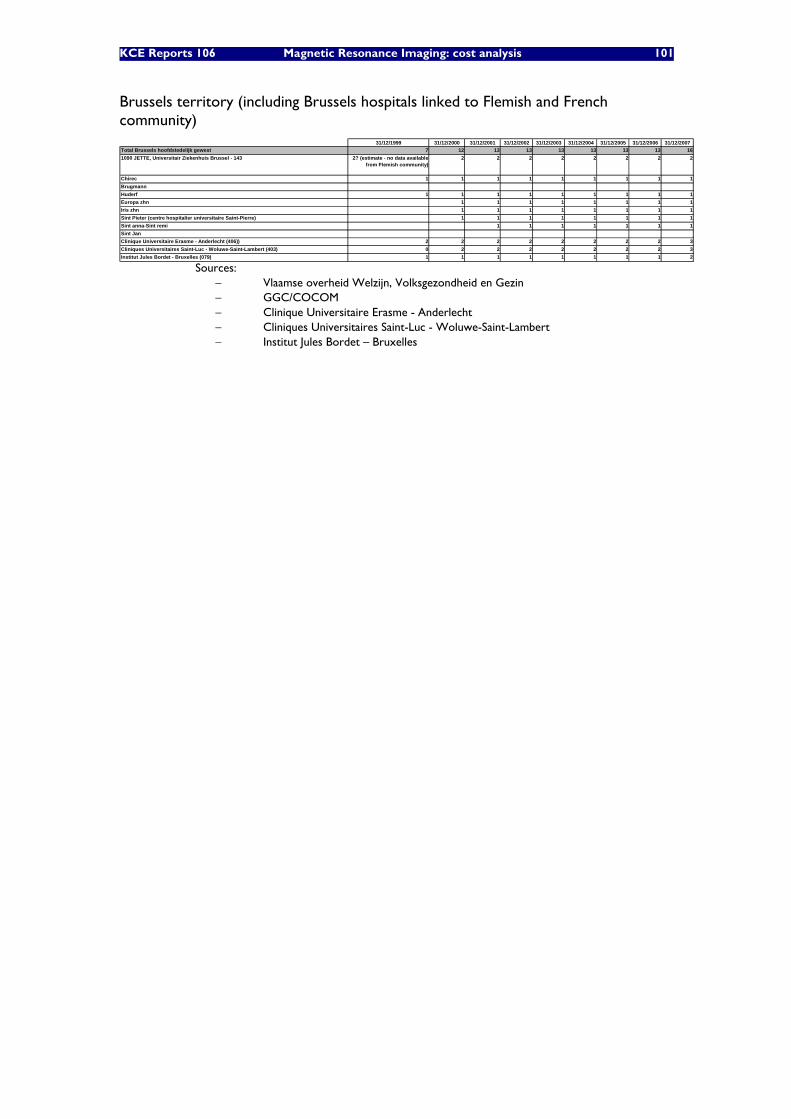
KCE Reports 106 Magnetic Resonance Imaging: cost analysis 101
Brussels territory (including Brussels hospitals linked to Flemish and French community)
31/12/1999 31/12/2000 31/12/2001 31/12/2002 31/12/2003 31/12/2004 31/12/2005 31/12/2006 31/12/2007Total Brussels hoofdstedelijk gewest 7 12 13 13 13 13 13 13 161090 JETTE, Universitair Ziekenhuis Brussel - 143 2? (estimate - no data available
from Flemish community)2 2 2 2 2 2 2 2
Chirec 1 1 1 1 1 1 1 1 1BrugmannHuderf 1 1 1 1 1 1 1 1 1Europa zhn 1 1 1 1 1 1 1 1Iris zhn 1 1 1 1 1 1 1 1Sint Pieter (centre hospitalier universitaire Saint-Pierre) 1 1 1 1 1 1 1 1Sint anna-Sint remi 1 1 1 1 1 1 1Sint JanClinique Universitaire Erasme - Anderlecht (406)) 2 2 2 2 2 2 2 2 3Cliniques Universitaires Saint-Luc - Woluwe-Saint-Lambert (403) 0 2 2 2 2 2 2 2 3Institut Jules Bordet - Bruxelles (079) 1 1 1 1 1 1 1 1 2
Sources: − Vlaamse overheid Welzijn, Volksgezondheid en Gezin − GGC/COCOM − Clinique Universitaire Erasme - Anderlecht − Cliniques Universitaires Saint-Luc - Woluwe-Saint-Lambert − Institut Jules Bordet – Bruxelles
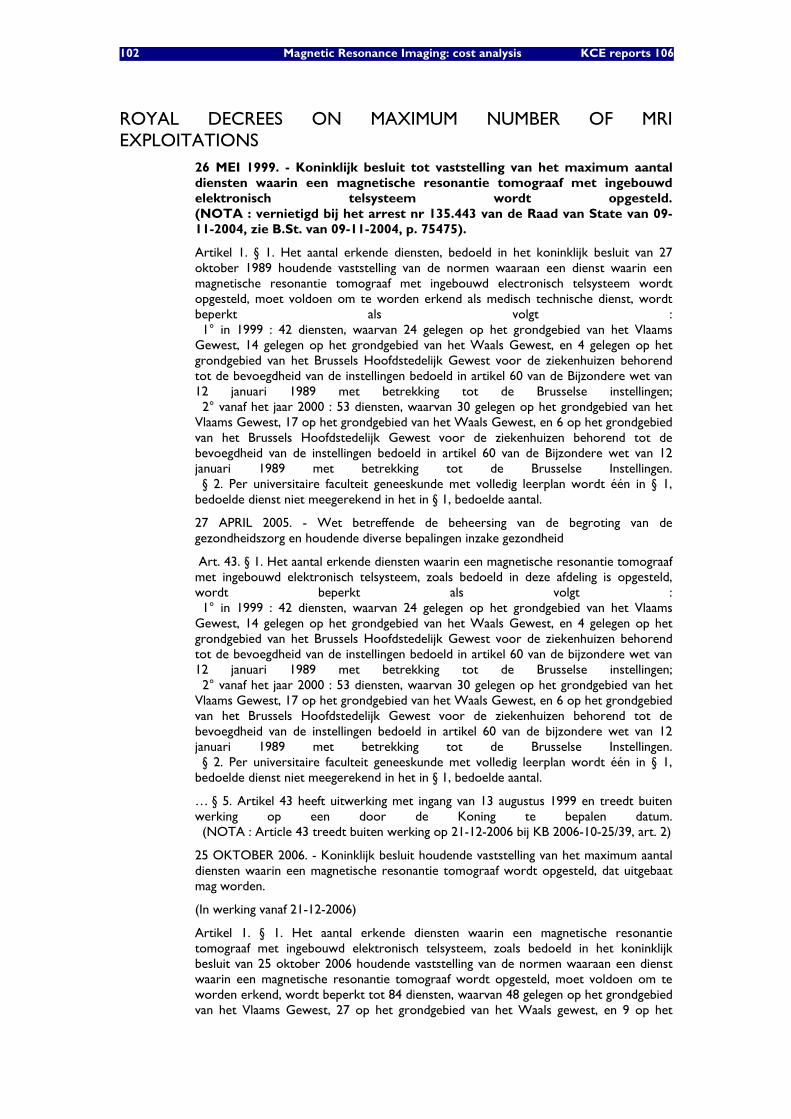
102 Magnetic Resonance Imaging: cost analysis KCE reports 106
ROYAL DECREES ON MAXIMUM NUMBER OF MRI EXPLOITATIONS
26 MEI 1999. - Koninklijk besluit tot vaststelling van het maximum aantal diensten waarin een magnetische resonantie tomograaf met ingebouwd elektronisch telsysteem wordt opgesteld. (NOTA : vernietigd bij het arrest nr 135.443 van de Raad van State van 09-11-2004, zie B.St. van 09-11-2004, p. 75475).
Artikel 1. § 1. Het aantal erkende diensten, bedoeld in het koninklijk besluit van 27 oktober 1989 houdende vaststelling van de normen waaraan een dienst waarin een magnetische resonantie tomograaf met ingebouwd electronisch telsysteem wordt opgesteld, moet voldoen om te worden erkend als medisch technische dienst, wordt beperkt als volgt : 1° in 1999 : 42 diensten, waarvan 24 gelegen op het grondgebied van het Vlaams Gewest, 14 gelegen op het grondgebied van het Waals Gewest, en 4 gelegen op het grondgebied van het Brussels Hoofdstedelijk Gewest voor de ziekenhuizen behorend tot de bevoegdheid van de instellingen bedoeld in artikel 60 van de Bijzondere wet van 12 januari 1989 met betrekking tot de Brusselse instellingen; 2° vanaf het jaar 2000 : 53 diensten, waarvan 30 gelegen op het grondgebied van het Vlaams Gewest, 17 op het grondgebied van het Waals Gewest, en 6 op het grondgebied van het Brussels Hoofdstedelijk Gewest voor de ziekenhuizen behorend tot de bevoegdheid van de instellingen bedoeld in artikel 60 van de Bijzondere wet van 12 januari 1989 met betrekking tot de Brusselse Instellingen. § 2. Per universitaire faculteit geneeskunde met volledig leerplan wordt één in § 1, bedoelde dienst niet meegerekend in het in § 1, bedoelde aantal.
27 APRIL 2005. - Wet betreffende de beheersing van de begroting van de gezondheidszorg en houdende diverse bepalingen inzake gezondheid
Art. 43. § 1. Het aantal erkende diensten waarin een magnetische resonantie tomograaf met ingebouwd elektronisch telsysteem, zoals bedoeld in deze afdeling is opgesteld, wordt beperkt als volgt : 1° in 1999 : 42 diensten, waarvan 24 gelegen op het grondgebied van het Vlaams Gewest, 14 gelegen op het grondgebied van het Waals Gewest, en 4 gelegen op het grondgebied van het Brussels Hoofdstedelijk Gewest voor de ziekenhuizen behorend tot de bevoegdheid van de instellingen bedoeld in artikel 60 van de bijzondere wet van 12 januari 1989 met betrekking tot de Brusselse instellingen; 2° vanaf het jaar 2000 : 53 diensten, waarvan 30 gelegen op het grondgebied van het Vlaams Gewest, 17 op het grondgebied van het Waals Gewest, en 6 op het grondgebied van het Brussels Hoofdstedelijk Gewest voor de ziekenhuizen behorend tot de bevoegdheid van de instellingen bedoeld in artikel 60 van de bijzondere wet van 12 januari 1989 met betrekking tot de Brusselse Instellingen. § 2. Per universitaire faculteit geneeskunde met volledig leerplan wordt één in § 1, bedoelde dienst niet meegerekend in het in § 1, bedoelde aantal.
… § 5. Artikel 43 heeft uitwerking met ingang van 13 augustus 1999 en treedt buiten werking op een door de Koning te bepalen datum. (NOTA : Article 43 treedt buiten werking op 21-12-2006 bij KB 2006-10-25/39, art. 2)
25 OKTOBER 2006. - Koninklijk besluit houdende vaststelling van het maximum aantal diensten waarin een magnetische resonantie tomograaf wordt opgesteld, dat uitgebaat mag worden.
(In werking vanaf 21-12-2006)
Artikel 1. § 1. Het aantal erkende diensten waarin een magnetische resonantie tomograaf met ingebouwd elektronisch telsysteem, zoals bedoeld in het koninklijk besluit van 25 oktober 2006 houdende vaststelling van de normen waaraan een dienst waarin een magnetische resonantie tomograaf wordt opgesteld, moet voldoen om te worden erkend, wordt beperkt tot 84 diensten, waarvan 48 gelegen op het grondgebied van het Vlaams Gewest, 27 op het grondgebied van het Waals gewest, en 9 op het
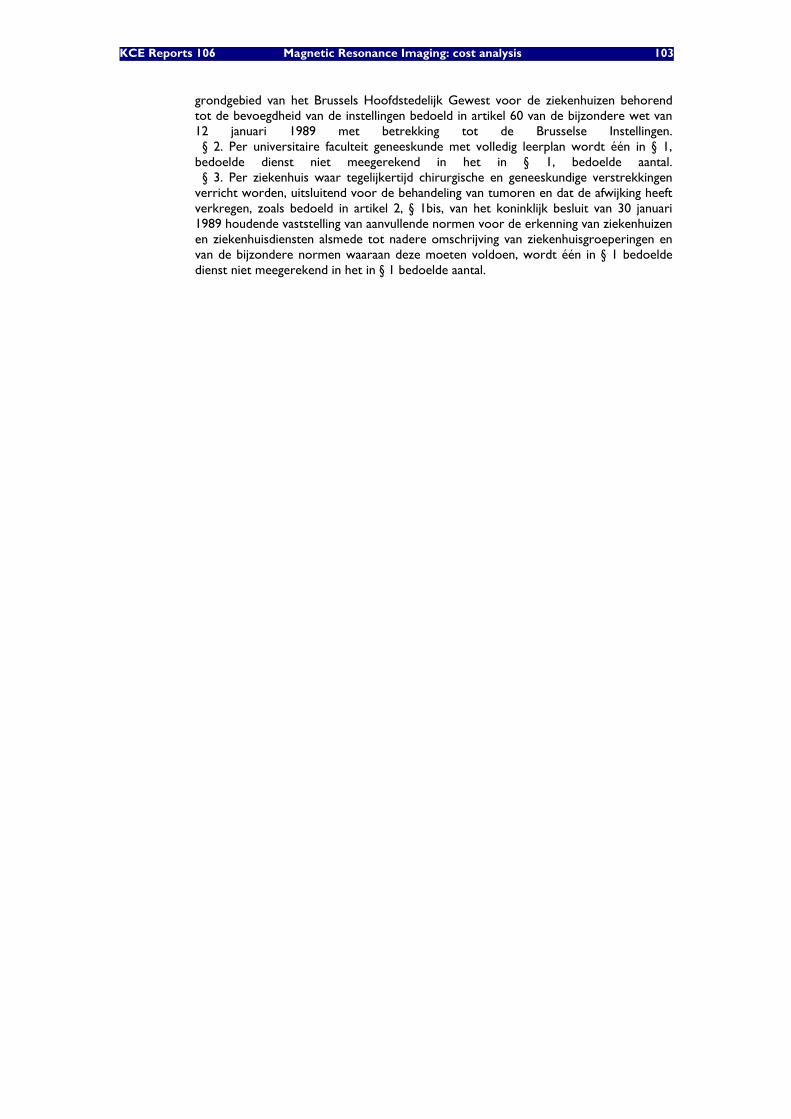
KCE Reports 106 Magnetic Resonance Imaging: cost analysis 103
grondgebied van het Brussels Hoofdstedelijk Gewest voor de ziekenhuizen behorend tot de bevoegdheid van de instellingen bedoeld in artikel 60 van de bijzondere wet van 12 januari 1989 met betrekking tot de Brusselse Instellingen. § 2. Per universitaire faculteit geneeskunde met volledig leerplan wordt één in § 1, bedoelde dienst niet meegerekend in het in § 1, bedoelde aantal. § 3. Per ziekenhuis waar tegelijkertijd chirurgische en geneeskundige verstrekkingen verricht worden, uitsluitend voor de behandeling van tumoren en dat de afwijking heeft verkregen, zoals bedoeld in artikel 2, § 1bis, van het koninklijk besluit van 30 januari 1989 houdende vaststelling van aanvullende normen voor de erkenning van ziekenhuizen en ziekenhuisdiensten alsmede tot nadere omschrijving van ziekenhuisgroeperingen en van de bijzondere normen waaraan deze moeten voldoen, wordt één in § 1 bedoelde dienst niet meegerekend in het in § 1 bedoelde aantal.
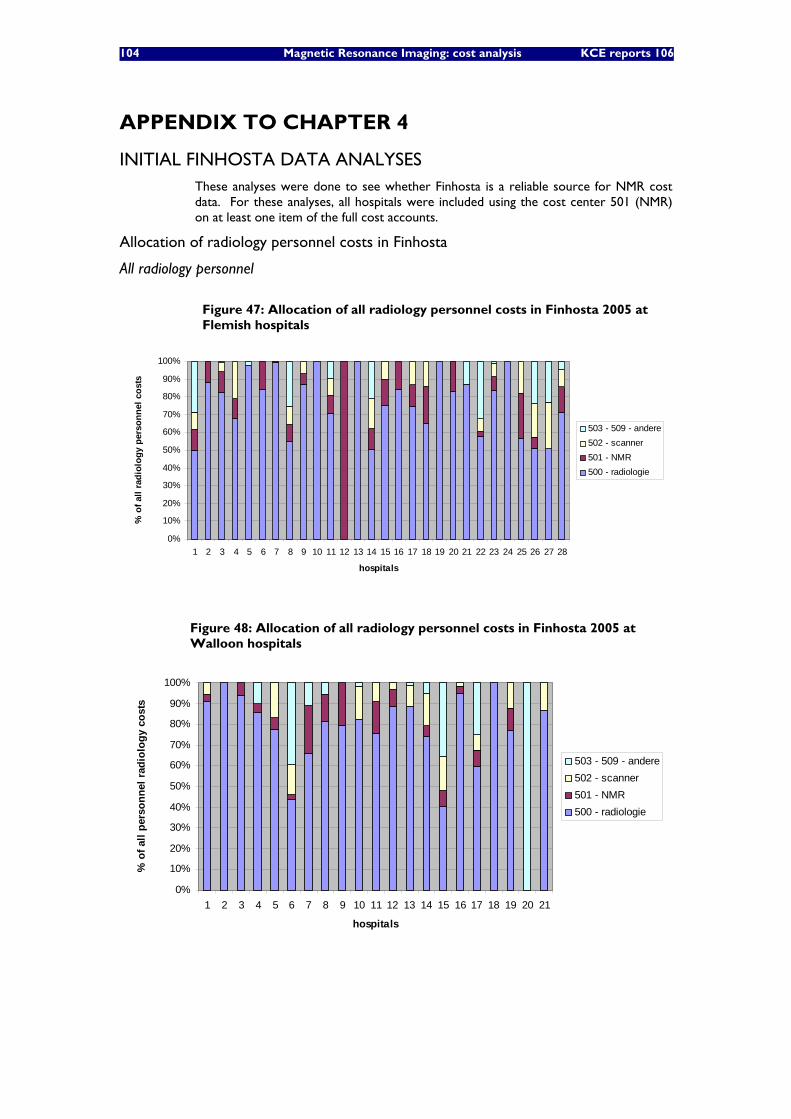
104 Magnetic Resonance Imaging: cost analysis KCE reports 106
APPENDIX TO CHAPTER 4
INITIAL FINHOSTA DATA ANALYSES These analyses were done to see whether Finhosta is a reliable source for NMR cost data. For these analyses, all hospitals were included using the cost center 501 (NMR) on at least one item of the full cost accounts.
Allocation of radiology personnel costs in Finhosta
All radiology personnel
Figure 47: Allocation of all radiology personnel costs in Finhosta 2005 at Flemish hospitals
0%
10%
20%
30%
40%
50%
60%
70%
80%
90%
100%
1 2 3 4 5 6 7 8 9 10 11 12 13 14 15 16 17 18 19 20 21 22 23 24 25 26 27 28
hospitals
% o
f all
radi
olog
y pe
rson
nel c
osts
503 - 509 - andere502 - scanner501 - NMR500 - radiologie
Figure 48: Allocation of all radiology personnel costs in Finhosta 2005 at Walloon hospitals
0%
10%
20%
30%
40%
50%
60%
70%
80%
90%
100%
1 2 3 4 5 6 7 8 9 10 11 12 13 14 15 16 17 18 19 20 21
hospitals
% o
f all
pers
onne
l rad
iolo
gy c
osts
503 - 509 - andere502 - scanner501 - NMR500 - radiologie
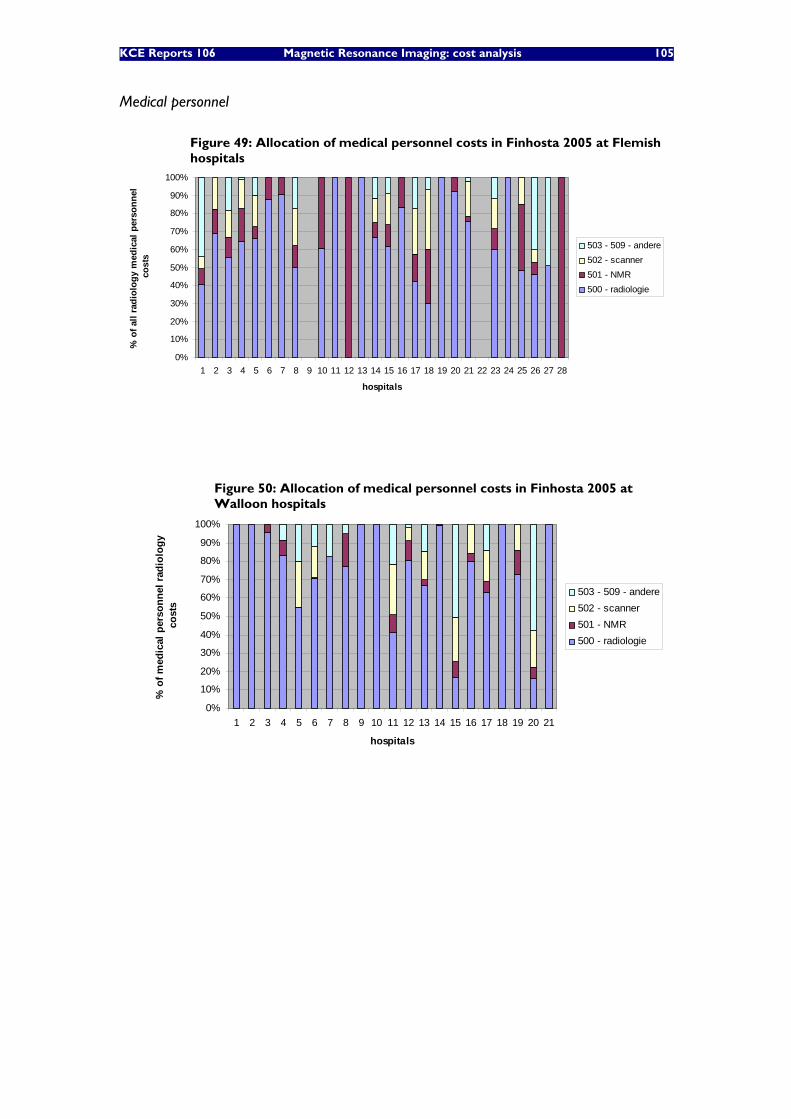
KCE Reports 106 Magnetic Resonance Imaging: cost analysis 105
Medical personnel
Figure 49: Allocation of medical personnel costs in Finhosta 2005 at Flemish hospitals
0%
10%
20%
30%
40%
50%
60%
70%
80%
90%
100%
1 2 3 4 5 6 7 8 9 10 11 12 13 14 15 16 17 18 19 20 21 22 23 24 25 26 27 28
hospitals
% o
f all
radi
olog
y m
edic
al p
erso
nnel
co
sts
503 - 509 - andere502 - scanner501 - NMR500 - radiologie
Figure 50: Allocation of medical personnel costs in Finhosta 2005 at Walloon hospitals
0%
10%
20%
30%
40%
50%
60%
70%
80%
90%
100%
1 2 3 4 5 6 7 8 9 10 11 12 13 14 15 16 17 18 19 20 21
hospitals
% o
f med
ical
per
sonn
el r
adio
logy
co
sts
503 - 509 - andere502 - scanner501 - NMR500 - radiologie
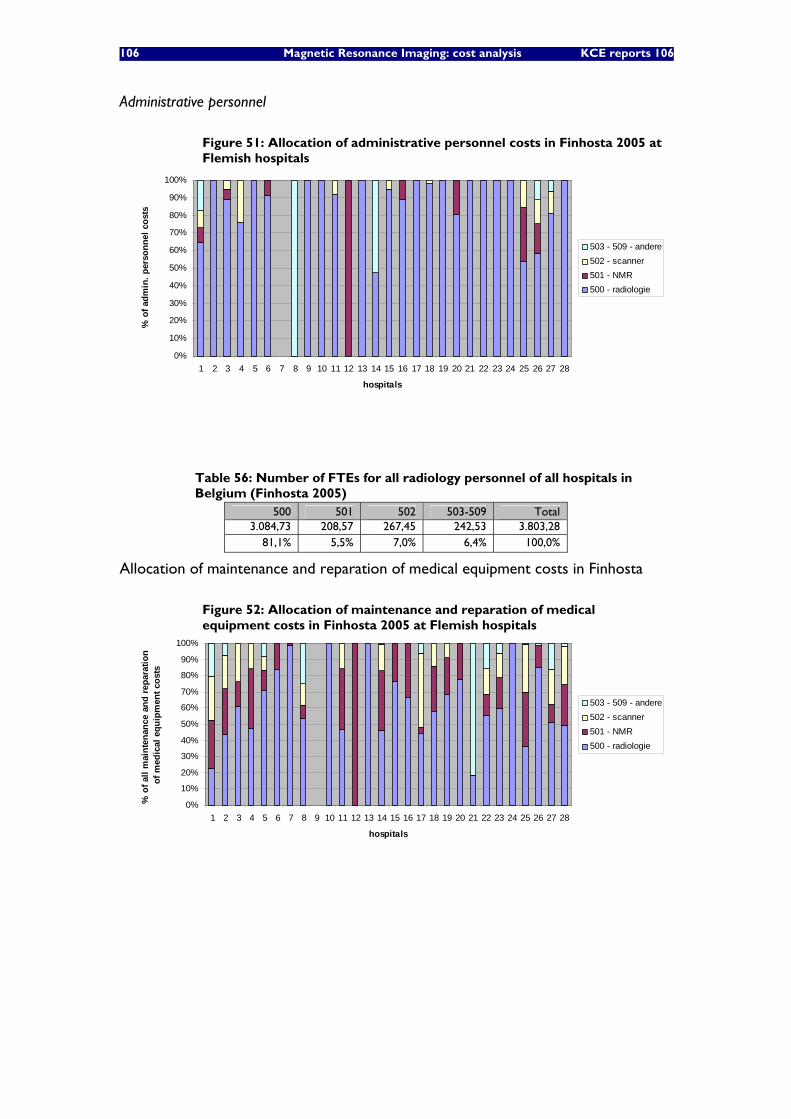
106 Magnetic Resonance Imaging: cost analysis KCE reports 106
Administrative personnel
Figure 51: Allocation of administrative personnel costs in Finhosta 2005 at Flemish hospitals
0%
10%
20%
30%
40%
50%
60%
70%
80%
90%
100%
1 2 3 4 5 6 7 8 9 10 11 12 13 14 15 16 17 18 19 20 21 22 23 24 25 26 27 28
hospitals
% o
f adm
in. p
erso
nnel
cos
ts
503 - 509 - andere502 - scanner501 - NMR500 - radiologie
Table 56: Number of FTEs for all radiology personnel of all hospitals in Belgium (Finhosta 2005)
500 501 502 503-509 Total 3.084,73 208,57 267,45 242,53 3.803,28
81,1% 5,5% 7,0% 6,4% 100,0%
Allocation of maintenance and reparation of medical equipment costs in Finhosta
Figure 52: Allocation of maintenance and reparation of medical equipment costs in Finhosta 2005 at Flemish hospitals
0%
10%
20%
30%
40%
50%
60%
70%
80%
90%
100%
1 2 3 4 5 6 7 8 9 10 11 12 13 14 15 16 17 18 19 20 21 22 23 24 25 26 27 28
hospitals
% o
f all
mai
nten
ance
and
repa
ratio
n of
med
ical
equ
ipm
ent c
osts
503 - 509 - andere502 - scanner501 - NMR500 - radiologie
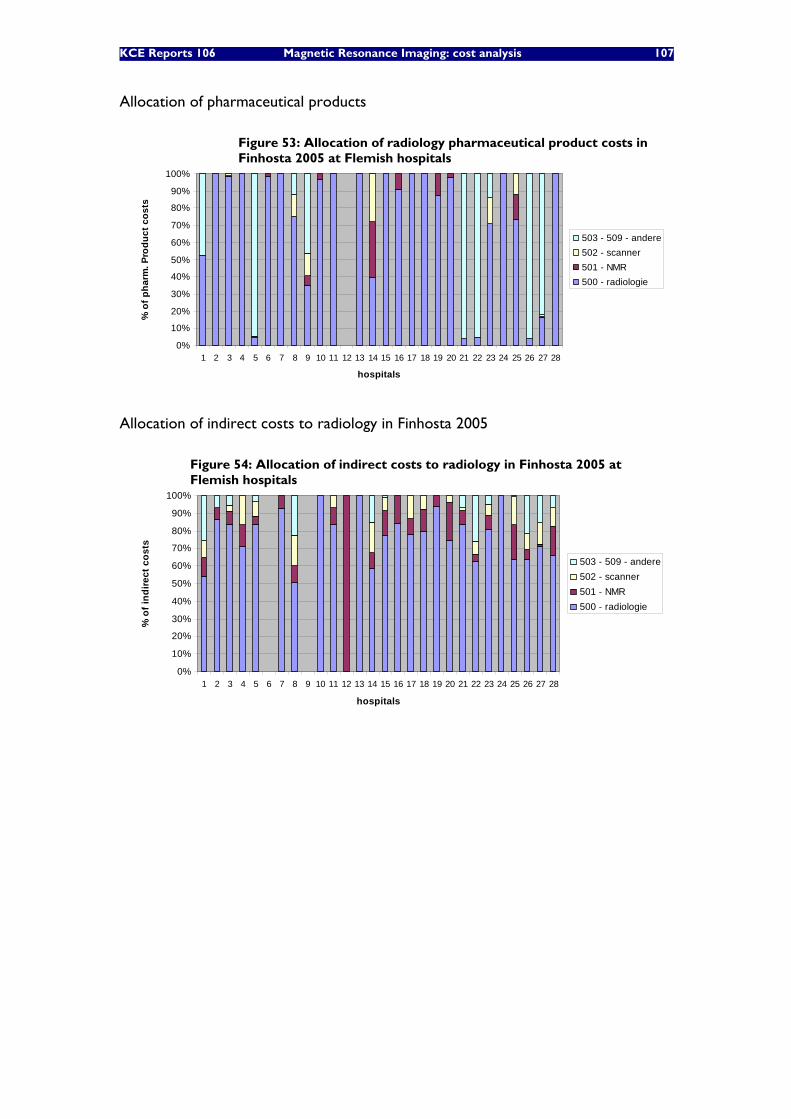
KCE Reports 106 Magnetic Resonance Imaging: cost analysis 107
Allocation of pharmaceutical products
Figure 53: Allocation of radiology pharmaceutical product costs in Finhosta 2005 at Flemish hospitals
0%
10%
20%
30%
40%
50%
60%
70%
80%
90%
100%
1 2 3 4 5 6 7 8 9 10 11 12 13 14 15 16 17 18 19 20 21 22 23 24 25 26 27 28
hospitals
% o
f pha
rm. P
rodu
ct c
osts
503 - 509 - andere502 - scanner501 - NMR500 - radiologie
Allocation of indirect costs to radiology in Finhosta 2005
Figure 54: Allocation of indirect costs to radiology in Finhosta 2005 at Flemish hospitals
0%
10%
20%
30%
40%
50%
60%
70%
80%
90%
100%
1 2 3 4 5 6 7 8 9 10 11 12 13 14 15 16 17 18 19 20 21 22 23 24 25 26 27 28
hospitals
% o
f ind
irect
cos
ts
503 - 509 - andere502 - scanner501 - NMR500 - radiologie
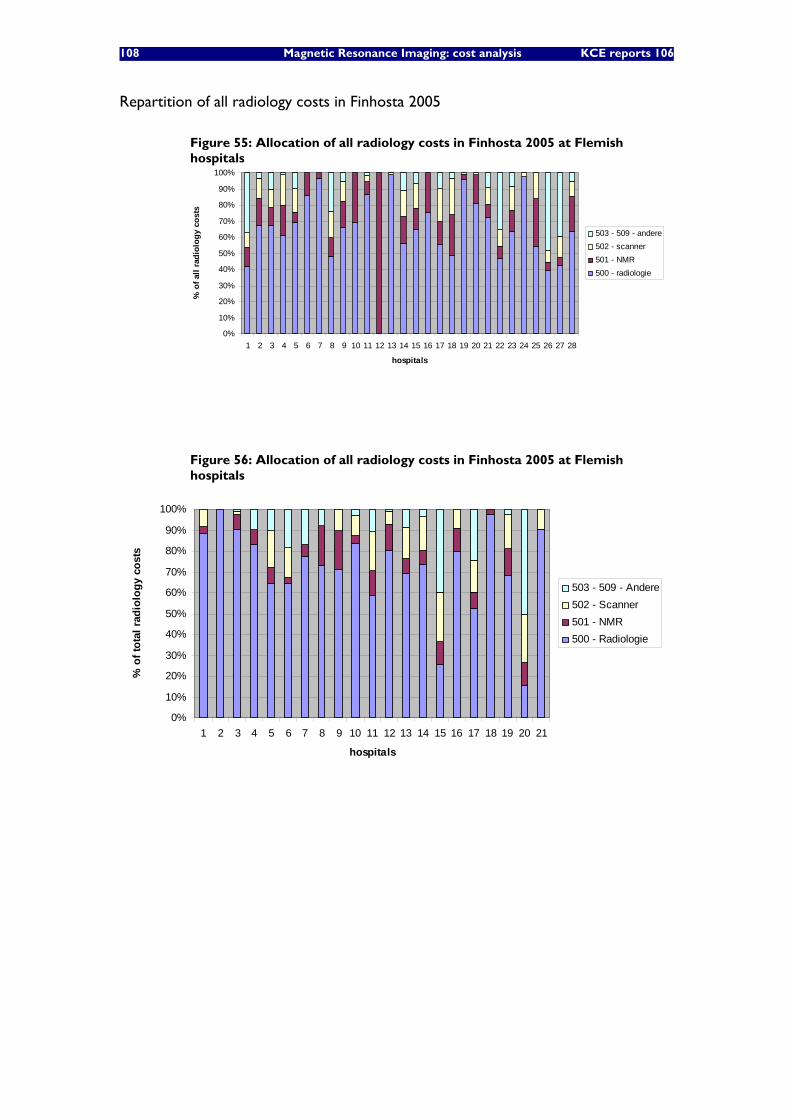
108 Magnetic Resonance Imaging: cost analysis KCE reports 106
Repartition of all radiology costs in Finhosta 2005
Figure 55: Allocation of all radiology costs in Finhosta 2005 at Flemish hospitals
0%
10%
20%
30%
40%
50%
60%
70%
80%
90%
100%
1 2 3 4 5 6 7 8 9 10 11 12 13 14 15 16 17 18 19 20 21 22 23 24 25 26 27 28
hospitals
% o
f all
radi
olog
y co
sts
503 - 509 - andere502 - scanner501 - NMR500 - radiologie
Figure 56: Allocation of all radiology costs in Finhosta 2005 at Flemish hospitals
0%
10%
20%
30%
40%
50%
60%
70%
80%
90%
100%
1 2 3 4 5 6 7 8 9 10 11 12 13 14 15 16 17 18 19 20 21
hospitals
% o
f tot
al ra
diol
ogy
cost
s
503 - 509 - Andere502 - Scanner501 - NMR500 - Radiologie
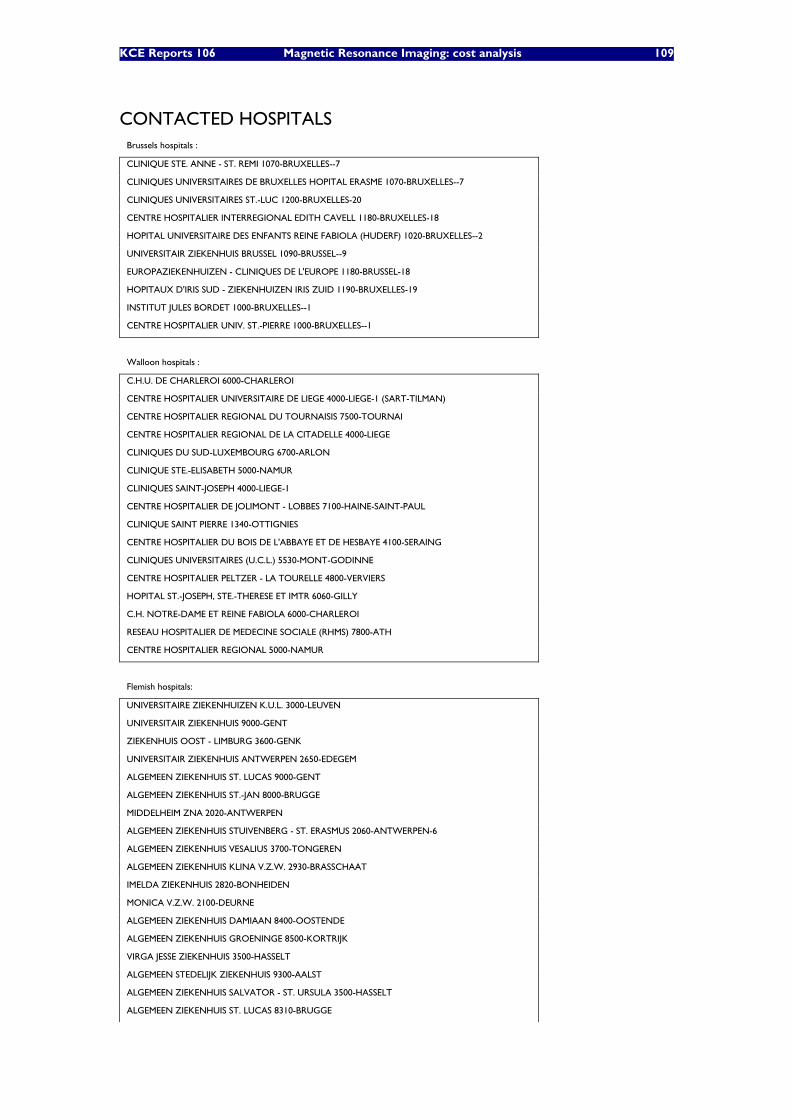
KCE Reports 106 Magnetic Resonance Imaging: cost analysis 109
CONTACTED HOSPITALS Brussels hospitals :
CLINIQUE STE. ANNE - ST. REMI 1070-BRUXELLES--7
CLINIQUES UNIVERSITAIRES DE BRUXELLES HOPITAL ERASME 1070-BRUXELLES--7
CLINIQUES UNIVERSITAIRES ST.-LUC 1200-BRUXELLES-20
CENTRE HOSPITALIER INTERREGIONAL EDITH CAVELL 1180-BRUXELLES-18
HOPITAL UNIVERSITAIRE DES ENFANTS REINE FABIOLA (HUDERF) 1020-BRUXELLES--2
UNIVERSITAIR ZIEKENHUIS BRUSSEL 1090-BRUSSEL--9
EUROPAZIEKENHUIZEN - CLINIQUES DE L'EUROPE 1180-BRUSSEL-18
HOPITAUX D'IRIS SUD - ZIEKENHUIZEN IRIS ZUID 1190-BRUXELLES-19
INSTITUT JULES BORDET 1000-BRUXELLES--1
CENTRE HOSPITALIER UNIV. ST.-PIERRE 1000-BRUXELLES--1
Walloon hospitals :
C.H.U. DE CHARLEROI 6000-CHARLEROI
CENTRE HOSPITALIER UNIVERSITAIRE DE LIEGE 4000-LIEGE-1 (SART-TILMAN)
CENTRE HOSPITALIER REGIONAL DU TOURNAISIS 7500-TOURNAI
CENTRE HOSPITALIER REGIONAL DE LA CITADELLE 4000-LIEGE
CLINIQUES DU SUD-LUXEMBOURG 6700-ARLON
CLINIQUE STE.-ELISABETH 5000-NAMUR
CLINIQUES SAINT-JOSEPH 4000-LIEGE-1
CENTRE HOSPITALIER DE JOLIMONT - LOBBES 7100-HAINE-SAINT-PAUL
CLINIQUE SAINT PIERRE 1340-OTTIGNIES
CENTRE HOSPITALIER DU BOIS DE L'ABBAYE ET DE HESBAYE 4100-SERAING
CLINIQUES UNIVERSITAIRES (U.C.L.) 5530-MONT-GODINNE
CENTRE HOSPITALIER PELTZER - LA TOURELLE 4800-VERVIERS
HOPITAL ST.-JOSEPH, STE.-THERESE ET IMTR 6060-GILLY
C.H. NOTRE-DAME ET REINE FABIOLA 6000-CHARLEROI
RESEAU HOSPITALIER DE MEDECINE SOCIALE (RHMS) 7800-ATH
CENTRE HOSPITALIER REGIONAL 5000-NAMUR
Flemish hospitals:
UNIVERSITAIRE ZIEKENHUIZEN K.U.L. 3000-LEUVEN
UNIVERSITAIR ZIEKENHUIS 9000-GENT
ZIEKENHUIS OOST - LIMBURG 3600-GENK
UNIVERSITAIR ZIEKENHUIS ANTWERPEN 2650-EDEGEM
ALGEMEEN ZIEKENHUIS ST. LUCAS 9000-GENT
ALGEMEEN ZIEKENHUIS ST.-JAN 8000-BRUGGE
MIDDELHEIM ZNA 2020-ANTWERPEN
ALGEMEEN ZIEKENHUIS STUIVENBERG - ST. ERASMUS 2060-ANTWERPEN-6
ALGEMEEN ZIEKENHUIS VESALIUS 3700-TONGEREN
ALGEMEEN ZIEKENHUIS KLINA V.Z.W. 2930-BRASSCHAAT
IMELDA ZIEKENHUIS 2820-BONHEIDEN
MONICA V.Z.W. 2100-DEURNE
ALGEMEEN ZIEKENHUIS DAMIAAN 8400-OOSTENDE
ALGEMEEN ZIEKENHUIS GROENINGE 8500-KORTRIJK
VIRGA JESSE ZIEKENHUIS 3500-HASSELT
ALGEMEEN STEDELIJK ZIEKENHUIS 9300-AALST
ALGEMEEN ZIEKENHUIS SALVATOR - ST. URSULA 3500-HASSELT
ALGEMEEN ZIEKENHUIS ST. LUCAS 8310-BRUGGE

110 Magnetic Resonance Imaging: cost analysis KCE reports 106
ONZE LIEVE VROUWZIEKENHUIS 9300-AALST
H.- HARTZIEKENHUIS ROESELARE - MENEN 8800-ROESELARE
ST.-VINCENTIUSZIEKENHUIS 2018-ANTWERPEN-1
ALGEMEEN ZIEKENHUIS ST.-AUGUSTINUS 2610-WILRIJK
HEILIG HART ZIEKENHUIS V.Z.W. 2500-LIER
ST.-ELISABETHZIEKENHUIS 2300-TURNHOUT
REGIONAAL ZIEKENHUIS JAN YPERMAN 8900-IEPER
ALGEMEEN ZIEKENHUIS ST.- MAARTEN 2800-MECHELEN
ALGEMEEN ZIEKENHUIS MARIA MIDDELARES 9000-GENT
ALGEMEEN ZIEKENHUIS ST. BLASIUS 9200-DENDERMONDE
ALGEMEEN ZIEKENHUIS NIKOLAAS 9100-SINT-NIKLAAS
ALGEMEEN ZIEKENHUIS ST.-JOZEF 2300-TURNHOUT
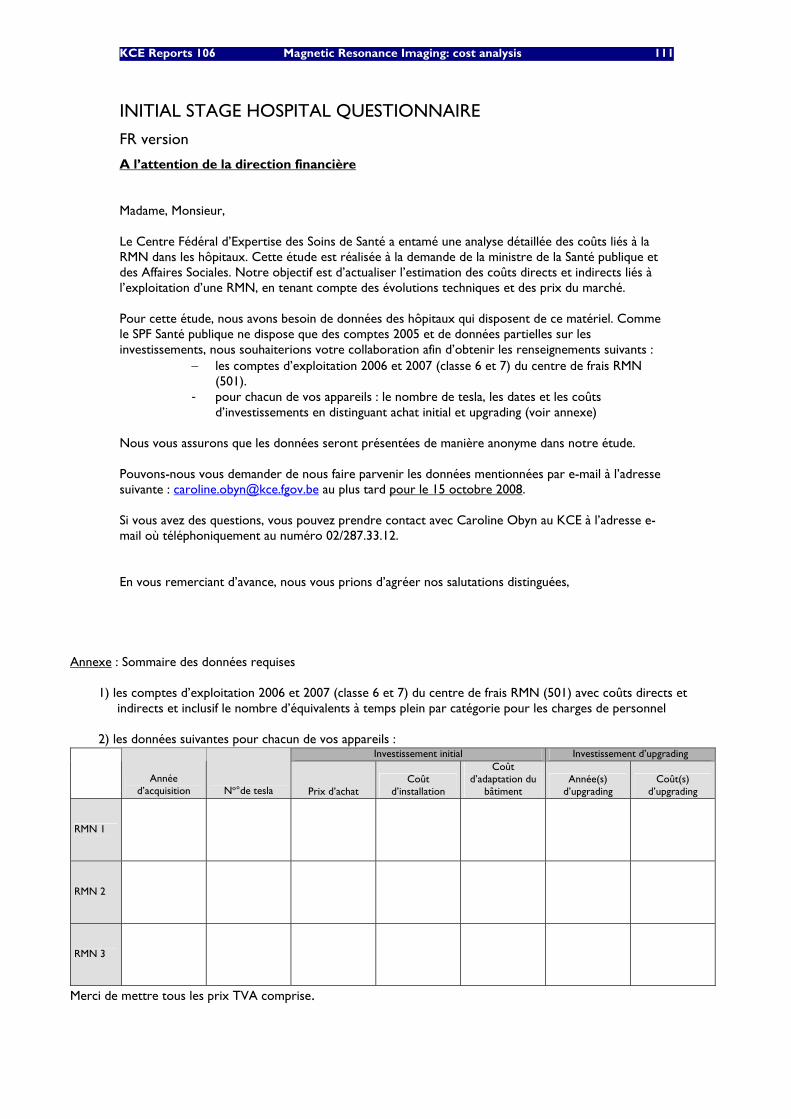
KCE Reports 106 Magnetic Resonance Imaging: cost analysis 111
INITIAL STAGE HOSPITAL QUESTIONNAIRE
FR version
A l’attention de la direction financière Madame, Monsieur, Le Centre Fédéral d’Expertise des Soins de Santé a entamé une analyse détaillée des coûts liés à la RMN dans les hôpitaux. Cette étude est réalisée à la demande de la ministre de la Santé publique et des Affaires Sociales. Notre objectif est d’actualiser l’estimation des coûts directs et indirects liés à l’exploitation d’une RMN, en tenant compte des évolutions techniques et des prix du marché. Pour cette étude, nous avons besoin de données des hôpitaux qui disposent de ce matériel. Comme le SPF Santé publique ne dispose que des comptes 2005 et de données partielles sur les investissements, nous souhaiterions votre collaboration afin d’obtenir les renseignements suivants :
− les comptes d’exploitation 2006 et 2007 (classe 6 et 7) du centre de frais RMN (501).
- pour chacun de vos appareils : le nombre de tesla, les dates et les coûts d’investissements en distinguant achat initial et upgrading (voir annexe)
Nous vous assurons que les données seront présentées de manière anonyme dans notre étude. Pouvons-nous vous demander de nous faire parvenir les données mentionnées par e-mail à l’adresse suivante : [email protected] au plus tard pour le 15 octobre 2008. Si vous avez des questions, vous pouvez prendre contact avec Caroline Obyn au KCE à l’adresse e-mail où téléphoniquement au numéro 02/287.33.12. En vous remerciant d’avance, nous vous prions d’agréer nos salutations distinguées,
Annexe : Sommaire des données requises
1) les comptes d’exploitation 2006 et 2007 (classe 6 et 7) du centre de frais RMN (501) avec coûts directs et indirects et inclusif le nombre d’équivalents à temps plein par catégorie pour les charges de personnel
2) les données suivantes pour chacun de vos appareils :
Investissement initial Investissement d’upgrading
Année d’acquisition No°de tesla Prix d’achat
Coût d’installation
Coût d’adaptation du
bâtiment Année(s)
d’upgrading Coût(s)
d’upgrading
RMN 1
RMN 2
RMN 3
Merci de mettre tous les prix TVA comprise.
112 Magnetic Resonance Imaging: cost analysis KCE reports 106
NL version
Aan de financiële directie Geachte mevrouw, mijnheer, Het Federaal Kenniscentrum voor Gezondheidszorg voert een gedetailleerde kostenanalyse van de dienst NMR uit. Dit gebeurt op vraag van de minister van Volksgezondheid en Sociale Zaken. In deze studie beschrijven we de directe en indirecte kosten verbonden aan het runnen van een NMR, rekening houdende met de huidige marktevolutie. Aangezien de FOD Volksgezondheid enkel over 2005 rekeningen en partiële investeringsgegevens beschikt, vragen we uw medewerking voor recentere data. Meer bepaald zijn we op zoek naar:
− de bedrijfsrekeningen 2006-2007 (klasse 6 en 7) van de kostenplaats NMR (501) - voor elk van uw apparaten : het aantal tesla, het jaartal en de kosten van de
aankoop- en upgrade investeringen (zie bijlage)
We verzekeren u dat de data op anonieme wijze in de studie worden opgenomen. Mogen we u verzoeken ons de betreffende data door te mailen naar het volgend e-mail adres: [email protected]. Dit ten laatste op 17 oktober 2008. Voor vragen hieromtrent kunt u contact opnemen met Caroline Obyn van het KCE op bovenstaand e-mailadres of telefonisch op het nummer 02/287.33.12. Van harte dank bij voorbaat. Met de meeste hoogachting, Jean-Pierre Closon Gert Peeters Algemeen directeur a.i. Adjunct directeur a.i.
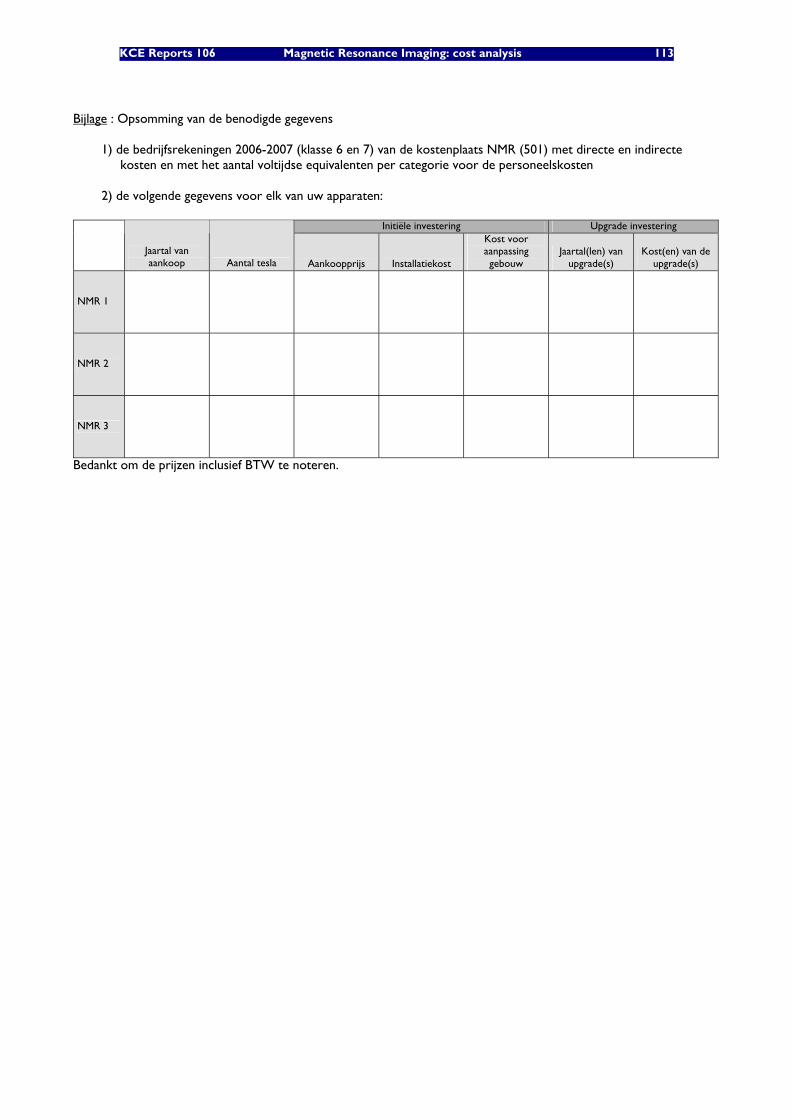
KCE Reports 106 Magnetic Resonance Imaging: cost analysis 113
Bijlage : Opsomming van de benodigde gegevens
1) de bedrijfsrekeningen 2006-2007 (klasse 6 en 7) van de kostenplaats NMR (501) met directe en indirecte kosten en met het aantal voltijdse equivalenten per categorie voor de personeelskosten
2) de volgende gegevens voor elk van uw apparaten:
Initiële investering Upgrade investering
Jaartal van aankoop Aantal tesla Aankoopprijs Installatiekost
Kost voor aanpassing gebouw
Jaartal(len) van upgrade(s)
Kost(en) van de upgrade(s)
NMR 1
NMR 2
NMR 3
Bedankt om de prijzen inclusief BTW te noteren.
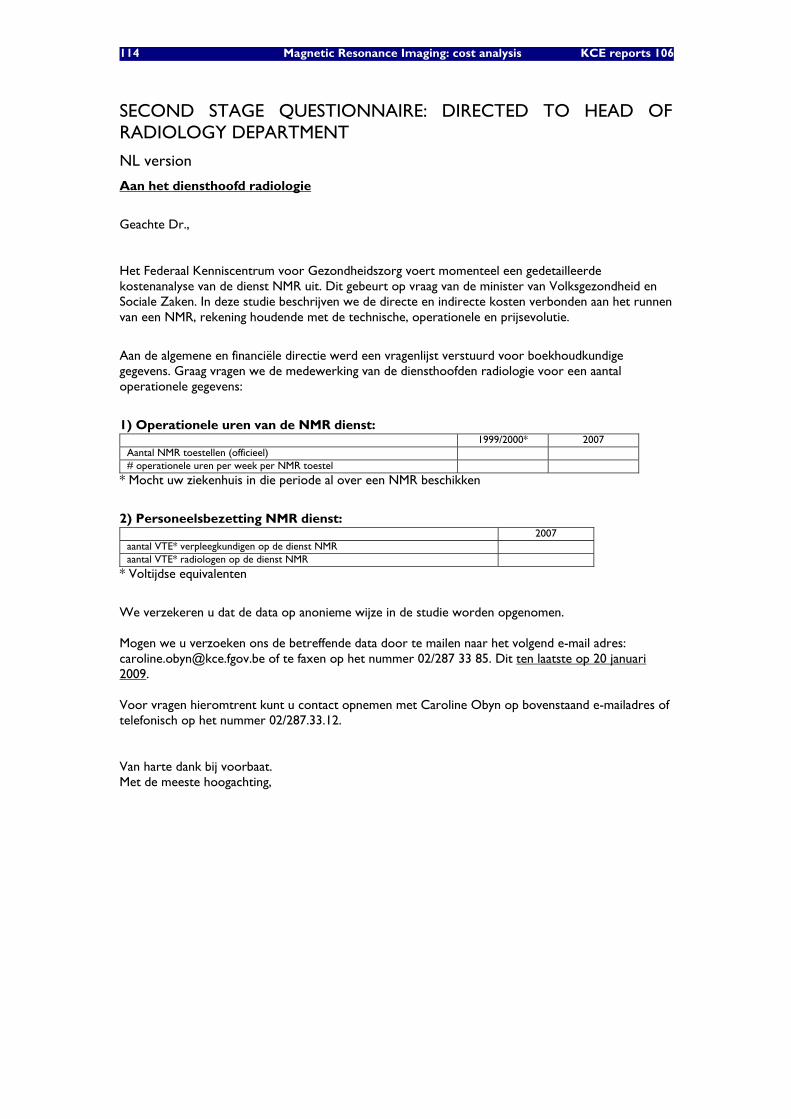
114 Magnetic Resonance Imaging: cost analysis KCE reports 106
SECOND STAGE QUESTIONNAIRE: DIRECTED TO HEAD OF RADIOLOGY DEPARTMENT NL version
Aan het diensthoofd radiologie
Geachte Dr.,
Het Federaal Kenniscentrum voor Gezondheidszorg voert momenteel een gedetailleerde kostenanalyse van de dienst NMR uit. Dit gebeurt op vraag van de minister van Volksgezondheid en Sociale Zaken. In deze studie beschrijven we de directe en indirecte kosten verbonden aan het runnen van een NMR, rekening houdende met de technische, operationele en prijsevolutie.
Aan de algemene en financiële directie werd een vragenlijst verstuurd voor boekhoudkundige gegevens. Graag vragen we de medewerking van de diensthoofden radiologie voor een aantal operationele gegevens:
1) Operationele uren van de NMR dienst: 1999/2000* 2007 Aantal NMR toestellen (officieel) # operationele uren per week per NMR toestel
* Mocht uw ziekenhuis in die periode al over een NMR beschikken
2) Personeelsbezetting NMR dienst: 2007 aantal VTE* verpleegkundigen op de dienst NMR aantal VTE* radiologen op de dienst NMR
* Voltijdse equivalenten
We verzekeren u dat de data op anonieme wijze in de studie worden opgenomen. Mogen we u verzoeken ons de betreffende data door te mailen naar het volgend e-mail adres: [email protected] of te faxen op het nummer 02/287 33 85. Dit ten laatste op 20 januari 2009. Voor vragen hieromtrent kunt u contact opnemen met Caroline Obyn op bovenstaand e-mailadres of telefonisch op het nummer 02/287.33.12. Van harte dank bij voorbaat. Met de meeste hoogachting,
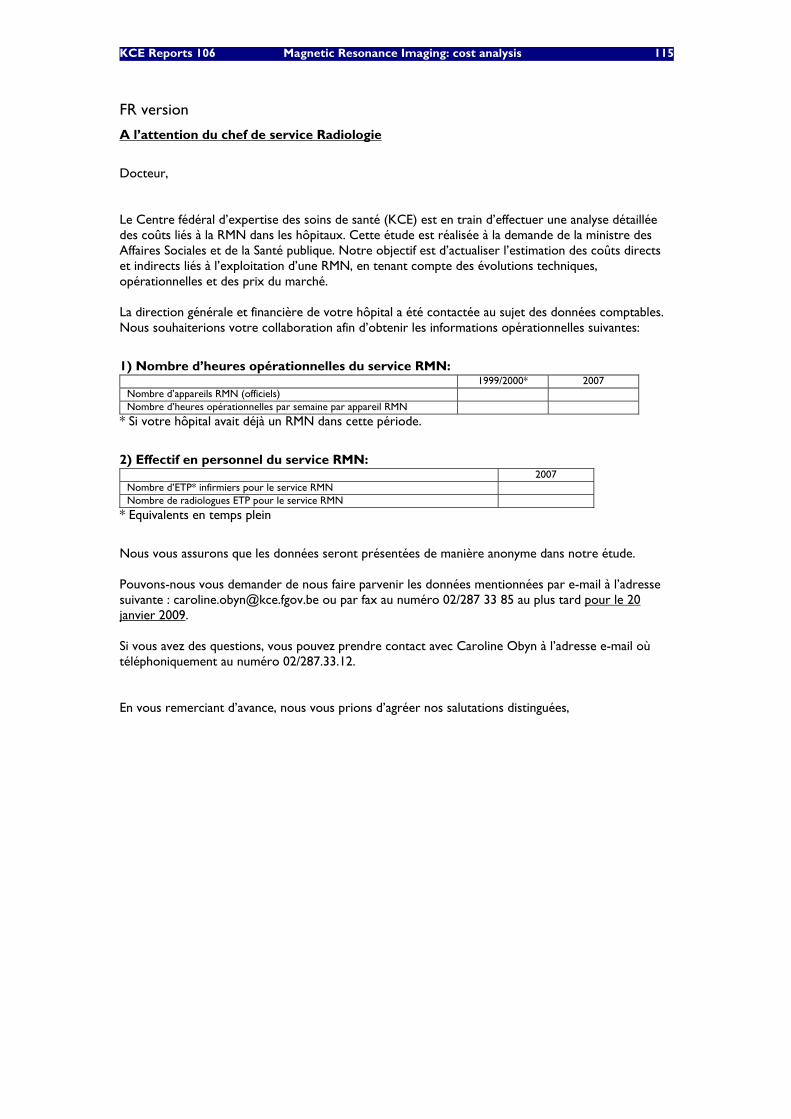
KCE Reports 106 Magnetic Resonance Imaging: cost analysis 115
FR version
A l’attention du chef de service Radiologie
Docteur,
Le Centre fédéral d’expertise des soins de santé (KCE) est en train d’effectuer une analyse détaillée des coûts liés à la RMN dans les hôpitaux. Cette étude est réalisée à la demande de la ministre des Affaires Sociales et de la Santé publique. Notre objectif est d’actualiser l’estimation des coûts directs et indirects liés à l’exploitation d’une RMN, en tenant compte des évolutions techniques, opérationnelles et des prix du marché. La direction générale et financière de votre hôpital a été contactée au sujet des données comptables. Nous souhaiterions votre collaboration afin d’obtenir les informations opérationnelles suivantes:
1) Nombre d’heures opérationnelles du service RMN: 1999/2000* 2007 Nombre d’appareils RMN (officiels) Nombre d’heures opérationnelles par semaine par appareil RMN
* Si votre hôpital avait déjà un RMN dans cette période.
2) Effectif en personnel du service RMN: 2007 Nombre d’ETP* infirmiers pour le service RMN Nombre de radiologues ETP pour le service RMN
* Equivalents en temps plein
Nous vous assurons que les données seront présentées de manière anonyme dans notre étude. Pouvons-nous vous demander de nous faire parvenir les données mentionnées par e-mail à l’adresse suivante : [email protected] ou par fax au numéro 02/287 33 85 au plus tard pour le 20 janvier 2009. Si vous avez des questions, vous pouvez prendre contact avec Caroline Obyn à l’adresse e-mail où téléphoniquement au numéro 02/287.33.12. En vous remerciant d’avance, nous vous prions d’agréer nos salutations distinguées,
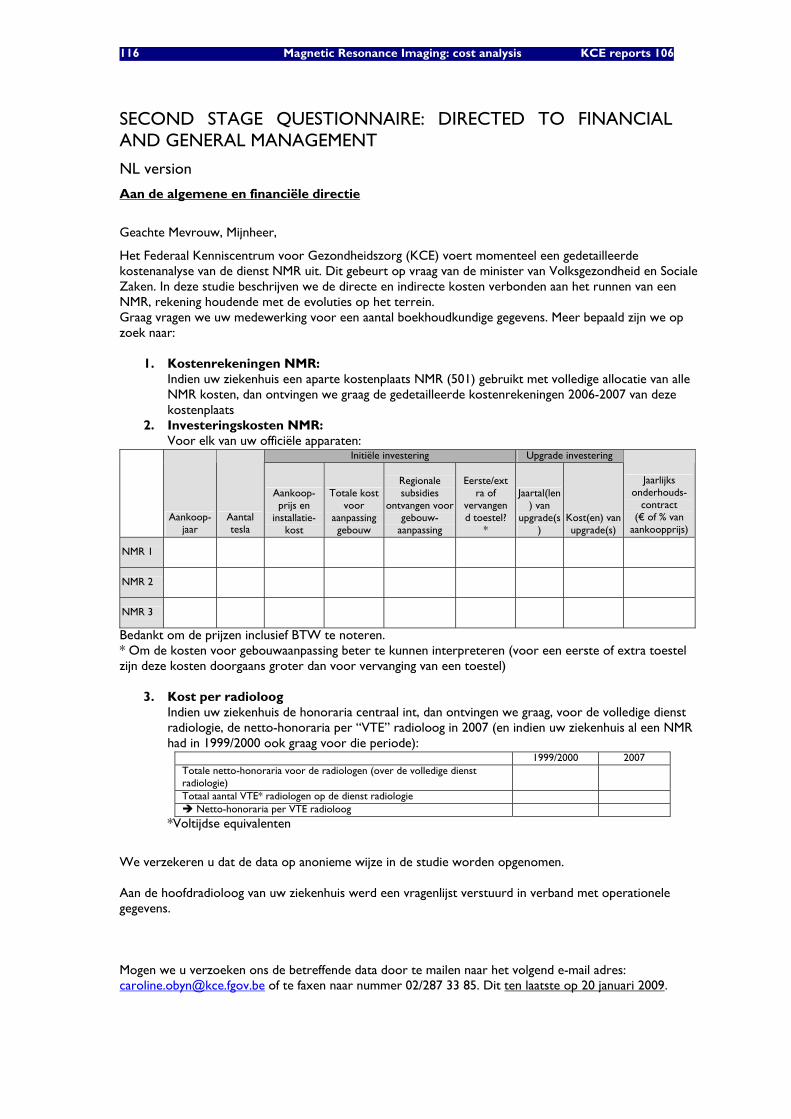
116 Magnetic Resonance Imaging: cost analysis KCE reports 106
SECOND STAGE QUESTIONNAIRE: DIRECTED TO FINANCIAL AND GENERAL MANAGEMENT
NL version
Aan de algemene en financiële directie
Geachte Mevrouw, Mijnheer,
Het Federaal Kenniscentrum voor Gezondheidszorg (KCE) voert momenteel een gedetailleerde kostenanalyse van de dienst NMR uit. Dit gebeurt op vraag van de minister van Volksgezondheid en Sociale Zaken. In deze studie beschrijven we de directe en indirecte kosten verbonden aan het runnen van een NMR, rekening houdende met de evoluties op het terrein. Graag vragen we uw medewerking voor een aantal boekhoudkundige gegevens. Meer bepaald zijn we op zoek naar:
1. Kostenrekeningen NMR: Indien uw ziekenhuis een aparte kostenplaats NMR (501) gebruikt met volledige allocatie van alle NMR kosten, dan ontvingen we graag de gedetailleerde kostenrekeningen 2006-2007 van deze kostenplaats
2. Investeringskosten NMR: Voor elk van uw officiële apparaten:
Initiële investering Upgrade investering
Aankoop-jaar
Aantal tesla
Aankoop-prijs en
installatie-kost
Totale kost voor
aanpassing gebouw
Regionale subsidies
ontvangen voor gebouw-
aanpassing
Eerste/ext
ra of vervangend toestel?
*
Jaartal(len) van
upgrade(s)
Kost(en) van upgrade(s)
Jaarlijks onderhouds-
contract (€ of % van
aankoopprijs)
NMR 1
NMR 2
NMR 3
Bedankt om de prijzen inclusief BTW te noteren. * Om de kosten voor gebouwaanpassing beter te kunnen interpreteren (voor een eerste of extra toestel zijn deze kosten doorgaans groter dan voor vervanging van een toestel)
3. Kost per radioloog
Indien uw ziekenhuis de honoraria centraal int, dan ontvingen we graag, voor de volledige dienst radiologie, de netto-honoraria per “VTE” radioloog in 2007 (en indien uw ziekenhuis al een NMR had in 1999/2000 ook graag voor die periode):
1999/2000 2007 Totale netto-honoraria voor de radiologen (over de volledige dienst radiologie)
Totaal aantal VTE* radiologen op de dienst radiologie Netto-honoraria per VTE radioloog
*Voltijdse equivalenten
We verzekeren u dat de data op anonieme wijze in de studie worden opgenomen. Aan de hoofdradioloog van uw ziekenhuis werd een vragenlijst verstuurd in verband met operationele gegevens. Mogen we u verzoeken ons de betreffende data door te mailen naar het volgend e-mail adres: [email protected] of te faxen naar nummer 02/287 33 85. Dit ten laatste op 20 januari 2009.

KCE Reports 106 Magnetic Resonance Imaging: cost analysis 117
Voor vragen hieromtrent kunt u contact opnemen met Caroline Obyn op bovenstaand e-mailadres of telefonisch op het nummer 02/287.33.12. Van harte dank bij voorbaat. Met de meeste hoogachting,
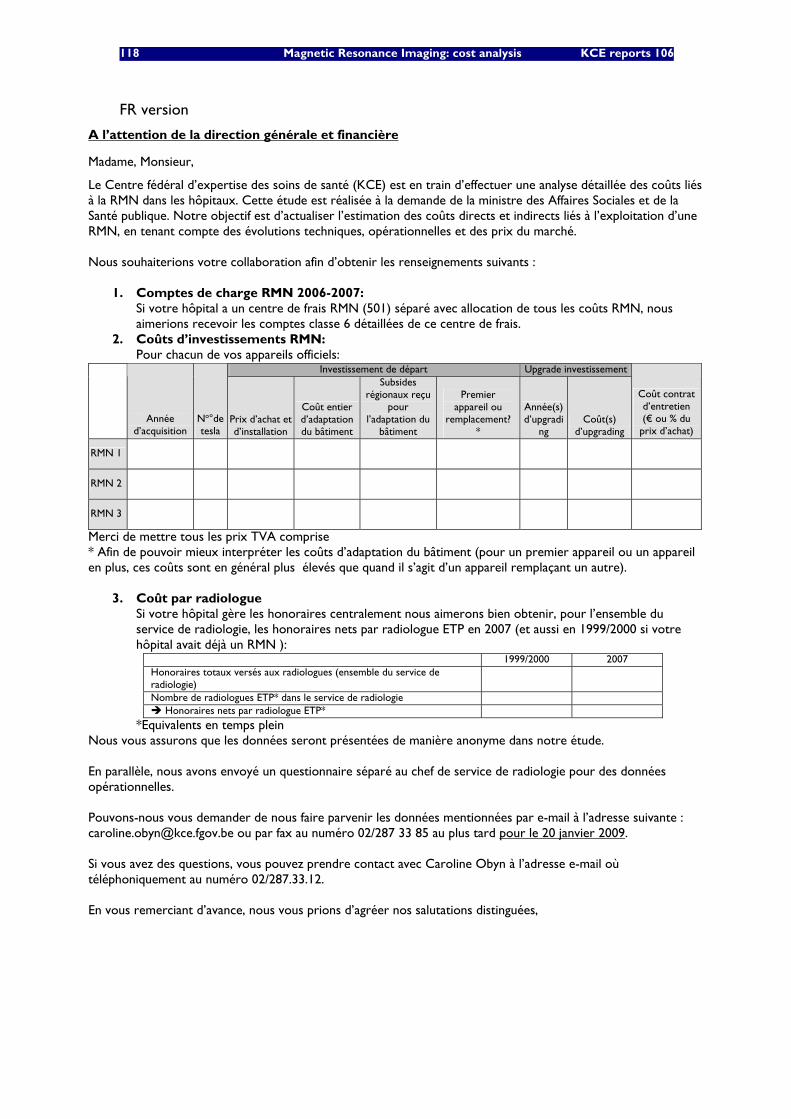
118 Magnetic Resonance Imaging: cost analysis KCE reports 106
FR version
A l’attention de la direction générale et financière
Madame, Monsieur,
Le Centre fédéral d’expertise des soins de santé (KCE) est en train d’effectuer une analyse détaillée des coûts liés à la RMN dans les hôpitaux. Cette étude est réalisée à la demande de la ministre des Affaires Sociales et de la Santé publique. Notre objectif est d’actualiser l’estimation des coûts directs et indirects liés à l’exploitation d’une RMN, en tenant compte des évolutions techniques, opérationnelles et des prix du marché. Nous souhaiterions votre collaboration afin d’obtenir les renseignements suivants :
1. Comptes de charge RMN 2006-2007: Si votre hôpital a un centre de frais RMN (501) séparé avec allocation de tous les coûts RMN, nous aimerions recevoir les comptes classe 6 détaillées de ce centre de frais.
2. Coûts d’investissements RMN: Pour chacun de vos appareils officiels:
Investissement de départ Upgrade investissement
Année d’acquisition
No°de tesla
Prix d’achat et d’installation
Coût entier d’adaptation du bâtiment
Subsides régionaux reçu
pour l’adaptation du
bâtiment
Premier appareil ou
remplacement? *
Année(s) d’upgradi
ng Coût(s)
d’upgrading
Coût contrat d’entretien (€ ou % du
prix d’achat)
RMN 1
RMN 2
RMN 3
Merci de mettre tous les prix TVA comprise * Afin de pouvoir mieux interpréter les coûts d’adaptation du bâtiment (pour un premier appareil ou un appareil en plus, ces coûts sont en général plus élevés que quand il s’agit d’un appareil remplaçant un autre).
3. Coût par radiologue
Si votre hôpital gère les honoraires centralement nous aimerons bien obtenir, pour l’ensemble du service de radiologie, les honoraires nets par radiologue ETP en 2007 (et aussi en 1999/2000 si votre hôpital avait déjà un RMN ):
1999/2000 2007 Honoraires totaux versés aux radiologues (ensemble du service de radiologie)
Nombre de radiologues ETP* dans le service de radiologie Honoraires nets par radiologue ETP*
*Equivalents en temps plein Nous vous assurons que les données seront présentées de manière anonyme dans notre étude. En parallèle, nous avons envoyé un questionnaire séparé au chef de service de radiologie pour des données opérationnelles. Pouvons-nous vous demander de nous faire parvenir les données mentionnées par e-mail à l’adresse suivante : [email protected] ou par fax au numéro 02/287 33 85 au plus tard pour le 20 janvier 2009. Si vous avez des questions, vous pouvez prendre contact avec Caroline Obyn à l’adresse e-mail où téléphoniquement au numéro 02/287.33.12. En vous remerciant d’avance, nous vous prions d’agréer nos salutations distinguées,
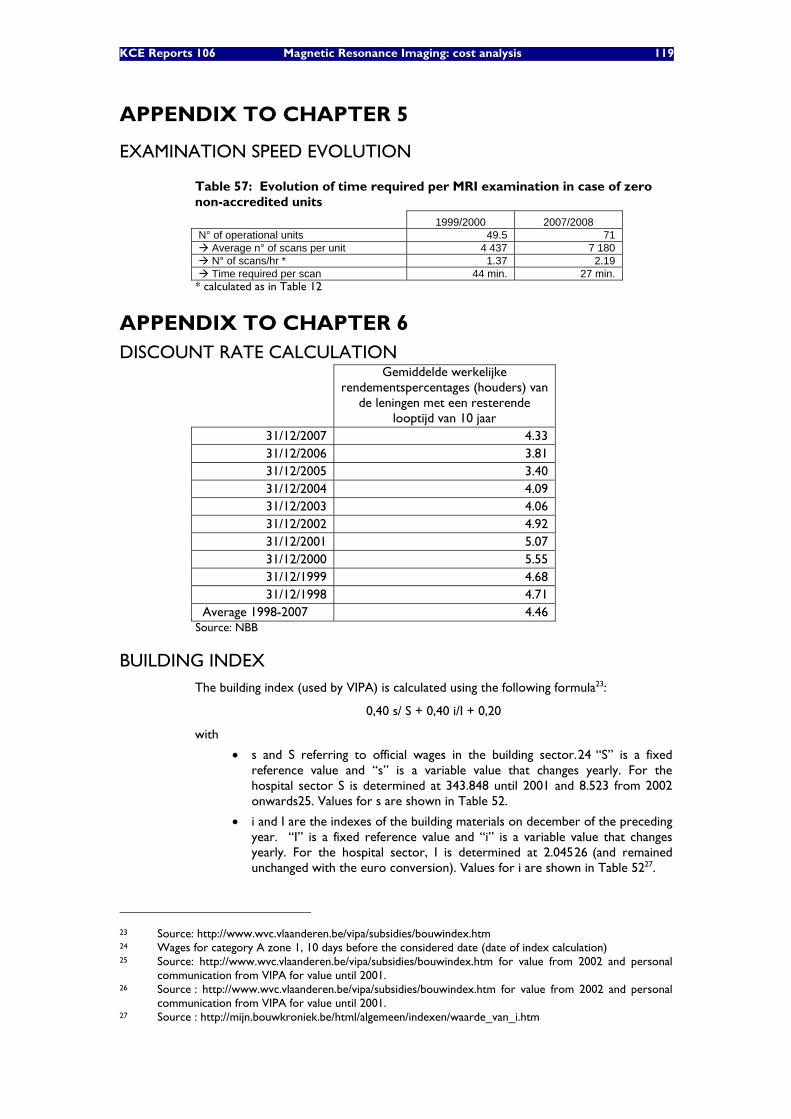
KCE Reports 106 Magnetic Resonance Imaging: cost analysis 119
APPENDIX TO CHAPTER 5
EXAMINATION SPEED EVOLUTION
Table 57: Evolution of time required per MRI examination in case of zero non-accredited units
1999/2000 2007/2008 N° of operational units 49.5 71
Average n° of scans per unit 4 437 7 180 N° of scans/hr * 1.37 2.19 Time required per scan 44 min. 27 min.
* calculated as in Table 12
APPENDIX TO CHAPTER 6 DISCOUNT RATE CALCULATION
Gemiddelde werkelijke rendementspercentages (houders) van
de leningen met een resterende looptijd van 10 jaar
31/12/2007 4.33 31/12/2006 3.81 31/12/2005 3.40 31/12/2004 4.09 31/12/2003 4.06 31/12/2002 4.92 31/12/2001 5.07 31/12/2000 5.55 31/12/1999 4.68 31/12/1998 4.71
Average 1998-2007 4.46 Source: NBB
BUILDING INDEX The building index (used by VIPA) is calculated using the following formula23:
0,40 s/ S + 0,40 i/I + 0,20
with
• s and S referring to official wages in the building sector.24 “S” is a fixed reference value and “s” is a variable value that changes yearly. For the hospital sector S is determined at 343.848 until 2001 and 8.523 from 2002 onwards25. Values for s are shown in Table 52.
• i and I are the indexes of the building materials on december of the preceding year. “I” is a fixed reference value and “i” is a variable value that changes yearly. For the hospital sector, I is determined at 2.04526 (and remained unchanged with the euro conversion). Values for i are shown in Table 5227.
23 Source: http://www.wvc.vlaanderen.be/vipa/subsidies/bouwindex.htm 24 Wages for category A zone 1, 10 days before the considered date (date of index calculation) 25 Source: http://www.wvc.vlaanderen.be/vipa/subsidies/bouwindex.htm for value from 2002 and personal
communication from VIPA for value until 2001. 26 Source : http://www.wvc.vlaanderen.be/vipa/subsidies/bouwindex.htm for value from 2002 and personal
communication from VIPA for value until 2001. 27 Source : http://mijn.bouwkroniek.be/html/algemeen/indexen/waarde_van_i.htm
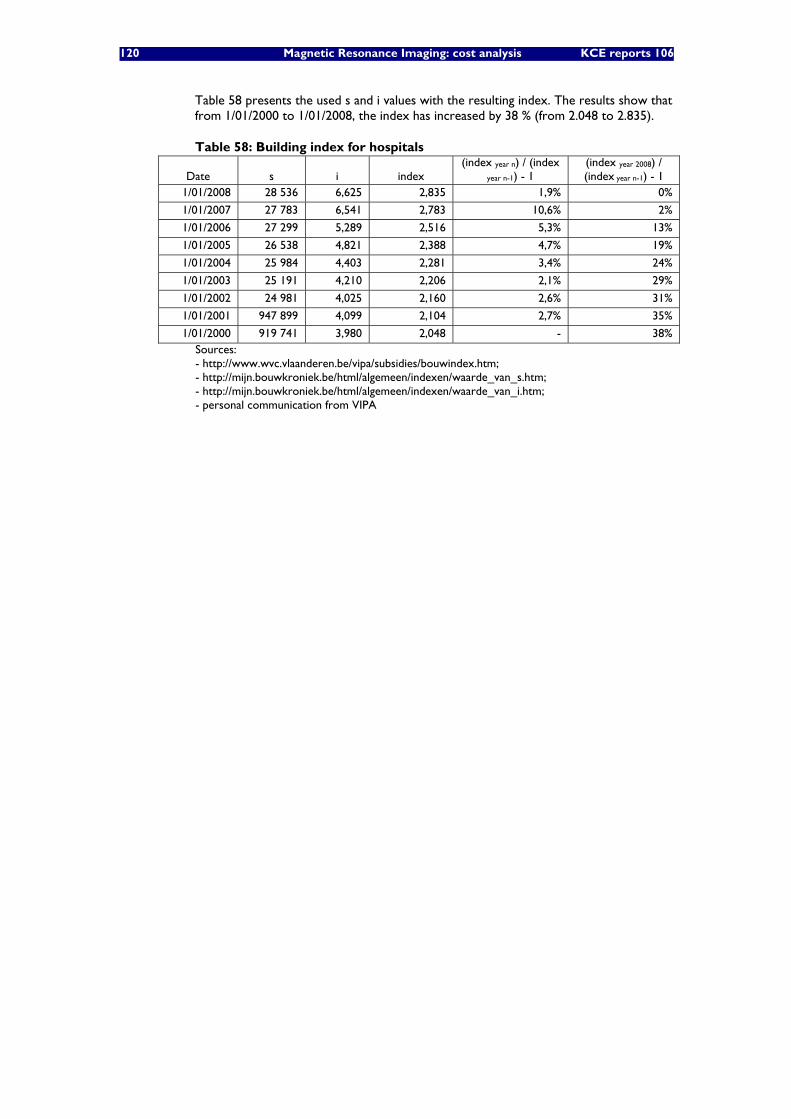
120 Magnetic Resonance Imaging: cost analysis KCE reports 106
Table 58 presents the used s and i values with the resulting index. The results show that from 1/01/2000 to 1/01/2008, the index has increased by 38 % (from 2.048 to 2.835).
Table 58: Building index for hospitals
Date s i index (index year n) / (index
year n-1) - 1 (index year 2008) / (index year n-1) - 1
1/01/2008 28 536 6,625 2,835 1,9% 0%
1/01/2007 27 783 6,541 2,783 10,6% 2%
1/01/2006 27 299 5,289 2,516 5,3% 13%
1/01/2005 26 538 4,821 2,388 4,7% 19%
1/01/2004 25 984 4,403 2,281 3,4% 24%
1/01/2003 25 191 4,210 2,206 2,1% 29%
1/01/2002 24 981 4,025 2,160 2,6% 31%
1/01/2001 947 899 4,099 2,104 2,7% 35%
1/01/2000 919 741 3,980 2,048 - 38% Sources: - http://www.wvc.vlaanderen.be/vipa/subsidies/bouwindex.htm; - http://mijn.bouwkroniek.be/html/algemeen/indexen/waarde_van_s.htm; - http://mijn.bouwkroniek.be/html/algemeen/indexen/waarde_van_i.htm; - personal communication from VIPA
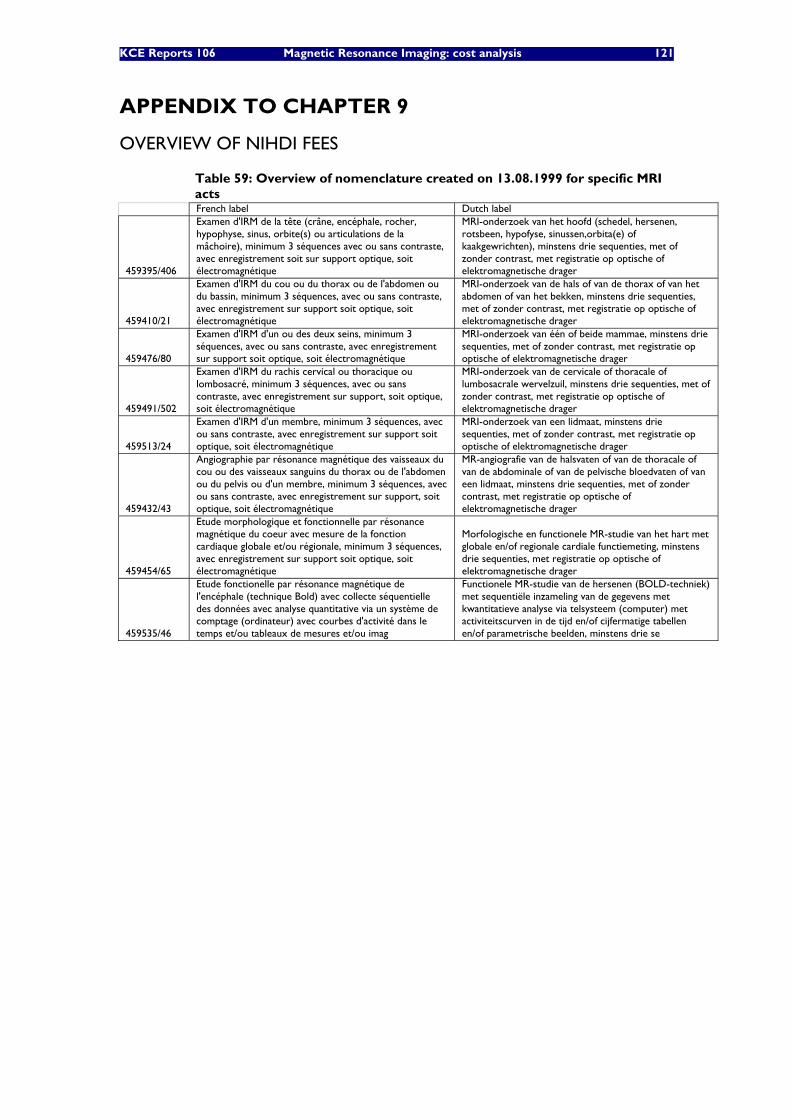
KCE Reports 106 Magnetic Resonance Imaging: cost analysis 121
APPENDIX TO CHAPTER 9
OVERVIEW OF NIHDI FEES
Table 59: Overview of nomenclature created on 13.08.1999 for specific MRI acts
French label Dutch label
459395/406
Examen d'IRM de la tête (crâne, encéphale, rocher, hypophyse, sinus, orbite(s) ou articulations de la mâchoire), minimum 3 séquences avec ou sans contraste, avec enregistrement soit sur support optique, soit électromagnétique
MRI-onderzoek van het hoofd (schedel, hersenen, rotsbeen, hypofyse, sinussen,orbita(e) of kaakgewrichten), minstens drie sequenties, met of zonder contrast, met registratie op optische of elektromagnetische drager
459410/21
Examen d'IRM du cou ou du thorax ou de l'abdomen ou du bassin, minimum 3 séquences, avec ou sans contraste, avec enregistrement sur support soit optique, soit électromagnétique
MRI-onderzoek van de hals of van de thorax of van het abdomen of van het bekken, minstens drie sequenties, met of zonder contrast, met registratie op optische of elektromagnetische drager
459476/80
Examen d'IRM d'un ou des deux seins, minimum 3 séquences, avec ou sans contraste, avec enregistrement sur support soit optique, soit électromagnétique
MRI-onderzoek van één of beide mammae, minstens drie sequenties, met of zonder contrast, met registratie op optische of elektromagnetische drager
459491/502
Examen d'IRM du rachis cervical ou thoracique ou lombosacré, minimum 3 séquences, avec ou sans contraste, avec enregistrement sur support, soit optique, soit électromagnétique
MRI-onderzoek van de cervicale of thoracale of lumbosacrale wervelzuil, minstens drie sequenties, met of zonder contrast, met registratie op optische of elektromagnetische drager
459513/24
Examen d'IRM d'un membre, minimum 3 séquences, avec ou sans contraste, avec enregistrement sur support soit optique, soit électromagnétique
MRI-onderzoek van een lidmaat, minstens drie sequenties, met of zonder contrast, met registratie op optische of elektromagnetische drager
459432/43
Angiographie par résonance magnétique des vaisseaux du cou ou des vaisseaux sanguins du thorax ou de l'abdomen ou du pelvis ou d'un membre, minimum 3 séquences, avec ou sans contraste, avec enregistrement sur support, soit optique, soit électromagnétique
MR-angiografie van de halsvaten of van de thoracale of van de abdominale of van de pelvische bloedvaten of van een lidmaat, minstens drie sequenties, met of zonder contrast, met registratie op optische of elektromagnetische drager
459454/65
Etude morphologique et fonctionnelle par résonance magnétique du coeur avec mesure de la fonction cardiaque globale et/ou régionale, minimum 3 séquences, avec enregistrement sur support soit optique, soit électromagnétique
Morfologische en functionele MR-studie van het hart met globale en/of regionale cardiale functiemeting, minstens drie sequenties, met registratie op optische of elektromagnetische drager
459535/46
Etude fonctionelle par résonance magnétique de l'encéphale (technique Bold) avec collecte séquentielle des données avec analyse quantitative via un système de comptage (ordinateur) avec courbes d'activité dans le temps et/ou tableaux de mesures et/ou imag
Functionele MR-studie van de hersenen (BOLD-techniek) met sequentiële inzameling van de gegevens met kwantitatieve analyse via telsysteem (computer) met activiteitscurven in de tijd en/of cijfermatige tabellen en/of parametrische beelden, minstens drie se
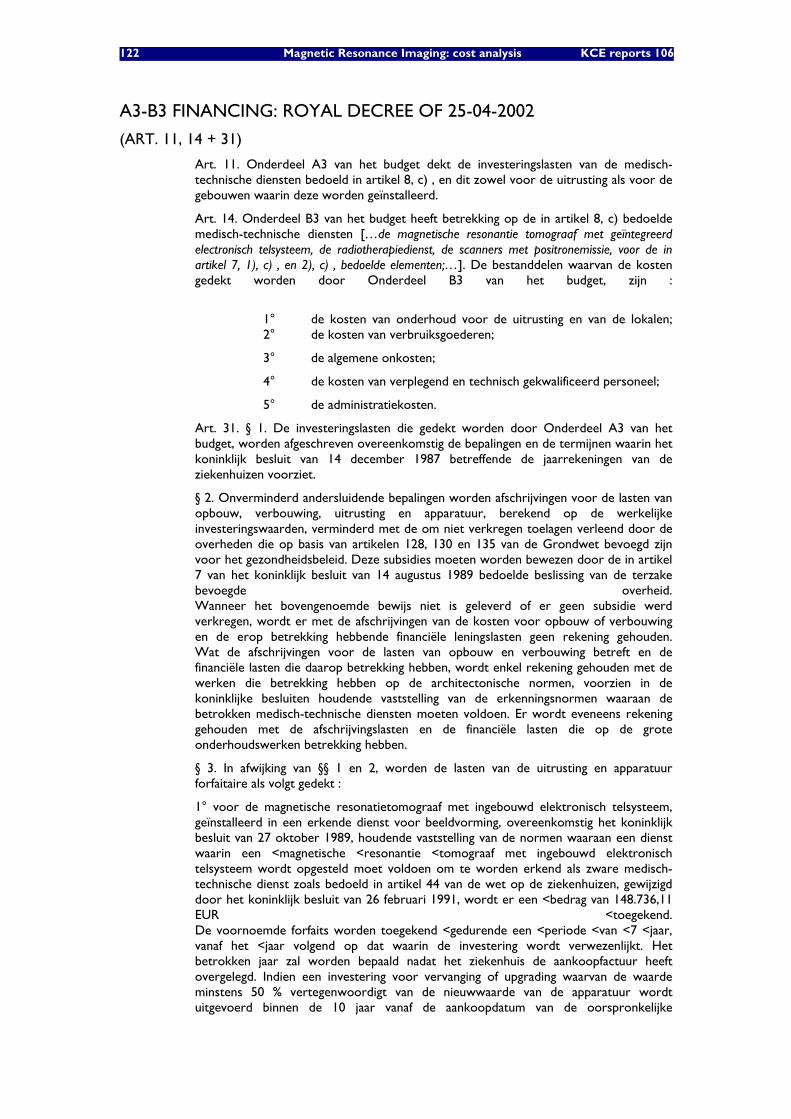
122 Magnetic Resonance Imaging: cost analysis KCE reports 106
A3-B3 FINANCING: ROYAL DECREE OF 25-04-2002
(ART. 11, 14 + 31)
Art. 11. Onderdeel A3 van het budget dekt de investeringslasten van de medisch-technische diensten bedoeld in artikel 8, c) , en dit zowel voor de uitrusting als voor de gebouwen waarin deze worden geïnstalleerd.
Art. 14. Onderdeel B3 van het budget heeft betrekking op de in artikel 8, c) bedoelde medisch-technische diensten […de magnetische resonantie tomograaf met geïntegreerd electronisch telsysteem, de radiotherapiedienst, de scanners met positronemissie, voor de in artikel 7, 1), c) , en 2), c) , bedoelde elementen;…]. De bestanddelen waarvan de kosten gedekt worden door Onderdeel B3 van het budget, zijn :
1° de kosten van onderhoud voor de uitrusting en van de lokalen; 2° de kosten van verbruiksgoederen;
3° de algemene onkosten;
4° de kosten van verplegend en technisch gekwalificeerd personeel;
5° de administratiekosten.
Art. 31. § 1. De investeringslasten die gedekt worden door Onderdeel A3 van het budget, worden afgeschreven overeenkomstig de bepalingen en de termijnen waarin het koninklijk besluit van 14 december 1987 betreffende de jaarrekeningen van de ziekenhuizen voorziet.
§ 2. Onverminderd andersluidende bepalingen worden afschrijvingen voor de lasten van opbouw, verbouwing, uitrusting en apparatuur, berekend op de werkelijke investeringswaarden, verminderd met de om niet verkregen toelagen verleend door de overheden die op basis van artikelen 128, 130 en 135 van de Grondwet bevoegd zijn voor het gezondheidsbeleid. Deze subsidies moeten worden bewezen door de in artikel 7 van het koninklijk besluit van 14 augustus 1989 bedoelde beslissing van de terzake bevoegde overheid. Wanneer het bovengenoemde bewijs niet is geleverd of er geen subsidie werd verkregen, wordt er met de afschrijvingen van de kosten voor opbouw of verbouwing en de erop betrekking hebbende financiële leningslasten geen rekening gehouden. Wat de afschrijvingen voor de lasten van opbouw en verbouwing betreft en de financiële lasten die daarop betrekking hebben, wordt enkel rekening gehouden met de werken die betrekking hebben op de architectonische normen, voorzien in de koninklijke besluiten houdende vaststelling van de erkenningsnormen waaraan de betrokken medisch-technische diensten moeten voldoen. Er wordt eveneens rekening gehouden met de afschrijvingslasten en de financiële lasten die op de grote onderhoudswerken betrekking hebben.
§ 3. In afwijking van §§ 1 en 2, worden de lasten van de uitrusting en apparatuur forfaitaire als volgt gedekt :
1° voor de magnetische resonatietomograaf met ingebouwd elektronisch telsysteem, geïnstalleerd in een erkende dienst voor beeldvorming, overeenkomstig het koninklijk besluit van 27 oktober 1989, houdende vaststelling van de normen waaraan een dienst waarin een <magnetische <resonantie <tomograaf met ingebouwd elektronisch telsysteem wordt opgesteld moet voldoen om te worden erkend als zware medisch-technische dienst zoals bedoeld in artikel 44 van de wet op de ziekenhuizen, gewijzigd door het koninklijk besluit van 26 februari 1991, wordt er een <bedrag van 148.736,11 EUR <toegekend. De voornoemde forfaits worden toegekend <gedurende een <periode <van <7 <jaar, vanaf het <jaar volgend op dat waarin de investering wordt verwezenlijkt. Het betrokken jaar zal worden bepaald nadat het ziekenhuis de aankoopfactuur heeft overgelegd. Indien een investering voor vervanging of upgrading waarvan de waarde minstens 50 % vertegenwoordigt van de nieuwwaarde van de apparatuur wordt uitgevoerd binnen de 10 jaar vanaf de aankoopdatum van de oorspronkelijke

KCE Reports 106 Magnetic Resonance Imaging: cost analysis 123
apparatuur, blijven voornoemde forfaits behouden na de voornoemde periode van 7 jaar, en dit voor een nieuwe periode van 7 jaar. Het bewijs van deze investering wordt bepaald door de overlegging van de betrokken factuur. 2° voor de apparatuur geïnstalleerd in een dienst radiotherapie erkend overeenkomstig het koninklijk besluit van 5 april 1991 houdende vaststelling van de normen waaraan een dienst radiotherapie moet voldoen om te worden erkend als zware medisch-technische dienst zoals bedoeld in artikel 44 van de wet op de ziekenhuizen, gecoördineerd op 7 augustus 1987, gewijzigd bij het koninklijk besluit van 17 oktober 1991, wordt de financiering toegekend waarover de dienst beschikt op 30 juni 2002. 3° voor de tomograaf met positron-emissie (PET-scanner), geïnstalleerd in een dienst voor nucleaire geneeskunde, erkend overeenkomstig het koninklijk besluit van 12 augustus 2000, wordt er een forfaitair bedrag van 282.598,62 EUR toegekend.
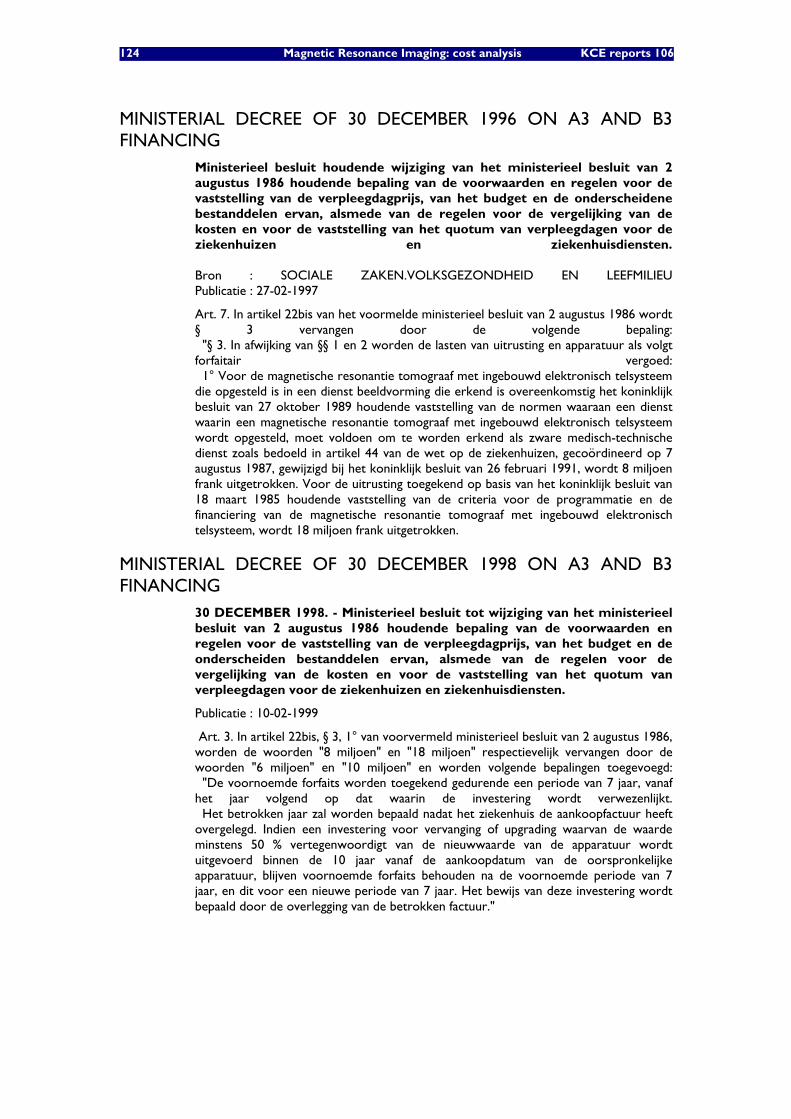
124 Magnetic Resonance Imaging: cost analysis KCE reports 106
MINISTERIAL DECREE OF 30 DECEMBER 1996 ON A3 AND B3 FINANCING
Ministerieel besluit houdende wijziging van het ministerieel besluit van 2 augustus 1986 houdende bepaling van de voorwaarden en regelen voor de vaststelling van de verpleegdagprijs, van het budget en de onderscheidene bestanddelen ervan, alsmede van de regelen voor de vergelijking van de kosten en voor de vaststelling van het quotum van verpleegdagen voor de ziekenhuizen en ziekenhuisdiensten. Bron : SOCIALE ZAKEN.VOLKSGEZONDHEID EN LEEFMILIEU Publicatie : 27-02-1997
Art. 7. In artikel 22bis van het voormelde ministerieel besluit van 2 augustus 1986 wordt § 3 vervangen door de volgende bepaling: "§ 3. In afwijking van §§ 1 en 2 worden de lasten van uitrusting en apparatuur als volgt forfaitair vergoed: 1° Voor de magnetische resonantie tomograaf met ingebouwd elektronisch telsysteem die opgesteld is in een dienst beeldvorming die erkend is overeenkomstig het koninklijk besluit van 27 oktober 1989 houdende vaststelling van de normen waaraan een dienst waarin een magnetische resonantie tomograaf met ingebouwd elektronisch telsysteem wordt opgesteld, moet voldoen om te worden erkend als zware medisch-technische dienst zoals bedoeld in artikel 44 van de wet op de ziekenhuizen, gecoördineerd op 7 augustus 1987, gewijzigd bij het koninklijk besluit van 26 februari 1991, wordt 8 miljoen frank uitgetrokken. Voor de uitrusting toegekend op basis van het koninklijk besluit van 18 maart 1985 houdende vaststelling van de criteria voor de programmatie en de financiering van de magnetische resonantie tomograaf met ingebouwd elektronisch telsysteem, wordt 18 miljoen frank uitgetrokken.
MINISTERIAL DECREE OF 30 DECEMBER 1998 ON A3 AND B3 FINANCING
30 DECEMBER 1998. - Ministerieel besluit tot wijziging van het ministerieel besluit van 2 augustus 1986 houdende bepaling van de voorwaarden en regelen voor de vaststelling van de verpleegdagprijs, van het budget en de onderscheiden bestanddelen ervan, alsmede van de regelen voor de vergelijking van de kosten en voor de vaststelling van het quotum van verpleegdagen voor de ziekenhuizen en ziekenhuisdiensten.
Publicatie : 10-02-1999
Art. 3. In artikel 22bis, § 3, 1° van voorvermeld ministerieel besluit van 2 augustus 1986, worden de woorden "8 miljoen" en "18 miljoen" respectievelijk vervangen door de woorden "6 miljoen" en "10 miljoen" en worden volgende bepalingen toegevoegd: "De voornoemde forfaits worden toegekend gedurende een periode van 7 jaar, vanaf het jaar volgend op dat waarin de investering wordt verwezenlijkt. Het betrokken jaar zal worden bepaald nadat het ziekenhuis de aankoopfactuur heeft overgelegd. Indien een investering voor vervanging of upgrading waarvan de waarde minstens 50 % vertegenwoordigt van de nieuwwaarde van de apparatuur wordt uitgevoerd binnen de 10 jaar vanaf de aankoopdatum van de oorspronkelijke apparatuur, blijven voornoemde forfaits behouden na de voornoemde periode van 7 jaar, en dit voor een nieuwe periode van 7 jaar. Het bewijs van deze investering wordt bepaald door de overlegging van de betrokken factuur."
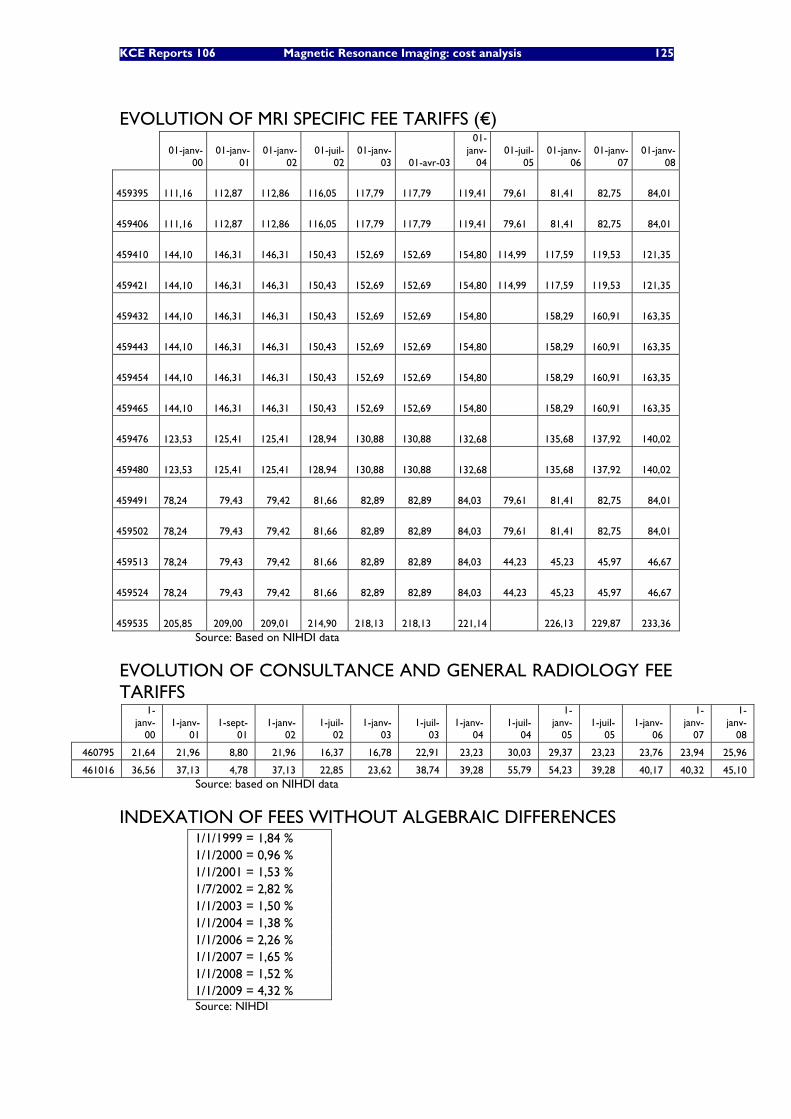
KCE Reports 106 Magnetic Resonance Imaging: cost analysis 125
EVOLUTION OF MRI SPECIFIC FEE TARIFFS (€)
01-janv-
00 01-janv-
01 01-janv-
02 01-juil-
02 01-janv-
03 01-avr-03
01-janv-
04 01-juil-
05 01-janv-
06 01-janv-
07 01-janv-
08
459395 111,16 112,87 112,86 116,05 117,79 117,79
119,41 79,61 81,41 82,75 84,01
459406 111,16 112,87 112,86 116,05 117,79 117,79
119,41 79,61 81,41 82,75 84,01
459410 144,10 146,31 146,31 150,43 152,69 152,69
154,80 114,99 117,59 119,53 121,35
459421 144,10 146,31 146,31 150,43 152,69 152,69
154,80 114,99 117,59 119,53 121,35
459432 144,10 146,31 146,31 150,43 152,69 152,69
154,80 158,29 160,91 163,35
459443 144,10 146,31 146,31 150,43 152,69 152,69
154,80 158,29 160,91 163,35
459454 144,10 146,31 146,31 150,43 152,69 152,69
154,80 158,29 160,91 163,35
459465 144,10 146,31 146,31 150,43 152,69 152,69
154,80 158,29 160,91 163,35
459476 123,53 125,41 125,41 128,94 130,88 130,88
132,68 135,68 137,92 140,02
459480 123,53 125,41 125,41 128,94 130,88 130,88
132,68 135,68 137,92 140,02
459491 78,24 79,43 79,42 81,66 82,89 82,89
84,03 79,61 81,41 82,75 84,01
459502 78,24 79,43 79,42 81,66 82,89 82,89
84,03 79,61 81,41 82,75 84,01
459513 78,24 79,43 79,42 81,66 82,89 82,89
84,03 44,23 45,23 45,97 46,67
459524 78,24 79,43 79,42 81,66 82,89 82,89
84,03 44,23 45,23 45,97 46,67
459535 205,85 209,00 209,01 214,90 218,13 218,13
221,14 226,13 229,87 233,36
Source: Based on NIHDI data
EVOLUTION OF CONSULTANCE AND GENERAL RADIOLOGY FEE TARIFFS
1-janv-
00 1-janv-
01 1-sept-
01 1-janv-
02 1-juil-
02 1-janv-
03 1-juil-
03 1-janv-
04 1-juil-
04
1-janv-
05 1-juil-
05 1-janv-
06
1-janv-
07
1-janv-
08
460795 21,64 21,96 8,80 21,96 16,37 16,78 22,91 23,23 30,03 29,37 23,23 23,76 23,94 25,96
461016 36,56 37,13 4,78 37,13 22,85 23,62 38,74 39,28 55,79 54,23 39,28 40,17 40,32 45,10 Source: based on NIHDI data
INDEXATION OF FEES WITHOUT ALGEBRAIC DIFFERENCES 1/1/1999 = 1,84 % 1/1/2000 = 0,96 % 1/1/2001 = 1,53 % 1/7/2002 = 2,82 % 1/1/2003 = 1,50 % 1/1/2004 = 1,38 % 1/1/2006 = 2,26 % 1/1/2007 = 1,65 % 1/1/2008 = 1,52 % 1/1/2009 = 4,32 % Source: NIHDI
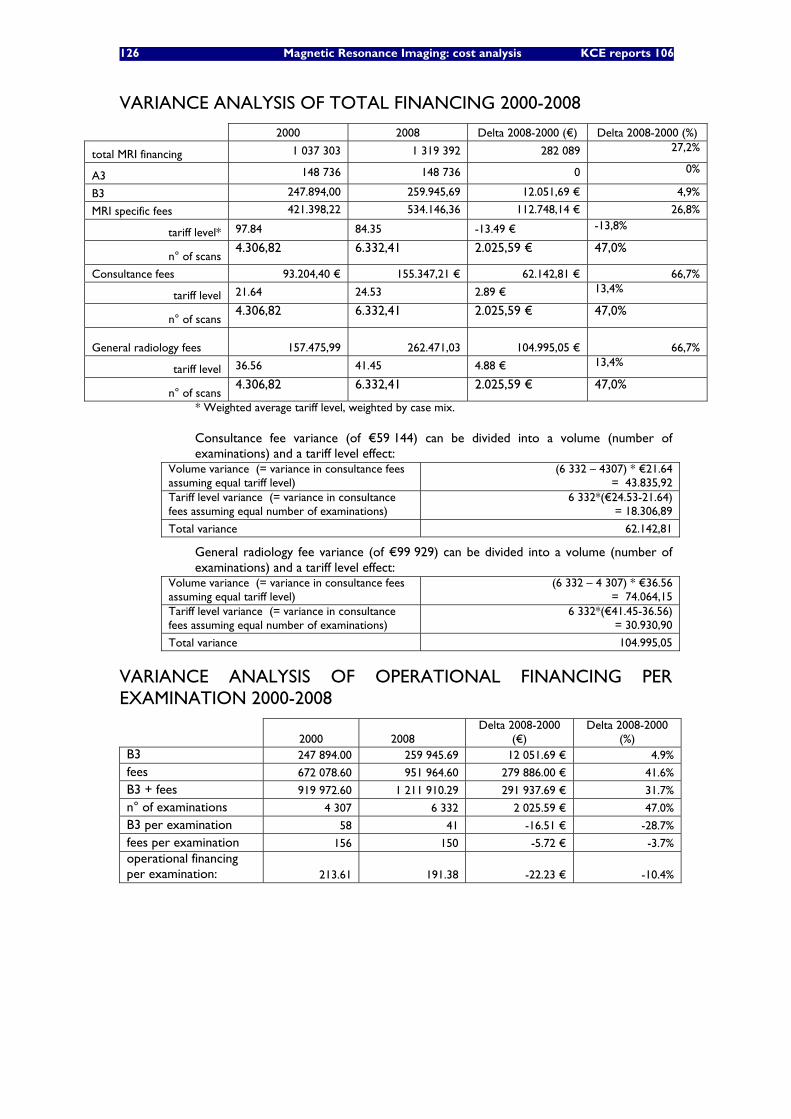
126 Magnetic Resonance Imaging: cost analysis KCE reports 106
VARIANCE ANALYSIS OF TOTAL FINANCING 2000-2008
2000 2008 Delta 2008-2000 (€) Delta 2008-2000 (%)
total MRI financing 1 037 303 1 319 392 282 089 27,2%
A3 148 736 148 736 0 0%
B3 247.894,00 259.945,69 12.051,69 € 4,9%
MRI specific fees 421.398,22 534.146,36 112.748,14 € 26,8%
tariff level* 97.84 84.35 -13.49 € -13,8%
n° of scans 4.306,82 6.332,41 2.025,59 € 47,0%
Consultance fees 93.204,40 € 155.347,21 € 62.142,81 € 66,7%
tariff level 21.64 24.53 2.89 € 13,4%
n° of scans 4.306,82 6.332,41 2.025,59 € 47,0%
General radiology fees
157.475,99 262.471,03 104.995,05 € 66,7%
tariff level 36.56 41.45 4.88 € 13,4%
n° of scans 4.306,82 6.332,41 2.025,59 € 47,0%
* Weighted average tariff level, weighted by case mix.
Consultance fee variance (of €59 144) can be divided into a volume (number of examinations) and a tariff level effect:
Volume variance (= variance in consultance fees assuming equal tariff level)
(6 332 – 4307) * €21.64 = 43.835,92
Tariff level variance (= variance in consultance fees assuming equal number of examinations)
6 332*(€24.53-21.64) = 18.306,89
Total variance 62.142,81
General radiology fee variance (of €99 929) can be divided into a volume (number of examinations) and a tariff level effect:
Volume variance (= variance in consultance fees assuming equal tariff level)
(6 332 – 4 307) * €36.56 = 74.064,15
Tariff level variance (= variance in consultance fees assuming equal number of examinations)
6 332*(€41.45-36.56) = 30.930,90
Total variance 104.995,05
VARIANCE ANALYSIS OF OPERATIONAL FINANCING PER EXAMINATION 2000-2008
2000 2008 Delta 2008-2000
(€) Delta 2008-2000
(%) B3 247 894.00 259 945.69 12 051.69 € 4.9% fees 672 078.60 951 964.60 279 886.00 € 41.6%
B3 + fees 919 972.60 1 211 910.29 291 937.69 € 31.7%
n° of examinations 4 307 6 332 2 025.59 € 47.0%
B3 per examination 58 41 -16.51 € -28.7%
fees per examination 156 150 -5.72 € -3.7% operational financing per examination: 213.61 191.38 -22.23 € -10.4%
KCE Reports 106 Magnetic Resonance Imaging: cost analysis 127
APPENDIX TO CHAPTER 10
FRENCH FINANCING SYSTEM
Principes Generaux
Systemes d’autorisation et de surveillance
L’autorisation administrative est décentralisée au niveau des Agences Régionale de l’Hospitalisation (futures Agences Régionales de Santé), qui procèdent aux éventuels arbitrages en fonction des besoins (Schéma Régional d’Organisation Sanitaire).
Au niveau individuel, l’autorisation technique d’installer un scanner un RMN est strictement encadrée et toujours nominative. Tout au long de la vie de l’appareil, la surveillance de celui-ci relève de l’Autorité de Sûreté Nucléaire28 qui est compétente notamment pour l’ensemble du champ radiologique (y compris pour les éventuelles sanctions).
Le systeme actuel de financement des rmn et scanners : le principe de la double facturation
Les actes de scanographie, de remnographie, de tomographie à émission de positons sont rémunérés par le cumul d'un tarif traditionnel à l’acte (tarif défini par la Classification Commune des Actes Médicaux – CCAM), visant à rémunérer l’acte intellectuel du praticien, et des forfaits techniques (défini selon différents critères) visant quant à eux à rémunérer les frais d’amortissement (sur 7 ans) et de fonctionnement de l’appareil (équipement, maintenance, consommables, frais de gestion, assurance etc…).
Presentation de la double facturation
Modalites d’application de la legislation
Etablissement Privé Hôpital Public
Consultation (sans Hospitalisation)
Hospitalisation Consultation Externe3 Avec hospitalisation
Facturation de l’Acte1 Facturation de l’Acte2 Facturation de l’Acte
Forfaits Techniques Forfaits Techniques2 Facturation des Forfaits Techniques
Le GHS couvre
L’Acte et les Forfaits
1. Etablissement privé/ Consultation : l’établissement privé qui dispense des actes de Scanner ou d’IRM peut pour certains actes facturer un supplément.
2. Etablissement privé / Hospitalisation : le calcul des GHS se fait hors RMN&Scanner qui son traités séparément. Les Forfaits sont versés au Médecin puis (en pratique dans la quasi-totalité des cas) reversés par ce dernier à la structure propriétaire de l’appareil (cf. Bordereau ci-joint).
3. Etablissements publics : dans le cadre des consultations externes, les actes de scanner ou de RMN sont facturés mais aussi suivis au niveau budgétaire. Dans le cadre des hospitalisations, les Groupes Homogènes de Séjour (GHS) couvrent l’intégralité des dépenses.
Cas particuliers : une certaine complexité a pu se faire jour dans des cas tels que la mutualisation des matériels, ou les partenariats public/privé. En effet, l’activité de certains plateaux techniques peut relever de deux législations budgétaires différentes.
28 http://www.asn.fr : Organisme créé par la loi 2006-686 du 13 Juin 2006. L’ASN est chargée de contrôler les
activités nucléaires civiles en France. Elle assure, au nom de l’Etat le controle de la sûreté nucléaire et la radioprotection en France pour protéger les travailleurs, les patients, le public et l’environnement des risques liés aux activités nucléaires.
128 Magnetic Resonance Imaging: cost analysis KCE reports 106
Le paiement traditionnel a l’acte : classification commune des actes medicaux (ccam)
Comme tous les autres actes médicaux, chaque acte de scanner ou de RMN se voit attribuer un code CCAM et une rémunération qui y est associée. La CCAM comporte, comme pour tous les autres actes les informations suivantes :
- Code CCAM
- Libellé (y compris indications, formation, et environnement spécifique),
- Modalités de prise en charge (Accord préalable éventuel, admission au remboursement, exonération du ticket modérateur)
- Tarification et suppléments éventuels de prise en charge en cabinet
- Eventuelle association d’actes (Scanner seulement)
La Classification Commune des Actes Médicaux (CCAM) a succédé en très récemment à l’ancienne Nomenclature Générale des Actes Professionnelles (NGAP), mais les logiques intellectuelles des deux nomenclatures sont très différentes. L’objectif stratégique affiché de la CCAM était non seulement de définir des définir des libellés d’actes parfaitement conformes aux données acquises de la science, mais aussi d’opérer une révision en profondeur de la hiérarchie des différents actes en fonction de l’évolution des pratiques (en particulier en terme de temps effectivement passé pour la réalisation de chaque acte en fonction de l’évolution récente des techniques). Cela n’a pas été le cas pour les actes de scanner et de RMN pour des raisons largement politiques (impact sur la pratique des cabinets). La neutralité économique a donc été privilégiée.
Dans la pratique les tarifs de la CCAM ne sont donc pas conformes à la logique initialement affichée par celle-ci. De plus, le nombre total d’actes inscrits à la CCAM est beaucoup plus important que celui présent dans l’ancienne NGAP, car le découpage des actes opéré par la CCAM est beaucoup plus fin et précis. Dans certaines hypothèses (minoritaires mais pas exceptionnelles), certains actes peuvent disposer d’un libellé officiel dans la CCAM sans trouver leur équivalent dans l’ancienne NGAP. Dans ce cas, ils existent bien réglementairement dans la CCAM, mais n’ont pas encore fait l’objet d’une tarification officielle (ni donc d’une prise en charge).
Les forfaits techniques
Définition des forfaits techniques
Le montant du forfait technique varie simultanément en fonction de trois facteurs :
- la classe (caractéristiques techniques) à laquelle appartient l'appareil
autorisé.
- de son année d'installation (prise en compte de l’évolution rapide des
techniques).
- d'un seuil d'activité de référence correspondant à une intensité
d’utilisation considérée comme normale, tant au plan clinique
qu’économique.
Au-delà de ce seuil d’activité, un montant réduit du forfait technique, dont la valeur monétaire est fixée dans les mêmes conditions que le forfait technique lui-même, est appliqué. Trois tranches d’activité sont définies au-delà de l’activité de référence :
1. Activité supérieure à l’activité de référence et inférieure ou égale au seuil 1
2. Activé supérieure au seuil 1 et inférieure ou égale au seuil 2
3. Activité supérieure au seuil 2.
KCE Reports 106 Magnetic Resonance Imaging: cost analysis 129
Pour les appareils de scanographie et d’IRM, le montant réduit du forfait technique varie selon la tranche d’activité considérée.
A chacune de ces tranches d’activité correspond un montant différent du forfait réduit.
Au niveau de la facturation (voir ci-joint le Bordereau Forfait Technique), il convient de souligner que le numéro de l’appareil est systématiquement mentionné, de même que sa date d’installation, sa puissance et sa classe. Sur le même document sont naturellement mentionnés les noms de l’établissement et du médecin effectuant l’acte. Concrètement les systèmes de facturation (cf. infra) permettent de procéder à ce niveau à des contrôles de cohérence entre facturation et appareil, mais aussi à d’éventuels contrôles d’activité sur un appareil pris individuellement.
Règles d’association d’actes
Pour les actes de scanographie (uniquement), il existe une règle d’association d’actes. Lorsque l'examen porte sur plusieurs régions anatomiques, un seul acte doit être tarifé, sauf dans le cas où est effectué l'examen conjoint des régions anatomiques suivantes : membres et tête, membres et thorax, membres et abdomen, tête et abdomen, thorax et abdomen complet, tête et thorax, quel que soit le nombre de coupes nécessaires, avec ou sans injection de produit de contraste.
Dans ce cas, deux actes au plus peuvent être tarifés et à taux plein. Deux forfaits techniques peuvent alors être facturés, le second avec une minoration de 10 % de son tarif. Quand un libellé décrit l'examen conjoint de plusieurs régions anatomiques, il ne peut être tarifé avec aucun autre acte de scanographie. Deux forfaits techniques peuvent alors être facturés, le second avec une minoration de 10 % de son tarif.
Dispositions en vigueur : l’avenant 24 a la convention medicale et ses consequences
Logique réglementaire et négociation conventionnelle
Les dispositions énoncées relatives au paiement des actes de Scanner et d’IRM relèvent tout à la fois d’une logique réglementaire (nécessité de fixer les règles dans des textes clairs) et de la négociation conventionnelle (forte implication du secteur privé dans les activités de scanners et de RMN), avec les impératifs économiques qui y sont liés. L’Assurance Maladie a du également tenir compte des contraintes budgétaires pesant sur ses propres comptes: en cas de dépassement de l’objectif de dépense (l’ONDAM) sur le poste « radiologie », elle se réserve le droit d’intervenir, ce qui fut fait récemment en signant avec la profession l’avenant 24 à la convention médicale des médecins libéraux du 25 juillet 200729 . Ce dernier, qui est le texte actuellement en vigueur, apporta des modifications sur les points suivants :
1. Baisse des tarifs des forfaits techniques et création de 2 nouveaux seuils d’activité permettant une nouvelle modulation dégressive du tarif en fonction de l’activité ;
2. Minoration du 2ème forfait en cas d’associations d’actes ou de procédures en scanographie ;
3. Mise à jour de la classification des appareils.
29 (Reprise dans la décision du 23/08/2007 – JO du 11/09/2007)
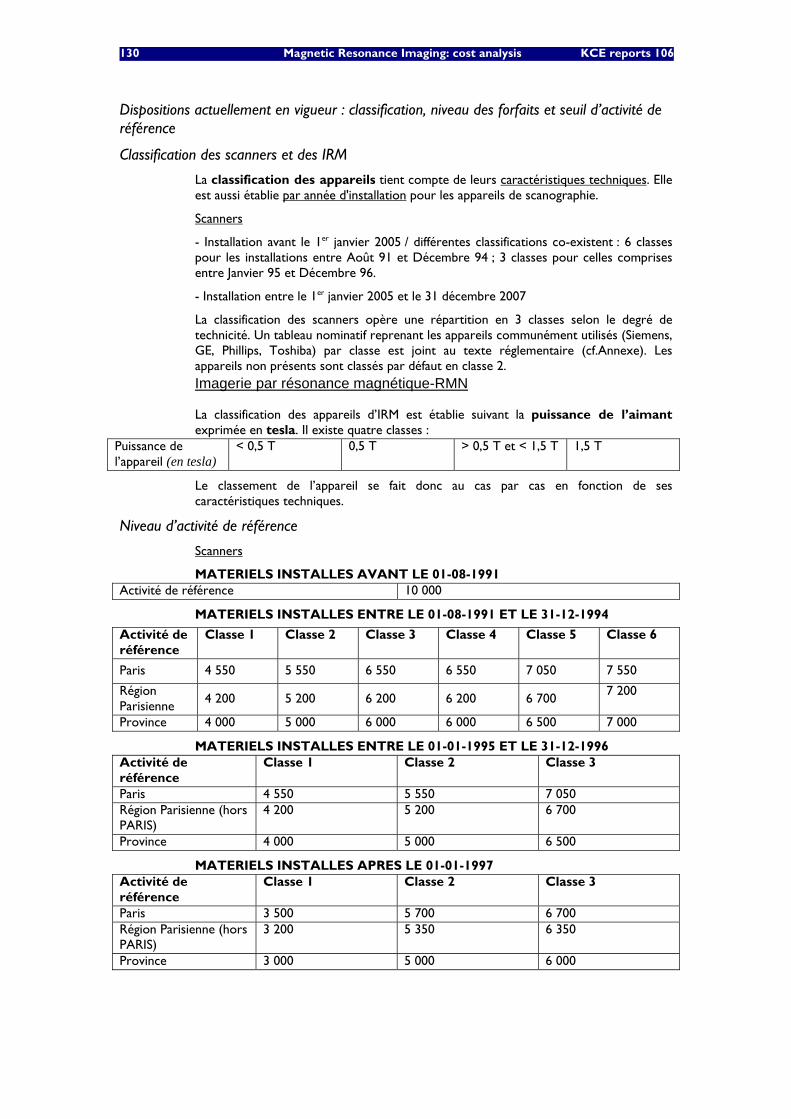
130 Magnetic Resonance Imaging: cost analysis KCE reports 106
Dispositions actuellement en vigueur : classification, niveau des forfaits et seuil d’activité de référence
Classification des scanners et des IRM
La classification des appareils tient compte de leurs caractéristiques techniques. Elle est aussi établie par année d'installation pour les appareils de scanographie.
Scanners
- Installation avant le 1er janvier 2005 / différentes classifications co-existent : 6 classes pour les installations entre Août 91 et Décembre 94 ; 3 classes pour celles comprises entre Janvier 95 et Décembre 96.
- Installation entre le 1er janvier 2005 et le 31 décembre 2007
La classification des scanners opère une répartition en 3 classes selon le degré de technicité. Un tableau nominatif reprenant les appareils communément utilisés (Siemens, GE, Phillips, Toshiba) par classe est joint au texte réglementaire (cf.Annexe). Les appareils non présents sont classés par défaut en classe 2. Imagerie par résonance magnétique-RMN
La classification des appareils d’IRM est établie suivant la puissance de l’aimant exprimée en tesla. Il existe quatre classes :
Puissance de l’appareil (en tesla)
< 0,5 T 0,5 T > 0,5 T et < 1,5 T 1,5 T
Le classement de l’appareil se fait donc au cas par cas en fonction de ses caractéristiques techniques.
Niveau d’activité de référence
Scanners
MATERIELS INSTALLES AVANT LE 01-08-1991 Activité de référence 10 000
MATERIELS INSTALLES ENTRE LE 01-08-1991 ET LE 31-12-1994
Activité de référence
Classe 1 Classe 2 Classe 3 Classe 4 Classe 5 Classe 6
Paris 4 550 5 550 6 550 6 550 7 050 7 550
Région Parisienne
4 200 5 200 6 200 6 200 6 700 7 200
Province 4 000 5 000 6 000 6 000 6 500 7 000
MATERIELS INSTALLES ENTRE LE 01-01-1995 ET LE 31-12-1996 Activité de référence
Classe 1 Classe 2 Classe 3
Paris 4 550 5 550 7 050 Région Parisienne (hors PARIS)
4 200 5 200 6 700
Province 4 000 5 000 6 500
MATERIELS INSTALLES APRES LE 01-01-1997 Activité de référence
Classe 1 Classe 2 Classe 3
Paris 3 500 5 700 6 700 Région Parisienne (hors PARIS)
3 200 5 350 6 350
Province 3 000 5 000 6 000
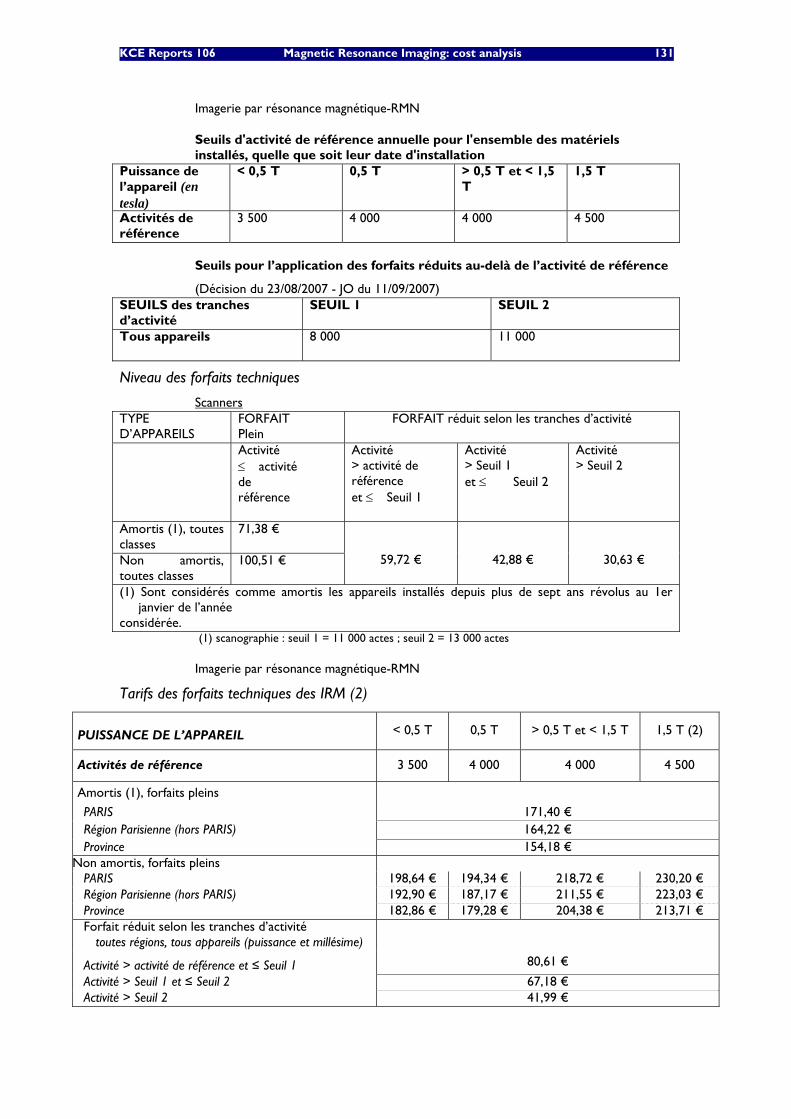
KCE Reports 106 Magnetic Resonance Imaging: cost analysis 131
Imagerie par résonance magnétique-RMN
Seuils d'activité de référence annuelle pour l'ensemble des matériels installés, quelle que soit leur date d'installation
Puissance de l’appareil (en tesla)
< 0,5 T 0,5 T > 0,5 T et < 1,5 T
1,5 T
Activités de référence
3 500 4 000 4 000 4 500
Seuils pour l’application des forfaits réduits au-delà de l’activité de référence
(Décision du 23/08/2007 - JO du 11/09/2007) SEUILS des tranches d’activité
SEUIL 1 SEUIL 2
Tous appareils 8 000
11 000
Niveau des forfaits techniques
Scanners TYPE D’APPAREILS
FORFAIT Plein
FORFAIT réduit selon les tranches d’activité
Activité ≤�activité de référence
Activité > activité de référence et ≤�Seuil 1
Activité > Seuil 1 et ≤��Seuil 2
Activité > Seuil 2
Amortis (1), toutes classes
71,38 €
Non amortis, toutes classes
100,51 €
59,72 €
42,88 €
30,63 €
(1) Sont considérés comme amortis les appareils installés depuis plus de sept ans révolus au 1er janvier de l’année
considérée. (1) scanographie : seuil 1 = 11 000 actes ; seuil 2 = 13 000 actes
Imagerie par résonance magnétique-RMN
Tarifs des forfaits techniques des IRM (2)
PUISSANCE DE L’APPAREIL < 0,5 T 0,5 T > 0,5 T et < 1,5 T 1,5 T (2)
Activités de référence 3 500 4 000 4 000 4 500
Amortis (1), forfaits pleins
PARIS 171,40 € Région Parisienne (hors PARIS) 164,22 € Province 154,18 €
Non amortis, forfaits pleins PARIS 198,64 € 194,34 € 218,72 € 230,20 € Région Parisienne (hors PARIS) 192,90 € 187,17 € 211,55 € 223,03 € Province 182,86 € 179,28 € 204,38 € 213,71 € Forfait réduit selon les tranches d’activité
toutes régions, tous appareils (puissance et millésime)
Activité > activité de référence et ≤ Seuil 1 80,61 €
Activité > Seuil 1 et ≤ Seuil 2 67,18 € Activité > Seuil 2 41,99 €
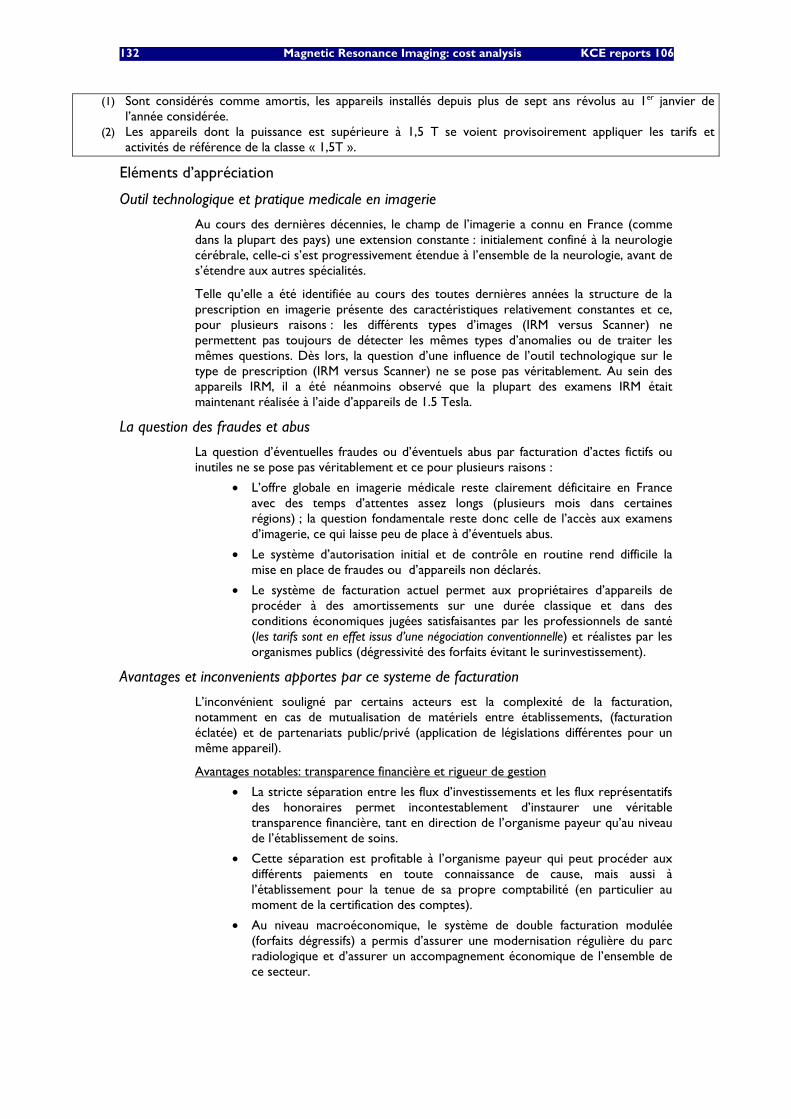
132 Magnetic Resonance Imaging: cost analysis KCE reports 106
(1) Sont considérés comme amortis, les appareils installés depuis plus de sept ans révolus au 1er janvier de l’année considérée.
(2) Les appareils dont la puissance est supérieure à 1,5 T se voient provisoirement appliquer les tarifs et activités de référence de la classe « 1,5T ».
Eléments d’appréciation
Outil technologique et pratique medicale en imagerie
Au cours des dernières décennies, le champ de l’imagerie a connu en France (comme dans la plupart des pays) une extension constante : initialement confiné à la neurologie cérébrale, celle-ci s’est progressivement étendue à l’ensemble de la neurologie, avant de s’étendre aux autres spécialités.
Telle qu’elle a été identifiée au cours des toutes dernières années la structure de la prescription en imagerie présente des caractéristiques relativement constantes et ce, pour plusieurs raisons : les différents types d’images (IRM versus Scanner) ne permettent pas toujours de détecter les mêmes types d’anomalies ou de traiter les mêmes questions. Dès lors, la question d’une influence de l’outil technologique sur le type de prescription (IRM versus Scanner) ne se pose pas véritablement. Au sein des appareils IRM, il a été néanmoins observé que la plupart des examens IRM était maintenant réalisée à l’aide d’appareils de 1.5 Tesla.
La question des fraudes et abus
La question d’éventuelles fraudes ou d’éventuels abus par facturation d’actes fictifs ou inutiles ne se pose pas véritablement et ce pour plusieurs raisons :
• L’offre globale en imagerie médicale reste clairement déficitaire en France avec des temps d’attentes assez longs (plusieurs mois dans certaines régions) ; la question fondamentale reste donc celle de l’accès aux examens d’imagerie, ce qui laisse peu de place à d’éventuels abus.
• Le système d’autorisation initial et de contrôle en routine rend difficile la mise en place de fraudes ou d’appareils non déclarés.
• Le système de facturation actuel permet aux propriétaires d’appareils de procéder à des amortissements sur une durée classique et dans des conditions économiques jugées satisfaisantes par les professionnels de santé (les tarifs sont en effet issus d’une négociation conventionnelle) et réalistes par les organismes publics (dégressivité des forfaits évitant le surinvestissement).
Avantages et inconvenients apportes par ce systeme de facturation
L’inconvénient souligné par certains acteurs est la complexité de la facturation, notamment en cas de mutualisation de matériels entre établissements, (facturation éclatée) et de partenariats public/privé (application de législations différentes pour un même appareil).
Avantages notables: transparence financière et rigueur de gestion
• La stricte séparation entre les flux d’investissements et les flux représentatifs des honoraires permet incontestablement d’instaurer une véritable transparence financière, tant en direction de l’organisme payeur qu’au niveau de l’établissement de soins.
• Cette séparation est profitable à l’organisme payeur qui peut procéder aux différents paiements en toute connaissance de cause, mais aussi à l’établissement pour la tenue de sa propre comptabilité (en particulier au moment de la certification des comptes).
• Au niveau macroéconomique, le système de double facturation modulée (forfaits dégressifs) a permis d’assurer une modernisation régulière du parc radiologique et d’assurer un accompagnement économique de l’ensemble de ce secteur.
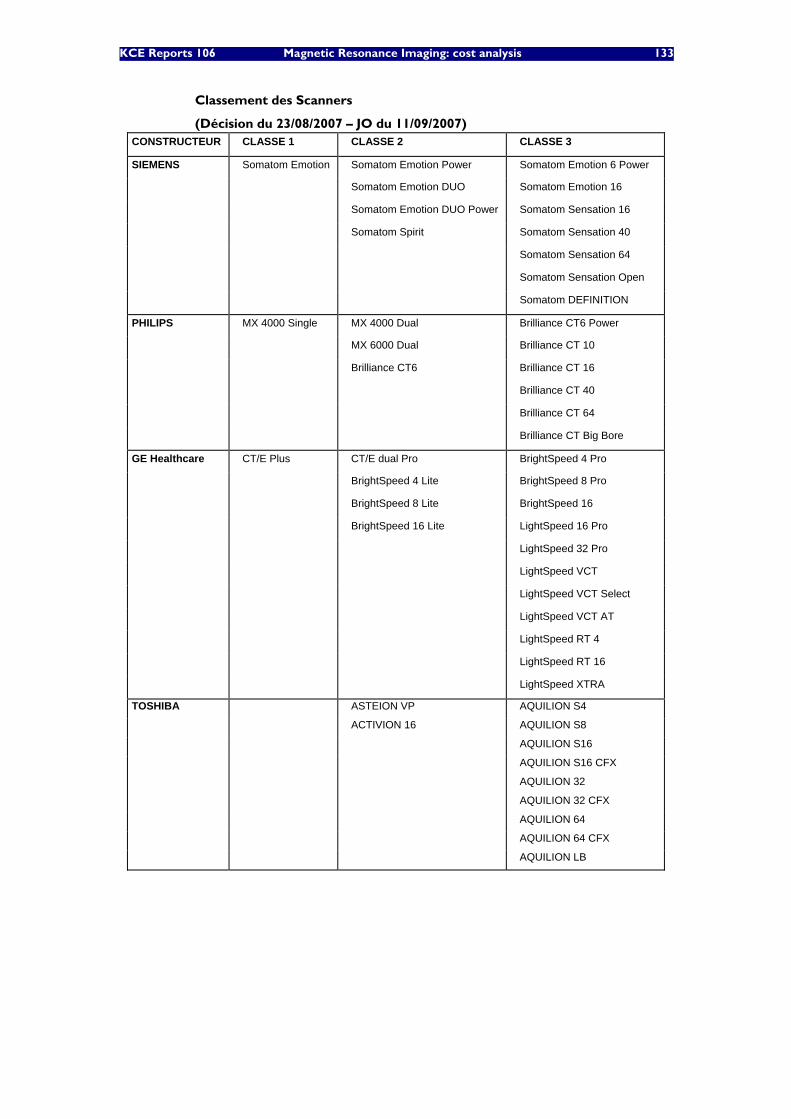
KCE Reports 106 Magnetic Resonance Imaging: cost analysis 133
Classement des Scanners
(Décision du 23/08/2007 – JO du 11/09/2007) CONSTRUCTEUR CLASSE 1 CLASSE 2 CLASSE 3
SIEMENS Somatom Emotion Somatom Emotion Power Somatom Emotion 6 Power
Somatom Emotion DUO Somatom Emotion 16
Somatom Emotion DUO Power Somatom Sensation 16
Somatom Spirit Somatom Sensation 40
Somatom Sensation 64
Somatom Sensation Open
Somatom DEFINITION
PHILIPS MX 4000 Single MX 4000 Dual Brilliance CT6 Power
MX 6000 Dual Brilliance CT 10
Brilliance CT6 Brilliance CT 16
Brilliance CT 40
Brilliance CT 64
Brilliance CT Big Bore
GE Healthcare CT/E Plus CT/E dual Pro BrightSpeed 4 Pro
BrightSpeed 4 Lite BrightSpeed 8 Pro
BrightSpeed 8 Lite BrightSpeed 16
BrightSpeed 16 Lite LightSpeed 16 Pro
LightSpeed 32 Pro
LightSpeed VCT
LightSpeed VCT Select
LightSpeed VCT AT
LightSpeed RT 4
LightSpeed RT 16
LightSpeed XTRA
TOSHIBA ASTEION VP AQUILION S4
ACTIVION 16 AQUILION S8
AQUILION S16
AQUILION S16 CFX
AQUILION 32
AQUILION 32 CFX
AQUILION 64
AQUILION 64 CFX
AQUILION LB
134 Magnetic Resonance Imaging: cost analysis KCE reports 106
13 REFERENCES 1. Hornak JP. The Basics of MRI. 1996-2008.Available from: http://www.cis.rit.edu/htbooks/mri/
2. Demaerel P, Hermans R, Verstraete K, Bogaert J, Van Goethem M, Deblaere K, et al. Magnetische Resonantie Beeldvorming. Health Technology Assessment (HTA). Brussel: Federaal Kenniscentrum voor de gezondheidszorg (KCE); 2006. (KCE reports 37A (D/2006/10.273/32))
3. Bronson J. High-Field MRI: Is It Time for 3T? Imaging Economics. 2004;Feb. .
4. Elster AD. How much contrast is enough? Dependence of enhancement on field strength and MR pulse sequence. Eur Radiol. 1997;7(suppl 5):276 - 80.
5. Chang KH, Ra DG, Han MH, Cha SH, Kim HD, Han MC. Contrast enhancement of brain tumors at different MR field strengths: comparison of 0.5 T and 2.0 T. AJNR Am J Neuroradiol. 1994;15(8):1413-9; discussion 20-3.
6. Reese L. Cost analysis of magnetic resonance imaging at St. Joseph's Health Centre of London. CMAJ. 1987;136(5):497-501.
7. Fletcher J, Clark MD, Sutton FA, Wellings R, Garas K. The cost of MRI: changes in costs 1989-1996. Br J Radiol. 1999;72(857):432-7.
8. Callens, Pirenne & Co. Kostprijs Nucleaire Magnetische Resonantie - NMR. 2008. Available from: http://www.nur-unr.be/08_verslag_kostprijs_NMR.PDF
9. Ernst & Young : VAN MAELE Rosita en SANDERS Jo. Validatie van het rapport van de Onderzoekscommissie over de onderfinanciering van de ziekenhuizen. Report. Brussel: Federaal Kenniscentrum voor de Gezondheidszorg (KCE); 2004 24 december. KCE reports 7A (D2004/10.273/11) Available from: http://kce.fgov.be/Download.aspx?ID=378

This page is left intentionally blank.

Dépôt légal : D/2009/10.273/15
KCE reports
1. Efficacité et rentabilité des thérapies de sevrage tabagique. D/2004/10.273/2. 2. Etude relative aux coûts potentiels liés à une éventuelle modification des règles du droit de la
responsabilité médicale (Phase 1). D/2004/10.273/4. 3. Utilisation des antibiotiques en milieu hospitalier dans le cas de la pyélonéphrite aiguë.
D/2004/10.273/6. 4. Leucoréduction. Une mesure envisageable dans le cadre de la politique nationale de sécurité
des transfusions sanguines. D/2004/10.273/8. 5. Evaluation des risques préopératoires. D/2004/10.273/10. 6. Validation du rapport de la Commission d’examen du sous financement des hôpitaux.
D/2004/10.273/12. 7. Recommandation nationale relative aux soins prénatals: Une base pour un itinéraire clinique de
suivi de grossesses. D/2004/10.273/14. 8. Systèmes de financement des médicaments hospitaliers: étude descriptive de certains pays
européens et du Canada. D/2004/10.273/16. 9. Feedback: évaluation de l'impact et des barrières à l'implémentation – Rapport de recherche:
partie 1. D/2005/10.273/02. 10. Le coût des prothèses dentaires. D/2005/10.273/04. 11. Dépistage du cancer du sein. D/2005/10.273/06. 12. Etude d’une méthode de financement alternative pour le sang et les dérivés sanguins labiles
dans les hôpitaux. D/2005/10.273/08. 13. Traitement endovasculaire de la sténose carotidienne. D/2005/10.273/10. 14. Variations des pratiques médicales hospitalières en cas d’infarctus aigu du myocarde en
Belgique. D/2005/10.273/12 15. Evolution des dépenses de santé. D/2005/10.273/14. 16. Etude relative aux coûts potentiels liés à une éventuelle modification des règles du droit de la
responsabilité médicale. Phase II : développement d'un modèle actuariel et premières estimations. D/2005/10.273/16.
17. Evaluation des montants de référence. D/2005/10.273/18. 18. Utilisation des itinéraires cliniques et guides de bonne pratique afin de déterminer de manière
prospective les honoraires des médecins hospitaliers: plus facile à dire qu'à faire.. D/2005/10.273/20
19. Evaluation de l'impact d'une contribution personnelle forfaitaire sur le recours au service d'urgences. D/2005/10.273/22.
20. HTA Diagnostic Moléculaire en Belgique. D/2005/10.273/24, D/2005/10.273/26. 21. HTA Matériel de Stomie en Belgique. D/2005/10.273.28. 22. HTA Tomographie par Emission de Positrons en Belgique. D/2005/10.273/30. 23. HTA Le traitement électif endovasculaire de l’anévrysme de l’aorte abdominale (AAA).
D/2005/10.273.33. 24. L'emploi des peptides natriurétiques dans l'approche diagnostique des patients présentant une
suspicion de décompensation cardiaque. D/2005/10.273.35 25. Endoscopie par capsule. D2006/10.273.02. 26. Aspects médico-légaux des recommandations de bonne pratique médicale. D2006/10.273/06. 27. Qualité et organisation des soins du diabète de type 2. D2006/10.273/08. 28. Recommandations provisoires pour les évaluations pharmacoéconomiques en Belgique.
D2006/10.273/11. 29. Recommandations nationales Collège d’oncologie : A. cadre général pour un manuel
d’oncologie B. base scientifique pour itinéraires cliniques de diagnostic et traitement, cancer colorectal et cancer du testicule. D2006/10.273/13.
30. Inventaire des bases de données de soins de santé. D2006/10.273/15. 31. Health Technology Assessment : l’antigène prostatique spécifique (PSA) dans le dépistage du
cancer de la prostate. D2006/10.273/18. 32. Feedback: évaluation de l'impact et des barrières à l'implémentation - Rapport de recherche:
partie II. D2006/10.273/20. 33. Effets et coûts de la vaccination des enfants Belges au moyen du vaccin conjugué
antipneumococcique. D2006/10.273/22. 34. Trastuzumab pour les stades précoces du cancer du sein. D2006/10.273/24.
35. Etude relative aux coûts potentiels liés à une éventuelle modification des règles du droit de la responsabilité médicale – Phase III : affinement des estimations. D2006/10.273/27.
36. Traitement pharmacologique et chirurgical de l'obésité. Prise en charge résidentielle des enfants sévèrement obèses en Belgique. D/2006/10.273/29.
37. Health Technology Assessment Imagerie par Résonance Magnétique. D/2006/10.273/33. 38. Dépistage du cancer du col de l’utérus et recherche du Papillomavirus humain (HPV).
D/2006/10.273/36 39. Evaluation rapide de technologies émergentes s'appliquant à la colonne vertébrale :
remplacement de disque intervertébral et vertébro/cyphoplastie par ballonnet. D/2006/10.273/39.
40. Etat fonctionnel du patient: un instrument potentiel pour le remboursement de la kinésithérapie en Belgique? D/2006/10.273/41.
41. Indicateurs de qualité cliniques. D/2006/10.273/44. 42. Etude des disparités de la chirurgie élective en Belgique. D/2006/10.273/46. 43. Mise à jour de recommandations de bonne pratique existantes. D/2006/10.273/49. 44. Procédure d'évaluation des dispositifs médicaux émergeants. D/2006/10.273/51. 45. HTA Dépistage du Cancer Colorectal : état des lieux scientifique et impact budgétaire pour la
Belgique. D/2006/10.273/54. 46. Health Technology Assessment. Polysomnographie et monitoring à domicile des nourrissons
en prévention de la mort subite. D/2006/10.273/60. 47. L'utilisation des médicaments dans les maisons de repos et les maisons de repos et de soins
Belges. D/2006/10.273/62 48. Lombalgie chronique. D/2006/10.273/64. 49. Médicaments antiviraux en cas de grippe saisonnière et pandémique. Revue de littérature et
recommandations de bonne pratique. D/2006/10.273/66. 50. Contributions personnelles en matière de soins de santé en Belgique. L'impact des suppléments.
D/2006/10.273/69. 51. Besoin de soins chroniques des personnes âgées de 18 à 65 ans et atteintes de lésions
cérébrales acquises. D/2007/10.273/02. 52. Rapid Assessment: Prévention cardiovasculaire primaire dans la pratique du médecin
généraliste en Belgique. D/2007/10.273/04. 53. Financement des soins Infirmiers Hospitaliers. D/2007/10 273/06 54. Vaccination des nourrissons contre le rotavirus en Belgique. Analyse coût-efficacité 55. Valeur en termes de données probantes des informations écrites de l’industrie pharmaceutique
destinées aux médecins généralistes. D/2007/10.273/13 56. Matériel orthopédique en Belgique: Health Technology Assessment. D/2007/10.273/15. 57. Organisation et Financement de la Réadaptation Locomotrice et Neurologique en Belgique
D/2007/10.273/19 58. Le Défibrillateur Cardiaque Implantable.: un rapport d’évaluation de technologie de santé
D/2007/10.273/22 59. Analyse de biologie clinique en médecine général. D/2007/10.273/25 60. Tests de la fonction pulmonaire chez l'adulte. D/2007/10.273/28 61. Traitement de plaies par pression négative: une évaluation rapide. D/2007/10.273/31 62. Radiothérapie Conformationelle avec Modulation d’intensité (IMRT). D/2007/10.273/33. 63. Support scientifique du Collège d’Oncologie: un guideline pour la prise en charge du cancer du
sein. D/2007/10.273/36. 64. Vaccination HPV pour la prévention du cancer du col de l’utérus en Belgique: Health
Technology Assessment. D/2007/10.273/42. 65. Organisation et financement du diagnostic génétique en Belgique. D/2007/10.273/45. 66. Drug Eluting Stents en Belgique: Health Technology Assessment. D/2007/10.273/48. 67. Hadronthérapie. D/2007/10.273/51. 68. Indemnisation des dommages résultant de soins de santé - Phase IV : Clé de répartition entre
le Fonds et les assureurs. D/2007/10.273/53. 69. Assurance de Qualité pour le cancer du rectum – Phase 1: Recommandation de bonne
pratique pour la prise en charge du cancer rectal D/2007/10.273/55 70. Etude comparative des programmes d’accréditation hospitalière en Europe. D/2008/10.273/02 71. Recommandation de bonne pratique clinique pour cinq tests ophtalmiques. D/2008/10.273/05 72. L’offre de médecins en Belgique. Situation actuelle et défis. D/2008/10.273/08
73. Financement du programme de soins pour le patient gériatrique dans l’hôpital classique : Définition et évaluation du patient gériatrique, fonction de liaison et évaluation d’un instrument pour un financement approprié. D/2008/10.273/12
74. Oxygénothérapie Hyperbare: Rapid Assessment. D/2008/10.273/14. 75. Guideline pour la prise en charge du cancer oesophagien et gastrique: éléments scientifiques à
destination du Collège d’Oncologie. D/2008/10.273/17. 76. Promotion de la qualité de la médecine générale en Belgique: status quo ou quo vadis ?
D/2008/10.273/19. 77. Orthodontie chez les enfants et adolescents D/2008/10.273/21 78. Recommandations pour les évaluations pharmacoéconomiques en Belgique. D/2008/10.273/24. 79. Remboursement des radioisotopes en Belgique. D/2008/10.273/27. 80. Évaluation des effets du maximum à facturer sur la consommation et l’accessibilité financière
des soins de santé. D/2008/10.273/36. 81. Assurance de qualité pour le cancer rectal – phase 2: développement et test d’un ensemble
d’indicateurs de qualité. D/2008/10.273/39 82. Angiographie coronaire par tomodensitométrie 64-détecteurs chez les patients suspects de
maladie coronarienne. D/2008/10.273/41 83. Comparaison internationale des règles de remboursement et aspects légaux de la chirurgie
plastique D/2008/10.273/44 84. Les séjours psychiatriques de longue durée en lits T. D/2008/10.273/47 85. Comparaison de deux systèmes de financement des soins de première ligne en Belgique.
D/2008/10.273/50. 86. Différenciation de fonctions dans les soins infirmiers :possibilités et limites D/2008/10.273/53 87. Consommation de kinésithérapie et de médecine physique et de réadaptation en Belgique.
D/2008/10.273/55 88. Syndrome de Fatigue Chronique : diagnostic, traitement et organisation des soins.
D/2008/10.273/59. 89. Evaluation des certains nouveaux traitements du cancer de la prostate et de l’hypertrophie
bénigne de la prostate. D/2008/10.273/62 90. Médecine générale: comment promouvoir l’attraction et la rétention dans la profession ?
D/2008/10.273/64. 91. Appareils auditifs en Belgique: health technology assessment. D/2008/10.273/68 92. Les infections nosocomiales en Belgique : Volet I, Etude Nationale de Prévalence.
D/2008/10.273/71. 93. Détection des événements indésirables dans les bases de données administratives.
D/2008/10.273/74. 94. Soins maternels intensifs (Maternal Intensive Care) en Belgique. D/2008/10.273/78. 95. Implantation percutanée des valvules cardiaques dans le cas de maladies valvulaires congénitales
et dégénératives: A rapid Health Technology Assessment. D/2007/10.273/80. 96. Construction d’un index médical pour les contrats privés d’assurance maladie.
D/2008/10.273/83. 97. Centres de réadaptation ORL/PSY : groupes cibles, preuves scientifiques et organisation des
soins. D/2009/10.273/85. 98. Évaluation de programmes de vaccination généraux et ciblés contre l’hépatite A en Belgique.
D/2008/10.273/89. 99. Financement de l’hôpital de jour gériatrique. D/2008/10.273/91. 100. Valeurs seuils pour le rapport coût-efficacité en soins de santé. D/2008/10.273/95. 101. Enregistrement vidéo des interventions chirurgicales par endoscopie : une évaluation rapide.
D/2008/10.273/98. 102. Les infections nosocomiales en Belgique: Volet II: Impact sur la mortalité et sur les coûts.
D/2009/10.273/100. 103. Réformes dans l’organisation des soins de santé mentale : étude d’évaluation des ‘projets
thérapeutiques’ - 1er rapport intermédiaire. D/2009/10.273/05. 104. Chirurgie assistée par robot: health technology assessment. D/2009/10.273/08 105. Soutien scientifique au Collège d’Oncologie: recommandations pour la pratique clinique dans la
prise en charge du cancer du pancréas. D/2009/10.273/11 106. Imagerie par résonance magnétique : analyse de coûts. D/2009/10.273/15