Embed Size (px)
Citation preview
ARTICLE
Interactions between callose and cellulose revealedthrough the analysis of biopolymer mixturesRadwa H. Abou-Saleh1,2, Mercedes C. Hernandez-Gomez1, Sam Amsbury 1, Candelas Paniagua1,
Matthieu Bourdon3, Shunsuke Miyashima4, Ykä Helariutta 3, Martin Fuller1, Tatiana Budtova5,
Simon D. Connell 6, Michael E. Ries 7 & Yoselin Benitez-Alfonso 1
The properties of (1,3)-β-glucans (i.e., callose) remain largely unknown despite their
importance in plant development and defence. Here we use mixtures of (1,3)-β-glucan and
cellulose, in ionic liquid solution and hydrogels, as proxies to understand the physico-
mechanical properties of callose. We show that after callose addition the stiffness of cellulose
hydrogels is reduced at a greater extent than predicted from the ideal mixing rule (i.e., the
weighted average of the individual components’ properties). In contrast, yield behaviour after
the elastic limit is more ductile in cellulose-callose hydrogels compared with sudden failure in
100% cellulose hydrogels. The viscoelastic behaviour and the diffusion of the ions in mixed
ionic liquid solutions strongly indicate interactions between the polymers. Fourier-transform
infrared analysis suggests that these interactions impact cellulose organisation in hydrogels
and cell walls. We conclude that polymer interactions alter the properties of callose-cellulose
mixtures beyond what it is expected by ideal mixing.
DOI: 10.1038/s41467-018-06820-y OPEN
1 Centre for Plant Science, School of Biology, University of Leeds, Leeds LS2 9JT, UK. 2 Faculty of Science, Biophysics Division, Department of Physics,Mansoura University, Mansoura, Egypt. 3 The Sainsbury Laboratory, University of Cambridge, Bateman Street, Cambridge CB2 1LR, UK. 4Graduate School ofBiological Sciences, Nara Institute of Science and Technology, 8916-5 Takayama, Ikoma, Nara 630-0192, Japan. 5MINES ParisTech, Centre for MaterialForming (CEMEF), PSL Research University, UMR CNRS 7635, CS 10207, 06904 Sophia Antipolis, France. 6Molecular and Nanoscale Physics Group, Schoolof Physics and Astronomy, University of Leeds, Leeds LS2 9JT, UK. 7 Soft Matter Physics Research Group, School of Physics and Astronomy, University ofLeeds, Leeds LS2 9JT, UK. These authors contributed equally: Radwa H. Abou-Saleh, Mercedes C. Hernandez-Gomez. Correspondence and requests formaterials should be addressed to M.E.R. (email: [email protected]) or to Y.B.-A. (email: [email protected])
NATURE COMMUNICATIONS | (2018) 9:4538 | DOI: 10.1038/s41467-018-06820-y | www.nature.com/naturecommunications 1
1234
5678
90():,;
The cell wall of plant, bacteria and fungi are enriched with β-glucans which are essential for development and adapta-tion to a changing environment1,2. The physical and
mechanical properties of this diverse group of polysaccharides areapplied in industry to obtain many valuable products. Forexample, β-glucans cell wall biopolymers are used as raw mate-rials for paper, films and textiles, as gelling agents and naturalimmune stimulants in food and in pharmaceutical products3.They are also applied in the development of recent technologiessuch as tissue engineering, prosthetics and nanostructuredmaterials4,5. In the cell wall matrix, the composition and structureof β-glucans underpin plant growth and development6. Under-standing how these glycans are assembled, how they interact atthe molecular level, and the specific physical and mechanicalproperties they confer, is a major challenge due to the complex-ities of their natural systems. This knowledge could open a wholenew range of applications in biotechnology and in the design ofnew biodegradable materials.
Cellulose (a homopolymer of (1,4)-β-linked glucosyl residues)is the most abundant β-glucan polysaccharide, found in the cellwall of bacteria, algae, fungi and plants and even in urochordateanimals7. Due to numerous intra- and intermolecular hydrogenbonds and van der Waals interactions8 cellulose chains self-assemble into microfibrils which provide strength and determinesthe direction of cell growth through increasing the stiffness oftransverse cell walls. Interactions between cell wall polymersmodify the ordering, spacing or slippage between microfibrilsaffecting cell wall mechanics and thereby cell behaviour such asgrowth rate, shape, etc6,9,10. The interactions of cellulose withdiverse glycan polymers (including xyloglucans and xylans) havebeen reported but rarely validated in biological systems11–13. Theassociation of these macromolecules into a composite structure isdependent upon intermolecular bonding, hence stability dependson several factors including the polymer side-chains and thenumber and spatial configuration of these interactions14–16.
In contrast to cellulose, plant (1,3)-β-glucans (termed callose)are a minor component in developing cell walls but haveimportant regulatory functions in cell-to-cell signalling, organo-genesis and defence17,18. In normal unstressed conditions, calloseappears mainly deposited around intercellular junctions namedplasmodesmata19. Callose accumulation determines intercellularcommunication, affecting developmental and environmentalsignalling20. Callose also has important regulatory functions incell plate formation during cell division and in the sieve pores thatconnect the phloem vascular system21. It accumulates in responseto wounding and exposure to biotic and abiotic stresses playing akey role in defence22,23.
Despite its importance, the physical properties of callose and itsinteractions with other biopolymers within the cell wall matrixremain unknown. Most of the work in this area focuses on callosedeposited during pathogenic attacks or during pollen tubegrowth. Callose is thought to strengthen the cell wall forming aphysical barrier against fungal penetration24–26 and to act as amatrix for the deposition of other cell wall components27.Digestion of callose appears to reduce cell wall stiffness leading toan increase in the diameter of the pollen tube28,29. Conversely, amutant in a callose biosynthetic enzyme (named powdery mildewresistant 4, pmr4), shows reduced callose levels but appearsresistant to some fungal infections30. Pectin and cellulose dis-tribution also change after digestion of callose in pollen tubes28
but the molecular mechanism behind these changes and theirimplications for plant-pathogen interactions are not clear31.
Recent studies visualised a 3D network of callose-cellulosemicrofibrils forming in the site of fungal penetration32. Given theimportance of callose to regulate developmental and adaptiveprocesses it is imperative to clarify whether it can interact with
cellulose at the molecular level and what are the mechano-physical properties that derive from this interaction. New emer-ging reagents and tools can be used in dissecting this question,including ionic liquids, such as 1-ethyl-3-methylimidazoliumacetate ([C2mim][OAc]) which is a powerful solvent for celluloseand other water-insoluble polysaccharides33, and vectors carryinga hyperactive version of the biosynthetic enzyme callose synthase3 in an inducible system (icals3m)34, which produce an over-accumulation of callose in cellulosic cell walls.
In the current study, we use a combination of techniquesincluding: Atomic Force Microscopy (AFM) and nanoindentationanalysis; Scanning Electron Microscopy (SEM), liquid stateNuclear Magnetic Resonance (NMR); rheology and FourierTransform InfraRed (FTIR) spectroscopy to analyse the proper-ties of mixture solutions of microcrystalline cellulose and a calloseanalogue (Pachyman). The results unveil molecular interactionsbetween cellulose and callose in both the liquid solution and inhydrogels, forming systems with dynamics and mechanicalproperties that are not adequately described by a simple idealmixing rule, i.e., the mixtures properties are not just the weightedaverage of the individual component properties. We consider therelevance of these interactions in cell walls by comparing wildtype and transgenic plant material expressing icals3m. Based onthe results, we propose that interactions occur between calloseand cellulose that influence cell wall structure (and therebyproperties). The implications of these results for the regulation ofcell-to-cell communication and other biological processes arediscussed, as well as their potential applications for the design ofnew cellulosic biomaterials.
ResultsMechanical properties of cellulose-callose hydrogels. To gaininsight into how callose modulates the physico-mechanicalproperties of plant cell walls, we used a simplified model ofcomposite hydrogels, as reported elsewhere35. The samples weremade with different proportions of commercial microcrystallinecellulose and the callose analogue Pachyman dissolved in theionic liquid [C2mim][OAc] and coagulated in water (see detailsin the methods section). It should be noted that cellulose andcallose are insoluble in water, and thus when water is added totheir solutions in ionic liquid, phase separation occurs leading toa formation of a 3D network. We shall use the term hydrogel inthe following keeping in mind that the samples were precipitatedpolymer networks with water in the pores. Mixtures contained a10% total weight (wt.) of the polysaccharides with differentproportions of the individual polymers. These samples arereferred to as wt. percent of cellulose-callose in the mixtures. Purecellulose is labelled 0%, 20:80 is 20% callose, 50:50 is 50% callose,80:20 is 80% callose and pure callose is labelled as 100%. Theconcentration of callose in hydrogels was fluorescently quantifiedas described in the Methods36 in order to confirm that callose wasnot washed out during exchange of ionic liquid to water. Theresults showed that callose was not removed during solventexchange and its concentration in hydrogel is the same as in themixtures with cellulose (see Supplementary Fig. 1).
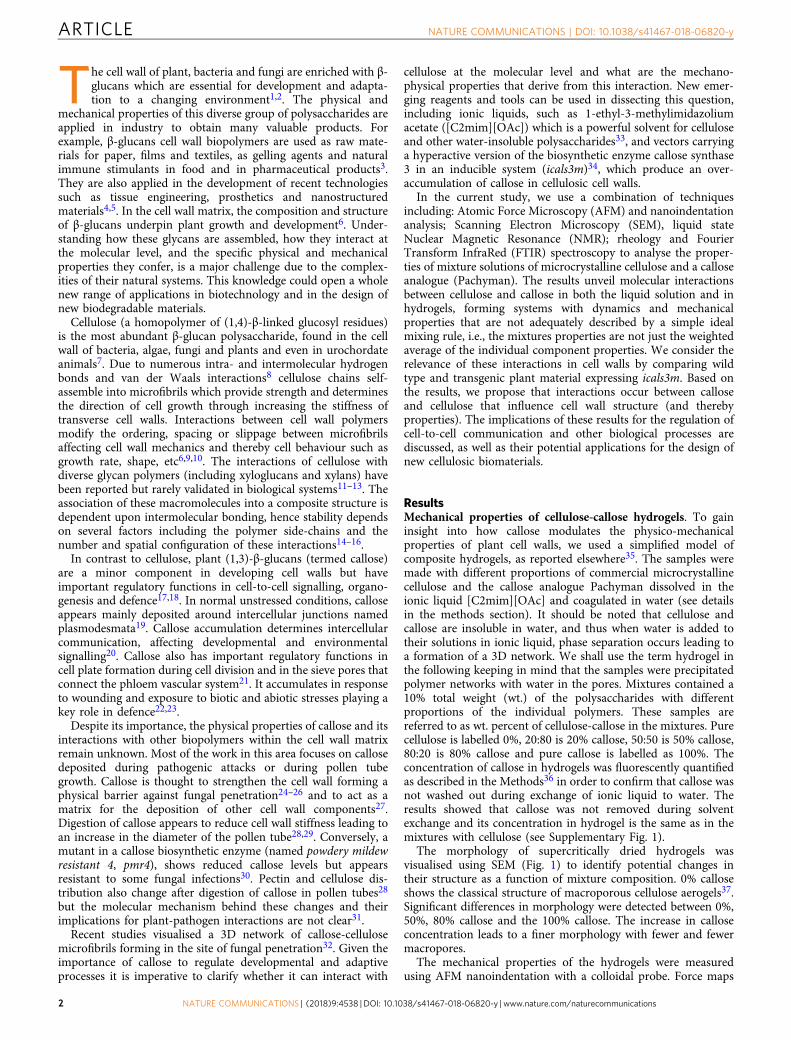
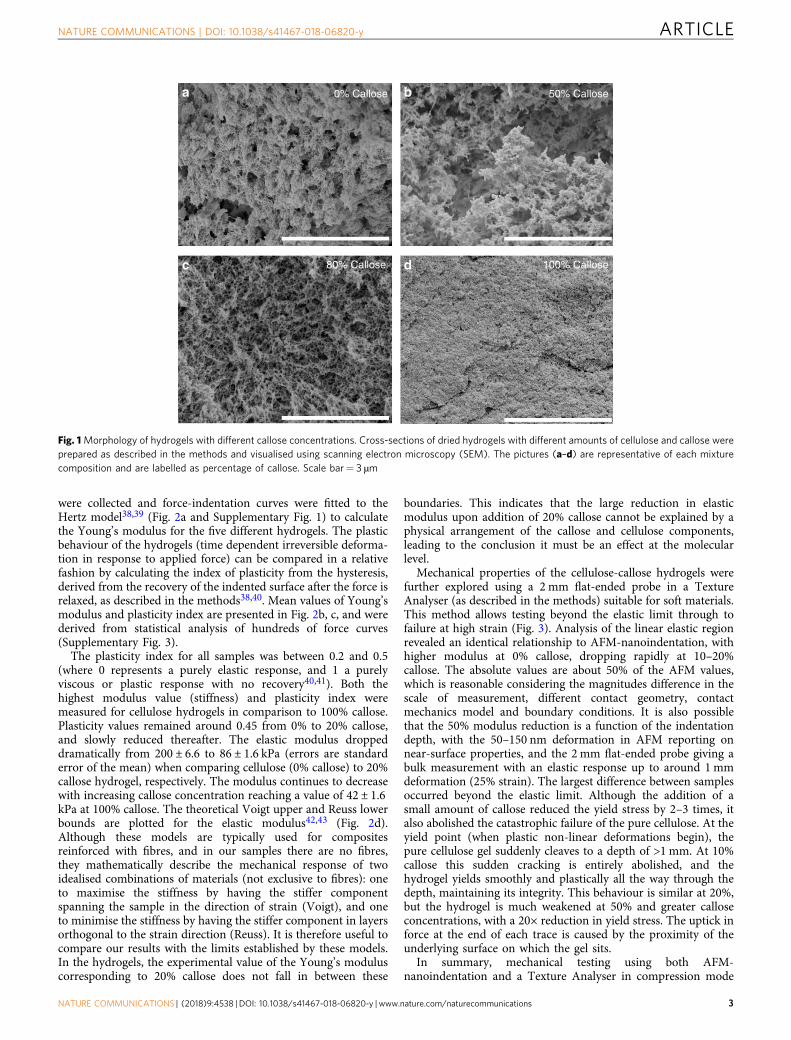
The morphology of supercritically dried hydrogels wasvisualised using SEM (Fig. 1) to identify potential changes intheir structure as a function of mixture composition. 0% calloseshows the classical structure of macroporous cellulose aerogels37.Significant differences in morphology were detected between 0%,50%, 80% callose and the 100% callose. The increase in calloseconcentration leads to a finer morphology with fewer and fewermacropores.
The mechanical properties of the hydrogels were measuredusing AFM nanoindentation with a colloidal probe. Force maps
ARTICLE NATURE COMMUNICATIONS | DOI: 10.1038/s41467-018-06820-y
2 NATURE COMMUNICATIONS | (2018) 9:4538 | DOI: 10.1038/s41467-018-06820-y | www.nature.com/naturecommunications
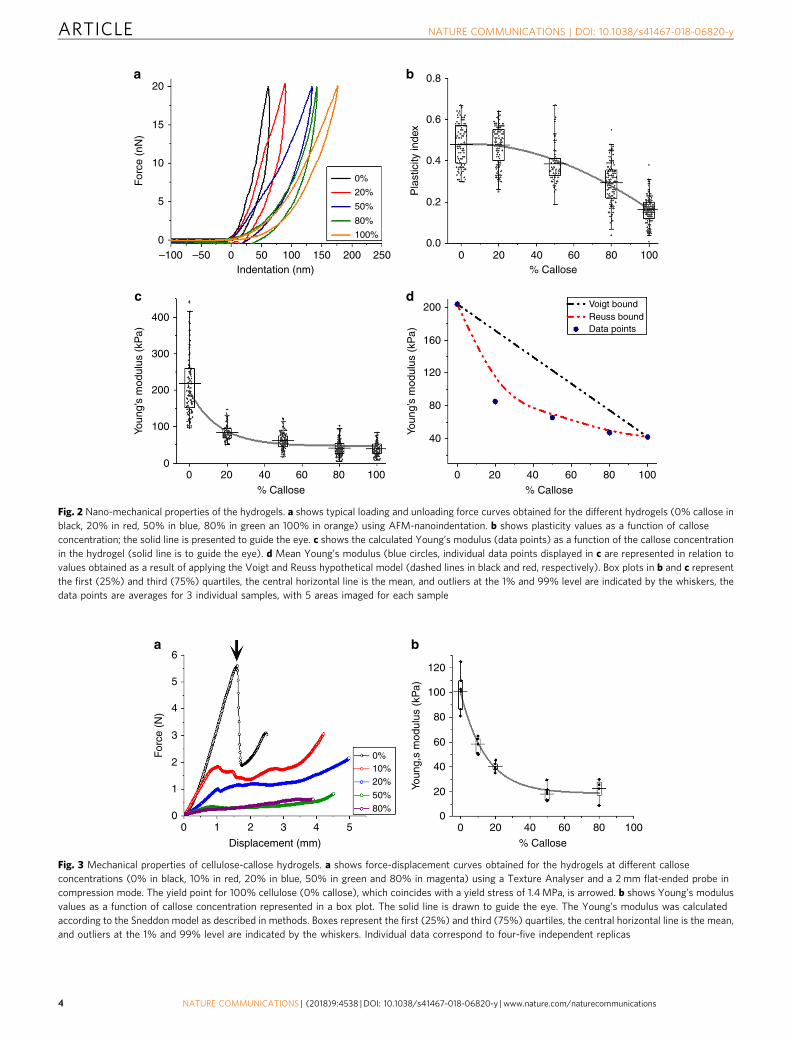
were collected and force-indentation curves were fitted to theHertz model38,39 (Fig. 2a and Supplementary Fig. 1) to calculatethe Young’s modulus for the five different hydrogels. The plasticbehaviour of the hydrogels (time dependent irreversible deforma-tion in response to applied force) can be compared in a relativefashion by calculating the index of plasticity from the hysteresis,derived from the recovery of the indented surface after the force isrelaxed, as described in the methods38,40. Mean values of Young’smodulus and plasticity index are presented in Fig. 2b, c, and werederived from statistical analysis of hundreds of force curves(Supplementary Fig. 3).
The plasticity index for all samples was between 0.2 and 0.5(where 0 represents a purely elastic response, and 1 a purelyviscous or plastic response with no recovery40,41). Both thehighest modulus value (stiffness) and plasticity index weremeasured for cellulose hydrogels in comparison to 100% callose.Plasticity values remained around 0.45 from 0% to 20% callose,and slowly reduced thereafter. The elastic modulus droppeddramatically from 200 ± 6.6 to 86 ± 1.6 kPa (errors are standarderror of the mean) when comparing cellulose (0% callose) to 20%callose hydrogel, respectively. The modulus continues to decreasewith increasing callose concentration reaching a value of 42 ± 1.6kPa at 100% callose. The theoretical Voigt upper and Reuss lowerbounds are plotted for the elastic modulus42,43 (Fig. 2d).Although these models are typically used for compositesreinforced with fibres, and in our samples there are no fibres,they mathematically describe the mechanical response of twoidealised combinations of materials (not exclusive to fibres): oneto maximise the stiffness by having the stiffer componentspanning the sample in the direction of strain (Voigt), and oneto minimise the stiffness by having the stiffer component in layersorthogonal to the strain direction (Reuss). It is therefore useful tocompare our results with the limits established by these models.In the hydrogels, the experimental value of the Young’s moduluscorresponding to 20% callose does not fall in between these
boundaries. This indicates that the large reduction in elasticmodulus upon addition of 20% callose cannot be explained by aphysical arrangement of the callose and cellulose components,leading to the conclusion it must be an effect at the molecularlevel.
Mechanical properties of the cellulose-callose hydrogels werefurther explored using a 2 mm flat-ended probe in a TextureAnalyser (as described in the methods) suitable for soft materials.This method allows testing beyond the elastic limit through tofailure at high strain (Fig. 3). Analysis of the linear elastic regionrevealed an identical relationship to AFM-nanoindentation, withhigher modulus at 0% callose, dropping rapidly at 10–20%callose. The absolute values are about 50% of the AFM values,which is reasonable considering the magnitudes difference in thescale of measurement, different contact geometry, contactmechanics model and boundary conditions. It is also possiblethat the 50% modulus reduction is a function of the indentationdepth, with the 50–150 nm deformation in AFM reporting onnear-surface properties, and the 2 mm flat-ended probe giving abulk measurement with an elastic response up to around 1 mmdeformation (25% strain). The largest difference between samplesoccurred beyond the elastic limit. Although the addition of asmall amount of callose reduced the yield stress by 2–3 times, italso abolished the catastrophic failure of the pure cellulose. At theyield point (when plastic non-linear deformations begin), thepure cellulose gel suddenly cleaves to a depth of >1 mm. At 10%callose this sudden cracking is entirely abolished, and thehydrogel yields smoothly and plastically all the way through thedepth, maintaining its integrity. This behaviour is similar at 20%,but the hydrogel is much weakened at 50% and greater calloseconcentrations, with a 20× reduction in yield stress. The uptick inforce at the end of each trace is caused by the proximity of theunderlying surface on which the gel sits.
In summary, mechanical testing using both AFM-nanoindentation and a Texture Analyser in compression mode
100% Callose80% Callose
50% Callose0% Callosea b
c d
Fig. 1Morphology of hydrogels with different callose concentrations. Cross-sections of dried hydrogels with different amounts of cellulose and callose wereprepared as described in the methods and visualised using scanning electron microscopy (SEM). The pictures (a–d) are representative of each mixturecomposition and are labelled as percentage of callose. Scale bar= 3 µm
NATURE COMMUNICATIONS | DOI: 10.1038/s41467-018-06820-y ARTICLE
NATURE COMMUNICATIONS | (2018) 9:4538 | DOI: 10.1038/s41467-018-06820-y | www.nature.com/naturecommunications 3
20a b
dc
15
10
5
0–100 –50 0 50 100 150 200 250
0%
20%
50%
80%
100%
Voigt boundReuss boundData points
0 20 40 60% CalloseIndentation (nm)
80 100
0 20 40 60% Callose
80 1000 20 40 60% Callose
80 100
400
300
200
100
0
200
160
120
80
40
0.8
0.6
0.4
Pla
stic
ity in
dex
Youn
g’s
mod
ulus
(kP
a)
Youn
g’s
mod
ulus
(kP
a)F
orce
(nN
)
0.2
0.0
Fig. 2 Nano-mechanical properties of the hydrogels. a shows typical loading and unloading force curves obtained for the different hydrogels (0% callose inblack, 20% in red, 50% in blue, 80% in green an 100% in orange) using AFM-nanoindentation. b shows plasticity values as a function of calloseconcentration; the solid line is presented to guide the eye. c shows the calculated Young’s modulus (data points) as a function of the callose concentrationin the hydrogel (solid line is to guide the eye). d Mean Young’s modulus (blue circles, individual data points displayed in c are represented in relation tovalues obtained as a result of applying the Voigt and Reuss hypothetical model (dashed lines in black and red, respectively). Box plots in b and c representthe first (25%) and third (75%) quartiles, the central horizontal line is the mean, and outliers at the 1% and 99% level are indicated by the whiskers, thedata points are averages for 3 individual samples, with 5 areas imaged for each sample
6a b
5
4
3
For
ce (
N)
Youn
g,s
mod
ulus
(kP
a)
2
1
00 1 2 3 4 5
0%10%20%
50%80%
0 20 40
% CalloseDisplacement (mm)
60 80 1000
20
40
60
80
100
120
Fig. 3 Mechanical properties of cellulose-callose hydrogels. a shows force-displacement curves obtained for the hydrogels at different calloseconcentrations (0% in black, 10% in red, 20% in blue, 50% in green and 80% in magenta) using a Texture Analyser and a 2 mm flat-ended probe incompression mode. The yield point for 100% cellulose (0% callose), which coincides with a yield stress of 1.4MPa, is arrowed. b shows Young’s modulusvalues as a function of callose concentration represented in a box plot. The solid line is drawn to guide the eye. The Young’s modulus was calculatedaccording to the Sneddon model as described in methods. Boxes represent the first (25%) and third (75%) quartiles, the central horizontal line is the mean,and outliers at the 1% and 99% level are indicated by the whiskers. Individual data correspond to four-five independent replicas
ARTICLE NATURE COMMUNICATIONS | DOI: 10.1038/s41467-018-06820-y
4 NATURE COMMUNICATIONS | (2018) 9:4538 | DOI: 10.1038/s41467-018-06820-y | www.nature.com/naturecommunications
indicates that the addition of a small amount of callose stronglyreduces the elastic modulus of the resultant hydrogels beyondwhat is predicted by the rule of mixtures (see Fig. 2d). Plasticity(and therefore the ability to absorb energy to cope withdeformations) is maintained in cellulose-callose hydrogels untilit drops at higher callose concentrations (Fig. 2b). The yieldbehaviour is also very different, with the pure cellulose gelallowing the stress to build up before the material catastrophicallyfails and breaks apart, whereas an addition of 10% callose allows asmooth yield and plastic deformation without a sudden failureevent. The results suggest that a small amount of callose disruptsthe cellulose network changing the hydrogel mechanical proper-ties, which points to potential microscopic interactions betweenthese two polymers. The yield behaviour might suggest that inter-molecular bonding is weakened such that the polymer chains canslide more easily and relieve the build-up of stress. Henceaddition of small amount of callose allows the material to be moreresilient to both high stress and strain which otherwise might leadto material failure.
Viscoelastic behaviour of cellulose-callose mixtures. Mechanicaltesting of the hydrogels shows a significant drop in plasticity atconcentrations >50% callose. The next step was to examine theviscoelastic properties of cellulose-callose mixtures in the liquidstate. The phase angle (δ) and storage (G’) and loss modulus (G”)of neat cellulose and callose solutions and of their mixtures arerepresented in Fig. 4; the complex modulus (G*) is shown inSupplementary Fig. 4.
The data suggest gel-like properties for the neat callose solutionas the phase angle remained almost independent of the frequency.This is also reflected by the overlap in the storage and lossmodulus at low frequency for 100% callose (Fig. 4b).
Steady state viscosity of the mixtures was measured as afunction of shear rate at different temperatures. Flow curvesdemonstrate mostly Newtonian behaviour and a very weak shearthinning, which is more pronounced for 100% callose solutions,likely as a consequence of high molecular weight chains’alignment in the flow (Supplementary Fig. 5). The Cross model(Eq. 1)44 was used to fit the data and calculate the viscosity of thesamples at zero shear rate:
η ¼ η0 þ η1αγn
1þ αγnð1Þ
where γ is shear rate, ƞ0 is zero shear rate viscosity, ƞ∞ is theviscosity at infinite shear rate, n is the flow index and α is theconsistency index.
The results show, as expected, that viscosity increased withdecreasing temperature for each system studied and, consistently,with the increase of callose concentration (Fig. 5). Interestingly, atall temperatures tested, values at 80% callose show lower viscositythan predicted by a simple ideal mixture rule, as it overlaps withthe ideal theoretical values for 50% callose (calculated as theaverage of the 0% and 100% ln η0 values) (Fig. 5b). On thecontrary, the experimental value of the zero shear rate viscosity ofthe mixture with 50% of callose is higher than ideal mixing ruleprediction. It is clear that there are structural reorganisations inthe mixtures with more than 50% of callose.
The activation energy of viscous flow was calculated using theArrhenius approach but no significant influence of mixturecomposition was detected across the entire concentration range,with values between 64.2 ± 1.8 kJ and 70.8 ± 9.6 kJ.
To summarise, the rheological analysis suggests gel-likeproperties for 10% wt. callose-ionic liquid solution. The viscosityof the 80% callose samples coincides with the experimental and
theoretical values for 50% callose suggesting that the mixtures donot obey the ideal mixing rule.
Liquid state 1H-NMR suggests cellulose-callose interactions.Molecular interactions between the two polymers could explainthe non-ideal mixing behaviour in the mechanical and viscoe-lastic properties of the mixes. To test this hypothesis, NMR wasused to determine the self-diffusion coefficients of the ions as afunction of composition of mixed solutions. The ions act as probemolecules in these systems. Their diffusion coefficients depend ontheir environment, which can be affected by the interactionsbetween the polymers. For cellulose, it has been shown that theions interact with the hydroxyl groups (not engaged in formingintra or inter–molecular hydrogen bonds between the polymers)and that this interaction reduces the diffusion coefficient of theions in solution45. If callose and cellulose interact, a change isexpected in the number of OH groups available for the ions tointeract with and thereby their diffusion coefficient to deviatefrom the ideal mixing rule, such as, for example, in the case of[C2mim][OAc] and water46.
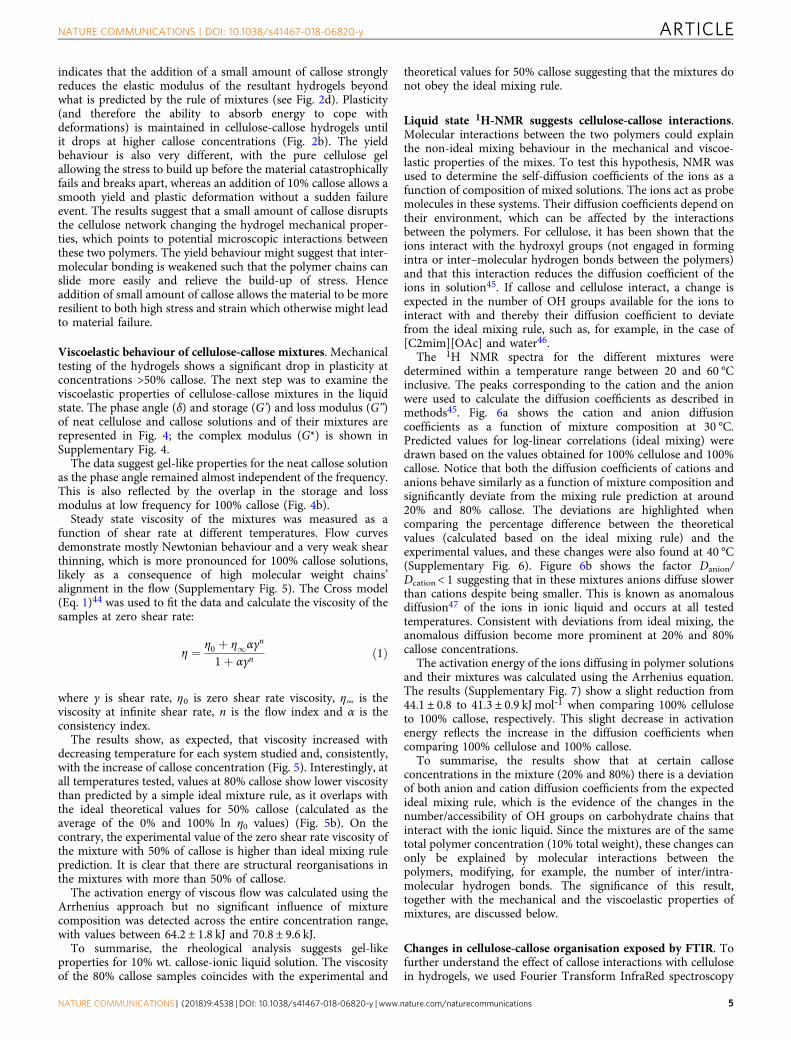
The 1H NMR spectra for the different mixtures weredetermined within a temperature range between 20 and 60 °Cinclusive. The peaks corresponding to the cation and the anionwere used to calculate the diffusion coefficients as described inmethods45. Fig. 6a shows the cation and anion diffusioncoefficients as a function of mixture composition at 30 °C.Predicted values for log-linear correlations (ideal mixing) weredrawn based on the values obtained for 100% cellulose and 100%callose. Notice that both the diffusion coefficients of cations andanions behave similarly as a function of mixture composition andsignificantly deviate from the mixing rule prediction at around20% and 80% callose. The deviations are highlighted whencomparing the percentage difference between the theoreticalvalues (calculated based on the ideal mixing rule) and theexperimental values, and these changes were also found at 40 °C(Supplementary Fig. 6). Figure 6b shows the factor Danion/Dcation < 1 suggesting that in these mixtures anions diffuse slowerthan cations despite being smaller. This is known as anomalousdiffusion47 of the ions in ionic liquid and occurs at all testedtemperatures. Consistent with deviations from ideal mixing, theanomalous diffusion become more prominent at 20% and 80%callose concentrations.
The activation energy of the ions diffusing in polymer solutionsand their mixtures was calculated using the Arrhenius equation.The results (Supplementary Fig. 7) show a slight reduction from44.1 ± 0.8 to 41.3 ± 0.9 kJ mol-1 when comparing 100% celluloseto 100% callose, respectively. This slight decrease in activationenergy reflects the increase in the diffusion coefficients whencomparing 100% cellulose and 100% callose.
To summarise, the results show that at certain calloseconcentrations in the mixture (20% and 80%) there is a deviationof both anion and cation diffusion coefficients from the expectedideal mixing rule, which is the evidence of the changes in thenumber/accessibility of OH groups on carbohydrate chains thatinteract with the ionic liquid. Since the mixtures are of the sametotal polymer concentration (10% total weight), these changes canonly be explained by molecular interactions between thepolymers, modifying, for example, the number of inter/intra-molecular hydrogen bonds. The significance of this result,together with the mechanical and the viscoelastic properties ofmixtures, are discussed below.
Changes in cellulose-callose organisation exposed by FTIR. Tofurther understand the effect of callose interactions with cellulosein hydrogels, we used Fourier Transform InfraRed spectroscopy
NATURE COMMUNICATIONS | DOI: 10.1038/s41467-018-06820-y ARTICLE
NATURE COMMUNICATIONS | (2018) 9:4538 | DOI: 10.1038/s41467-018-06820-y | www.nature.com/naturecommunications 5

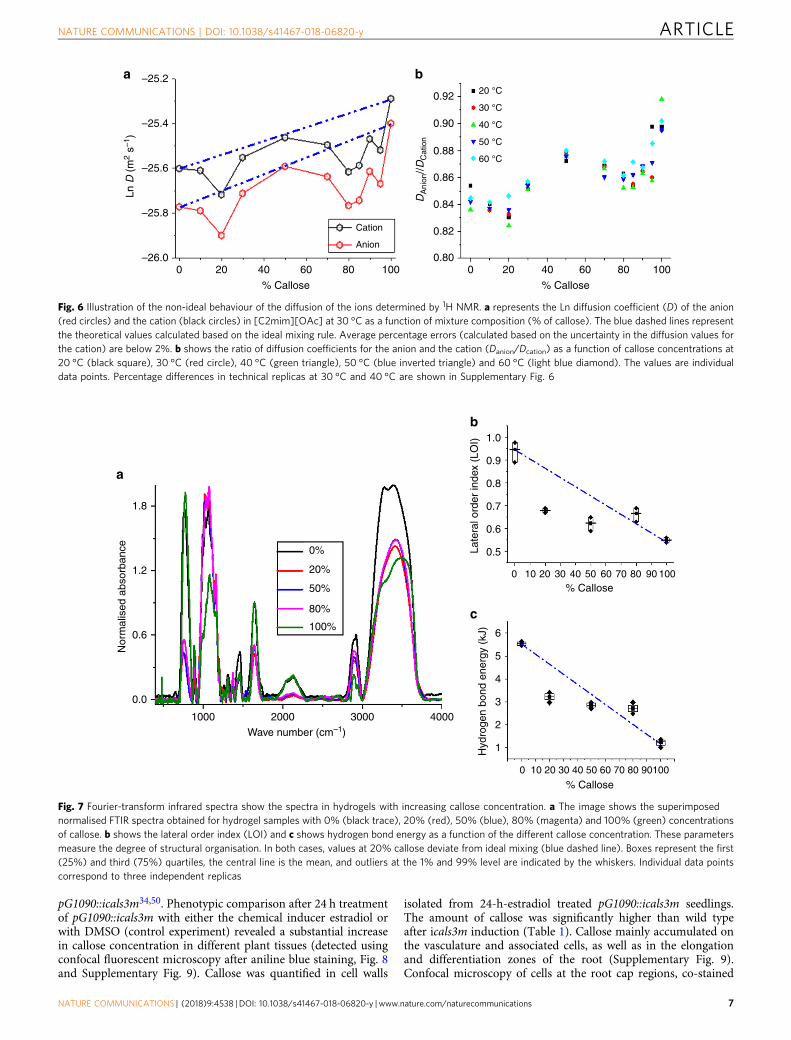
(FTIR) to analyse the spectra of the callose:cellulose mixtures(Fig. 7a). The spectra depicted main characteristic vibrationalbands corresponding to cellulose II which allow characterisationof polymer mixture ordering48. The peak positions for the rawpowders of microcrystalline cellulose (Avicel) and callose(Pachyman), as well as their 50% mixture were also obtained(Supplementary Fig. 8, Supplementary Table 1).
Significant differences were observed in the position of theOH- stretching vibration broad band (3100–3600 cm-1) thatinforms about the hydrogen bonding pattern48,49. Usinginformation from the spectra, the lateral order index (LOI, ratiobetween CH2 bending and C–O–C stretching absorption bands)and the energy of the hydrogen bond (EH) was calculated (seemethods and reference49) (Fig. 7b, c). It was found that thecellulose sample has the highest LOI (also known as crystallinityindex) and EH values which correlates with forming a higherorganised network in relation to callose. Both values decreasedwith the increase of callose concentration in hydrogel but
deviations from an ideal behaviour (linear correlation withconcentration, Fig. 7b) were significant at 20% callose. Thissuggests that addition of callose modifies cellulose structuringduring coagulation in a manner that affects the hydrogenbonding and the ordering of the polymer chains in the hydrogel.This result supports the interpretation of the results obtained byNMR.
Callose synthesis in A. thaliana modifies the FTIR profile.Callose co-exists with cellulose in specific plant cell wall domainsand cell types. To determine if callose concentration in plantamodifies cellulose organisation (as found in hydrogels) we used atransgenic tool to induce ectopic callose synthesis in seedlings ofArabidopsis thaliana. A vector containing an estradiol-dependentpromoter (pG1090:XVE) and a mutated hyperactive version of thecallose synthetic enzyme CALS3 (cals3m) was introduced intoArabidopsis thaliana to produce a stable transgenic line named
10,000
1000
100
10
1
0.1
0.11001010.120
30
40
50
60
70P
hase
ang
le (
°)
G′ &
G″
(Pa)
80
90
100a b
1
G ′ G ″
f (Hz)f (Hz)10
0%20%50%
80%100%
0%
20%
50%
80%
100%
100
0.01
Fig. 4 Viscoelastic properties of the cellulose-callose mixtures in ionic liquid solution at 25 °C. a represents changes in the phase angle (δ, open circles) asa function of frequency (f) for the five callose concentrations. b Changes in the viscous (G”, open squares) and elastic (G’, filled squares) components as afunction of frequency at different percentage (%) of callose in the mixtures. Graph elements in black correspond to 0% callose, in dark-red to 20%, orangeto 50%, blue to 80% and green to 100%. The arrows indicate the approximate frequency where G” and G’ overlap
a 6
5
4
Ln �
(P
a.s)
3
2
6
4
Ln �
(P
a.s)
2
10 20 40
% Callose
60 80 100 0.0030 0.0031 0.0032
1/T (K)
0.0033
0%20%50%80%100%
30 °C
40 °C
60 °C
50 °C
b
Fig. 5 Zero shear rate viscosity values as a function of callose concentration and temperature in the mixtures of ionic liquid solution. a shows the Ln of theviscosity (η) at the different callose percentage and within the temperature range 30-60 °C. A linear fitting (mixing rule) is presented in discontinuous linesin brown for 30 °C, blue for 40 °C, orange for 50 °C and green for 60 °C. The graph in b shows changes in the viscosity values as a function of temperatureat the different callose concentrations (%). The discontinuous pink line in b shows the theoretical values predicted for the 50% composition as calculatedusing the ideal mixing rule. Box plots represent the first (25%) and third (75%) quartiles, the central horizontal line is the mean, and outliers at the 1% and99% level are indicated by the whiskers. Individual data points for four-five independent replicas are shown, with between 20 and 40 repeat measurementsfor each concentration/temperature combination. Every individual data point is plotted at 80% transparency
ARTICLE NATURE COMMUNICATIONS | DOI: 10.1038/s41467-018-06820-y
6 NATURE COMMUNICATIONS | (2018) 9:4538 | DOI: 10.1038/s41467-018-06820-y | www.nature.com/naturecommunications
pG1090::icals3m34,50. Phenotypic comparison after 24 h treatmentof pG1090::icals3m with either the chemical inducer estradiol orwith DMSO (control experiment) revealed a substantial increasein callose concentration in different plant tissues (detected usingconfocal fluorescent microscopy after aniline blue staining, Fig. 8and Supplementary Fig. 9). Callose was quantified in cell walls
isolated from 24-h-estradiol treated pG1090::icals3m seedlings.The amount of callose was significantly higher than wild typeafter icals3m induction (Table 1). Callose mainly accumulated onthe vasculature and associated cells, as well as in the elongationand differentiation zones of the root (Supplementary Fig. 9).Confocal microscopy of cells at the root cap regions, co-stained
0.92
–25.2a b
–25.4
–25.6
Ln D
(m
2 s–1
)
–25.8
–26.0
20 °C
30 °C
40 °C
50 °C
60 °C
0.90
0.88
DA
nion
//DC
atio
n
0.86
0.84
0.82
0.800 20 40 60 80 1000 20 40
% Callose % Callose
60 80
Cation
Anion
100
Fig. 6 Illustration of the non-ideal behaviour of the diffusion of the ions determined by 1H NMR. a represents the Ln diffusion coefficient (D) of the anion(red circles) and the cation (black circles) in [C2mim][OAc] at 30 °C as a function of mixture composition (% of callose). The blue dashed lines representthe theoretical values calculated based on the ideal mixing rule. Average percentage errors (calculated based on the uncertainty in the diffusion values forthe cation) are below 2%. b shows the ratio of diffusion coefficients for the anion and the cation (Danion/Dcation) as a function of callose concentrations at20 °C (black square), 30 °C (red circle), 40 °C (green triangle), 50 °C (blue inverted triangle) and 60 °C (light blue diamond). The values are individualdata points. Percentage differences in technical replicas at 30 °C and 40 °C are shown in Supplementary Fig. 6
1.8
a
0%
20%
50%
80%
100%
1.2
0.6
0.0
Nor
mal
ised
abs
orba
nce
1000 2000 3000 4000
Wave number (cm–1)
1.0
6
5
4
3
2
1
b
c
0.9La
tera
l ord
er in
dex
(LO
I)H
ydro
gen
bond
ene
rgy
(kJ)
0.8
0.7
0.6
0.5
0 10 20 30 40 50 60 70 80 90 100% Callose
0 10 20 30 40 50 60 70 80 90100
% Callose
Fig. 7 Fourier-transform infrared spectra show the spectra in hydrogels with increasing callose concentration. a The image shows the superimposednormalised FTIR spectra obtained for hydrogel samples with 0% (black trace), 20% (red), 50% (blue), 80% (magenta) and 100% (green) concentrationsof callose. b shows the lateral order index (LOI) and c shows hydrogen bond energy as a function of the different callose concentration. These parametersmeasure the degree of structural organisation. In both cases, values at 20% callose deviate from ideal mixing (blue dashed line). Boxes represent the first(25%) and third (75%) quartiles, the central line is the mean, and outliers at the 1% and 99% level are indicated by the whiskers. Individual data pointscorrespond to three independent replicas
NATURE COMMUNICATIONS | DOI: 10.1038/s41467-018-06820-y ARTICLE
NATURE COMMUNICATIONS | (2018) 9:4538 | DOI: 10.1038/s41467-018-06820-y | www.nature.com/naturecommunications 7
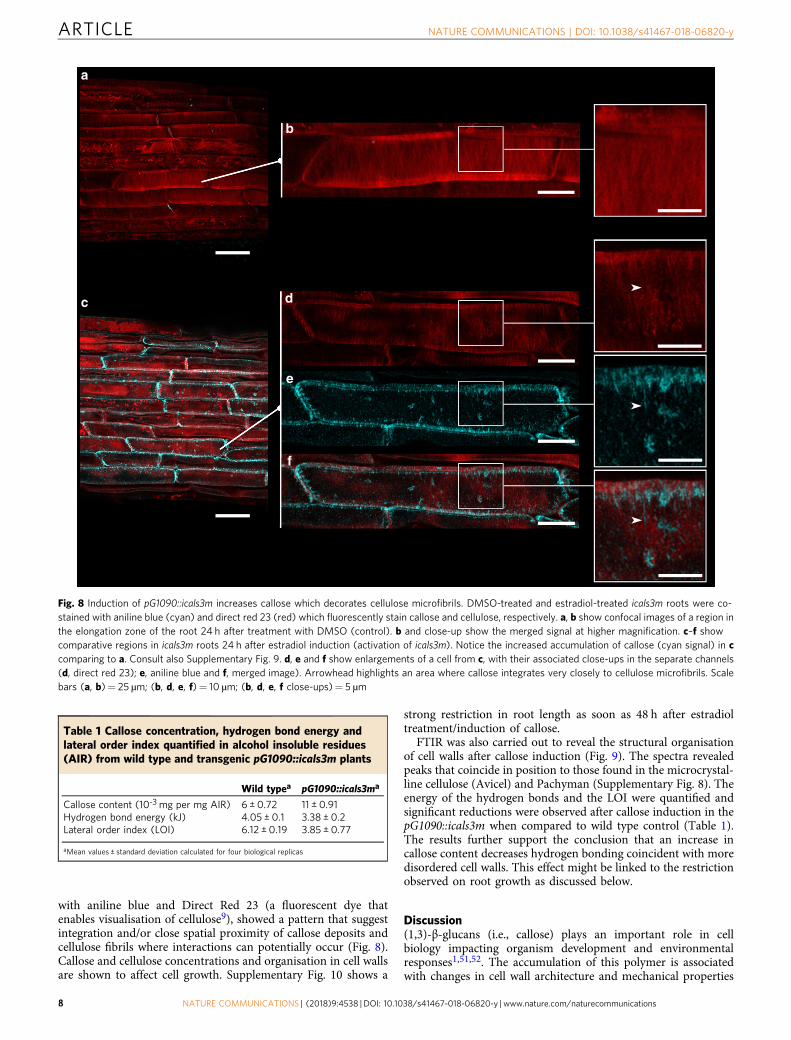
with aniline blue and Direct Red 23 (a fluorescent dye thatenables visualisation of cellulose9), showed a pattern that suggestintegration and/or close spatial proximity of callose deposits andcellulose fibrils where interactions can potentially occur (Fig. 8).Callose and cellulose concentrations and organisation in cell wallsare shown to affect cell growth. Supplementary Fig. 10 shows a
strong restriction in root length as soon as 48 h after estradioltreatment/induction of callose.
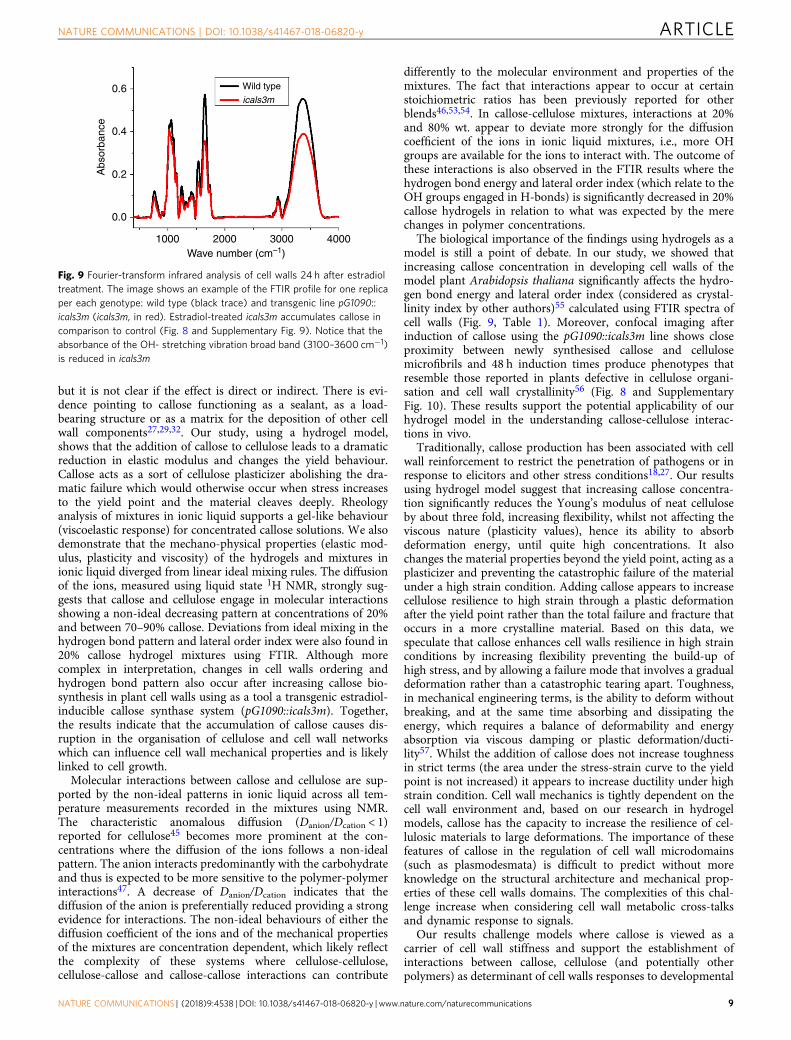
FTIR was also carried out to reveal the structural organisationof cell walls after callose induction (Fig. 9). The spectra revealedpeaks that coincide in position to those found in the microcrystal-line cellulose (Avicel) and Pachyman (Supplementary Fig. 8). Theenergy of the hydrogen bonds and the LOI were quantified andsignificant reductions were observed after callose induction in thepG1090::icals3m when compared to wild type control (Table 1).The results further support the conclusion that an increase incallose content decreases hydrogen bonding coincident with moredisordered cell walls. This effect might be linked to the restrictionobserved on root growth as discussed below.
Discussion(1,3)-β-glucans (i.e., callose) plays an important role in cellbiology impacting organism development and environmentalresponses1,51,52. The accumulation of this polymer is associatedwith changes in cell wall architecture and mechanical properties
d
e
f
b
c
a
Fig. 8 Induction of pG1090::icals3m increases callose which decorates cellulose microfibrils. DMSO-treated and estradiol-treated icals3m roots were co-stained with aniline blue (cyan) and direct red 23 (red) which fluorescently stain callose and cellulose, respectively. a, b show confocal images of a region inthe elongation zone of the root 24 h after treatment with DMSO (control). b and close-up show the merged signal at higher magnification. c–f showcomparative regions in icals3m roots 24 h after estradiol induction (activation of icals3m). Notice the increased accumulation of callose (cyan signal) in ccomparing to a. Consult also Supplementary Fig. 9. d, e and f show enlargements of a cell from c, with their associated close-ups in the separate channels(d, direct red 23); e, aniline blue and f, merged image). Arrowhead highlights an area where callose integrates very closely to cellulose microfibrils. Scalebars (a, b)= 25 µm; (b, d, e, f)= 10 µm; (b, d, e, f close-ups)= 5 µm
Table 1 Callose concentration, hydrogen bond energy andlateral order index quantified in alcohol insoluble residues(AIR) from wild type and transgenic pG1090::icals3m plants
Wild typea pG1090::icals3ma
Callose content (10-3 mg per mg AIR) 6 ± 0.72 11 ± 0.91Hydrogen bond energy (kJ) 4.05 ± 0.1 3.38 ± 0.2Lateral order index (LOI) 6.12 ± 0.19 3.85 ± 0.77
aMean values ± standard deviation calculated for four biological replicas
ARTICLE NATURE COMMUNICATIONS | DOI: 10.1038/s41467-018-06820-y
8 NATURE COMMUNICATIONS | (2018) 9:4538 | DOI: 10.1038/s41467-018-06820-y | www.nature.com/naturecommunications
but it is not clear if the effect is direct or indirect. There is evi-dence pointing to callose functioning as a sealant, as a load-bearing structure or as a matrix for the deposition of other cellwall components27,29,32. Our study, using a hydrogel model,shows that the addition of callose to cellulose leads to a dramaticreduction in elastic modulus and changes the yield behaviour.Callose acts as a sort of cellulose plasticizer abolishing the dra-matic failure which would otherwise occur when stress increasesto the yield point and the material cleaves deeply. Rheologyanalysis of mixtures in ionic liquid supports a gel-like behaviour(viscoelastic response) for concentrated callose solutions. We alsodemonstrate that the mechano-physical properties (elastic mod-ulus, plasticity and viscosity) of the hydrogels and mixtures inionic liquid diverged from linear ideal mixing rules. The diffusionof the ions, measured using liquid state 1H NMR, strongly sug-gests that callose and cellulose engage in molecular interactionsshowing a non-ideal decreasing pattern at concentrations of 20%and between 70–90% callose. Deviations from ideal mixing in thehydrogen bond pattern and lateral order index were also found in20% callose hydrogel mixtures using FTIR. Although morecomplex in interpretation, changes in cell walls ordering andhydrogen bond pattern also occur after increasing callose bio-synthesis in plant cell walls using as a tool a transgenic estradiol-inducible callose synthase system (pG1090::icals3m). Together,the results indicate that the accumulation of callose causes dis-ruption in the organisation of cellulose and cell wall networkswhich can influence cell wall mechanical properties and is likelylinked to cell growth.
Molecular interactions between callose and cellulose are sup-ported by the non-ideal patterns in ionic liquid across all tem-perature measurements recorded in the mixtures using NMR.The characteristic anomalous diffusion (Danion/Dcation < 1)reported for cellulose45 becomes more prominent at the con-centrations where the diffusion of the ions follows a non-idealpattern. The anion interacts predominantly with the carbohydrateand thus is expected to be more sensitive to the polymer-polymerinteractions47. A decrease of Danion/Dcation indicates that thediffusion of the anion is preferentially reduced providing a strongevidence for interactions. The non-ideal behaviours of either thediffusion coefficient of the ions and of the mechanical propertiesof the mixtures are concentration dependent, which likely reflectthe complexity of these systems where cellulose-cellulose,cellulose-callose and callose-callose interactions can contribute
differently to the molecular environment and properties of themixtures. The fact that interactions appear to occur at certainstoichiometric ratios has been previously reported for otherblends46,53,54. In callose-cellulose mixtures, interactions at 20%and 80% wt. appear to deviate more strongly for the diffusioncoefficient of the ions in ionic liquid mixtures, i.e., more OHgroups are available for the ions to interact with. The outcome ofthese interactions is also observed in the FTIR results where thehydrogen bond energy and lateral order index (which relate to theOH groups engaged in H-bonds) is significantly decreased in 20%callose hydrogels in relation to what was expected by the merechanges in polymer concentrations.
The biological importance of the findings using hydrogels as amodel is still a point of debate. In our study, we showed thatincreasing callose concentration in developing cell walls of themodel plant Arabidopsis thaliana significantly affects the hydro-gen bond energy and lateral order index (considered as crystal-linity index by other authors)55 calculated using FTIR spectra ofcell walls (Fig. 9, Table 1). Moreover, confocal imaging afterinduction of callose using the pG1090::icals3m line shows closeproximity between newly synthesised callose and cellulosemicrofibrils and 48 h induction times produce phenotypes thatresemble those reported in plants defective in cellulose organi-sation and cell wall crystallinity56 (Fig. 8 and SupplementaryFig. 10). These results support the potential applicability of ourhydrogel model in the understanding callose-cellulose interac-tions in vivo.
Traditionally, callose production has been associated with cellwall reinforcement to restrict the penetration of pathogens or inresponse to elicitors and other stress conditions18,27. Our resultsusing hydrogel model suggest that increasing callose concentra-tion significantly reduces the Young’s modulus of neat celluloseby about three fold, increasing flexibility, whilst not affecting theviscous nature (plasticity values), hence its ability to absorbdeformation energy, until quite high concentrations. It alsochanges the material properties beyond the yield point, acting as aplasticizer and preventing the catastrophic failure of the materialunder a high strain condition. Adding callose appears to increasecellulose resilience to high strain through a plastic deformationafter the yield point rather than the total failure and fracture thatoccurs in a more crystalline material. Based on this data, wespeculate that callose enhances cell walls resilience in high strainconditions by increasing flexibility preventing the build-up ofhigh stress, and by allowing a failure mode that involves a gradualdeformation rather than a catastrophic tearing apart. Toughness,in mechanical engineering terms, is the ability to deform withoutbreaking, and at the same time absorbing and dissipating theenergy, which requires a balance of deformability and energyabsorption via viscous damping or plastic deformation/ducti-lity57. Whilst the addition of callose does not increase toughnessin strict terms (the area under the stress-strain curve to the yieldpoint is not increased) it appears to increase ductility under highstrain condition. Cell wall mechanics is tightly dependent on thecell wall environment and, based on our research in hydrogelmodels, callose has the capacity to increase the resilience of cel-lulosic materials to large deformations. The importance of thesefeatures of callose in the regulation of cell wall microdomains(such as plasmodesmata) is difficult to predict without moreknowledge on the structural architecture and mechanical prop-erties of these cell walls domains. The complexities of this chal-lenge increase when considering cell wall metabolic cross-talksand dynamic response to signals.
Our results challenge models where callose is viewed as acarrier of cell wall stiffness and support the establishment ofinteractions between callose, cellulose (and potentially otherpolymers) as determinant of cell walls responses to developmental
1000
0.0
0.2
0.4
Abs
orba
nce
0.6
2000
Wild type
icals3m
Wave number (cm–1)3000 4000
Fig. 9 Fourier-transform infrared analysis of cell walls 24 h after estradioltreatment. The image shows an example of the FTIR profile for one replicaper each genotype: wild type (black trace) and transgenic line pG1090::icals3m (icals3m, in red). Estradiol-treated icals3m accumulates callose incomparison to control (Fig. 8 and Supplementary Fig. 9). Notice that theabsorbance of the OH- stretching vibration broad band (3100–3600 cm−1)is reduced in icals3m
NATURE COMMUNICATIONS | DOI: 10.1038/s41467-018-06820-y ARTICLE
NATURE COMMUNICATIONS | (2018) 9:4538 | DOI: 10.1038/s41467-018-06820-y | www.nature.com/naturecommunications 9
and environmental signals. It also highlights the importance ofconsidering cell wall composition and dynamics and how theseaffect callose biological function. More studies are required todissect callose properties and potential role as cellulose modifierin cell walls. From the material science perspective, the interac-tions between callose and cellulose, exposed by this research, openthe path for the development of new applications for this naturalbiopolymer to create, for example, composites that can be used asbiodegradable substitutes for other less environmentally friendlypolymers.
MethodsMaterials. Microcrystalline cellulose Avicel PH-101, the ionic liquid 1-ethyl-3-methyl-imidazolium acetate ([C2mim][OAc]) (97% purity), FTIR grade KBr,ethanol (absolute, ≥99.8%), acetone (≥99.9%), methanol (≥99.9%) and chloroform(≥99%) were all obtained from Sigma Aldrich. Callose commercial analogue, the(1–3)-β-D-glucan Pachyman and aniline blue fluorochrome were obtained fromBiosupplies Australia (www.biosupplies.com.au). The molecular weight of AvicelPH-101 is 28 400 g mol−158 whereas of Pachyman it is as 168,000 g mol-159. Themolecular weight distribution of Avicel PH-101, as well as polydispersity andcrystallinity index were reported elsewhere60,61. Molecular weight and otherproperties (such as polydispersity, flexibility and conformation of polymers) werealso reported elsewhere for Pachyman62.
All plant work used Arabidopsis thaliana in the Columbia (Col-0) background.Transgenic pG1090::icals3m was generated by Agrobacterium-mediatedtransformation of Arabidopsis plants with a vector containing a hyperactive callosesynthase mutant version (cals3m) under the control of a β-estradiol induciblepG1090 promoter50. In this transgenic line, callose amount is significantly higher6–24 h after exposure to β-estradiol in comparison to wild type subjected to thesame conditions. Wild type and transgenic seeds were surfaced sterilised in bleachsolution (20% thin bleach, 0.01% tween-20) for 10 min and stratified in the dark at4 °C for 5 days. Seeds were germinated on ½ Murashige and Skoog (MS) mediumplates containing 0.22% Murashige and Skoog basal medium (Sigma Aldrich), 1%sucrose (Sigma Aldrich), 0.8% plant agar (Sigma Aldrich) and grown under longday conditions (16 h photoperiod) at a constant temperature of 20 °C. Ten day oldpG1090::icals3m seedlings were transferred for induction to ½ MS platessupplemented with 10 μM β-estradiol (Sigma Aldrich, diluted from a stock solutionin DMSO). Control experiments (with basal/non-induced amount of callose) wereperformed by exposing pG1090::icals3m to the corresponding solvent (DMSO)concentration or by transferring wild type seedlings to 10 μM β-estradiol. Plantswere analysed or harvested at different times after transfer as indicated in Results.For FTIR analysis, plants were collected 24 h post-transfer and flash-frozen inliquid nitrogen to stop metabolic activity before undergoing freeze drying.
Preparation of ionic liquid mixtures. Callose was milled at 50 Hz for 2 min in aTissueLyser LT (Qiagen, Hilden, Germany) to break agglomerations formed due toambient humidity. Cellulose and callose were then dried in a vacuum oven at 50 °Cfor 2 days prior to preparing the mixes. Five different samples were prepared withconcentrations of 0, 20, 50, 80 and 100% callose, all at a final concentration of 10 wt% of total carbohydrate weight in [C2mim][OAc]. First, dry polymers were mixedin the proportions mentioned above and then the mixed powders were dissolved inionic liquid. All solutions were prepared in an MBraun Labmaster 130 atmosphericchamber under nitrogen, providing a dry environment, with the chamber beingmaintained at a dew point level between −70 and −40 °C. The [C2mim][OAc] andcallose/cellulose were mixed and kept on magnetic stirrer at 50 °C until producingclear solutions. All samples were kept sealed when not in use to prevent anymoisture contamination.
Hydrogel preparation and callose quantification. The mixtures were hydrated toform hydrogels by adding deionised water, which was renewed every few hours inthe course of two days until full removal of the ionic liquid.
The percentage of callose in the hydrogels was determined using aniline blue.The fluorochrome produces a signal directly proportional to (1,3)-β-glucanconcentration that can be measured using a fluorescence microscope and/orfluorometer. For confocal imaging, hydrogel samples were cut into 3 × 3 × 1 mmsections and incubated for 30 min at room temperature in 1 ml of staining solutioncontaining 25 mgml−1 of aniline blue fluorochrome in distilled water. Stainedsamples were washed with 3 changes of distilled water (5 min per change) andmounted on microscope slides. Samples were imaged on a Zeiss LSM880 Uprightconfocal microscope (Zeiss, Cambridge, UK) using a ×40 objective with 405 nmexcitation and 450 nm emission. Imaging settings (pinhole, gain, etc.) were keptconstant in all images.
For fluorometric quantification, hydrogels were freeze dried, then ground usinga TissueLyser LT (Qiagen, Hilden, Germany). 0.2 mg of the powder was incubatedin 200 µl of 1 M NaOH at 80 °C for 30 min then centrifuged at 11,336×g for 15 minto remove any undissolved material. The supernatant was added to 1.25 ml ofaniline blue staining solution (0.25 M glycine, pH 9 with 2.25% aniline blue) and
incubated for 20 min at 50 °C followed by 30 min at room temperature. 200 µl ofsample was aliquoted to a dark multiwell plate and fluorescence was assayed at 405nm excitation, 512 nm emission using a POLARstar OPTIMA microplate reader(BMG labtech, Ortenberg, Germany).
A calibration curve was created using different starting weights (0.05, 0.1, 0.15and 0.25 mg) of callose (powder obtained from the 100% callose hydrogel).Changes in fluorescence values in relation to callose weight (mg) were representedto generate a linear regression curve. This was used to calculate callose content ineach of the hydrogels as described above.
Characterisation of hydrogels using SEM. Hydrogels were fixed for 2 h in 2.5%glutaraldehyde in 0.1 M phosphate buffer, then washed twice in 0.1 M phosphatebuffer for 30 min each. They were then incubated with 1% osmium tetroxide in 0.1M phosphate buffer overnight. Gels were dehydrated using an ascending acetoneseries (20–40–60–80–100%) for 30 min each change, followed by critical pointdrying with a Polaron E3000 apparatus using carbon dioxide.
The specimens were then mounted on 13 mm diameter pin stubs using doublesided adhesive carbon tape tabs. These were then coated with platinum to athickness of 5 nm using a Cressington 208 h high resolution sputter coating unit.Images were then obtained using a FEI Quanta 200 F FEGESEM (field emissiongun environmental scanning electron microscope).
AFM-nanoindentation analysis. AFM coupled with a colloidal probe was used toprobe the mechanical properties of the hydrogels. A few drops of cellulose-callosemixtures in ionic liquid were placed in an O-ring fixed on a glass slide, and then thewhole slide was immersed in a petri dish with methanol for 5 h with continuousexchange of methanol every 30 min. When the alcogel disc was formed, it was thenplaced in an eppendorf tube filled with deionised water to exchange the methanolfor water. The samples were stored in water for a minimum of one day, and usuallytwo days, to ensure complete exchange. This was important as even residualswelling at rates of nanometres per second would take the sample surface beyondthe limited z-range of the AFM scanners with the long acquisition times of theforce spectroscopy maps. In preparation for the AFM, the hydrogels were brieflyplaced onto a filter paper to remove excess water on the underside only and thenglued on a glass slide using two-part epoxy.
An Asylum Research MFP-3D AFM (Asylum Research, Santa Barbara, CA,USA) and a PNP-TR silicon nitride cantilever with polystyrene colloidal probe(SQube, Surface Science Support, Germany) with diameter of 1.98 μm was used formeasuring the elastic modulus of the hydrogels. The cantilever was calibrated forsensitivity and spring constant before starting any measurement. The springconstant was calibrated in water using the thermal tuning method63 giving 0.09 Nm-1. The gel disc for each sample was prepared twice and for each sample forcevolumes were collected on an average of 5 different areas of the gel. An average of 5Force maps (20 × 20 μm) were acquired for each sample on different areas, witheach force volume map providing 400 individual force measurements. The loadingvelocity was fixed to 1 µm s−1, ramp size of 1 μm and a maximum applied load of20 nN. For all samples, the same probe was used and all the parameters were keptconstant. Between experiments the cantilever was rinsed with Isopropanol, thenozone cleaning was performed to ensure the colloidal probe is not contaminated.
The Hertz model was used for calculating a Young’s modulus E of thehydrogels. This models a sphere indenting a flat plane, the exact geometry of oursystem. The force F applied is given by:
F ¼ 4EffiffiffiR
p
3 1� αð Þ ;3=2 ð2Þ
where Φ is the indentation depth of the colloidal probe into the hydrogel, α is thePoisson ratio of the hydrogel (here estimated ≈ 0.35) and R is the radius of theprobe sphere. The proprietary AFM (Asylum Research) software was used to fit theHertz model to the first 20% indentation only (Supplementary Fig. 2, black trace onthe force curve around the contact area).
The viscoelastic properties have been calculated from the hysteresis betweenloading and unloading for all samples, which is related to the dissipation of energyduring sample deformation. The plastic behaviour of the hydrogel can bequantified by calculating the plasticity factor (P) from the ratio between the areasunder the unloading (Au) and loading curves (AL) as given by Eq. 3 which reflectsthe relative plastic/elastic behaviour of the material under force40,41,64
P ¼ 1� Au
AL
� �ð3Þ
For purely elastic samples, where the matter recovers immediately andelastically after indentation, the loading and unloading curves overlap and the twoareas are equal (AU= AL), there is no hysteresis and P= 0. In contrast, P= 1indicates fully plastic properties where the area under the unloading curve is zero,and the deformation of the hydrogel remains constant when the load is removed,meaning it has been plastically deformed over a timescale of seconds (it mightrecover at longer time scales).
ARTICLE NATURE COMMUNICATIONS | DOI: 10.1038/s41467-018-06820-y
10 NATURE COMMUNICATIONS | (2018) 9:4538 | DOI: 10.1038/s41467-018-06820-y | www.nature.com/naturecommunications
Macro-indentation measurement. Cellulose-callose mixtures in ionic liquid wereproduced and rehydrated similarly as described above for AFM disc-hydrogels buton a larger scale. 2 ml of cellulose-callose mixtures in ionic liquid were prepared in5 ml vials and then immersed in methanol for 5 h with continuous exchange ofmethanol every 30 min. The samples were then incubated in deionized water for24 h. Hydrogel discs of 10 mm diameter were cut out with a hole borer, thethickness of the gels was approximately 4 mm. 100% callose hydrogels could not bemade by the method. The hydrogel discs were glued onto a petri dishes using two-part epoxy and measurements (force-distance) were performed with a TA-TX2Texture Analyser (stable Micro Systems, Surrey, UK) in compression modeequipped with a flat-bottomed probe of 2.0 mm diameter65. Indentation was straincontrolled to an indentation depth of around 80% of the full sample depth. The rawforce-distance values were exported and analysed. Young’s modulus was calculatedaccording to the Sneddon model66, which is suitable for deep indentation into softmaterials that conform to the indenter probe geometry. The Elastic modulus (E)was obtained using the following Eq. (4)
E ¼pπ
2� S � ð1� ν2Þffiffiffiffi
Ap ð4Þ
where A is the contact area, ν is the Poisson ratio (0.3) and S is the stiffnesscalculated by δP
δh, where P is the indenter load and h is the displacement of theindenter.
Rheological measurements. Rheological measurements of the neat solutions andof cellulose/callose mixtures in [C2mim][OAc] were performed on Kinexus rhe-ometer (Malvern Instrument Ltd., Worcestershire, England, UK), equipped withcone-plate geometry (40–40 mm) with 2 mm gap and a temperature controlledsystem. Viscoelastic spectra of the samples (elastic component, G’, viscous com-ponent, G”, and phase angle δ) were detected with the oscillation frequency sweepmethod, within a frequency range 0.01–100 Hz, at 25 °C. For a pure elastic material(solid-like behaviour) the stress and strain are in phase with each other resulting inδ= 0, but for a pure viscous material (liquid-like behaviour) the stress and strainare out of phase67 with δ= 900.
Steady state viscosity of each sample was measured using the same rheometer atincreasing shear rate in the range of 0.01–100 s-1 across the temperature range30–60 °C, in 10 °C increments.
The activation energy was calculated using the Arrhenius equation (Eq. 5),where ηa is the zero shear rate viscosity, A is a constant, R is the universal gasconstant (8.314 J mol−1 K−1) and T is temperature in K.
ηa ¼ Ae �EaRTð Þ ð5Þ
Pulsed-field gradient 1H NMR spectroscopy. The cation [C2mim]+ and anion[OAc]− self-diffusion coefficients were measured as described elsewhere45 bypulsed-field gradient 1H NMR, using an Avance II NMR Spectrometer (BrukerBiospin) with a 1H resonance frequency of 400MHz. The measurements werecarried out in a Diff50 diffusion probe (Bruker Biospin), which can generate a fieldgradient of up to 20 T m−1. Before each measurement the calibration of the gra-dient field strength was confirmed by determining the diffusion coefficient of waterat 20.0 ± 0.1 °C, this has the value of (2.03 ± 0.01) × 10−9 m2 s−1. The sampleenvironment temperature was also confirmed, by experimentally determiningthe temperature dependence of the diffusion coefficient for water and comparingthose results to data published by Holz et al.6 To reduce the effect of convection onour results we followed the advice of Annat et al.6 by keeping NMR tube sampledepths to less than 1 cm. The uncertainty in the obtained diffusion coefficients isestimated to be less than 3%. A stimulated echo pulse sequence with bipolargradients was used, in which the attenuation of the signal intensity follows thefollowing Eq. 670:
lnSiSi0
� �¼ �Diγ
2g2δ2 Δ� δ
3� τ
2
� �ð6Þ
where Si is the measured signal intensity of species i and Di is the diffusioncoefficient of that species, Si0 defines the initial signal intensity, γ is the protongyromagnetic ratio, δ is the pulse duration of a combined pair of bipolar pulses, τ isthe period between bipolar gradients, Δ is the period separating the beginning ofeach pulse-pair, and g is the gradient strength. In each experiment the strengthof the gradient pulse was incremented, while δ (2−5 ms), Δ (60 ms) and τ (2 ms)were all kept constant. The 90° pulse width was 6.6 μs, g had a maximum value of600 G cm-1, the number of scans was 16, and the repetition time was 6 s,satisfying the criterion of being at least five times T1, which we measured to be~1000 ms. Samples were studied in steps of 10 °C over the inclusive temperaturerange 20−60 °C.
FTIR spectroscopy. Hydrogel samples were snap-frozen in liquid nitrogen andthen dehydrated in a freeze drier at −80 °C for 24 h. The dried hydrogels wereground using tissue lyser LT (Qiagen, Hilden, Germany) for 20 min each. For theplant samples, alcohol insoluble residues (AIR) were obtained from frozen tissues
via extraction in an ascending ethanol series (70, 80, 90, 100% v/v in H20) for 1 hper change, followed by extraction with 100% acetone and methanol:chloroform(3:2) (1 h per change). The pellet was recovered by centrifugation between eachstep. The resulting pellet was dried and used directly for FTIR. 1 mg of each samplewas mixed with 300 mg of fresh FTIR grade KBr, ground together, and thencompressed to a disc under 10 tons applied weight for 2 min.
FTIR spectra were obtained for all samples using Bruker IFS-66 spectrometerequipped with a liquid nitrogen cooled MCT detector, with all optics undervacuum. Scans were taken at a 2 cm−1 resolution, within frequency range of400–4000 cm-1, in absorption mode, and 1000 spectra were co-added to yieldspectra of high signal-to-noise ratio. Obtained spectra were normalised to theabsorbance of the O–H in-plain deformation band at 1336 cm−1.
The energy of the hydrogen bond (EH) was calculated using the Eq. 748:
EH ¼ 1K
� �ν0 � υð Þν0
� �ð7Þ
where ν0 is the standard frequency corresponding to free –OH groups (3600 cm−1), υ is the frequency of the bonded –OH groups and K= 1.68 ×10⁻² kcal−1.
Lateral Order Index (LOI) was calculated as a ratio of intensity of the peaks,α1429/89371.
Analysis and confocal imaging of the plant material. Plants were grown asindicated in the methods section. For phenotyping, seedlings were stained in a two-step procedure by aniline blue followed with Direct Red 23 (Sigma Aldrich, USA).Roots were dissected from the plant hypocotyls and incubated for 2 h at roomtemperature in a 25 µg ml−1 (42.66 µM) solution of aniline blue fluorochrome(Biosupplies, AU) in a 50 mM K2HPO4 buffer under vacuum (60MPa). A 1% wt.filtered (0.45 µm filter) stock solution of Direct Red 23 (Sigma Aldrich, USA) wasthen added to the aniline blue solution in order to reach a 0.1% wt. final con-centration, and allow to stain one more hour in the same vacuum conditions (60MPa). Slight changes were made to perform this double staining in leaves: leaveswere dehydrated in 96% vol EtOH until cleared, quickly rehydrated in water priorto a 4 h incubation at room temperature in a 25 µg ml−1 (42.66 µM) solution ofaniline blue fluorochrome in a 50 mM K3PO4 buffer under vacuum (60MPa).Direct Red 23 was then added as described above to the aniline blue solution andallowed to stain 2 h more. Roots and leaves were then mounted in a 1:1 vol solutionof AF1 antifadent (Citifluor, USA) and 50 mM K2HPO4 or K3PO4 buffer, andsubsequently imaged by confocal laser scanning microscopy (Zeiss LSM700).Aniline blue staining was imaged with a 405 nm solid state laser, whose emissionwas recovered with a short pass 490 nm filter, and Direct Red 23 staining wasimaged with a 555 nm solid state laser, whose emission was recovered with a longpass 560 nm filter. Pictures were processed using the deconvolution softwareHuygens and ImageJ 1.51 s (for z-stacks projections and contrast). Adobe Photo-shop CS5 was used to create the montages.
Callose amounts were quantified in AIR extracts obtained 24 h after estradioltreatment using aniline blue fluorescence as described for the hydrogels above.
Materials and correspondence. Correspondence to Y.B.-A. or M.R.
Data availabilityAll raw and processed data, associated with both main and supplementary figures andtables, are accessible in ‘https://doi.org/10.5518/225’. All other data supporting thefindings of this study are available within the manuscript or are available from thecorresponding authors upon request.
Received: 2 September 2017 Accepted: 21 September 2018
References1. Bacic, A., Fincher, G. B., Stone, B. A. Chemistry, Biochemistry, and Biology of
1-3 Beta Glucans and Related Polysaccharides, First edn. (Academic press,Elsevier, USA, 2009).
2. Brown, G. D. & Gordon, S. Fungal beta-glucans and mammalian immunity.Immunity 19, 311–315 (2003).
3. Ferreira, A. R. V., Alves, V. D., Coelhoso, I. M. Polysaccharide-basedmembranes in food packaging applications. Membranes 6 (2016).
4. Carreno N. L. V., et al. Advances in Nanostructured Cellulose-basedBiomaterials, First edn. (Springer International Publishing, Switzerland AG,2017).
5. Zhang, R. R. & Edgar, K. J. Properties, chemistry, and applications of thebioactive polysaccharide curdlan. Biomacromolecules 15, 1079–1096 (2014).
6. Cosgrove, D. J. Growth of the plant cell wall. Nat. Rev. Mol. Cell Biol. 6,850–861 (2005).
NATURE COMMUNICATIONS | DOI: 10.1038/s41467-018-06820-y ARTICLE
NATURE COMMUNICATIONS | (2018) 9:4538 | DOI: 10.1038/s41467-018-06820-y | www.nature.com/naturecommunications 11
7. Nakashima, K., Yamada, L., Satou, Y., Azuma, J. & Satoh, N. The evolutionaryorigin of animal cellulose synthase. Dev. Genes. Evol. 214, 81–88 (2004).
8. Thomas, L. H. et al. Structure of cellulose microfibrils in primary cell wallsfrom collenchyma. Plant Physiol. 161, 465–476 (2013).
9. Anderson, C. T., Carroll, A., Akhmetova, L. & Somerville, C. Real-timeimaging of cellulose reorientation during cell wall expansion in arabidopsisroots. Plant Physiol. 152, 787–796 (2010).
10. Marga, F., Grandbois, M., Cosgrove, D. J. & Baskin, T. I. Cell wall extensionresults in the coordinate separation of parallel microfibrils: evidence fromscanning electron microscopy and atomic force microscopy. Plant J. 43,181–190 (2005).
11. Kiemle, S. N. et al. Role of (1,3)(1,4)-β-glucan in cell walls: interaction withcellulose. Biomacromolecules 15, 1727–1736 (2014).
12. Köhnke, T., Pujolras, C., Roubroeks, J. P. & Gatenholm, P. The effect of barleyhusk arabinoxylan adsorption on the properties of cellulose fibres. Cellulose15, 537 (2008).
13. Simmons, T. J. et al. Folding of xylan onto cellulose fibrils in plant cell wallsrevealed by solid-state NMR. Nat. Commun. 7, 13902 (2016).
14. Busse-Wicher, M. et al. The pattern of xylan acetylation suggests xylan mayinteract with cellulose microfibrils as a twofold helical screw in the secondaryplant cell wall of Arabidopsis thaliana. Plant J. 79, 492–506 (2014).
15. Cosgrove, D. J. Re-constructing our models of cellulose and primary cell wallassembly. Curr. Opin. Plant. Biol. 22, 122–131 (2014).
16. Park, Y. B. & Cosgrove, D. J. Xyloglucan and its interactions with othercomponents of the growing cell wall. Plant Cell Physiol. 56, 180–194(2015).
17. Ellinger, D. & Voigt, C. A. Callose biosynthesis in arabidopsis with a focus onpathogen response: what we have learned within the last decade. Ann. Bot.114, 1349–1358 (2014).
18. Amsbury, S., Kirk, P. & Benitez-Alfonso, Y. Emerging models on theregulation of intercellular transport by plasmodesmata-associated callose. J.Exp. Bot. 69, 105–115 (2018).
19. Maule, A. J., Benitez-Alfonso, Y. & Faulkner, C. Plasmodesmata–membranetunnels with attitude. Curr. Opin. Plant. Biol. 14, 683–690 (2011).
20. Levy, A., Erlanger, M., Rosenthal, M. & Epel, B. L. A plasmodesmata-associated beta-1,3-glucanase in Arabidopsis. Plant J. 49, 669–682 (2007).
21. Barratt, D. H. P. et al. Callose synthase GSL7 is necessary for normal phloemtransport and inflorescence growth in Arabidopsis. Plant Physiol. 155,328–341 (2011).
22. Stone, B. A. Cell-walls in plant microorganism associations. Aust. J. Plant.Physiol. 16, 5–17 (1989).
23. Stone, B. A. Chemistry of β-glucans. In: Chemistry, biochemistry, and biologyof 1-3-beta-glucans and related polysaccharides (Eds Bacic, A. et al.) 5–46(Academic Press, San Diego, 2009).
24. Jones, J. D. G. & Dangl, J. L. The plant immune system. Nature 444, 323–329(2006).
25. Schwessinger, B. & Ronald, P. C. Plant innate immunity: perception ofconserved microbial signatures. Annu. Rev. Plant. Biol. 63, 451–482 (2012).
26. Stone, B. A., Clarke, A. E. Chemistry and biology of (1,3)-B-glucans. (La TrobeUniversity Press, Melbourne, 1992).
27. Parre, E. & Geitmann, A. More than a leak sealant. the mechanical propertiesof callose in pollen tubes. Plant Physiol. 137, 274–286 (2005).
28. Chebli, Y., Kaneda, M., Zerzour, R. & Geitmann, A. The cell wall of thearabidopsis pollen tube—spatial distribution, recycling, and networkformation of polysaccharides. Plant Physiol. 160, 1940–1955 (2012).
29. Parre, E. & Geitmann, A. Pectin and the role of the physical properties of thecell wall in pollen tube growth of Solanum chacoense. Planta 220, 582–592(2005).
30. Nishimura, M. T. et al. Loss of a callose synthase results in salicylic acid-dependent disease resistance. Science 301, 969–972 (2003).
31. Voigt, C. A. Cellulose/callose glucan networks: the key to powdery mildewresistance in plants? New Phytol. 212, 303–305 (2016).
32. Eggert, D., Naumann, M., Reimer, R., Voigt, C. A. Nanoscale glucan polymernetwork causes pathogen resistance. Sci. Rep. 4, 4159 (2014).
33. Swatloski, R. P., Spear, S. K., Holbrey, J. D. & Rogers, R. D. Dissolution ofcellose with ionic liquids. J. Am. Chem. Soc. 124, 4974–4975 (2002).
34. Vaten, A. et al. Callose biosynthesis regulates symplastic trafficking duringroot development. Dev. Cell. 21, 1144–1155 (2011).
35. Lopez-Sanchez, P. et al. Cellulose-pectin composite hydrogels: intermolecularinteractions and material properties depend on order of assembly. CarbohydPolym. 162, 71–81 (2017).
36. Herburger, K. & Holzinger, A. Localization and Quantification of Callose inthe Streptophyte Green Algae Zygnema and Klebsormidium: Correlation withDesiccation Tolerance. Plant Cell Physiol. 56, 2259–2270 (2015).
37. Sescousse, R., Gavillon, R. & Budtova, T. Aerocellulose from cellulose–ionicliquid solutions: preparation, properties and comparison withcellulose–NaOH and cellulose–NMMO routes. Carbohyd Polym. 83,1766–1774 (2011).
38. Briscoe, B. J., Fiori, L. & Pelillo, E. Nano-indentation of polymeric surfaces. J.Phys. D. Appl. Phys. 31, 2395–2405 (1998).
39. Hertz, H. On the contact of elastic solids. J. Reine Angew. Math. 92, 156–171(1881).
40. Klymenko, O., Wiltowska-Zuber, J., Lekka, M. & Kwiatek, W. M. Energydissipation in the AFM elasticity measurments. Acta Phys. Pol. A 115,548–551 (2009).
41. Abou-Saleh, R. H., Peyman, S. A., Critchley, K., Evans, S. D. & Thomson, N.H. Nanomechanics of lipid encapsulated microbubbles with functionalcoatings. Langmuir 29, 4096–4103 (2013).
42. Huet, B., Yamato, P. & Grasemann, B. The minimized power geometricmodel: an analytical mixing model for calculating polyphase rock viscositiesconsistent with experimental data. J. Geophys. Res. 119, 3897–3924 (2014).
43. Reuss, A. Account of the liquid limit of mixed crystals on the basis of theplasticity condition for single crystal. Z. Angew. Math. Mech. 9, 49–58 (1929).
44. Cross, M. M. Rheology of non-Newtonian fluids–a new flow equation forpseudoplastic systems. J. Coll. Sci. Imp. U Tok. 20, 417 (1965).
45. Ries, M. E., Radhi, A., Keating, A. S., Parker, O. & Budtova, T. Diffusion of 1-ethyl-3-methyl-imidazolium acetate in glucose, cellobiose, and cellulosesolutions. Biomacromolecules 15, 609–617 (2014).
46. Hall, C. A. et al. Macroscopic and microscopic study of 1-ethyl-3-methyl-imidazolium acetate-water mixtures. J. Phys. Chem. B 116, 12810–12818(2012).
47. Lovell, C. S. et al. Influence of cellulose on ion diffusivity in 1-ethyl-3-methyl-imidazolium acetate cellulose solutions. Biomacromolecules 11, 2927–2935(2010).
48. Ciolacu, D., Ciolacu, F. & Popa, V. I. Amorphous cellulose–structure andcharacterization. Cell Chem. Technol. 45, 13–21 (2011).
49. Park, S., Baker, J. O., Himmel, M. E., Parilla, P. A., Johnson, D. K. Cellulosecrystallinity index: measurement techniques and their impact on interpretingcellulase performance. Biotechnol. Biofuels 3, 10 (2010).
50. Siligato, R. et al. MultiSite gateway-compatible cell type-specific gene-inducible system for plants. Plant Physiol. 170, 627–641 (2016).
51. Schneider, R., Hanak, T., Persson, S. & Voigt, C. A. Cellulose and callosesynthesis and organization in focus, what’s new? Curr. Opin. Plant. Biol. 34,9–16 (2016).
52. Knox, J. P. & Benitez-Alfonso, Y. Roles and regulation of plant cell wallssurrounding plasmodesmata. Curr. Opin, Plant Biol. 22C, 93–100 (2014).
53. Gordobil, O., Egues, I., Urruzola, I. & Labidi, J. Xylan-cellulose films:improvement of hydrophobicity, thermal and mechanical properties.Carbohyd Polym. 112, 56–62 (2014).
54. Sundberg, J., Toriz, G. & Gatenholm, P. Effect of xylan content on mechanicalproperties in regenerated cellulose/xylan blend films from ionic liquid.Cellulose 22, 1943–1953 (2015).
55. Kljun, A. et al. Comparative analysis of crystallinity changes in cellulose Ipolymers using ATR-FTIR, X-ray diffraction, and carbohydrate-bindingmodule probes. Biomacromolecules 12, 4121–4126 (2011).
56. Fujita, M. et al. The anisotropy1 D604N mutation in the arabidopsis cellulosesynthase1 catalytic domain reduces cell wall crystallinity and the velocity ofcellulose synthase complexes. Plant Physiol. 162, 74–85 (2013).
57. Moghadam, M. N. & Pioletti, D. P. Improving hydrogels׳ toughness byincreasing the dissipative properties of their network. J. Mech. Behav. Biomed.Mater. 41, 161–167 (2015).
58. Engel, P., Hein, L. & Spiess, A. C. Derivatization-free gel permeationchromatography elucidates enzymatic cellulose hydrolysis. Biotechnol.Biofuels. 5, 77 (2012).
59. Ding, Q., Zhang, L., Xu, X., Zhang, X. & Wu, C. Solution properties ofpachyman from poria cocos mycelia in dimethyl sulfoxide. J. Macromol. Sci.,Part B 40, 147–156 (2001).
60. Engel, P., Hein, L., Spiess, A. C. Derivatization-free gel permeationchromatography elucidates enzymatic cellulose hydrolysis. Biotechnol. Biofuels5, 77 (2012).
61. Roder, T., Morgenstern, B., Schelosky, N. & Glatter, O. Solutions of cellulosein N,N-dimethylacetamide/lithium chloride studied by light scatteringmethods. Polymer 42, 6765–6773 (2001).
62. Ding, Q., Zhang, L. N., Xu, X. J., Zhang, X. F. & Wu, C. Solution properties ofpachyman from Poria cocos mycelia in dimethyl sulfoxide. J. Macromol. Sci.Phys. 40, 147–156 (2001).
63. Hutter, J. L. & BechhoeferJ. Calibration of atomic-force microscope. Tips. Rev.Sci. Instrum. 64, 1868–1873 (1993).
64. Heath, G. R. et al. Self-assembly of actin scaffolds on lipid microbubbles. SoftMatter 10, 694–700 (2014).
65. Missaghi, S. & Fassihi, R. Evaluation and comparison of physicomechanicalcharacteristics of gelatin and hypromellose capsules. Drug Dev. Ind. Pharm.32, 829–838 (2006).
66. Sneddon, I. N. The relation between load and penetration in the axisymmetricboussinesq problem for a punch of arbitrary profile. Int. J. Eng. Sci. 3, 47–57(1965).
ARTICLE NATURE COMMUNICATIONS | DOI: 10.1038/s41467-018-06820-y
12 NATURE COMMUNICATIONS | (2018) 9:4538 | DOI: 10.1038/s41467-018-06820-y | www.nature.com/naturecommunications
67. Lee, I. B., Cho, B. H., Son, H. H. & Um, C. M. Rheological characterization ofcomposites using a vertical oscillation rheometer. Dent. Mater. 23, 425–432(2007).
68. Holz, M., Heil, S. R. & Sacco, A. Temperature-dependent self-diffusioncoefficients of water and six selected molecular liquids for calibration inaccurate H-1 NMR PFG measurements. Phys. Chem. Chem. Phys. 2,4740–4742 (2000).
69. Annat, G., MacFarlane, D. R. & Forsyth, M. Transport properties in ionicliquids and ionic liquid mixtures: the challenges of NMR pulsed field gradientdiffusion measurements. J. Phys. Chem. B 111, 9018–9024 (2007).
70. Cotts, R. M., Hoch, M. J. R., Sun, T. & Markert, J. T. Pulsed field gradientstimulated echo methods for improved nmr diffusion measurements inheterogeneous systems. J. Magn. Reson. 83, 252–266 (1989).
71. Široký, J., Blackburn, R. S., Bechtold, T., Taylor, J. & White, P. Attenuatedtotal reflectance Fourier-transform Infrared spectroscopy analysis ofcrystallinity changes in lyocell following continuous treatment with sodiumhydroxide. Cellulose 17, 103–115 (2010).
AcknowledgementsThis work was supported by EPSRC Grant EF/M027740/1 (which funded M.C.H.-G.work) and the Leverhulme Trust Grant RPG-2016-136 (which funded R.H.A.-S., C.P.and S.A. work). We thank Prof. Peter Hine, Prof. Richard Bushby and Dr. RichardBlackburn for help with the analysis of the data and comments on the manuscript. M.E.R. is grateful to the Royal Society for funding his Industrial Fellowship. Y.H. has beensupported by the Finnish Centre of Excellence in Molecular Biology of Primary Pro-ducers (Academy of Finland CoE program 2014–2019) decision #271832. Y.H. labora-tory was funded by the Gatsby Foundation [GAT3395/PR3)]; the National ScienceFoundation Biotechnology and Biological Sciences Research Council grant [BB/N013158/1]; University of Helsinki [award 799992091], the European Research CouncilAdvanced Investigator Grant SYMDEV [No. 323052].
Author contributionsAll authors contributed to manuscript preparation. R.H.A.-S. and M.C.H.-G. did most ofthe experiments and contributed to data analysis and interpretation of results. S.A.experimentally determined (1,3)-β-glucan concentration, did all plant work and isolated
cell walls extracts for FTIR. C.P. did the macro-indentation measurements. M.F. did theSEM experiments and T.B. contributed to the analysis and interpretation of the data. M.B., S.M. and Y.H. obtained and analysed the pG1090::icals3m lines and contributed to thewriting of this manuscript. Y.B.-A, M.E.R. and S.D.C. conceived and designed research,interpreted the data and supervised the experiments.
Additional informationSupplementary Information accompanies this paper at https://doi.org/10.1038/s41467-018-06820-y.
Competing interests: The authors declare no competing interests.
Reprints and permission information is available online at http://npg.nature.com/reprintsandpermissions/
Publisher's note: Springer Nature remains neutral with regard to jurisdictional claims inpublished maps and institutional affiliations.
Open Access This article is licensed under a Creative CommonsAttribution 4.0 International License, which permits use, sharing,
adaptation, distribution and reproduction in any medium or format, as long as you giveappropriate credit to the original author(s) and the source, provide a link to the CreativeCommons license, and indicate if changes were made. The images or other third partymaterial in this article are included in the article’s Creative Commons license, unlessindicated otherwise in a credit line to the material. If material is not included in thearticle’s Creative Commons license and your intended use is not permitted by statutoryregulation or exceeds the permitted use, you will need to obtain permission directly fromthe copyright holder. To view a copy of this license, visit http://creativecommons.org/licenses/by/4.0/.
© The Author(s) 2018
NATURE COMMUNICATIONS | DOI: 10.1038/s41467-018-06820-y ARTICLE
NATURE COMMUNICATIONS | (2018) 9:4538 | DOI: 10.1038/s41467-018-06820-y | www.nature.com/naturecommunications 13