Embed Size (px)
Citation preview
Report No. 20656-TH
Thai landPublic Finance in Transition
September 18, 2000
Poverty Reduction and Economic Management UnitEast Asia and Pacific Region
Document of the World Bank
Pub
lic D
iscl
osur
e A
utho
rized
Pub
lic D
iscl
osur
e A
utho
rized
Pub
lic D
iscl
osur
e A
utho
rized
Pub
lic D
iscl
osur
e A
utho
rized
KINGDOM OF THAILAND - FISCAL YEAROctober i - September 30
CURRENCY EQUIVALENTS(as of June 30, 2000)
Currency Unit = Baht (B)US$1.00 = B 37.20
B 1.00 = US$0.0269
ABBREVIATIONS
ADB - Asian Development BankAGD - Auditor General's DepartmentARD - Accelerated Rural DevelopmentBoB - Bureau of the BudgetBMA - Bangkok Metropolitan AdministrationCAOs - Changwad Administrative OrganizationsCG - Comptroller GeneralCGD - Comptroller General's DepartmentCIT - Corporate Income TaxCVA - Central Valuation AgencyDoLA - Department of Local AdministrationFDI - Foreign Direct InvestmentFIDF - Financial Institutions Development FundFPO - Fiscal Policy OfficeGAAP - Generally Accepted Accounting PrincipleGDP - Gross Domestic ProductGIS - Geographic Information SystemsLEAs - Local Education AuthoritiesMoF - Ministry of FinanceMoU - Memorandum of UnderstandingMTEF - Medium-Term Expenditure FrameworkNDC - National Decentralization CommiteeNESDB - National Economic and Social Development BoardOAG - Office of the Auditor GeneralOECD - Organization for Economic Cooperation and DevelopmentPAOs - Provincial Administrative OrganizationsPDMO - Public Debt Management OfficePIT - Personal Income TaxPSRL - Public Sector Reform LoanPWD - Public Works DepartmentRAs - Resource AgreementsRD - Revenue DepartmentRUDF - Regional Urban Development FundSAM - Social Accounting MatrixSBT - Small Business TaxSD - Sanitary DistrictsSIF - Social Investment FundSLAOs - Special Local Administrative OrganizationsSOEs - State-Owned EnterprisesTAOs - Tambon Administrative OrganizationsVAT - Value Added TaxVHC - Voluntary Health Card
Vice President Mr. Jemal-ud-din Kassum, EAPVPCountry Director Mr. Jayasankar Shivakumar, EACTFSector Manager . Mr. Homi Kharas, EASPRTask Manager Ms. Dana Weist, EASPR
THAILAND: PUBLIC FINANCE IN TRANSITION
TABLE OF CONTENTS
Pages
ACKNOWLEDGEMENTS .................................................................. v
EXECUTIVE SUMMARY ................................................................. vi
CHAPTER I: ECONOMIC STABILITY AND FISCAL POLICY IN THAILAND .... 1Introduction ................................................................. l1. Macroeconomic Developments and Fiscal Policy before the Crisis ........................ 12. Fiscal Response During the Economic Crisis ........................................................... 63. Fiscal Sustainability Issues for Thailand ................................................................ 17
CHAPTER II: MANAGING TAX REVENUES ............................................................. 201. Introduction ................................................................. 202. The Composition of Revenue ........................................... 203. The Crisis and Its Implications ........................................... 224. Outlook ........................................... 235. Sustainability ........................................... 266. Reforms Underway ........................................... 29
CHAPTER III: PUBLIC EXPENDITURES AND DEVELOPMENT OUTCOMES 351. Introduction ........................................... 352. Trends in the Composition of Govemment Expenditure ...................................... 363. The Budgetary Response to the Crisis ................................ -384. Performance of Key Economic and Social Sectors .............................................. 455. Conclusions ................................................................ 52
CHAPTER IV. REFORMING THAILAND'S EXPENDITURE PLANNING ANDMANAGEMENT ................................................................ 55
1. Introduction ................................................................ 552. Overview of Fiscal Institutions ................................................................ 553. Weaknesses in Thailand's Expenditure Management ............................................ 564. Strategies for Reforming Expenditure Management ............................................. 615. Managing Fiscal Risks ..................................... 66
CHAPTER V. FISCAL DECENTRALIZATION ..................................... 71I . Introduction ..................................... 712. Foundation for Decentralization ..................................... 723. Assignment of Functions .................... 744. Local Revenues .................... 765. Intergovernmental Transfers ...................... 866. Local Borrowing ...................... 877. Local Accountability ...................... 878. Monitoring the Status of Decentralization and Local Fiscal Condition ............... 889. Thailand's Reform Strategy ..................... 88
ii
TABLES IN TEXT
Table I.1: Correlation between Share of Actual Expenditure, Revenue, andDeficit Relative to GDP and Normalized GDP Growth, 1980-1997 ...... 2
Table 1.2: Correlation between Share of Actual, Planned, and UnplannedDeficit to GDP and Normalized GDP Gtowth, 1980-1997 .....................4
Table 1.3: Disbursement of Budgeted Expenditures ...............................................5Table 1.4: Fiscal Policy Stance as a Percent of GDP, by Fiscal Year .................... 13Table 2.1: Revenue Composition, Share of GDP ................................................ 21Table 2.2: Revenue Buoyancy ................................................ 23Table 2.3: Tax Arrears ................................................ 30'Table 2.4: Information Technology Tasks Underway ............................................ 33Table 2.5: Efficiency and Effectiveness of Revenue Administration .................... 34Table 3.1: Share of Capital in Total Expenditure ......................................... 37Table 3.2 Expenditures under the Miyazawa Initiative ......................................... 43Table 5.1: Local Government Revenues, FY1997 (Baht in millions) .................... 77
FIGURES
Figure 1.1: Economic Growth and Fiscal Balance ........................... ,.,.,.,.2Figure 1.2: Planned and Actual Balance ........................... 3Figure 1.3: Revenue Forecasts, 1988-1997 ........................... 4Figure 1.4: Revenue Collection and GDP ........................... 6Figure 1.5: A Chronology of Fiscal Policy During the Crisis ..................................7Figure 1.6: Expectations for 1998 ...................................... 8Figure 1.7: Fiscal Performance Criteria under the IMF Program ............................8Figure 1.8: Fiscal Balance Targets under the IMF Program .................................. 10Figure 1.9: Revenue Shortfalls ...................................... IFigure 1.10: General Government Expenditure and Public Investment .12Figure 1. I 1: Central Government and Non-Financial SOE Debt .18Figure 1.12: Sustainability Projections ............................ 19Figure 2.1: Revenue Collection ........................ 20Figure 2.2: Revenue Composition ........................ 20Figure 2.3: Revenue Collection ........................ 21Figure 2.4: Revenue by Department ........................ 23Figure 2.5: Monthly Import Duties Collection ........................ 23Figure 2.6: VAT Collection ........................ 28Figure 3.1: The Sectoral Composition of Government Expenditures ................... 36Figure 3.2 Wages and Salaries as Percent of Total Expenditure 1970-98 for
Selected Asian Countries ................. 38Figure 3.3: The Budget Cut, FY97-98 ................. 39Figure 3.4: Actual Government Expenditures, FY97-98, billion Baht .................. 39Figure 3.5: Percentage Change in Expenditures, FY96-FY98 ............................... 40Figure 3.6: Use of Education and Health Services ......................................... 40Figure 3.7: Budget Cuts by Ministries ..................................... ,.,. 41Figure 3.8: The Miyazawa Package: Composition of Approved Expenditures
FY99 .................................... 44Figure 4.1 The Medium-Term Fiscal Strategy Design Process ............................ 66Figure 4.2: Guaranteed Debt Outstanding, 1999 ..................................... ,,.,.,,.68Figure 4.3: Guaranteed Debt Repayment Schedule .................................... 68
izi
BOXES
Box 1.1: Non Financial, State-Owned Enterprises in Thailand (SOEs) ..................... 9Box 2.1: Incidence of Thai Taxes ........................................................... 24Box 2.2: Improving Revenue Forecasting Capacity ................................................. 25Box 2.3: Actions Underway to Improve Taxpayer Compliance ............................... 31Box 2.4: Information Technology Tasks Underway ................................................. 33Box 2.5: Efficiency and Effectiveness of Revenue Administration .......................... 34Box 3.1: Recommended Education Expenditure Priorities ...................................... 46Box 3.2: Recommended Health Expenditure Priorities ............................................ 48Box 3.3: Recommended Agricultural Expenditure Priorities ................................... 50Box 3.4: Recommended Transport Expenditure Priorities ....................................... 52Box 4.1: Roles of Executive Agencies in Fiscal Decision Making .......................... 56Box 4.2: Thailand's Budget Modernization Strategy ................................................ 63Box 5.1: Nine Measures to Increase Municipal Revenues ....................................... 72Box 5.2: Decentralization Legal Framework ........................................................... 73Box 5.3: Roles of the National Decentralization Committee .................................. 74Box 5.4: Structure of Thai Sub-national Governments ............................................. 75Box 5.5: Local Education Authorities ........................................................... 76Box 5.6: Key Success Factors ........................................................... 86Box 5.7 Specific Tasks to be Undertaken during the PSRP .................................... 89
ANNEXES
Annex Table Al. Budget Balance, Inflation, and GDP Growth .............................. 90Annex Table A2. Overview of Central Government Expenditure ........................... 91Annex Table A3. Central Government Revenue Collection .................................... 92Annex Table A4. Macroeconomic Framework ........................................................ 93Annex Table A5. General Government Fiscal Operations ...................................... 94Annex Table A6. Revenue Structure in Southeast Asian Countries, 1992-1996
Average ........................................................... 95Annex Table A7. Revenue Structure in South East Asian Countries, FY97 ........... 96Annex Table A8. General Personal and Company Income Tax and VAT Rates
in South East Asia ........................................................... 97Annex Table A9. Collection of Government Revenues on Comparison with
Forecasts of Revenues and GDP ................................................. 98Annex Table AI 0. Revenue Forecast ........................................................... 99Annex Table AI l. Sectoral Composition of Expenditures Across Countries ......... 100Annex Table Al 2. Budget Appropriation by Sectors ............................................... 1 01Annex Table A 13. Total Actual Expenditure by Sector .......................................... 102Annex Table A14. Actual Expenditure, Current and Capital ................................... 103Annex Table Al 5. Actual Expenditure, by Object of Expenditure .......................... 104Annex Table A16. Aggregate Local Government Expenditure ............................... 105Annex Table A17. Aggregate Local Government Revenue .................................... 106Annex Table A18. Public Civilian Personnel as of FY95-FY98 ............................. 107Annex Table Al9. Public Sector Debt ........................................................... 108Annex Table A20. Local Government Tax Revenues by Type ............................... 109Annex Table A21. International Comparisons of Property Tax Yields ................... 110Annex Table A22 Regression Analyses of Revenues and GDP ............................. 111Annex Table A23. Structural Aspects of Property Taxes in Selected Countries ..... 112
iv
Annex Table A24. Intergovernmental Aspects of Property Taxes in SelectedCountries ..... 113
BIBLIOGRAPHY ..... 114
v
ACKNOWLEDGEMENTS
This report has been prepared by a core team of principal authors led by Mr. Stefan Koeberle(World Bank) and Ms. Dana Weist (World Bank) and comprising Messrs. Lars Sondergaard(macro and fiscal analysis), Jaime Vazquez-Caro (revenue administration), and Bill McLeary(expenditure prioritization). Overall guidance for the report was provided by Mr. Ijaz Nabi (LeadEconomist for Thailand, World Bank). Key written inputs were provided by Steen Byskov(macro and fiscal analysis), Geoff Dixon (expenditure management), Catherine Downard (stateowned enterprises), Sudarshan Gooptu (risk management), Chris Murray (revenueadministration), Alexander Mutebi (state owned enterprises), Serif Sayin (expendituremanagement and fiscal transparency), Peter Warr (fiscal incidence), Arthur Andersen Consultants(contingent liabilities), and Mokoro Consultants (expenditure prioritization and management).Valuable comments and suggestions on earlier drafts of this report were provided by SteveBarnett (IMF), Benu Bidani (World Bank), Ejaz Ghani (World Bank), Sudarshan Gooptu (WorldBank), Homi Kharas (World Bank), and Hana Polackova-Brixi (World Bank). Much of theanalysis cited in the report was conducted over the period 1997 to 1999 in designing the ThaiGovernment's Public Sector Management Reform Program. The lead counterpart for this reportwas the Ministry of Finance's Fiscal Policy Office; substantial contributions were made by theBureau of the Budget, the Revenue Department, and the NESDB. The report was discussed withcounterparts during a workshop held in June 2000 on "Thailand: Public Finance in Transition."Peer reviewers for the report were: Michael Engelschalk (PRMPS), Malcolm Holmes (PRMPS),Pascale Kervyn de Lettenhove (ECSPE), and Vinaya Swaroop (DECRG). Document processingwas undertaken by Muriel Greaves, Gloria Elmore and Flavia Fernandes.
vi
EXECUTIVE SUMMARY
OBJECTIVES OF THE REVIEW
1. This Public Finance Review assesses the performance of Thailand's fiscal institutions inresponding to the pressures of the economic crisis, and its likely performance in meeting thechallenges of the new Constitution and modernizing the public sector. It draws on the analysisconducted in designing the Government's Public Sector Management Reform Program, and laysout numerous reform options, many of which are incorporated in the Government's Program,which is being implemented by various agencies. It draws lessons from Thailand's experienceduring the economic crisis by examining policy responses, identifying institutional shortcomings,reviewing key challenges for fiscal policy and administration, and developing practical policyrecommendations. While the Review is selective in its focus-issues such as human resourcemanagement and tax policy reforms are not directly addressed-it serves as a practicalcompendium of reforms currently underway, assessing progress achieved and suggestingpriorities for further reform.
2. Thailand is emerging from the biggest economic crisis in a generation, which strained itspublic finances and fundamentally changed the environment in which it makes fiscal decisions.After a decade of surpluses and skillful management of its aggregate fiscal accounts, Thailandfaces recession-induced lower revenues, rising social expenditures, costly restructuring of thefinancial system, and higher public debt. Fiscal reforms are also mandated by the newConstitution. These reformns emphasize accountability and transparency; changes in financialmanagement and reporting, and service delivery, as well as the decentralization of governmentactivities to local administrations. Thailand's ability to respond to these pressures dependscritically on the quality and capability of its fiscal institutions and tools.
3. Thai fiscal policy can generally be characterized by fiscal conservatism. The Governmentis legally restrained from running a large deficit, and fiscal policy has traditionally played astabilizing role on the economy. This conservatism served it well during the boom years, whenfiscal policy provided a healthy macroeconomic environment for growth. From 1976 to 1996, theaverage economic growth was 8 percent annually, placing Thailand firmly among the East Asianmiracle countries.
4. However, there were problems-even during the boom period-in fiscal planning andmanagement that were little observed. Growth was accompanied by increasing income inequalitythrough the early 1990s, and the efficiency and effectiveness of spending were poor. Revenuegrowth was disproportionately allocated to investment spending, which failed to surmount theinfrastructure bottlenecks of Thailand's rapidly growing economy. The string of fiscal surpluseslargely reflected a continuous underestimation of revenues, whereas actual expenditures wereconsiderably lower than planned. Lack of transparency in public expenditure management hasemerged as a major concern.
5. The crisis revealed both strengths and weaknesses in public institutions that were oftenundetected during the boom period. To its credit, the Government was able to maintain socialspending directed toward disadvantaged groups. On the other hand, a clear asymmetry wasobserved in the Government's capacity to use fiscal policy as a tool of demand management. In
Executive Summary vii
the initial crisis period, the Government effectively cut budgeted expenditures by almost 20percent. However, fiscal expansion proved more difficult than budget cuts. The fiscal stimulusprogram did, over time, succeed, spurring consumption and also leaving a legacy of substantiallylarger public debt-estimated to rise to more than 50 percent of GDP in the medium term from 16percent in 1996.
6. The fiscal challenges posed by the crisis and the new Constitution call for concertedeffort on several interrelated fronts. The task for Thailand's policy makers will be:first, to ensurefiscal sustainability by sound public debt management, asset disposal/privatization, andmobilizing adequate resources through improved revenue administration. Second, Thailand'scapacity for prioritizing and targeting public expenditures must be strengthened. Third, moreefficient fiscal management requires a more performance-based and transparent management ofpublic expenditures, revenues and liabilities. Finally, careful steps toward decentralization offiscal responsibility and accountability are required by the new Constitution. These individualchallenges can be overcome within the Government's Public Sector Management ReformProgram. The reform agenda, and actions that the Government has embarked upon, are describedbelow.
THE REFORM AGENDA AND ACTIONS UNDERWAY
Revenue Mobilization
7. Thailand's revenue mobilization is on par with other Asian countries-averaging 18.4percent of GDP before the crisis-though taxes account for a relative larger share of GDP (16.6percent). Compared to other, similar-income countries, it has traditionally relied heavily onindirect taxes and corporation taxes. The revenue share from direct taxes is low--about one-thirdof total revenues--and is composed mostly of corporation taxes (personal taxes are lesssignificant). Substantial revenue comes from import duties and selective sales taxes, which tendto be more distortionary than broader-based taxes like the value added tax (VAT). State OwnedEnterprises generate net revenue; remittances contribute I percent of GDP (around 5 percent oftotal revenues). During the boom years, Thailand's revenue collection systematically exceededexpectations without significant effort, and it was characterized by the IMF as "modern,reasonably efficient, and broadly in conformity with international good practices."
8. During the crisis, revenues fell far more than can be explained by the decrease ineconomic activity (from 19.1 percent of GDP in FY96 to 15.1 percent of GDP in FY99) raisingconcerns regarding the effectiveness of tax administration. Over the medium term, revenues mustbe restored to pre-crisis levels to ensure fiscal sustainability, and enhanced revenue mobilizationwill be required to reduce newly acquired public debt and meet other expenditure needs.Enhancing revenue mobilization will require substantial improvements in tax administration,especially with regard to improving the efficiency and transparency of tax collection,strengthening auditing and enforcement, and enhancing information technology.
9. Tax policy changes (e.g., broadening tax bases, reducing tax rates, etc.) will also beneeded to enhance the productivity, efficiency, and equity of the tax system. The area in greatestneed of reform is the personal income tax, which suffers from a number of structural weaknessesand distortionary features. These include a narrow tax base (due to extensive exemptions, incomedeductions, allowances and other tax relief mechanisms), and a highly complex tax system that isnon-transparent, unfair, and distortionary, as well as difficult and costly to administer. The IMFrecently assessed Thailand's personal income tax system and recommended a series of reforms,
viii Thailand: Public Finance Review
which the Government is considering, to simplify the personal income tax system, enhance itstransparency and ease its administration.
10. Equally important is the need to strengthen tax administration, to ensure adequate andsustainable revenue flows. As part of the Public Sector Management Reform Program, theRevenue Department has launched a reform prDgram that seeks to improve revenue collectionand minimize tax evasion, and to achieve a more equitable distribution of the tax burden. Theseobjectives will be achieved by:
* Strengthening collection enforcement. The first priority is to accelerate efforts to collectcurrent debts, and to develop debt collection strategies by debt category. Accurate and timelyinformation about tax arrears will also be developed, as well as a debt case managementapplication to improve controls over casework, and audit case selection methods. Collectibledebt is expected to be reduced to a manageable level of no more than 5 percent of total annualtax collections. Development of an arrears strategy is a critical next step.
* Improving taxpayer compliance. Important steps taken so far include the establishment of theLarge Business Tax Administration Office and designing an automated audit case selectionsystem. Other critical tasks include: (i) developing and implementing a more comprehensiveaudit strategy; (ii) improving the quality and availability of audit data; (iii) unifying taxpayeridentification numbers; (iv) establishing a more streamlined and focused VAT refund controlsystem; and (iv) coordinating audit and delinquency collection. Development of a compliancestrategy is a critical next step.
* Enhancing information technology as a means to strengthen management. The RevenueDepartment's computer system lacks basic functionality to maintain taxpayer accounts,identify arrears, select quality audit cases, and provide timely management information.Efforts will be made to develop an operational, functional and integrated computer systemand to align business and operational priorities with the envisaged developments intechnology.
Public Expenditures and Development Outcomes
II. Thailand's expenditure allocation among sectors has broadly reflected its developmentpriorities. By comparison with other middle-income countries in the region and elsewhere, itallocates a relatively large share of government expenditures to agriculture, transportation andcommunication, health and education. By contrast, less is spent on defense, social security andwelfare and general public services. Public expenditures helped achieve gains in transition ratesto both lower- and upper-secondary school, the coverage of health care and the quality of roadconstruction and rehabilitation projects.
12. While budgets expanded rapidly during the boom period, the crisis sharply reducedavailable funds, changed priorities, and required budget reallocations. The Bureau of the Budgetadministered these cuts largely in a top-down, across-the-board fashion. The criteria guiding thebudgetary cuts and reallocations--that education, health care, and regional development were tobe protected--were appropriate although encumbrances (carryforwards from past authorizations)strongly mitigated the actual level and composition of the cuts. Thailand effectively protectedexpenditures on health and education, although targeting to the poor and unemployed waslimited.
Executive Summary ix
13. On average, about 20 percent of each annual budget is carried forward to the next fiscalyear in the form of encumbrances. Improved projections of spending from encumbrances andbudget allocations consistent with available resources would likely yield smaller, annual budgetallocations, and smaller carryforwards of unexpended amounts each year.
14. Enlargement of poverty alleviation programs and improved targeting will be critical toreduce the population of poor persons and to protect against periodic downswings in theeconomy. Although expenditures allocated to these programs are growing, the Governmentshould increase the use of geographical targeting and self-targeted programs in allocatingresources to meet distributional objectives. Critical needs are to shift away from the current, equaldistribution of resources across regions, and to define better criteria for allocating resources (e.g.,on the basis of per capita income or regional poverty levels).
Public Expenditure Management
15. Thai budget processes are strongly centralized by the standards of well-performingcountries. While this centralization ensures effective achievement of overall fiscal targets, it alsoimposes inflexibility and distortions on government agencies. These agencies face no incentivesto use the budget as a management tool to increase the performance-i.e., the efficiency,effectiveness and equity-of government programs.
16. Fiscal transparency is weak in Thailand. The Government does not have a clear medium-termn fiscal strategy, fiscal planning is based on cash flows of a narrowly defined centralgovernment, off-budget operations dilute fiscal responsibility and accountability, fiscal risksarising from government's contingent liabilities are not considered properly, and lack of ministryand department level financial reporting hides the true cost of government policies and services.This lack of transparency distorts the prioritization and allocation of public resources, anddiminishes accountability.
17. As part of the Public Sector Management Reform Program, the Bureau of the Budget haslaunched a comprehensive budget modernization program that will modernize Thailand's budgetmanagement so that it promotes better performance and transparency. Expenditure managementreforms are underway to:
• Introducing performance-based budgeting. In the context of performance-based budgeting,the Bureau of the Budget is defining a new "flexibility and accountability" framework forsector ministries, which will delegate more authority to these ministries in return for greaterperformance and reporting standards. Such a framework will improve the management ofoutputs and outcomes rather than control inputs. The Comptroller General's Department isconcurrently identifying financial reporting requirements for ministries and departments,improving the Government's accounting policies, and developing an integrated financialmanagement system.
* Strengthening evaluation of sector policies and performance. In the new performanceframework, as central agencies relinquish line-item control they will focus more on reviewingand evaluating the performance of ministries and departments and on analyzing whether theirpolices are consistent with the Government's strategic priorities. A first step in this process isto coordinate evaluation and policy analysis among the Bureau of the Budget, the NESDBand line ministries.
x Thailand: Public Finance Review
Improving fiscal transparency. The Bureau of the Budget and the Comptroller General'sDepartment are developing a policy to improve fiscal transparency, and standards forreporting off-budget fiscal operations as part of budget documents and financial statements.The Bureau of the Budget and Public Debt Management Office are compiling information oncontingent liabilities. A fiscal strategy extending over the "general government financialposition" with a medium-term outlook will also be developed. Additional reforms are neededto manage fiscal risks within the budget process and to meet international public accountingstandards.
1 8. Historically, the Government was not proactive in managing its assets nor its liabilities,nor in analyzing and mitigating the fiscal risks arising from its outstanding public debt obligationsand contingent liabilities. Preliminary analysis suggests that, in the afternath of the crisis, theGovernment faces increasing off-budget obligations which accumulated primarily in the bankingand enterprise sectors, which in addition to the significant increase in public debt, must bemanaged carefully. A Public Debt Management Office (PDMO) has recently been established toanalyze and manage the Government's liabilities. The PDMO is responsible for several functionsincluding debt service forecasting, active debt management, cash management, risk management,project finance related transactions, and tracking and preparing to deal with contingent liabilitiesof Government. To undertake these tasks, the PDMO will require a number of debt, cash, riskmanagement and other systems and considerable capacity building.
Fiscal Decentralization
19. Thailand is a unitary government that presently has a highly centralized fiscal system thatgrants limited local autonomy in terms of functions, area, staffing, funding and decision making.The Government has only recently begun implementing the decentralization reforms mandated bythe new Constitution, which include increasing the share of local government expenditures,assigning more revenue sources to local governments, revising the system of intergovernmentaltransfers to provide grants in a more transparent and predictable way, and promoting mechanismsfor local accountability. As part of the Public Sector Management Reform Program, theGovernment is designing the decentralization framework for subsequent implementation.Decentralization reforms are underway to:
* Clearly defining central-local expenditure functions. Clarity in expenditure assignment isnecessary to eliminate the overlapping functions performed by the central and localgovernments, and to improve expenditure effectiveness. The National Decentralization Actspecifies a phased approach-spanning four years-to the devolution of administrative powerto prepare central and local governments to assume their new roles.
* Devolving revenue authority. The proposed devolution of revenue authority is based on thegoal that, by 2001, the share of local revenue relative to total government revenues (includingintergovernmental transfers) will increase to 20 percent, largely by increasing transfers tolocal governments. Local revenue shares are expected to increase to 35 percent of totalgovernment revenues by 2006. International experience shows that decentralization can havenegative effects-including overlapping expenditure provision and macro-instability-iffinancing precedes functional assignment of responsibilities. Equally important, the potentialdisincentive effects of large central transfers on local resource mobilization should becarefully considered.
* Improving local revenue mobilization. As additional responsibilities are devolved to localgovernments, they must improve their revenue mobilization both to assure fiscal
Executive Summary xi
sustainability and to promote local accountability. Options include introducing new taxes,reforming existing taxes and enhancing collections from charges and fees. To meet the targetsfor 2006, local governments may need to double their own revenue collections (from 1.5percent of GDP to 3 percent of GDP). In many countries around the world, property taxes,which are underutilized in Thailand, serve as an important local revenue source. Proposedproperty tax reforms could enhance local revenues, although establishing competent, localadministration may be costly and require significant capacity building.
* Reforming the intergovernmental transfer system. Thailand's intergovernmental transfersystem is neither transparent nor stable. Over 70 percent of intergovernmental transfers (or"subsidies") are allocated for specific investment projects, in an ad hoc and highly politicizedmanner. Reforms will reduce the reliance on specific project grants and increase reliance ongeneral-purpose grants that are allocated according to transparent formula(e) that addressvertical imbalance and equalization objectives.
* Promoting responsible local borrowing. While municipalities have the legal right to borrow,few do so because of limited resources and experience, and cumbersome approval processesby the Ministry of Interior. International experience has shown that macroeconomic fiscalimbalances can arise if local government borrowing is not managed carefully. Reformsunderway include the development of the Regional Urban Development Fund as amechanism to channel credit to viable projects managed by creditworthy local governments.Future reforms include potential aggregate limits on local indebtedness, local bankruptcyregulations and mechanisms for promoting responsible local borrowing.
* Enhancing local accountability. Local accountability must be enhanced if decentralization isto succeed, and reforms must be introduced to strengthen local fiscal reporting and localrevenue mobilization, and to engage civil society in local decision making and monitoring.

I. ECONOMIC STABILITY AND FISCAL POLICY INTHAILAND
INTRODUCTION
1.1 Thailand's longstanding reputation for maintaining strong fiscal discipline waschallenged by the economic crisis, which strained fiscal institutions and revealed weaknesses thatwere obscured during the boom years. The crisis has also substantially increased the stock ofpublic debt, which raises concerns over fiscal sustainability and Thailand's resilience to futureshocks. Managing these challenges will depend on Thailand's ability to overcome institutionalrigidities and to restore its tradition of fiscal discipline. This chapter reviews the tradeoffs andconstraints faced by policy makers before and during the crisis in supporting macroeconomicobjectives, and assesses fiscal sustainability over the medium-term. It highlights how fiscalpolicies during the crisis were circumscribed by institutional constraints. What motivated theshifts in fiscal policy from retrenchment to stimulus, and how effective were these policies andinstruments? What factors limited fiscal flexibility? How can future fiscal discipline be restored?The legacy of the crisis will both determine the medium-term fiscal outlook and the reformagenda for managing revenues, expenditures and fiscal risks, which are discussed in subsequentchapters. This chapter develops several main themes:
* the traditional effectiveness of Thailand's budgetary arrangements in moderating economicvolatility;
* the limitations of fiscal policy in dealing with the large shocks caused by the crisis;* the asymmetry between the relatively quick budget cuts in the initial phase of the crisis and
the protracted efforts to raise disbursement levels during the stimulative phase;* the role of reducing revenues versus increasing expenditures in managing budget deficits, and
the traditional reluctance to use revenues as an active fiscal tool; and* the role of increased investment and external borrowing of state enterprises as a means of
fiscal stimulus.
1.2 Thailand's public finances are also considered relative to likely future macroeconomictrends. A brief analysis of fiscal sustainability in light of Thailand's increased debt burdenprovides the context for future institutional reforms in debt management and fiscal transparency.
1. MACROECONOMIC DEVELOPMENTS AND FISCAL POLICY BEFORE THE
CRISIS
1.3 During the boom years, fiscal policy provided a healthy macroeconomic environment forgrowth. From 1976 to 1996, the Thai economy grew an average of 8 percent annually, placing itfirmly among the East Asian miracle countries. Nine consecutive years of government surplusesprovided a low-inflation environment conducive to high savings and investment. While theprivate sector increasingly relied on foreign borrowing to finance growth, beginning in 1988, theGovernment sterilized these inflows by running surpluses of I to 4 percent of GDP. As privatecapital inflows fueled the economic boom, fiscal policy moderated the resulting increases indomestic demand. As a result, the Government repaid virtually all of the domestic debt that had
2 Thailand- Public Finance Review
accumulated during the early 1980s. Central government debt declined steadily from 24 percentof GDP in FY89 to less than 4 percent of GDP in FY97.
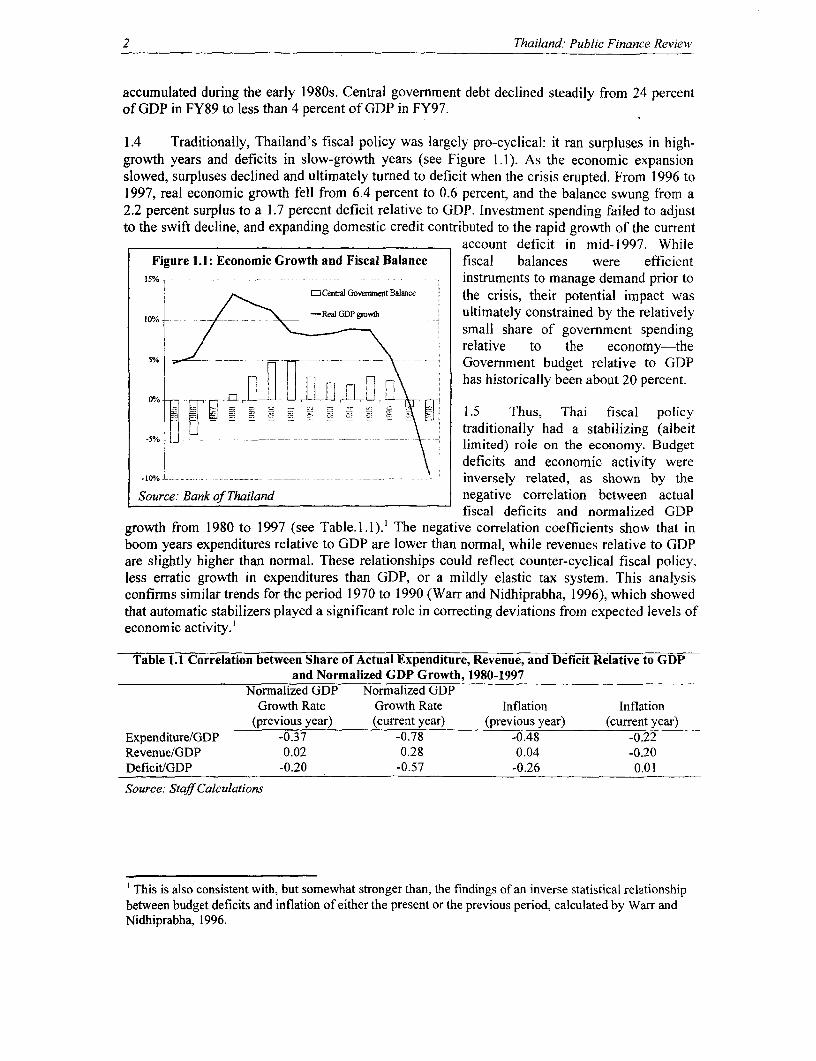
1.4 Traditionally, Thailand's fiscal policy was largely pro-cyclical: it ran surpluses in high-growth years and deficits in slow-growth years (see Figure 1.1). As the economic expansionslowed, surpluses declined and ultimately turned to deficit when the crisis erupted. From 1996 to1997, real economic growth fell from 6.4 percent to 0.6 percent, and the balance swung from a2.2 percent surplus to a 1.7 percent deficit relative to GDP. Investment spending failed to adjustto the swift decline, and expanding domestic credit contributed to the rapid growth of the current
account deficit in mid-1997. WhileFigure 1.1: Economic Growth and Fiscal Balance fiscal balances were efficient
15% instruments to manage demand prior toOCental GovernmneitBaiance the crisis, their potential impact was
1RealGDPgwwh ultimately constrained by the relativelysmall share of government spendingrelative to the economy-the
5% _ _ __ .__ Government budget relative to GDPhas historically been about 20 percent.
H -X 1.5 Thus, Thai fiscal policy__ \ traditionally had a stabilizing (albeit
-5% _ . ~~ -~~ t limited) role on the economy. Budgetdeficits and economic activity were
.1O% -.-- ..-- __ __ ._._inversely related, as shown by theSource: Bank of Thailand negative correlation between actual
fiscal deficits and normalized GDPgrowth from 1980 to 1997 (see Table.1.1).' The negative correlation coefficients show that inboom years expenditures relative to GDP are lower than normal, while revenues relative to GDPare slightly higher than normal. These relationships could reflect counter-cyclical fiscal policy,less erratic growth in expenditures than GDP, or a mildly elastic tax system. This analysisconfirms similar trends for the period 1970 to 1990 (Warr and Nidhiprabha, 1996), which showedthat automatic stabilizers played a significant role in correcting deviations from expected levels ofeconomic activity.'
Table 1.1 Correlation between Share of Actual Expenditure, Revenue, and Deficit Relative to GDPand Normalized GDP Growth, 1980-1997
Normnalized GDP Normalized GDPGrowth Rate Growth Rate Inflation Inflation
(previous year) (current year) (previous year) (current year)Expenditure/GDP -0.37 -0.78 -0.48 -0.22Revenue/GDP 0.02 0.28 0.04 -0.20DeficitJGDP -0.20 -0.57 -0.26 0.01Source: Staff Calculations
' This is also consistent with, but somewhat stronger than, the findings of an inverse statistical relationshipbetween budget deficits and inflation of either the present or the previous period, calculated by Warr andNidhiprabha, 1996.
Economic Stability and Fiscal Policy in Thailand 3
Automatic Stabilizers Or Weak Planning?
1.6 Evidence suggests that while Thailand's fiscal policy was governed by explicit rulespromoting stabilization, it also suffered from institutional weaknesses in fiscal planning. On theone hand, fiscal policy is legally restrained from running a large deficit, which tilts the Thaibudget toward fiscal conservatism. The 1959 Budget Law limits the difference between plannedspending and revenue to 20 percent of planned spending. In 1974, the deficit limit was expandedby excluding refinancing payments-i.e., in each fiscal year the Government may borrow up to20 percent of that year's appropriations plus 80 percent of anticipated principal repayments.
1.7 On the other hand, strong growth and fiscal surpluses masked weaknesses in public sectormacroeconomic management. Growth in revenues was disproportionately allocated to investmentspending, which rose from less than 20 percent of budgetary allocations in 1987 to more than 40percent a decade later.2 And while this increase in public investment offset the previousdeterioration in capital stock, it failed to surmount the infrastructure bottlenecks of Thailand'srapidly growing economy. Second, while economic growth led to an overall decline in povertyincidence, disparities between the rich and the poor widened. Perpetuating a trend from the mid-1970s, between 1988 and 1992, income distribution in Thailand became more skewed, with anincrease in the Gini coefficient from 0.48 to 0.54. Third, corruption and lack of transparency inpublic expenditure management emerged as major concerns, with frequent scandals involvingbureaucrats and politicians and Thailand ranking 69th out of 99 surveyed countries in the 1999Transparency International Index.
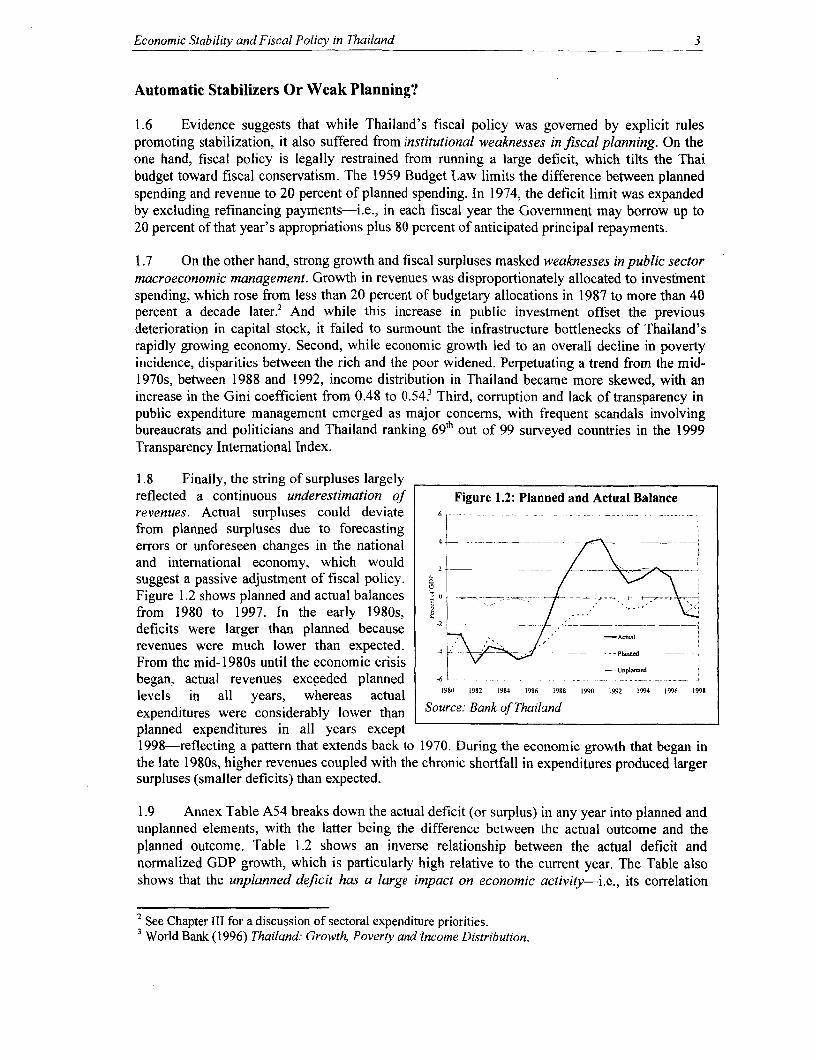
1.8 Finally, the string of surpluses largelyreflected a continuous underestimation of Figure 1.2: Planned and Actual Balancerevenues. Actual surpluses could deviate 6
from planned surpluses due to forecastingerrors or unforeseen changes in the national 4 _ _ _
and international economy, which would 2 / \
suggest a passive adjustment of fiscal policy. _-Figure 1.2 shows planned and actual balances a = ----..-from 1980 to 1997. In the early 1980s, 2deficits were larger than planned because -2 _ ---
revenues were much lower than expected. 4 P' /'- _ d
From the mid-1980s until the economic crisis-Unpl-.
began, actual revenues exceeded planned -6 - -= -_
levels in all years, whereas actual 980 1982 1984 1986 1988 1990 1992 1994 1996 1998
expenditures were considerably lower than Source: Bankof Thailandplanned expenditures in all years except1998-reflecting a pattern that extends back to 1970. During the economic growth that began inthe late 1980s, higher revenues coupled with the chronic shortfall in expenditures produced largersurpluses (smaller deficits) than expected.
1.9 Annex Table A54 breaks down the actual deficit (or surplus) in any year into planned andunplanned elements, with the latter being the difference between the actual outcome and theplanned outcome. Table 1.2 shows an inverse relationship between the actual deficit andnormalized GDP growth, which is particularly high relative to the current year. The Table alsoshows that the unplanned deficit has a large impact on economic activity-i.e., its correlation
2 See Chapter III for a discussion of sectoral expenditure priorities.3 World Bank (1996) Thailand: Growth, Poverty and Income Distribution.
4 Thailand: Public Finance Review
with normalized GDP is many times higher than the planned deficit. Both deficit measures showcounter trends, but the automatic stabilizer shows a stronger tendency.
Table 1.2: Correlation between Share of Actual, Planned, and Unplanned Deficit to GDP andNormalized GDP Growth, 1980-1997
Deficit/GDP Normalized GDP Normalized GDPGrowth Rate Growth Rate Inflation Inflation
(previous year) (current year) (previous year) (current year)Actual -0.20 -0.57 -0.26 0.01Planned 0.01 -0.18 -0.11 0.09Unplanned -0.36 -0.80 -0.37 -0.07Source: Staffcalculations
1.10 As shown above, actualdeficits/surpluses in Thailand deviate Figure 1.3: Revenue Forecasts, 1988-1997substantially from those that were planned. 30 -
For the period 1980 to 1997, the averagedeviation amounts to 1.7 percent of GDP, a 25 /substantial percentage for a country whose i
budget balance ordinarily ranged from plus * 20 i
or minus 4 percent of GDP. In part, this is -desirable because automatic stabilizersmoderate swings in economic activity. 1 *However, these deviations may have been c /magnified by the tendency toward t 5conservative tax forecasts in order to .restrain budget allocations. Historically, it 0 . - -
was not politically viable for the /Government to accrue surpluses, and lower 5revenue projections may have been one tool -5 5 15 25. . ~~~4 Forecasted Growth in Revenuesto avoid political controversy.
i.11 Two features of historical revenue forecasts can be read from Figure 1.3: (i) revenueswere systematically underestimated; and (ii) the accuracy of the forecasts was poor. Perfectlyaccurate forecasts reflect the diagonal line of the figure. Even if adjusted for the bias towardsunderestimation, it is difficult to show any significant predictive power of the forecasts, whichsuggests that they were limited by poor techniques or inadequate information. Without adequateinformation and forecasting tools, it is difficult for the Government to "fine tune" its fiscal policy.
1.12 Past budgets have largely exceeded actual spending by departments (Table 1.3 andAnnex Table A2). Even when actual spending includes amounts authorized to be carried forwardfrom past years (encumbrances), actual spending still falls short of budget plans. (Encumbrancesare discussed in more detail in Chapter III). This suggests that many government departments aretaking on more expenditure responsibilities than they are capable of handling.
4 See Siamwalla, 1997.
Economic Stability and Fiscal Policy in Thailand 5
Table 1.3: Disbursement of Budgeted ExpendituresApproved/Budgeted Actual Disbursement Rates
Fiscal Expen- Encum- TotalExpen- Encum- TotalYear ditures brances ditures brances ditures brances
1992 460 70 531 373 na na 80.9% na na1993 560 89 649 460 58 518 82.2% 64.6% 79.8%1994 625 107 732 524 69 593 83.8% 64.8% 81.0%1995 715 123 838 575 74 649 80.4% 60.4% 77.5%1996 843 150 993 667 114 781 79.1% 76.3% 78.7%1997 925 145 1070 780 130 911 84.3% 89.9% 85.1%1998 830 Na na 697 185 882 84.0% na na
Source: Mokoro 1999.
Revenue as a Demand Management Tool
1.13 In the short run, revenues fluctuate with the business cycle based on consumption, savingand investment patterns. Corporate profits in Thailand are particularly responsiveness to overalleconomic activity. The long-run effect of GDP growth on revenues can be measured by revenuebuoyancy.5 In Thailand, the corporate income tax is the only tax with a high bouyancy (andtherefore a strong automatic stabilization effect; buoyancy of 1.5 as shown in the upper graphs inFigure 1.4).6 From 1965 to 1996, the overall revenue buoyancy with respect to GDP is estimatedas 1. 1, i.e., when GDP increased by 10 percent, revenues increased by 11 percent. The effects ofthe crisis on revenue collections are first observed in 1998-it is too soon to tell whether thelong-run buoyancy of revenues will return to historical levels after the crisis.
1.14 Both automatic revenue stabilizers and discretionary expenditure measures have beenused in Thailand. Expenditure measures generally have higher multiplier effects than revenuemeasures, and they have greater potential for targeting, while automatic revenue stabilizers reactpromptly and are unconstrained by political decisions. Thailand's historical practice has been torely on expenditure measures and to avoid adjusting tax rates-with the exception of customstariffs.7 The rigidity of Thailand's budget process effectively constrained politicians' control tobroad expenditure programs.! The political clout of the small, but wealthy revenue base inBangkok's private sector, and weaknesses in tax administration likely explain the Government'sreluctance to use changes in tax policy to manage demand.
1.15 Thailand's fiscal conservatism and use of automatic stabilizers partially explain the veryprudent fiscal policy outcomes of the past. The crisis posed unforeseen challenges to fiscal policy,and the next section discusses how institutional mechanisms, automatic stabilizers anddiscretionary policy changes were applied as the crisis evolved.
5 In technical terms, the revenue buoyancy with respect to GDP is the elasticity of revenues with respect toGDP, without adjustment for changes in tax rates or bases.6 Specific business taxes and interest income taxes also responded to the growth in the economy, especiallyduring the boom period when capital income was high.7 Listed tariffs have been rising after 1958; although in practice the actual tariffs collected suggest a lowerlevel of protection.8 There are indications that patronage is instead dispensed by elected Cabinet Ministers through sectoralallocations. See Christensen, S., Siamwalla, A. Vichyanond, P. (1992) Institutional and Political Bases ofGrowth-Inducing Policies in Thailand, cit. In Siamwalla (1997) Thailand's Boom and Bust, TDRI, p.33.
6 Thailand: Public Finance Review
2. FISCAL RESPONSE DURING THE ECONOMIC CRISIS
1.16 The crisis brought dynamic challenges to Thailand's fiscal policy: cutting the budget byalmost 20 percent; funding social programs as a means of establishing a social safety net; fundingthe costs of financial sector restructuring; and raising the Value Added Tax (VAT) and selectedother taxes to offset structural deterioration in the tax base. To date, the total cost of financialsector restructuring is unknown, but recent estimates suggest that it may reach 50 percent ofGDP.9
Figure 1.4: Revenue Collection and GDPTotal Revenue Collection Corporate Income Tax Collection
60 60
5996~~~~~~~~~~~~~~~~~~~~~~~~~9
Slopo: I I3'~~~ 54 3i
3 0 3,0
2s L 2.5S150 5 2 5- 56 5S 60 62 6.4 6.6 6S 5.0 51 54 5.6 58 60 62 6.4 66 6.S
Log(GDP) Log(GDP)
Revenue Collection and the Business Cycle Corporate Income Tax and the Business Cycle
. 6 20%
-- I Slop0 . * - 10% Slop:2 *
-. -S, .- _ -- _ - 00 - … --- --------- ,---- ---._________X__
, 26 4 Y 6% 8% 10% 12% 14%
.5-, I * v - - -0%-10-/o~~~~~~~~~~~ 1 -
2% 4% 6%Y. 8% 10%S. 12% 14% -20% Rca GDP G-ooh Real GDP g,o th
Source: Bank of Thailand
Note: The two upper graphs reflect 1965-1998; the two lower graphs reflect 1965-1996. All estimationshave been done on the basis of 1965-1996 data.1.17 Thailand's fiscal policy stance during the crisis is not clearly described because of thedrastic policy changes that occurred between 1997 and 1999--for which the long-termimplications are still evolving. The fiscal response of the Thai authorities during the crisis can beconsidered from three periods: (i) during the initial phase from July 1997 to February 1998, whenbudgets were cut dramatically, both before and after the IMF program; (ii) a period fromFebruary to November 1998 when it became clear that the recession was much deeper thanexpected but institutional rigidities could not be overcome; and (iii) a period of fiscal stimulus,
9 Recent estimates of the debt associated with the Financial Institutions Development Fund (FIDF) rangefrom the Public Debt Management Office's estimate of about 40 percent of GDP, to Policy ResearchInstitute estimates of 54 percent of GDP, to Senate Committee on Fiscal Banking and Financial Institutionsestimates of 61 percent of GDP. See "Government Told to Act on FIDF Debts," The Nation, 19 March2000.
Economic Stability and Fiscal Policy in Thailand 7
when the fiscal contraction was reversed to jump start the economy. This categorization amongperiods raises a number of questions: Why did policies shift and how fast were theyimplemented? What problems did the Thai authorities face? Were these problems successfullyovercome?
Phase I: Fiscal Discipline and Budget Cuts
1.18 The first phase from July 1997 to February 1998 was characterized by abrupt fiscalconsolidation-budget cuts and tax increases-to finance the costs of financial sectorrestructuring. Before the crisis and in response to the widening current account deficit, Thaiauthorities had begun to cut the FY97 budget, focusing on low-priority projects, foreignpurchases and trips.'° More than 30 percent of the FY97 budget cut reflected "underspending."tt
Wherever disbursement rates were persistently low, the BOB generally cut redundantexpenditures.
Figure 1.5: A Chronology of Fiscal Policy during the Crisis
FY98 budget cut from 982 to FY98 budget cut from FY98 budget Selected excise taxes and import tariffs
923 billion baht VAT rate 823 to 800 billion baht. increased from 800 lowered, depreciation of fixed assets
raised from 7 to 10 percent to 830 biltion baht. increased to stimulate investments
FY98 budget cut from Selected excise 53 bn baht additonal Excise tax on
923 to 823 billion baht taxes and import expenditures, 55 bn bahf tax diesel reduced
l Baht devaiues | | Selected excise taxes and tariffs increased reductions, 24 bn baht energy by 0.50 baht perimport tariffs increased price reductions, litre
July 1998 August 1997 October 1997 November 1997 February 1998 May 1998 March 1999 August 1999 October 1999
1.19 The recognition that huge financial sector losses would be incurred and borne at least inpart by the Government motivated it to consolidate its public finances swiftly. In August 1997,within the framework of the IMF program, a succession of budget cuts and revenue measureswere implemented to accommodate an expected revenue, shortfall, to reduce the current accountdeficit, and to produce a budget surplus of I percent of GDP. At that point, it was not expectedthat the economy would contract as sharply as it did (by almost 10 percent in 1998; see Figure1.6). In three rounds between August and November 1997, Baht 182 billion were cut, amountingto nearly 20 percent of the original FY98 budget. The VAT rate was raised from 7 to 10 percent,causing total revenues to increase slightly at the end of 1997.
1.20 Thailand's system of controlling allotments initially proved effective in controllingexpenditures. Central government capital expenditures were reduced, while current expenditureswere relatively unaffected since allotments had been assigned earlier in the fiscal year. However,actual capital expenditures did not decline as much as initially anticipated because of the largeencumbrances carried over from the previous year's budget.
1.21 The role of state enterprises in Thailand's fiscal adjustment is generally underappreciated. Operating like corporations, their large, ongoing investment programs can be used toreach fiscal objectives (see Box 1.1). The Government's planning agency, the NESDB, isresponsible for approving and monitoring this investment program, and it limits SOE
t° The fiscal year in Thailand runs from October I to September 30." A total of Baht 59 billion was cut (from Baht 984 to 925 billion) and Baht 19 billion of this was cut"from underspending", according to the BOB, p. 13.
8 Thailand: Public Finance Review
expenditures to their retained income. Numerous SOEs carry out financial operations, whichexacerbates the fragmentation of the public sector and makes it hard to plan and control net creditfrom the banking sector.
Figure 1.6: Expectations for 1998
Consensus Forecast for 1998 GDP Growth IMF Forecasts for Central Government Revenues and8 1 .. ._ ___._ _ _ _ _.__ ._... . __. __ ...... ___.. ______Grants in FYI 998
11111 1117
0-6 ___.14L_
-h - ..-- - - -=° Ao -O s
Source: IMF Source: IMF
1.22 In order not to crowd out private consumption and investment, performance criteria underthe IMF program were imposed on the banking system's net credit to the public sector (see Figure1.7). Although actual credits never reached the performance criterion, it did impose a liquidityconstraint on the public sector throughout 1998, and it clearly limited official SOE borrowing.According to the BOT, SOEs reoriented their sources of financing and in some cases resorted tonon-commercial bank borrowing (i.e., the Government Savings Bank) to avoid breaching theperformance criterion. Due to the lack of timely data, controlling SOE investments proveddifficult. The net-credit criterion was gradually relaxed, and in 1999 the constraint was no longerbinding.
Figure 1.7: Fiscal Performance Criteria under the IMF ProgramNet Credit to the Public Sector Cumulative Balance of the Central Government
0 ~~~~~~~~~~~~~~~~~~~~~~~~0
+Pefo-nance alion -20.100 -. ..-- . . . -
-500
4(0 -Aa0~~~~-0
-120 r-~-&onc nno
554) -. ~~~~~~~~~~~~~~~~~~~~~~-1401Sqr97 Dc-97 M.r-98 Jun-98 Sq-98 Dec-98 Mn-99 Jun-99 Sep-
97Dec-97 M-r-98 1Jn-98 Sep-98 Dc-98 Mu-99 Jun-99
Source: IMF Source: IMF
Economic Stability and Fiscal Policy in Thailand 9
Box 1.1: Non Financial, State-Owned Enterprises in Thailand (SOEs)
Thailand's State Owned Enterprises (SOEs) play a dominant role in delivering a wide range of services and public investments. As awhole, SOEs generate net profits and contribute approximately 5 percent of government revenues. In FY97, 34 percent of all capitalexpenditures funded public investment in SOEs. Thailand's 59 non-financial SOEs span various activities ranging from tourismpromotion to infrastructure and public utilities. Many of these SOEs were established to deliver services that would not be provided bythe private sector. In addition to the 59 nnon-financial SOE's, Thailand has 6 state owned financial institutions and the Bank ofThailand. The Government and SOEs are linked by remittances, dividends and taxes on SOE income, and subsidies on SOEexpenditures. Since few SOEs are corporatized, dividendsand taxes are negligible. Remittances generally represent a SOE Subsidies and Remittancesshare of earnings paid, and generally vary across SOEs andover time according to investment activity, actual and 1.2% .expected operating performance, etc.
Overall, SOEs remit significant profits to the Government.Within infrastructure, the largest profits are earned by the 08% __. _ _ X ._Telephone Organization of Thailand, and electricity lgeneration within public utilities. Only some SOEs like the '5 06% _ _ _ . -6 -%State Railway of Thailand, the Bangkok MetropolitanTransit Authority and the Tourism Authority of Thailand 04% - -
incur deficits. Liabilities are concentrated in those SOEswith large investment activity and with sufficient collateral 0.2%. I_for borrowing.
Fiscal Contraction 1993 1994 1995 1996 1997 199B
I Subsidies =R1-inmcos -Net flow to GovommntThe Govemment used SOEs as a fiscal tool during both thecontraction and expansion periods of the crisis. During the Source: Arthur Andersen (1999)contractionary phase, the NESDB, the Ministry of Finance and their respective line ministries advised SOE managers to administerbroad, across-the-board expenditure cuts. The cuts were guided by the same criteria as those of other government agencies: education,health care, and regional development projects, as well as employment-generating expenditures were to be preserved whereverpossible. Conversely, projects with high import content, projects that had not yet received Cabinet or NESDB approval, or projectsthat had a relatively low priority in the 8th Five-Year Plan, were most subject to cuts. SOE managers were also directed to ration theirrespective enterprises' income such that the investments did not exceed retained income, In order to meet an IMF performancecriterion, the Comptroller General's Office also encouraged SOEs to borrow from non-Bank sources wherever possible in order tocontain net credit to the public sector from the banking system. In general, SOEs reacted during this phase by either slowing orpostponing new capital investment and by reigning in such items as early retirement schemes and recurrent expenditures.
Fiscal Expansion
When the Govemment embarked on its fiscal expansion in 1998, SOEs were asked to reverse course and increase their spending. TheNESDB's position, for example, was very clear: it asked SOEs to increase their capital expenditures, a directive that mostly translatedinto speeding up of project procurement. Since mid-1 998, most SOEs had various projects ready to be restarted. In addition, as part ofthe March 1999 fiscal expansion package, the Government allocated Baht 19.2 billion annually to lower electricity prices. In practice,the SOE policy reversal was more difficult to effect than originally anticipated. Institutional constraints, coupled with policycontradictions, hindered the timely use of SOEs as fiscal policy tools during the economic downturn.
* Available data suggest that, whereas broad macro policy goals were clear, details of how those overall policies related to SOEswere not clearly expressed. For example, while the country's deficit targets were set at a macro level by the BOT, the specificdetails regarding how investment and tariff goals (which are set by other govemment agencies) supported those deficit targetswere not clearly defined for SOEs.
During fiscal expansion, it was particularly difficult to jumpstart SOE investment expenditures once initial cuts had been made,in part due to information asymmetries and policy implementation lags. Each new Letter of Intent to the IMF had to go, first tothe Cabinet, then to the NESDB where it often required one month to come up with new targets for SOEs.
The multiplicity of agencies involved in SOEs leads to lack of clarity in overall SOE policy, which is further exacerbated by thepolitical overtones of SOE board structures, the asymmetry of information between SOE management and their fiscalsupervisors (the Ministry of Finance), and the inherently political and social nature of many of the SOEs.
10 Thailand: Public Finance Review
1.23 Actual spending reductions were less traumatic than would appear from the proposed 20percent reduction. Even after three rounds of budgetary reductions, the FY98 budget (Baht 800billion) was 22.6 percent higher than actual disbursements in FY96. Furthermore, the FY98budget differed substantially from plan: actual expenditures (Baht 882 billion) were 6.3 percenthigher than budgeted, largely due to a surge in encumbrance spending. This encumbrancespending mitigated the effects of budget cutbacks, and it raises questions about the Government'sability to implement its priorities.
1.24 To sustain program credibility and investor confidence, the fiscal deficit target for FY98was not altered until February 1998 when revenue projections were lowered by 1.9 percent ofGDP. Targets were further changed in November 1998 in anticipation of the fiscal stimuluspackage of Baht 115 billion (see Figure 1.8).
Figure 1.8: Fiscal Balance Targets under the IMF ProgramFiscal Year 1998 Fiscal Year 1999
23 SOEs
X~ ~~~~~~~~~~~ aCernml Goe mienasn Balance[ F |-
-->5~ ~~~~~~~ ---------w: L _ l-:x.W G. -n U.. .,
USOE
U CerUa Gocm-em Balanc
Source: IMF
1.25 Revenues deteriorated rapidly during the crisis. Although measures were taken to stemthe shortfall, revenues declined swiftly throughout 1998, especially import tariffs and corporatetax revenues (Annex Table A3). Revenues fell from 18.9 percent of GDP in FY96 to 15.6 percentin FY98, and over the first 10 months of FY99, revenues declined another 0.6 percent of GDP.Falling tax revenues largely accounted for this decline; remittances from SOEs fell little and othernon-tax revenues increased slightly. Figure 1.9 shows that in FY98, corporate taxes declined by1.6 percent of GDP, and import duties fell by 0.7 percent. Corporate profits deteriorated bothbecause of the devaluation (since many corporations had net, short foreign positions) and lostoperating revenues due to the recession. Imports also fell drastically during the recession, whichled to lower import duty revenues.
1.26 During the first year of the crisis, prospects for revenue collection were bleak. Theoriginal budget assumed continued economic growth, and throughout the 12 months followingthe devaluation, the Consensus Forecast was repeatedly adjusted downward. Revenueexpectations declined continuously throughout 1997 and 1998, which counter-balanced thetendency to underestimate revenues during the pre-crisis boom period.
Economic Stability and Fiscal Policy in Thailand 11
Figure 1.9: Revenue Shortfalls
Revenue and Selected Contributing Components Total Revenue
1 6% 2 0/o 30% Yearon Ye-r change
a.12% -- - ------ __ _ __- 1-%'--I 6'0., - _ . 16%
o 1~~~~~~~~~~~~4%0 4%-- - -- 12%
FY1996 FY1997 FY1998 FY1999- -20%
_Corpoetion t E lpere _VAT m
_State Entepris-s *RevcnuerGDP -30 Q Q2 Q3 Q Q Q2 Q3 Q4 Ql Q2
1997 1998 1999
Source: Bank of Thailand Source: Bank o Thailand* 1999 is the change from the first 10 months of FY1998 to the first 10 months of FY1999
1.27 Potential proceeds from privatization were targeted during the initial stages of theprogram but were excluded from revenue projections. Although the Government approved acomprehensive Privatization Master Plan in September 1998, privatization lost its urgency whenits complexity and long time period became evident, that asset prices were too depressed for thosestate holdings that could have been sold (e.g., Thai Airways), and that political opposition againstprivatization, especially for foreign sales, was rising
Phase II: Overcoming Institutional Rigidities
1.28 As the crisis deepened, the initial, tight fiscal policy was reversed in early 1998. FromFebruary through November, fiscal austerity was gradually abandoned, and deficit targets wereexpanded because of revenue shortfalls, but little effort was made to boost expenditures. In late1998, fiscal policy was used to boost the economy. Using fiscal policy to stimulate the economywas more difficult than cutting the budget since the Government was unfamiliar with the activeuse of deficit financing and hampered by the same institutional rigidities that had fostered fiscaldiscipline over the past decade.
1.29 Budget deficits arose from an unexpected collapse in revenues rather than a deliberatefiscal expansion. By February 1998, the Government's FY98 revenue projections were reviseddownward by almost Baht 100 billion, or 1.9 percent of GDP. (Economic growth was alsoadjusted from 0.1 percent to -3.0 to -3.5 percent). The revenue shortfalls arose from cyclicaldeterioration in the economy, and were distributed among reductions in corporate income taxes (-0.6 percent of GDP), customs duty collections (4.4 percent of GDP), automobile excises (-0.4percent of GDP), and the VAT, personal income, and other excise duties.'2 As a result, the deficittarget was changed to 2 percent (before incorporating the cost of interest payments from financialsector restructuring), and the Government implemented measures both to enhance revenues andcut expenditures.
1.30 Mitigating the social impact of the crisis became an increasingly important expenditurepriority. A fast-disbursing Social Policy Program Loan financed by the ADB (US$500 million)
12 IMF, Second Review, Box 1. "Thailand: Revised Fiscal Outlook for FY 1997/98", February 1998.
12 Thailand: Public Finance Review
was followed by the World Bank-supported Social Investment Project (SIP, US$462 million)."3
As these loans were foreign-financed, they did not require Parliamentary approval which alloweda swifter, albeit less transparent, decision process.
1.31 Tax reductions were increasingly advocated, including a package of measures proposedto the Cabinet by the NESDB in August 1998. The Government was reluctant to implementrevenue measures and to rescind the initial VAT increases, partly because the VAT rate wasalready low by international comparisons. It was believed that expenditure measures would bemore effective--both due to their higher multiplier effect and broader impact relative to thenarrow tax base--although it was clear that expenditure impacts would be less immediate.Furthermore, given the economic uncertainty among consumers during the first year of the crisis,it was thought that taX reductions would not increase spending, thereby failing to stimulate theeconomy. During 1998, incentives to save (rather than consume) eventually diminished as depositinterest rates declined.
1.32 As the crisis deepened, concems about the appropriateness of the fiscal stance rose. Asrevenues plummeted, a larger and larger deficit was allowed for under the IMF program (2.1percent in February, 3.1 percent in May and August, 1998). By the summer, it was recognizedthat the stimulus was being achieved too slowly. Apart from the ADB loan and the SIP project(see Chapter III), no significant additional expenditure programs nor tax cuts were approvedexcept for a deferral of corporate taxes.
1.33 The Government came under increasing pressure for not vigorously implementing anexpansionary fiscal policy. In fact, there was no defacto expansionary policy on the expenditure-side until late 1998. Surprisingly, despite the public pronouncements of the Government's use offiscal policy to stimulate the economy, both government consumption and investment declined ona year-on-year basis until the first quarter of 1999. In fact, the 1997 budget cuts meant thatgovernment consumption and public fixed capital formnation began contracting on a year-on-yearbasis in the 2nd and 4 th quarters of 1997, respectively (see Figure 1.10).
Figure 1.10: General Government Expenditure and Public InvestmentGovernment Consumption Public Investment
100% .. . pea.t. i .p[.t .. loen.I- I
SO% Purchase [tfot Enwprics mnd Abmoad + _ __- _ ---
-Tolal General Go. e-Wet Consumpfion Expendit-re --- Equipment60%u1 609/ % _
0% 60% l .- Totot Pubik Gmss Fi-xd Capital Fo-nation
40% _ 40% __
20 20-- ----- 20.
.
0% - %- -
-20% ----- - --- 20%F
40%4 -40%
-60% -60%- -
94Q1 94Q; 95QI 95Q; 96QI 96Q3 97Q1 97Q3 93Q1 98Q3 99Qt 97Q1 97Q2 97Q3 97Q4 9SQ1 98Q2 98Q3 98Q4 99Q1 99Q2
Source: NESDB, Quarterly GDP data.
1.34 Standard analysis of fiscal stance confirms that no expenditure expansion took place (seeTable 1.4). '4 The Central Government shrank during the crisis in the sense that both revenues
13 The SIP project was mentioned in February 1998 (2nd Review), May (3rd), approved by the WB board inJune/July and the details laid out August (4 th Review). The loan did not become effective until November1998 due to legal constraints.
Economic Stability and Fiscal Policy in Thailand 13
and expenditures fell as compared to the "neutral" scenario. The decline in actual expendituresrelative to neutral expenditures initially reflected budget cuts and later the inability to expandspending. Also, few automatic expenditure stabilizers exist in Thailand, unlike other countrieswith individual transfer payments. The decline in actual revenues compared to neutral revenuesreflected both policy changes and structural characteristics of the Thai economy. The revenue andexpenditure impulses were very strong in FY98 and led to a net fiscal contraction of 0.8 percentof GDP.
Table 1.4: Fiscal Policy Stance as a Percent of GDP, by Fiscal Year1995/96 1996/97 1997/98 1998/99
Central govermmentRevenues 19.1% 17.8% 15.3% 14.3%Expenditures 16.8% 19.2% 17.8% 17.7%Balance 2.3% -1.4% -2.5% -3.4%
Neutral Revenues 19.6% 19.6% 19.6% 19.6%Neutral Expenditures 13.8% 14.4% 16.3% 17.1%Neutral Balance 5.7% 5.2% 3.2% 2.5%
Fiscal Stance 3.4% 6.6% 5.7% 5.9%Fiscal Impulse 0.3% 3.1% -0.8% 0.1%Revenue Impulse -0.3% 1.3% 2.5% 1.0%Expenditure Impulse 0.6% 1.8% -3.3% -0.9%
Source: Bank of Thailand, IMF, and staffcalculations
1.35 The delay in adopting a counter-cyclical fiscal policy stance partially reflects Thailand'sconservative fiscal policy, and its unwillingness to raise taxes. While institutional inertia and theneed for consensus among agencies slowed decision-making, the delay in implementing a fiscalstimulus may be attributed to the political unwillingness to incur higher public debt, or a largerdeficit. It is notable that the growing estimates for the fiscal costs of financial sector restructuringwere not included in the publicly announced deficit targets.
1.36 While there were no explicit new expenditure programs, the widened deficit targets didleave room to raise disbursement rates. The strategy of raising disbursement rates rather thanpassing supplementary budgets had numerous benefits. First, raising the disbursement rate from80 to 89 percent would yield an 11 percent increase in FY98 expenditures. Second, unlike theprocess of approving a supplementary budget, raising disbursement rates does not require alengthy parliamentary debate. Most importantly, raising disbursement rates in one fiscal year doesnot affect medium-termn spending like a supplementary spending package would.
1.37 However, increasing disbursement rates and overcoming Thailand's tradition of under-spending its budget proved difficult for several reasons. Most importantly, funding for projectsthat had been postponed, abandoned or were still being planned could not easily be disbursed dueto the physical constraints of bidding, procurement and implementation, and theoverall numberof projects and operators did not increase. Second, slower project completion by contractors(who therefore could not be paid) due to the liquidity shortage and difficulties in financing their
14 The standard methodology calculates the fiscal stance implicitly. It is assumed that neutral fiscal policyleads to Neutral Revenues growing at the same rate as actual nominal GDP, and Neutral Expendituresgrowing at the same rate as potential GDP. Potential GDP is estimated as an HP-trend of actual GDP. Thebase was chosen as FY90.
14 Thailand: Public Finance Review
working capital compounded the problem. Before the crisis, private contractors could receive 5percent of the total contract amount up front and the remainder at the project's completion,usually at the end of the fiscal year, which explains the large jump in expenditures in the lastmonths of the fiscal year (see Figure 1.10). To accelerate the payment process, the Governmentallowed the renegotiation of contracts and increased up-front payments to contractors to 8percent.
1.38 However, expenditures were slow to pick up as the lengthening of contracts sometimesdelayed the completion of works, and well-intentioned government officials were given littlediscretion to take initiative or to bypass standard government approval procedures-apparentlymany agencies waited for written confirmation of the policy change, sometimes lasting sevendays-before accelerating spending. Government representatives report that the involvement ofmultiple agencies (NESDB, CGD, Office of State Enterprises, BOB) with overlappingresponsibilities also caused delays.
1.39 Toward the end of FY98, innovative measures were taken to meet the new higherdisbursement targets. For example, the monthly deadline when ministries could submit a petitionto the CGD to spend money was extended from the 2 0 th to the 2 5'h of each month.'5 These fiveextra days meant that expenditures rose to a record high in the month of September 1998.
1.40 By contrast, it proved less difficult to revive the investment program of SOEs once theeasing occurred. Cash-flow management proved to be a challenge, however, as SOEs frequentlyhad to approach the Government on short notice to cover shortfalls and renegotiate remittances.
1.41 With hindsight, during most of 1998 efforts to carry out a fiscal stimulus program wereconstrained by: (i) the relatively small magnitude of foreign-financed social expenditures such asthe SIP (small in comparison to overall spending of Baht 21 billion over three years), (ii)problems in raising disbursement targets, and (iii) insufficient incentives to change behaviorwithin a rule-bound and paper-based bureaucracy. These problems raise a broader question:given Thailand's history of under-spending its budgets, why did fiscal expansion rest largely onraising disbursement targets? Equally puzzling, why in April 1998, was the budget for FY99approved in Parliament at Baht 825 billion - a Baht 5 billion decrease from the previous year'sbudget? Could incentives have been used to encourage swifter action?
Phase III: Fiscal Stimulus
1.42 It was only in November 1998, when the IMF visited for the 7 th Review, that agreementwas reached on the first fiscal stimulus package to increase public spending and cut taxes. Fundswere primarily targeted toward improving the social safety net and generating employment, andwere hoped both to stimulate the economy and alleviate poverty. At the end of March 1999,efforts to stimulate the economy actively, rather than relying on automatic stabilizers, acceleratedand the analysis of the fiscal stance indicates a fiscal expansion of 0.1 percent of GDP. Inparticular, the VAT rate was cut from 10 to 7 percent for a period of two years, and new spendingequal to 0.4 percent of GDP was identified mainly within social safety net and agricultural
'5 Before budgetary funds can be disbursed, a ministry has to submit a petition to the CGD. To be able tospend the money within a given month, the petition has to be made before the 20th in the previous month. Itwas this deadline that was extended. Naturally, in the long-run this change would have no change on thedisbursement rates in a given year but the objective in FY97 was to expend as large a part of that year'sbudget as possible.
Economic Stability and Fiscal Policy in Thailand 15
infrastructure. Four months elapsed between the agreement for the fiscal stimulus and itsimplementation on 1 April 1999.
1.43 Data from the first ten months of 1999 show that the temporary reduction in the VAT rateresulted in a decline in revenues of almost 1 percent of GDP (see Figure 1.9) when comparedwith the same period in 1998. Other revenue sources stabilized over this period, and income taxrevenues from corporations actually increased somewhat (by 0.2 percent of GDP).
1.44 The ADB loan allocated Baht 21.6 billion of additional spending over 3.5 years foremployment creation, training, health, and rural development. These longer-term developmentcomponents, compliance with stringent requirements for transparency, and procurement rulesslowed disbursement rates. (By the end of FY99, less than 20 percent of the ADB loan had beendisbursed - well below plans.) Apart from the foreign-financed social expenditure programs, noadditional expenditure packages were implemented in FY98. Thus, ministries were spendingfrom the regular Baht 825 billion budget, Baht 5 billion less in nominal terms than previous yearsand probably 2 percent less in real terms.
1.45 Within a few weeks, a list of priority projects for the Miyazawa initiative was decided bythe NESDB and the BOB, and then presented to the MOF. Pressure rose to finalize the packageby the end of 1998 so that funds could be disbursed in the first few months of 1999 to prevent areturn migration of rural laborers to the cities before the new spring crop cycle. However, thedetails of programs to be funded were the subject to considerable internal debate. Concerns overpolitical acceptance and fear of party politics within the coalition government may explain thefour month delay. At the same time, World Bank conditionality made the release of funds-which co-financed the Miyazawa initiative-contingent upon the adoption of changes inThailand's bankruptcy legislation which was held up in parliamentary debate until April 1999.The Miyazawa package was presented for adoption by Cabinet only in mid-March 1999, a meretwo weeks before the committed funds would have become unavailable with the end of Japan'sfiscal year. With limited time for Cabinet discussions and no parliamentary scrutiny, the foreign-financed, first stimulus package became effective on 1 April 1999-22 months after the crisisbegan.
1.46 Public debate on the Miyazawa program focused on concerns over transparency, inparticular the large funds allocated to local administrative units-tambon administrativeorganizations-which had little accountability and questionable institutional capacity for efficientspending allocations."6
1.47 A second fiscal stimulus package was adopted on 10 August 1999. The main aim was tostimulate investment through the promotion of small and medium-sized enterprises. Othermeasures included a reduction in import tariffs, promotion of real estate business and constructionsector as well as accelerated depreciation allowances.
1.48 Over the summer of 1999, there was still some uncertainty about whether the targeteddeficit would be reached, but by early 2000, GDP growth prospects improved from I percent to 5percent thereby removing some of the pressure for expansionary fiscal policy."7
16 The prioritization and implementation of the Miyazawa initiative a discussed in more detail in ChapterIII.17 See Annex Tables A4 and A5 for a summary of the projections of macro and fiscal indicators.
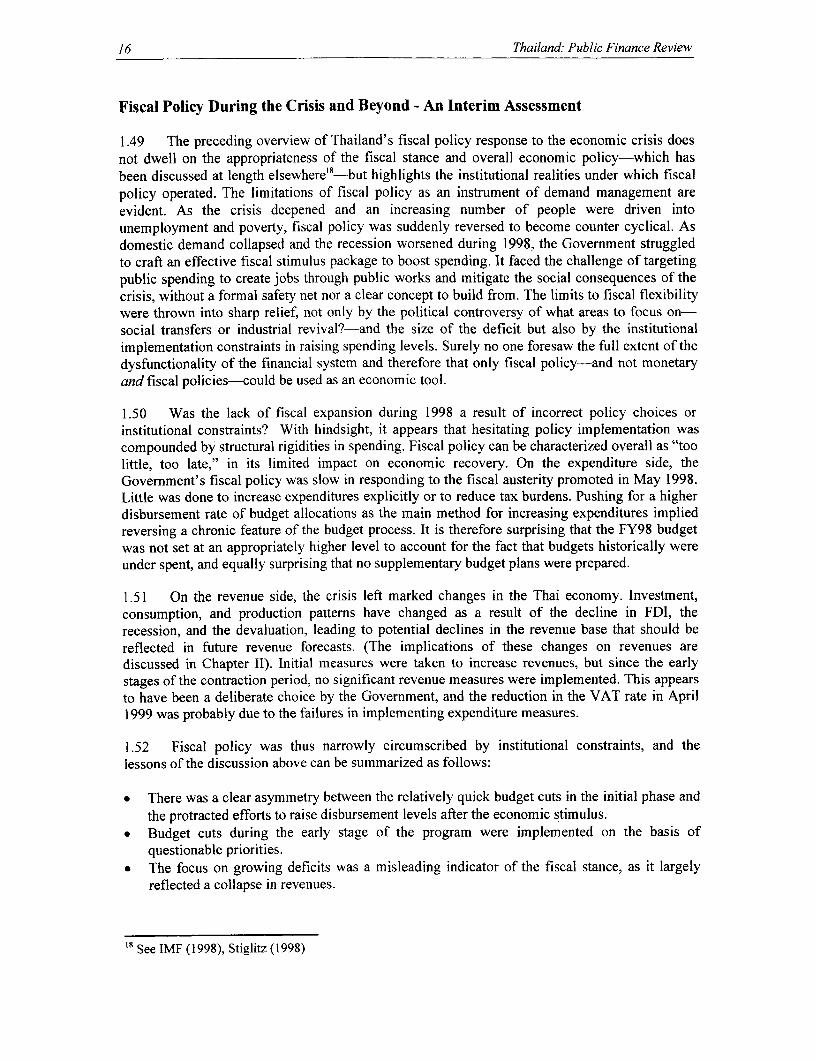
16 Thailand: Public Finance Review
Fiscal Policy During the Crisis and Beyond - An Interim Assessment
1.49 The preceding overview of Thailand's fiscal policy response to the economic crisis doesnot dwell on the appropriateness of the fiscal stance and overall economic policy-which hasbeen discussed at length elsewhere'8 -but highlights the institutional realities under which fiscalpolicy operated. The limitations of fiscal policy as an instrument of demand management areevident. As the crisis deepened and an increasing number of people were driven intounemployment and poverty, fiscal policy was suddenly reversed to become counter cyclical. Asdomestic demand collapsed and the recession worsened during 1998, the Government struggledto craft an effective fiscal stimulus package to boost spending. It faced the challenge of targetingpublic spending to create jobs through public works and mitigate the social consequences of thecrisis, without a formal safety net nor a clear concept to build from. The limits to fiscal flexibilitywere thrown into sharp relief, not only by the political controversy of what areas to focus on-social transfers or industrial revival?-and the size of the deficit but also by the institutionalimplementation constraints in raising spending levels. Surely no one foresaw the full extent of thedysfunctionality of the financial system and therefore that only fiscal policy-and not monetaryand fiscal policies-could be used as an economic tool.
1.50 Was the lack of fiscal expansion during 1998 a result of incorrect policy choices orinstitutional constraints? With hindsight, it appears that hesitating policy implementation wascompounded by structural rigidities in spending. Fiscal policy can be characterized overall as "toolittle, too late," in its limited impact on economic recovery. On the expenditure side, theGovernment's fiscal policy was slow in responding to the fiscal austerity promoted in May 1998.Little was done to increase expenditures explicitly or to reduce tax burdens. Pushing for a higherdisbursement rate of budget allocations as the main method for increasing expenditures impliedreversing a chronic feature of the budget process. It is therefore surprising that the FY98 budgetwas not set at an appropriately higher level to account for the fact that budgets historically wereunder spent, and equally surprising that no supplementary budget plans were prepared.
1.51 On the revenue side, the crisis left marked changes in the Thai economy. Investment,consumption, and production patterns have changed as a result of the decline in FDI, therecession, and the devaluation, leading to potential declines in the revenue base that should bereflected in future revenue forecasts. (The implications of these changes on revenues arediscussed in Chapter II). Initial measures were taken to increase revenues, but since the earlystages of the contraction period, no significant revenue measures were implemented. This appearsto have been a deliberate choice by the Government, and the reduction in the VAT rate in April1999 was probably due to the failures in implementing expenditure measures.
1.52 Fiscal policy was thus narrowly circumscribed by institutional constraints, and thelessons of the discussion above can be summarized as follows:
* There was a clear asymmetry between the relatively quick budget cuts in the initial phase andthe protracted efforts to raise disbursement levels after the economic stimulus.
* Budget cuts during the early stage of the program were implemented on the basis ofquestionable priorities.
* The focus on growing deficits was a misleading indicator of the fiscal stance, as it largelyreflected a collapse in revenues.
1 See IMF (1998), Stiglitz (1998)
Economic Stability and Fiscal Policy in Thailand 17
* Expenditure-based fiscal stimulus occurred after a significant delay and when the beginningof economic recovery was underway.
* Fiscal policy could not jumpstart the economy, but fiscal policy worked well against socialdegradation (see Chapter III).
* The role of SOEs as a fiscal tool has been under appreciated.* The fiscal authorities in the Ministry of Finance and the Bank of Thailand had limited
analytical tools for medium-term fiscal planning; and the NESDB's influence on fiscal policywas limited.
* Contingency plans were not developed.
1.53 What are some of the lessons for institutional reform? As Chapter IV discusses, morerealistic budgetary planning would require that encumbrances (plans for spending carryoversfrom past budgets) be included in budget plans and that these plans be tailored more carefully tothe actual implementation capacity of government agencies. Two important benefits would begained from more accurate tax and expenditure plans: (i) the budget would provide a clearerpicture to market participants in the real and financial sectors (both domestic and international) ofthe Government's actual spending intentions and fiscal stance, which would enhance the"credibility" of government policy; and (ii) the budget would provide a firmer basis for planningand managing government expenditures, both in the aggregate and for individual sectors.
3. FISCAL SUSTAINABILITY ISSUES FOR THAILAND
1.54 The future challenges of fiscal policy are in part determined by the Government'sincreased debt burden. The Government's balance in the pre-crisis years was dominated byrapidly increasing revenues and low public debt, and this policy setting will not re-occur in thenear future. While revenue options and issues are discussed in Chapter II, and fiscal risks arediscussed in greater detail in Chapter IV, this section analyses developments in the public debtburden. Public debt has increased substantially during the crisis as a result of Government-issuedbonds to cover losses incurred by the FIDF, large fiscal deficits, and the BOT's borrowing forbalance of payments support. To date, little work has been done to consolidate the new level ofpublic sector debt, and analyze the medium-term effects of the resulting fiscal burdens that theGovernment will face. This section highlights developments in various types of public debt,presents consolidated debt figures, and discusses some of the results that emerge from our debtsustainability analysis.
Developments in Public Sector Debt
1.55 Central government debt increased sharply during the crisis. Central government (CG)debt has risen from Baht 176 billion (4 percent of GDP) at the end of 1996 to almost Baht 958billion (18 percent of GDP) by the 3 rd quarter 1999 (see Figure 1. 1 1). CG debt has soared becauseof the issuance of Baht 500 billion of bonds to cover losses incurred by the FIDF. Future issuanceof FIDF bonds will be necessary to cover the remaining FIDF losses. The total costs ofrestructuring the financial sector are currently estimated at Baht 1.4 trillion"9 Bonds issued,combined with the fiscal deficit in FY99 and the planned deficit in FY00 could raise CG debt tomore than 25 percent of GDP by end-December 2000. Interest expenses as a percent of the CG
19 The Ministry of Finance estimated that as of February 2000, the FIDF's outstanding debts were Baht775.5 billion, which exclude Baht 148.3 in future obligations and the Baht 500 billion that was fiscalizedby the Government.
18 Thailand: Public Finance Review
budget have already risen from less than 2 percent in 1996 to 5 percent in 1998 and have risen to10.7 percent in this year's budget.
1.56 Other types of public-sector debt have also risen sharply. Debt held by non-financialSOEs has also risen during the crisis, from 12 percent of GDP at the end of 1996 to 17 percent bythe 3rd quarter 1999. While this debt does not exert immediate pressure on the CG budget, theclose linkages between SOEs and the CG budget warrant a closer monitoring of SOE debt.Finally, public debt has risen through the BOT's external borrowing of more than US$14 billionunder the IMF-sponsored rescue package. Similar to SOE debt, the CG is not immediatelyresponsible for repaying this debt. However, BOT's profit remittances to the CG (US$14.5 billionin FY97) could be considerably lower because of this debt burden.
Figure 1.11: Central Government and Non-Financial SOE Debt
External and Domestic Public Sector Debt Public Sector Debt
606', . 5, l
1 BOT Ec lXi0Y, -- l3Do..s.C 910 - N-n-Rn -61aSOE- N 6
35/. _ C.nl G.,7-1t
30% -I40/,9. . ._ . _ 23)
2V11'1
1986 1987 1999 1989 1990 1991 1992 1993 1994 1995 1996 1997, 1998 99Q3 1991 1992 1993 1994 1995 1996 1997 1998 99Q3
Central Government Debt Non-Financial SOE Debt
2(17., . 25%/
Esem,- Non-g-i[od -U o
6' *D. D tesicFIDF 20% - *Do-mli,. Non-gtr-ardneo
1T% VI D-mesti Noa-FSDF LDomeojic,Guemntc.
12 .' . 1 _ lS/oX-5%1 T i4
1991 1992 1993 1994 1995 1996 1997 1998 99Q3 1991 1992 1993 1994 1995 1996 1997 1998 99Q3
Source: Bank of Thailand
Fiscal Sustainability and Implications for Fiscal Policy
1.57 During the next few years, the combined effects of financial sector recapitalization, risinginterest expenses, and future fiscal stimulus packages will raise public debt to GDP ratios beforedeclining. First, while more than half of total financial sector restructuring costs have a'readybeen incurred, they have not all been fiscalized. To fiscalize some of the financial sectorrestructuring costs incurred by the FIDF, the Government issued Baht 500 billion of FIDF bonds
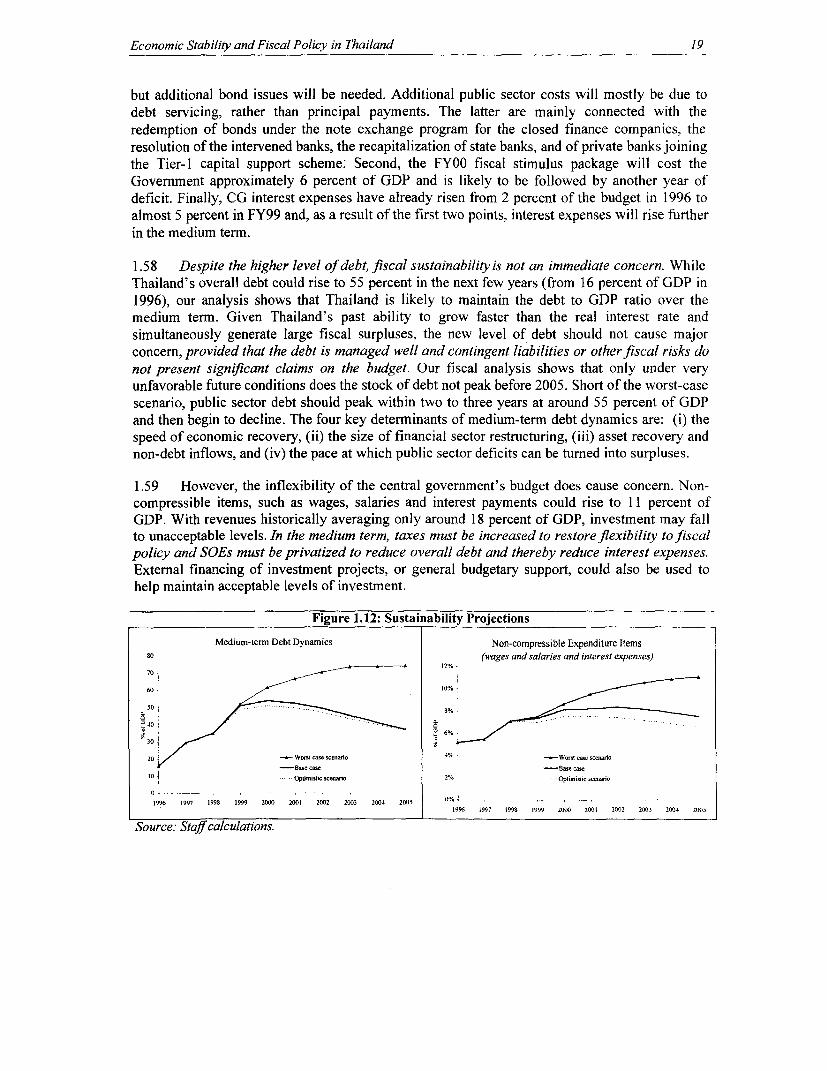
Economic Stability and Fiscal Policy in Thailand 19
but additional bond issues will be needed. Additional public sector costs will mostly be due todebt servicing, rather than principal payments. The latter are mainly connected with theredemption of bonds under the note exchange program for the closed finance companies, theresolution of the intervened banks, the recapitalization of state banks, and of private banks joiningthe Tier-I capital support scheme; Second, the FY00 fiscal stimulus package will cost theGovernment approximately 6 percent of GDP and is likely to be followed by another year ofdeficit. Finally, CG interest expenses have already risen from 2 percent of the budget in 1996 toalmost 5 percent in FY99 and, as a result of the first two points, interest expenses will rise furtherin the medium term.
1.58 Despite the higher level of debt, fiscal sustainability is not an immediate concern. WhileThailand's overall debt could rise to 55 percent in the next few years (from 16 percent of GDP in1996), our analysis shows that Thailand is likely to maintain the debt to GDP ratio over themedium term. Given Thailand's past ability to grow faster than the real interest rate andsimultaneously generate large fiscal surpluses, the new level of debt should not cause majorconcern, provided that the debt is managed well and contingent liabilities or other fiscal risks donot present significant claims on the budget. Our fiscal analysis shows that only under veryunfavorable future conditions does the stock of debt not peak before 2005. Short of the worst-casescenario, public sector debt should peak within two to three years at around 55 percent of GDPand then begin to decline. The four key determninants of medium-term debt dynamics are: (i) thespeed of economic recovery, (ii) the size of financial sector restructuring, (iii) asset recovery andnon-debt inflows, and (iv) the pace at which public sector deficits can be turned into surpluses.
1.59 However, the inflexibility of the central government's budget does cause concern. Non-compressible items, such as wages, salaries and interest payments could rise to 11 percent ofGDP. With revenues historically averaging only around 18 percent of GDP, investment may fallto unacceptable levels. In the medium term, taxes must be increased to restore flexibility to fiscalpolicy and SOEs must be privatized to reduce overall debt and thereby reduce interest expenses.External financing of investment projects, or general budgetary support, could also be used tohelp maintain acceptable levels of investment.
Figure 1.12: Sustainability Projections
Medium-term Debt Dynamics Non-compressible Expenditure Items80 (wages and salaries and interest expenses)
12, -
60 ~~~~~~~~~~~~~~~~~~~~~~~~~~~10,, -
40~~~~~~~~~~~~~~~~0
6%
20 - Womt ase scemnAo 4%. - Worsl case scenano10 j -B..cie -- Ba.e as
10 - odmistic sceosslo 2% - - O,oomistic sce-ario
1996 1997 1998 1999 2000 2001 2002 2003 2004 2005 0% --- 1996 1997 1998 1999 2000 2091 20 02203 2004 205
Source: Staffcalculations.
20 Thailand: Public Finance Review
II. MANAGING TAX REVENUES
1. INTRODUCTION
2.1. This chapter reviews the operation of Thailand's tax system and the performance of itstax institutions during and immediately after the crisis' It presents first an overview of the taxsystem prior to the crisis, and then briefly reviews the impact of the crisis on tax revenues and theGovernment's actions. Based on the IMF's overall assessment and projected fiscal scenarios, itconcludes that various factors already on course will reduce the deficit to levels consistent withmacroeconomic stability. For example, the Value Added Tax (VAT) rate is programmed to returnto 10 percent in March 2001, and the natural buoyancy of the VAT and Corporate Income Taxwill increase revenues as the economy improves. However, given the increased debt and futureexpenditure priorities mentioned in Chapter I, additional efforts-especially in strengthening taxadministration-are needed to ensure long-term sustainability.
2.2. The chapter considers what options might be considered in dealing with the negativerevenue trends arising from the crisis in the short-run, as well as options for fiscal consolidationto address the increased level of public debt. What policy changes (e.g., broadening tax bases,reducing tax rates, etc.) will enhance the productivity, efficiency, and equity of the tax system?What actions must be taken to strengthen the institutional capacity of revenue administration tomobilize revenues, ensure sustainability, and meet other objectives over the medium term?
2. THE COMPOSITION OF REVENUE
2.3. The public sector has played an increasingly prominent role in Thailand's development,which has meant a need for growing revenues. In 1996, total revenues collected by the centralGovernment (in real terms) were four times greater than revenues collected in 1980 (see Figure2.1). As is the case in other countries in the early stages of modernization, the composition ofrevenues moved towards direct taxes, as the economy grew more sophisticated (see Figure 2.2).
Figure 2.1: Revenue Collection Figure 2.2 Revenue Composition
900 : sooos0
70% 700 __ -X 80% - --
_50t3 = _ "--__ X 50% t3 l 01_500 -- ------ --- - -- -_ -. _- -
50%
40% - -
°300 E -- n -. ^ F-- ---- - …-- -- o _ Y5 F7 F5-5 Y5 F9
(o ~ ~~~~~~30% -
20% OSQSEs
_ 04 Di= _T=
FY65 FY75 FY85 FY95 FY998585
Source: Bank of Thailand Source: Bank of Thailand
'The chapter focuses on tax revenues, especially those administered by the Revenue Department,and does not analyze excise taxes and import duties in detail, which are administered by theCustoms and Excise Departments.
Managing Tax Revenues 21
2.4. Figure 2.3 shows that revenue growth was roughly equal to the growth in economicactivity; revenue as a share of GDP increased only slightly during the period 1986 to 1990.Compared to other countries of the same income level, the Thai Government has traditionallyrelied heavily on indirect taxes andcorporation taxes2. Table 2.1 shows the Figure 2.3: Revenue Collectionrecent composition of central Government Fue crevenues. The revenue share from direct
* other Re- e,es
taxes is low--about one third of total 20,% Ta. R-eu
revenues--and is composed mostly ofcorporation taxes (personal taxes are lesssignificant.)3 This tax mix leads to a highdependence on indirect taxes. Substantialrevenue comes from import duties and Iselective sales taxes, which tend to be moredistortionary than broader-based taxes likethe VAT. State Owned Enterprises (SOEs)are net revenue producers in Thailand;remittances contribute 1 percent of GDP Source: Bank of Thailand(around 5 percent of total revenues). Priorto the crisis, Thailand's overall revenue system was characterized by the IMF as "modern,reasonably efficient, and broadly in conformity with intemational good practices.'4
Table 2.1: Revenue Composition, Share of GDPFY97 FY98 FY99
Taxes: 16.2% 14.1% 14.3%Direct taxes: 5.9% 4.6% 4.8%
Personal 2.4% 2.5% 2.3%Corporation 3.4% 1.9% 2.2%Petroleum 0.1% 0.1% 0.2%
Indirect Taxes: 10.4% 9.5% 9.6%Import Duties 2.2% 1.4% 1.6%Value Added Tax a/ 3.6% 4.2% 3.5%Selective Sales Tax 3.9% 3.3% 3.8%Other Taxes 0.6% 0.5% 0.6%
State Enterprise Contributions/Dividends 1.2% 0.8% 0.8%Miscellaneous Revenue and Income 0.5% 0.7% 1.0%Total Revenue 18.0% 15.6% 16.1%Source: Bank of Thailanda/ Including Specific Business Tax
2.5. The very low revenue from personal income taxes diminishes the potential bouyancy ofthe overall revenue system. (See Box 2.1 below for a discussion of the incidence of the Thai taxsystem). Limited reliance on personal income taxes also leads to a lack of progressivity in theoverall tax system.
2 See Annex Table A3 for Thailand and Annex Table A6 and A7 for an international comparison.Although the shares have changed during the crisis due to the high volatility of corporate taxes, the long
run trend is still that the larger share of the direct taxes will arise from the corporate income tax.4Thailand: Improving the Structure and Performance of the Revenue System, by George Abed, JohnNorregaard, Koenraad van der Heeden, Reint Gropp, and James Walsh, IMF, May 1998.
22 Thailand: Public Finance Review
3. THE CRISIS AND ITS IMPLICATIONS
Revenue Impact
2.6. During the crisis, revenues fell far more than can be explained by the decrease ineconomic activity. Revenues fell from 19.1 percent of GDP in FY96 to 16.1 percent of GDP inFY99. Over the next few years, at a minimum, revenues must be restored to pre-crisis levels, andenhanced revenue mobilization will be required to reduce the stock of newly acquired debt.Greater revenues will come in part from the economic recovery, which will increase corporateprofits and taxable value added, and from the programmed return of the VAT tax rate to 10percent.
2.7. As noted in Chapter I, when the crisis emerged in 1997, a period of fiscal contractionensued, and the need for fiscal consolidation was broadly recognized. The two main revenuemeasures were an increase in the VAT rate and an increase in import tariffs via a generalsurcharge. The VAT rate was raised from 7 to 10 percent effective 16 August 1997, and inOctober, selected import tariffs and excise tax rates were raised, primarily on luxury consumptiongoods. The VAT rate increase partly reflected the Government's objective to shift the taxstructure towards broader-based taxes in accordance with international standards (the VAT rate isi0 percent in most countries in the region, as shown in Annex Table A8).
2.8. In the beginning, of 1998, the Government's strategy shifted to fiscal expansion. Asexpenditure measures proved difficult, the Government turned to revenue measures, which couldbe implemented much faster. In March 1999, the VAT rate was temporarily lowered from 10 to 7percent for a period of two years, and the 1.5 percent VAT on gross revenue for small enterpriseswith sales between Baht 600,000 to 1,200,000 was eliminated. Personal income tax relief wasprovided to all taxpayers, but particularly low-income earners, by exempting the first Baht50,000 of net income from tax. The revenue effect of these measures has been estimated to beBaht 55 billion annually (1.2 percent of GDP), or Baht 32 billion (0.7 percent of GDP) for FY99.Further measures to reduce the tax burden were introduced in August 1999 through tariffreductions and accelerated depreciation of fixed assets targeted to provide investment incentives.Finally, to alleviate liquidity problems in both the private sector and among State OwnedEnterprises (SOEs), the Government deferred corporate income tax payments and remittancesfrom SOEs.
2.9. While collections in all revenue departments fell during the crisis (see Figure 2.4),collections by the Customs Department declined most sharply, as revenue from import duties fellsteeply. This steep decline was due to declining incomes and consumption shifts away fromimports and towards domestic goods. The shift away from imported goods was partly a responseto the significant devaluation of the Baht. A typical pattern in the case of a devaluation is thatbefore the decline sets in, imports increase in terms of local currency, as actual imports lag importdecisions. The devaluation leads to increased import values in local currency (generally referredto as the J-curve effect), but this initial increase in import duty revenue is not detected in themonthly data (see Figure 2.5). These short-term effects were not strong enough to dominate theeffects of consumers and firms shifting away from imported goods.
Managing Tax Revenues 23
Figure 2.4: Revenue By Department: Figure 2.5: Monthly Import Duties20a/o 1 Collection
14%
1 2% I
-0%
8%- ____ 1
4% Al -
OCI-tp 22 _ * _ _ _ =w
2%fl __ ,~, __'_ t_.___ _____ __ ______________________ _________
0%--5f5p L1996 1997 1998
Source: Various agencies Source: Bank of Thailand
2.10. At the onset of the crisis, corporation tax revenue declined even more steeply thanimports due to its relatively high revenue buoyancy and the devaluation of the Baht. Many Thaicorporations and financial institutions had unhedged, short net-foreign positions, which incurredlarge foreign exchange losses as the Baht depreciated. Profits (and therefore revenues)deteriorated due to these losses and declining consumer demand. As firms in Thailand areallowed to carry forward losses to offset against future profits, the losses incurred during thecrisis may still have significant effects in the medium term. The crisis is also likely to haveincreased tax evasion due to liquidity constraints and the Government's deferral (twice) ofcorporate income tax payments. Furthermore, the significant number of non-performing loanswill depress bank profits, which are likely to diminish the corporate tax base for some time.
4. OUTLOOK
2.11. As a result of the devaluation, the recession and structural reforms, tax rates and baseshave changed. Tax rates (except for the temporary reduction in the VAT) have changedpermanently. The Baht has depreciated in real effective terms by 18 percent since June 1997, andthis has changed the composition of consumption and production in Thailand, thus altering thetax base, and possibly the composition of corporations as well. In the future, there will likely beless activity in the real estate sector, and capital inflows and investments will be smaller. Theimpact of these different effects must be analyzed to assess the future productivity of Thailand'stax base.
2.12. Tax revenues will recover over the next few Table 2.2: Revenue Buoyancyyears due to several factors, the most important of Total Revenue 1.1
Taxes: ~~~~~~~~~1.1which is economic recovery. Historical patterns Direct Taxes: 1.4suggest that when GDP grows by 1 percent, total Personal 1.3
5 Corporation 1.5revenues grow by I .1 percent. Tax buoyancy Indirect Taxes: 1.0
measures the long-run trend in revenues, but in the Import Duties 1.0
short run, the business cycle-and the recent SBT+VAT I/ 1.1downturn-also affect rrevenue .Different Selective Sales Tax 1.2
economic downtum-also affect revenues. Different State Enterprises 1.2
tax sources have different buoyancy rates (see Table I/Including specific business tax. VAT was
2.2). Without the very buoyant corporate income tax, only introduced in 1992, and partly substituted2.2). the Special Business Tax. It is very likely thatthe revenue system would register little growth the change led to a change in the buoyancy.
Source: Staff calculation
B Based on the period 1965 to 1996; structural changes during the crisis and in the future might alter thischaracteristic. See annex Tables A9 and A10 for forecasts by revenue source.
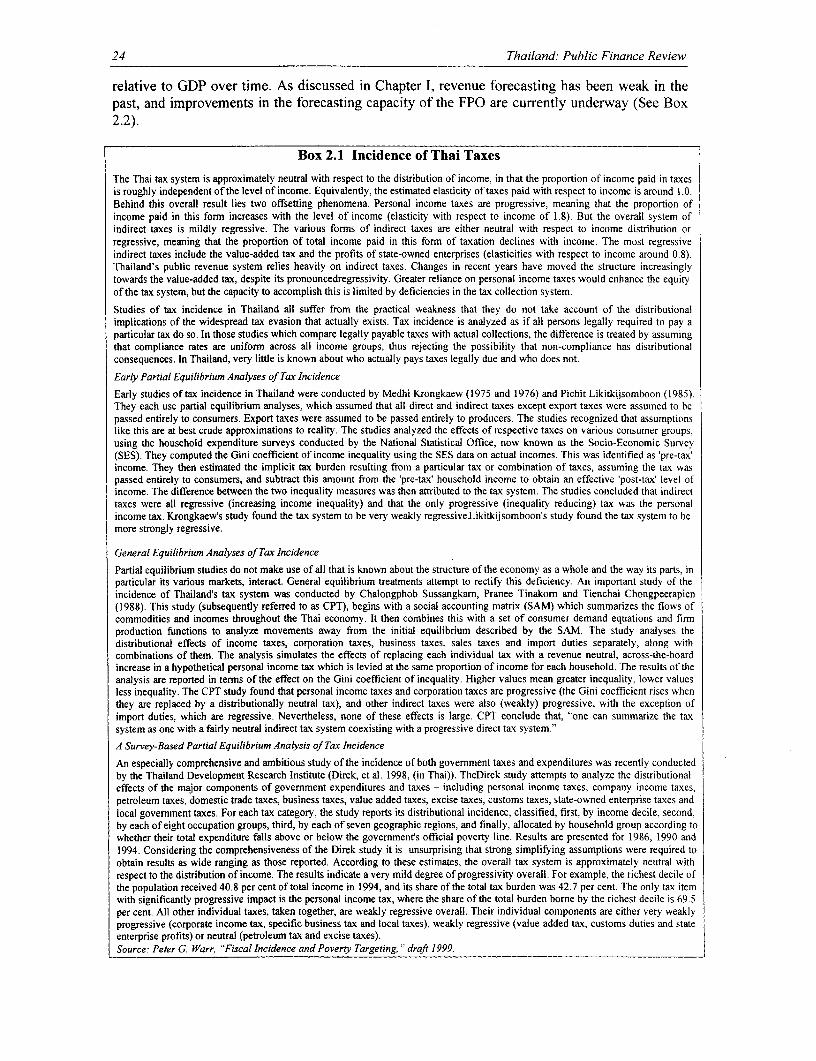
24 Thailand: Public Finance Review
relative to GDP over time. As discussed in Chapter I, revenue forecasting has been weak in thepast, and improvements in the forecasting capacity of the FPO are currently underway (See Box2.2).
Box 2.1 Incidence of Thai Taxes
The Thai tax system is approximately neutral with respect to the distribution of income, in that the proportion of income paid in taxesis roughly independent of the level of income. Equivalently, the estimated elasticity of taxes paid with respect to income is around 1.0.Behind this overall result lies two offsetting phenomena. Personal income taxes are progressive, meaning that the proportion ofincome paid in this form increases with the level of income (elasticity with respect to income of 1.8). But the overall system ofindirect taxes is mildly regressive. The various forms of indirect taxes are either neutral with respect to income distribution orregressive, meaning that the proportion of total income paid in this form of taxation declines with income. The most regressiveindirect taxes include the value-added tax and the profits of state-owned enterprises (elasticities with respect to income around 0.8).Thailand's public revenue system relies heavily on indirect taxes. Changes in recent years have moved the structure increasinglvtowards the value-added tax, despite its pronouncedregressivity. Greater reliance on personal income taxes would enhance the equityof the tax system, but the capacity to accomplish this is limited by deficiencies in the tax collection system.
Studies of tax incidence in Thailand all suffer from the practical weakness that they do not take account of the distributionalimplications of the widespread tax evasion that actually exists. Tax incidence is analyzed as if all persons legally required to pay aparticular tax do so. In those studies which compare legally payable taxes with actual collections, the difference is treated by assumingthat compliance rates are uniform across all income groups, thus rejecting the possibility that non-compliance has distributionalconsequences. In Thailand, very little is known about who actually pays taxes legally due and who does not.
Early Partial Equilibrium Analyses of Tax Incidence
Early studies of tax incidence in Thailand were conducted by Medhi Krongkaew (1975 and 1976) and Pichit Likitkijsomboon (1985).They each use partial equilibrium analyses, which assumed that all direct and indirect taxes except export taxes were assumed to bepassed entirely to consumers. Export taxes were assumed to be passed entirely to producers. The studies recognized that assumptionslike this are at best crude approximations to reality. The studies analyzed the effects of respective taxes on various consumer groups,using the household expenditure surveys conducted by the National Statistical Office, now known as the Socio-Economic Survey(SES). They computed the Gini coefficient of income inequality using the SES data on actual incomes. This was identified as 'pre-tax'income. They then estimated the implicit tax burden resulting from a particular tax or combination of taxes, assuming the tax waspassed entirely to consumers, and subtract this amount from the 'pre-tax' household income to obtain an effective 'post-tax' level ofincome. The difference between the two inequality measures was then attributed to the tax system. The studies concluded that indirecttaxes were all regressive (increasing income inequality) and that the only progressive (inequality reducing) tax was the personalincome tax. Krongkaew's study found the tax system to be very weakly regressiveLikitkijsomboon's study found the tax system to bemore strongly regressive.
General Equilibrium Analyses of Tax Incidence
Partial equilibrium studies do not make use of all that is known about the structure of the economy as a whole and the way its parts, inparticular its various markets, interact. General equilibrium treatments attempt to rectify this deficiency. An important study of theincidence of Thailand's tax system was conducted by Chalongphob Sussangkam, Pranee Tinakom and Tienchai Chongpeerapien(1988). This study (subsequently referred to as CPT), begins with a social accounting matrix (SAM) which summarizes the flows ofcommodities and incomes throughout the Thai economy. It then combines this with a set of consumer demand equations and firmproduction functions to analyze movements away from the initial equilibrium described by the SAM. The study analyses thedistributional effects of income taxes, corporation taxes, business taxes, sales taxes and import duties separately, along withcombinations of them. The analysis simulates the effects of replacing each individual tax with a revenue neutral, across-the-boardincrease in a hypothetical personal income tax which is levied at the same proportion of income for each household. The results of theanalysis are reported in terms of the effect on the Gini coefficient of inequality. Higher values mean greater inequality, lower valuesless inequality. The CPT study found that personal income taxes and corporation taxes are progressive (the Gini coefficient rises whenthey are replaced by a distributionally neutral tax), and other indirect taxes were also (weakly) progressive, with the exception ofimport duties, which are regressive. Nevertheless, none of these effects is large. CPT conclude that, "one can summarize the taxsystem as one with a fairly neutral indirect tax system coexisting with a progressive direct tax system."
A Survey-Based Partial Equilibrium Analysis of Tax Incidence
An especially comprehensive and ambitious study of the incidence of both govemment taxes and expenditures was recently conductedby the Thailand Development Research Institute (Direk, et al. 1998, (in Thai)). TheDirek study attempts to analyze the distributionaleffects of the major components of govemment expenditures and taxes - including personal income taxes, company income taxes,petroleum taxes, domestic trade taxes, business taxes, value added taxes, excise taxes, customs taxes, state-owned enterprise taxes andlocal govemment taxes. For each tax category, the study reports its distributional incidence, classified, first, by income decile, second,by each of eight occupation groups, third, by each of seven geographic regions, and finally, allocated by household group according towhether their total expenditure falls above or below the govemmenfs official poverty line. Results are presented for 1986, 1990 and1994. Considering the comprehensiveness of the Direk study it is unsurprising that strong simplifying assumptions were required toobtain results as wide ranging as those reported. According to these estimates, the overall tax system is approximately neutral withrespect to the distribution of income. The results indicate a very mild degree of progressivity overall. For example, the richest decile ofthe population received 40.8 per cent of total income in 1994, and its share of the total tax burden was 42.7 per cent. The only tax itemwith significantly progressive impact is the personal income tax, where the share of the total burden bome by the richest decile is 69.5per cent. All other individual taxes, taken together, are weakly regressive overall. Their individual components are either very weaklyprogressive (corporate income tax, specific business tax and local taxes), weakly regressive (value added tax, customs duties and stateenterprise profits) or neutral (petroleum tax and excise taxes).Source: Peter G. Warr, "Fiscal Incidence and Poverty Targeting, " draft 1999.
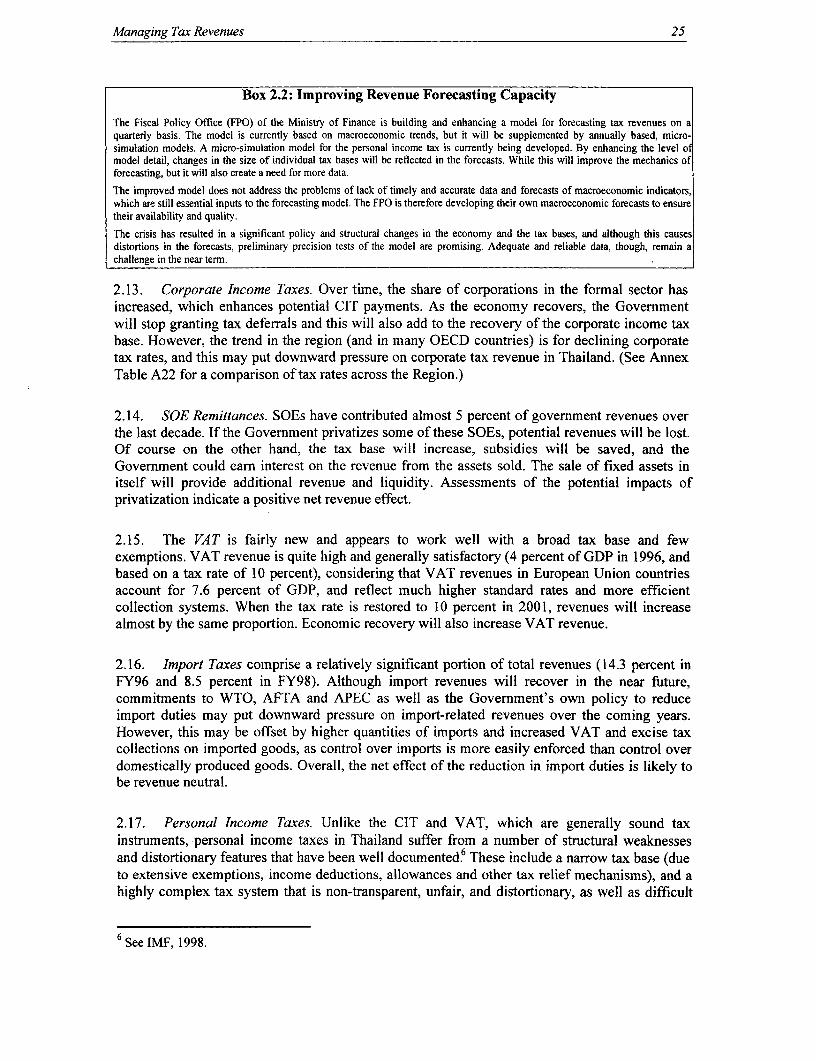
Managing Tax Revenues 25
Box 2.2: Improving Revenue Forecasting Capacity
The Fiscal Policy Office (FPO) of the Ministry of Finance is building and enhancing a model for forecasting tax revenues on aquarterly basis. The model is currently based on macroeconomic trends, but it will be supplemented by annually based, micro-simulation models. A micro-simulation model for the personal income tax is currently being developed. By enhancing the level omodel detail, changes in the size of individual tax bases will be reflected in the forecasts. While this will improve the mechanics offorecasting, but it will also create a need for more data.
The improved model does not address the problems of lack of timely and accurate data and forecasts of macroeconomic indicators,which are still essential inputs to the forecasting model. The FPO is therefore developing their own macroeconomic forecasts to ensuretheir availability and quality.
The crisis has resulted in a significant policy and structural changes in the economy and the tax bases, and although this causesdistortions in the forecasts, preliminary precision tests of the model are promising. Adequate and reliable data, though, remain achallenge in the near term.
2.13. Corporate Income Taxes. Over time, the share of corporations in the formal sector hasincreased, which enhances potential CIT payments. As the economy recovers, the Governmentwill stop granting tax deferrals and this will also add to the recovery of the corporate income taxbase. However, the trend in the region (and in many OECD countries) is for declining corporatetax rates, and this may put downward pressure on corporate tax revenue in Thailand. (See AnnexTable A22 for a comparison of tax rates across the Region.)
2.14. SOE Remittances. SOEs have contributed almost 5 percent of government revenues overthe last decade. If the Government privatizes some of these SOEs, potential revenues will be lost.Of course on the other hand, the tax base will increase, subsidies will be saved, and theGovernment could earn interest on the revenue from the assets sold. The sale of fixed assets initself will provide additional revenue and liquidity. Assessments of the potential impacts ofprivatization indicate a positive net revenue effect.
2.15. The VAT is fairly new and appears to work well with a broad tax base and fewexemptions. VAT revenue is quite high and generally satisfactory (4 percent of GDP in 1996, andbased on a tax rate of 10 percent), considering that VAT revenues in European Union countriesaccount for 7.6 percent of GDP, and reflect much higher standard rates and more efficientcollection systems. When the tax rate is restored to 10 percent in 2001, revenues will increasealmost by the same proportion. Economic recovery will also increase VAT revenue.
2.16. Import Taxes comprise a relatively significant portion of total revenues (14.3 percent inFY96 and 8.5 percent in FY98). Although import revenues will recover in the near future,commitments to WTO, AFTA and APEC as well as the Government's own policy to reduceimport duties may put downward pressure on import-related revenues over the coming years.However, this may be offset by higher quantities of imports and increased VAT and excise taxcollections on imported goods, as control over imports is more easily enforced than control overdomestically produced goods. Overall, the net effect of the reduction in import duties is likely tobe revenue neutral.
2.17. Personal Income Taxes. Unlike the CIT and VAT, which are generally sound taxinstruments, personal income taxes in Thailand suffer from a number of structural weaknessesand distortionary features that have been well documented 6 These include a narrow tax base (dueto extensive exemptions, income deductions, allowances and other tax relief mechanisms), and ahighly complex tax system that is non-transparent, unfair, and distortionary, as well as difficult
6 See IMF, 1998.
26 Thailand: Public Finance Review
and costly to administer. The IMF recently assessed Thailand's personal income tax system andrecommended a series of reforms to simplify the PIT system, enhance its transparency and easeits administration that the Government is considering.
2.18. The conclusion from the above analysis is that, although the present tax rates aregenerally satisfactory, additional revenues must be generated from the tax system to restorerevenue-to-GDP ratios to pre-crisis levels, and to assure fiscal stability in the medium to long-term. Thus, to secure full recovery of revenues, and to meet the needs for increased revenues,reforms in both tax administration and tax policy may be needed. Critical questions in tax policy,including whether the tax system encourages longer-term capital inflows, are appropriate policestowards innovative financial instruments in place, and does tax policy allow for the developmentof sound financial institutions and markets, must also be addressed.
5. SUSTAINABILITY
2.19. Two conditions are necessary for revenue sustainability. First, tax bases should respondautomatically to economic growth to avoid the inefficiencies associated with frequent policychanges. Second, the tax administration should be sufficiently strong to collect revenues in a costeffective way and to endure changing circumstances.
Broadening Tax Bases
2.20. The Government should minimize the risk of losses by ensuring that revenue is collectedfrom a range of different taxes across broad taxpayer bases. While it is possible to collectsignificant revenues by imposing high tax rates on a few taxpayers, policies aimed towards lowertax rates and a larger taxpayer population are more equitable and sustainable. Broadening taxbases makes them more responsive to changes in the economic environment, and this should be amajor mid-term goal in Thailand both on efficiency and equity grounds. The analysis below dealswith two inter-related levels of base erosion: (i) the policy (legally) based erosions derived fromlegal concessions; and (ii) the behavioral base erosions derived from reduced compliance oroutright tax evasion by taxpayers.
2.21. Since 1997, numerous recommendations have been made by the IMF to improve taxpolicy. Very few of these recommendations have been implemented. The following commentsfocus on the key issues arising from these recommendations.
Personal Income Tax (PIT)
2.22. PIT revenues collected in FY96 were 2.4 percent of GDP, which is very low byinternational standards (See Annex Table A6 and A7).7 For FY98, less than 5 million taxpayersfiled personal income tax returns, although there are 60 million people in the country8 Fromsurvey data, the Statistics Office has estimated that there are about 30 million workers in
7In FY99, the revenue from PIT had declined to about 2 percent of GDP.8Note that taxpayers for whom all taxes were withheld will not be reflected in the 5 million figure sincethey do not file tax returns.
Managing Tax Revenues 27
Thailand, but this includes unpaid work as well as paid employment.9 Even so, the discrepancybetween 5 million and 30 million people is too large to be ignored, and may suggest a need toimprove the withholding tax at the employer level.
2.23. Equity of the PIT is low due to the erosion caused by targeted exemptions aggravated bythe extended use of administrative discretion to grant sector-based allowances. There are noautomatic adjustments of brackets and monetary allowances, so the inflationary effect on ratesand thresholds has gradually eliminated much of the progressivity of the rate structure. As anaftermath of this process of gradual erosion, horizontal inequities emerge as individuals withsimilar income levels (but from different sources) pay different marginal tax rates.
2.24. The standard deductions allowed for different types of income are too generous andappear to be illogical. For example, allowing a standard deduction of 40 percent against incomefrom employment while only granting a 30 percent deduction against professional income makeslittle sense. Tax "allowances," which are also deductions from taxable income for dependents,education expenses, insurance premiums, mortgage interest, social insurance payments, anddonations should be reviewed for appropriateness and simplified. The intention should be toreduce the variables and level of proof required for these allowances so that employers can easilyand correctly calculate the rate of PIT to be withheld from their employees' wages. Then, the PITmay become a final withholding system in the majority of cases, eliminating the need foremployees to file tax returns.
2.25. Amendments to the law in March 1999 (effective from 1 January 1999) introduced ageneral exemption for the first Baht 50,000 of personal income, but no changes were made tostandard deductions and allowances. The general exemption should have replaced the standarddeduction of 40 percent (up to Baht 60,000 maximum) allowed against employment income, andstandard deductions for other types of income should be removed. Introduction of a simplified,presumptive system for self-employed and small businesses should be considered.
2.26. An area for further work is to analyze PIT base definitions thoroughly to delete as manytargeted allowances as possible and to replace any remaining (generic) ones by tax credits thatwould preserve the intended progressivity of the PIT. As noted in Chapter IV, annual estimatesshould be prepared of the tax expenditures associated with exemptions and allowances, so thatpolicy makers are fully aware of the financial impact of these provisions. Also, considerationshould be given to creating an automatic inflation adjustment methodology to update brackets,thresholds and any Baht-denominated parameters in the PIT.
Corporate Income Tax (CIT)
2.27. Corporations are important partners in tax collection: they pay the CIT, and withholdpersonal and business taxes when they make payments to other economic agents. Nevertheless,the controls over corporations doing international business must be reinforced. Overpayment ofroyalties, thin capitalization and transfer pricing are sensitive issues to be concerned aboutespecially during a crisis when companies may try to expatriate funds. Estimating the domestic
9The 30 million figure, which is from the late 1980's, also includes agricultural and other workers in theinformal sector whose income is typically outside of the tax system. The Revenue Departmentacknowledges the need to update its statistics on the taxpayer population.
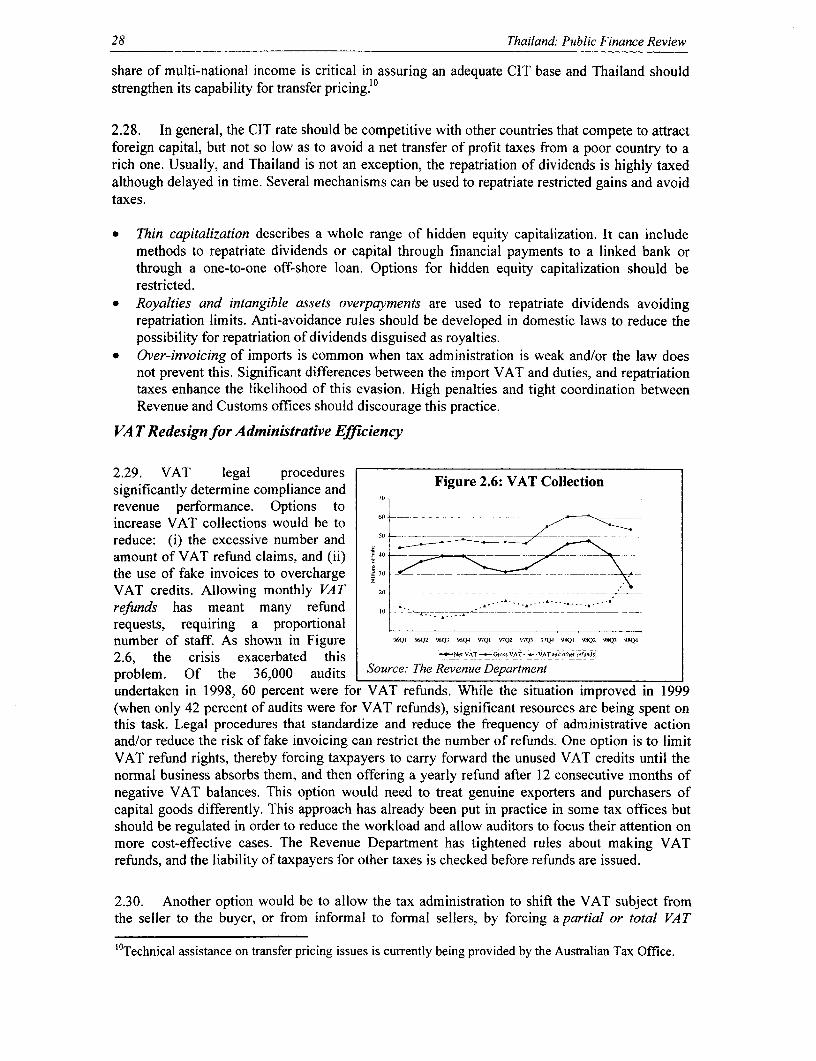
28 Thailand: Public Finance Review
share of multi-national income is critical in assuring an adequate CIT base and Thailand shouldstrengthen its capability for transfer pricing. °
2.28. In general, the CIT rate should be competitive with other countries that compete to attractforeign capital, but not so low as to avoid a net transfer of profit taxes from a poor country to arich one. Usually, and Thailand is not an exception, the repatriation of dividends is highly taxedalthough delayed in time. Several mechanisms can be used to repatriate restricted gains and avoidtaxes.
* Thin capitalization describes a whole range of hidden equity capitalization. It can includemethods to repatriate dividends or capital through financial payments to a linked bank orthrough a one-to-one off-shore loan. Options for hidden equity capitalization should berestricted.
* Royalties and intangible assets overpayments are used to repatriate dividends avoidingrepatriation limits. Anti-avoidance rules should be developed in domestic laws to reduce thepossibility for repatriation of dividends disguised as royalties.
* Over-invoicing of imports is common when tax administration is weak and/or the law doesnot prevent this. Significant differences between the import VAT and duties, and repatriationtaxes enhance the likelihood of this evasion. High penalties and tight coordination betweenRevenue and Customs offices should discourage this practice.
VAT Redesign for Administrative Efficiency
2.29. VAT legal procedures Figure2.6: VAT Collectionsignificantly determine compliance and 70
revenue performance. Options to l60
increase VAT collections would be toreduce: (i) the excessive number and 50
amount of VAT refund claims, and (ii) i4 _0
the use of fake invoices to overcharge 30
VAT credits. Allowing monthly VAT 20
refunds has meant many refund -0 -...-...requests, requiring a proportional . _.
number of staff. As shown in Figure Q1 9Q2 %6Q3 %Q4 97Q1 97Q2 9
7Q3 9
7Q4 98QI 98Q2 9SQ3 98Q
2.6, the crisis exacerbated this -Ce5VAT -- VATdolherT
problem. Of the 36,000 audits Source: The Revenue Departmentundertaken in 1998, 60 percent were for VAT refunds. While the situation improved in 1999(when only 42 percent of audits were for VAT refunds), significant resources are being spent onthis task. Legal procedures that standardize and reduce the frequency of administrative actionand/or reduce the risk of fake invoicing can restrict the number of refunds. One option is to limitVAT refund rights, thereby forcing taxpayers to carry forward the unused VAT credits until thenormal business absorbs them, and then offering a yearly refund after 12 consecutive months ofnegative VAT balances. This option would need to treat genuine exporters and purchasers ofcapital goods differently. This approach has already been put in practice in some tax offices butshould be regulated in order to reduce the workload and allow auditors to focus their attention onmore cost-effective cases. The Revenue Department has tightened rules about making VATrefunds, and the liability of taxpayers for other taxes is checked before refunds are issued.
2.30. Another option would be to allow the tax administration to shift the VAT subject fromthe seller to the buyer, or from informal to formal sellers, by forcing a partial or total VAT
'°Technical assistance on transfer pricing issues is currently being provided by the Australian Tax Office.
Managing Tax Revenues 29
withholding pre-payment in certain transactions where "risky" taxpayers are involved. Thisauthority could be temporarily used in two cases. The first is partial or total withholding of VATto "risky" suppliers. The proportion to be withheld would need to be analyzed to allow thesupplier a reasonable estimate of his real costs and to prevent any bad use of exceeded debits.Construction suppliers using fake invoices are the most evident case in Thailand. If the taxadministration determines, for example, that the normal value added of sand suppliers is 50percent, a withholding rate fixed at 50 percent of the tax rate would offset input credits. Thispayment would be the responsibility of a better known taxpayer.
2.31. VAT prepayment for sales of certain goods to risky retailers is another way to shift theVAT subject and prevent evasion. In this case, the wholesaler of certain products that have beenidentified as 'evasion' risks must estimate or determine the final price of the good and pay notonly his own VAT balance but also the VAT of the next person in the VAT chain. If a pack ofcigarettes is sold by a wholesaler for Baht 100 to be retailed for Baht 200, the total VAT basedon the wholesaler's and the retailer's value added (i.e., Baht 300) must be paid by the knownwholesaler, thereby freeing the unknown retailer from any VAT obligation. Whether this optionwould be accepted by the business community must be assessed in considering the viability ofthis option.
Base Erosion and Tax Administration
2.32. Tax bases are also eroded when taxpayers exit the tax system by failing to register,underestimating their tax declarations, underpaying their tax liabilities, or stopping filing. Thiserosion is more prevalent during economic downturns, when taxpayers look for alternativesources of financing, including the non-payment of tax liabilities. Certainly tax arrears haveincreased significantly in the last three years, and it is reasonable to assume that the level of taxevasion has also increased during the crisis.
2.33. Measures of the level of non compliance and tax evasion are not readily available in mostcountries. Box 2.2 shows theoretical measures of the Revenue Department's effectiveness inreducing the gap between tax revenues collected and legally payable revenues. Formal estimatesof potential tax yield can only be obtained by econometric modeling or from analysis and surveysof industry sectors. Such studies have not been undertaken recently in Thailand. However,canvassing efforts by the Revenue Department in the last 12 months have detected 30,000unregistered VAT taxpayers, each with an annual tumover of at least Baht 600,000-indicating asignificant problem.
6. REFORMS UNDERWAY
2.34. The objectives of the tax administration reform underway as part of the Public SectorReform Program are to: (i) ensure adequate and sustainable revenue flows by strengtheningcollection enforcement and improving taxpayer compliance; and (ii) achieve a more equitabledistribution of the tax burden.
Strengthening Collection Enforcement
2.35. As a result of the economic crisis, tax debts have increased significantly. At the end of1996, total tax arrears were Baht 35 billion (0.7 percent of GDP), but by August 1999, these debtshad reached Baht 94 billion (about 2 percent of GDP). The difficulty in collecting tax debts also
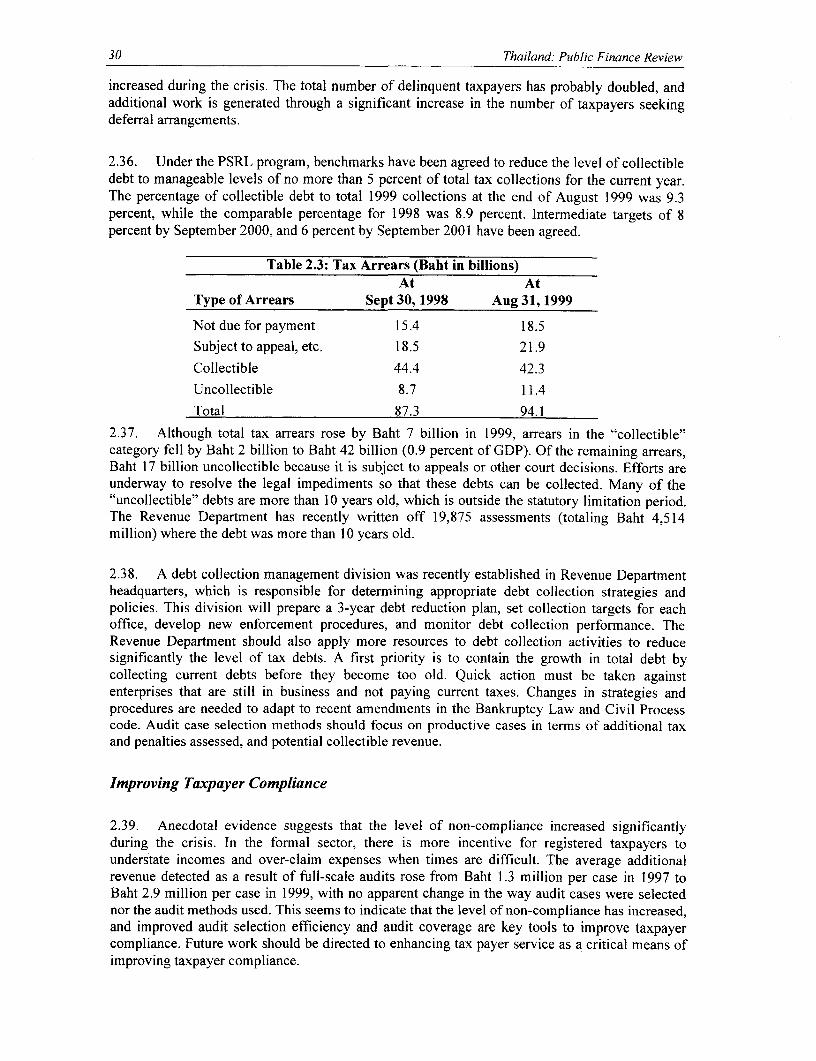
30 Thailand: Public Finance Review
increased during the crisis. The total number of delinquent taxpayers has probably doubled, andadditional work is generated through a significant increase in the number of taxpayers seekingdeferral arrangements.
2.36. Under the PSRL program, benchmarks have been agreed to reduce the level of collectibledebt to manageable levels of no more than 5 percent of total tax collections for the current year.The percentage of collectible debt to total 1999 collections at the end of August 1999 was 9.3percent, while the comparable percentage for 1998 was 8.9 percent. Intermediate targets of 8percent by September 2000, and 6 percent by September 2001 have been agreed.
Table 2.3: Tax Arrears (Baht in billions)At At
Type of Arrears Sept 30, 1998 Aug 31, 1999
Not due forpayment 15.4 18.5Subjecttoappeal,etc. 18.5 21.9
Collectible 44.4 42.3Uncollectible 8.7 11.4
Total 87.3 94.1
2.37. Although total tax arrears rose by Baht 7 billion in 1999, arrears in the "collectible"category fell by Baht 2 billion to Baht 42 billion (0.9 percent of GDP). Of the remaining arrears,Baht 17 billion uncollectible because it is subject to appeals or other court decisions. Efforts areunderway to resolve the legal impediments so that these debts can be collected. Many of the"uncollectible" debts are more than 10 years old, which is outside the statutory limitation period.The Revenue Department has recently written off 19,875 assessments (totaling Baht 4,514million) where the debt was more than 10 years old.
2.38. A debt collection management division was recently established in Revenue Departmentheadquarters, which is responsible for determining appropriate debt collection strategies andpolicies. This division will prepare a 3-year debt reduction plan, set collection targets for eachoffice, develop new enforcement procedures, and monitor debt collection performance. TheRevenue Department should also apply more resources to debt collection activities to reducesignificantly the level of tax debts. A first priority is to contain the growth in total debt bycollecting current debts before they become too old. Quick action must be taken againstenterprises that are still in business and not paying current taxes. Changes in strategies andprocedures are needed to adapt to recent amendments in the Bankruptcy Law and Civil Processcode. Audit case selection methods should focus on productive cases in terms of additional taxand penalties assessed, and potential collectible revenue.
Improving Taxpayer Compliance
2.39. Anecdotal evidence suggests that the level of non-compliance increased significantlyduring the crisis. In the formal sector, there is more incentive for registered taxpayers tounderstate incomes and over-claim expenses when times are difficult. The average additionalrevenue detected as a result of full-scale audits rose from Baht 1.3 million per case in 1997 toBaht 2.9 million per case in 1999, with no apparent change in the way audit cases were selectednor the audit methods used. This seems to indicate that the level of non-compliance has increased,and improved audit selection efficiency and audit coverage are key tools to improve taxpayercompliance. Future work should be directed to enhancing tax payer service as a critical means ofimproving taxpayer compliance.
Managing Tax Revenues 31
2.40. The number of potential taxpayers in the informal sector is difficult to measure but hasprobably grown as self employment likely increased commensurately with unemployment during
the crisis. Recent efforts by the Revenue Department under their new taxpayer canvassing
program achieved an 11 percent increase in the number of registered VAT taxpayers. These
taxpayers have minimum turnovers of Baht 600,000, indicating significant non-compliance withthe tax laws in the informal sector. To reduce the informal sector, requirements for business
registration should be strengthened to include tighter control over marketplaces and streetvendors. A national business registration system should be introduced, and all traders should be
registered before being allowed to trade. Marketplace managers should be required to providedesignated trading areas for each vendor, and ensure that all vendors are registered. More
stringent rules for record keeping should be introduced, and tax inspectors should be able to
impose fines for vendors if they do not keep proper records.
Box 2.3: Actions Underway To Improve Taxpayer Compliance
* Develop an audit strategy plan
* Identify legal changes to improve audits and target high-risk taxpayers
* Prepare user specifications for the taxpayer risk profile and audit case selectionapplications
* Design and implement an automated audit case selection system
* Support the Large Business Tax Administration Office in managing the largesttaxpayers
* Prepare proposals to reduce taxpayer compliance costs
* Simplify forms for Excise Tax and VAT
* Conduct promotion campaign to encourage tax payments through banks and other third
parties
2.41. At the end of the program period, reforms to improve taxpayer compliance are expectedto expand the number of registered VAT taxpayers, and to increase the additional revenue that iscollected through audit activities to 2.5 percent of total tax collections (or 0.5 percent of GDP).
The Large Business Tax Administration Office has been established and is currently handling the1,448 largest companies, and another 870 companies are expected to be added shortly. Thesecompanies are expected to pay more than 50 percent of total revenue collections.
Institutional Strengthening
2.42. The crisis highlighted weaknesses in the institutions responsible for formulating andimplementing tax policy. Institutional capacity to respond with strategies to diagnose and propose
new policies was weak. The quantitative basis to support decision making-notably timely andaccurate data, and systematic methods to assess the impact of changes in tax policies-wasgenerally unavailable during the crisis. The FPO has begun developing this analytical capability.
At the administrative level, the Revenue Department was unable to stem the immediate increasein tax arrears or curb the increase in evasion. It lacked the information to formulate a strategy and
identify those taxpayers. In order to develop a sustainable revenue base, the capacity of theseinstitutions should be strengthened over the next few years.
32 Thailand: Public Finance Review
2.43. Reforms should include improving the capacity of the FPO to support and take soundpolicy decisions based on forecasting models, surveys, and data analysis, and improving thecapacity of the Revenue, Customs and Excise Departments to administer their revenues andmonitor the behavior of taxpayers. This effort should lead to a reasonable and synergistic "Policy-Administration Mix" and the capacity to identify which policies or administrative tools should beused under different circumstances.
Fiscal Policy Office
2.44. Policy formulation has been built around several groups of academics, think tanks andexperts, and this is a sound approach. However, the MOF should enhance its technical capabilityto support and/or evaluate policy alternatives. The FPO should assume a deliberate taxpolicy/administration role to anticipate problems and forecast revenue behavior with enoughdetail to guide policy makers and tax administrators.
2.45. Following a recent review of administrative arrangements, the responsibility fordetermining tax policy has been transferred from the Revenue, Customs and Excise Departmentsto the FPO. The role of the FPO now involves analysis of revenue data and other statistics, andthey are developing forecasting models and sample surveys to predict the impact of tax changesat macro and micro levels.
2.46. A reorganization of the FPO may be appropriate to coincide with taking on theseadditional responsibilities. The current organization by tax may result in fragmentation,bureaucratization, and possible inconsistent policy formulation. Staffing and skill levels should beadjusted, and equipment and training requirements determined. By improving the knowledge baseabout the individual taxes and the revenue structure in general, and introducing the appropriatetechnology, the size of the office would not necessarily need to grow.
Revenue Department
2.47. It is necessary to strengthen the Revenue Department's institutional capacity by aligningbusiness and operational priorities with envisaged technological developments. Executivemanagement must work to integrate the institution and manage the process of change. Given thesize and complexity of tasks, top-down approaches to defining institutional strategies andprocedures should be a priority. This capacity building is underway with the support of the AsianInstitute of Technology. Formulation of a strategic plan, an IT master plan and subsequentbusiness plans will clarify the Revenue Department's direction in the intermediate future.
2.48. The RD has had significant and on-going implementation problems in developing itsInformation Technology (IT) system. Software applications have not been fully developed, andthe IT system has not delivered timely information to manage tax debts and detect non-compliance by taxpayers. The Revenue Department is working to develop and operationalize afunctional and integrated computer system. Operational requirements are that taxpayer data fromtax returns be input in a timely manner, system data will be available in the main RevenueDepartment offices when required on a need-to-know basis, taxpayer accounts will be fullymaintained by the system, the majority of audit cases will be selected by the system based onpreset criteria, and timely and useful management reports will be available on all aspects ofoperations.
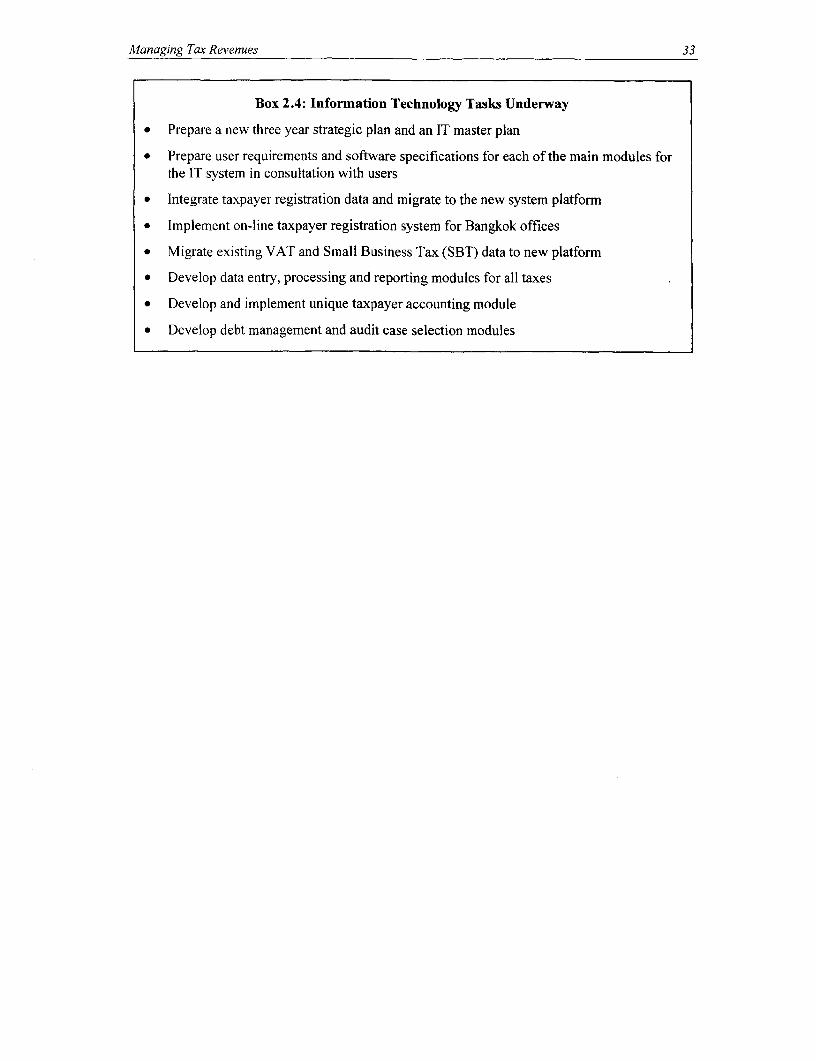
AManaging Tax Revenues 33
Box 2.4: Information Technology Tasks Underway
* Prepare a new three year strategic plan and an IT master plan
* Prepare user requirements and software specifications for each of the main modules forthe IT system in consultation with users
* Integrate taxpayer registration data and migrate to the new system platform
* Implement on-line taxpayer registration system for Bangkok offices
* Migrate existing VAT and Small Business Tax (SBT) data to new platform
* Develop data entry, processing and reporting modules for all taxes
* Develop and implement unique taxpayer accounting module
* Develop debt management and audit case selection modules
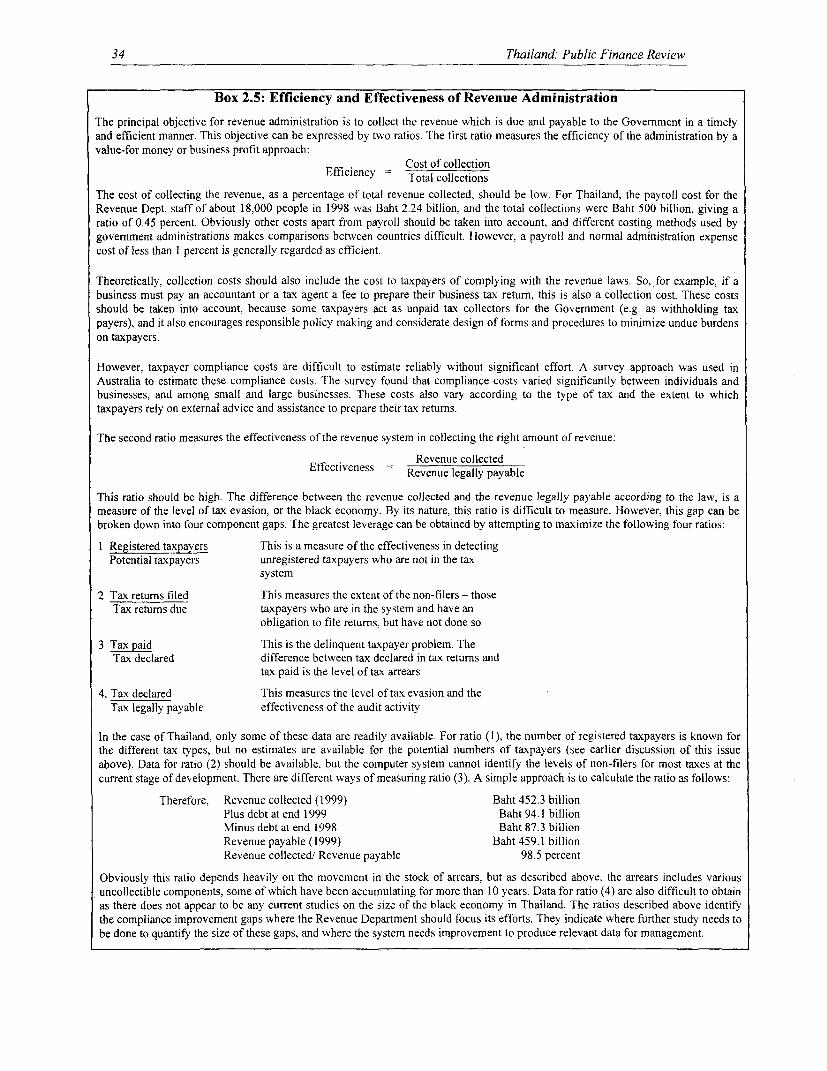
34 Thailand: Public Finance Review
Box 2.5: Efficiency and Effectiveness of Revenue AdministrationThe principal objective for revenue administration is to collect the revenue which is due and payable to the Government in a timelyand efficient manner. This objective can be expressed by two ratios. The first ratio measures the efficiency of the administration by avalue-for money or business profit approach:
Efficienc =Cost of collectionEfficiency = Total collections
The cost of collecting the revenue, as a percentage of total revenue collected, should be low. For Thailand, the payroll cost for theRevenue Dept. staff of about 18,000 people in 1998 was Baht 2.24 billion, and the total collections were Baht 500 billion, giving aratio of 0.45 percent. Obviously other costs apart from payroll should be taken into account, and different costing methods used bygovernment administrations makes comparisons between countries difficult. However, a payroll and normal administration expensecost of less than I percent is generally regarded as efficient.
Theoretically, collection costs should also include the cost to taxpayers of complying with the revenue laws. So, for example, if abusiness must pay an accountant or a tax agent a fee to prepare their business tax retum, this is also a collection cost. These costsshould be taken into account, because some taxpayers act as unpaid tax collectors for the Government (e.g. as withholding taxpayers), and it also encourages responsible policy making and considerate design of forms and procedures to minimize undue burdenson taxpayers.
However, taxpayer compliance costs are difficult to estimate reliably without significant effort. A survey approach was used inAustralia to estimate these compliance costs. The survey found that compliance costs varied significantly between individuals andbusinesses, and among small and large businesses. These costs also vary according to the type of tax and the extent to whichtaxpayers rely on external advice and assistance to prepare their tax retums.
The second ratio measures the effectiveness of the revenue system in collecting the right amount of revenue:
Revenue collectedEffectiveness - Revenue legally payable
This ratio should be high. The difference between the revenue collected and the revenue legally payable according to the law, is ameasure of the level of tax evasion, or the black economy. By its nature, this ratio is difficult to measure. However, this gap can bebroken down into four component gaps. The greatest leverage can be obtained by attempting to maximize the following four ratios:I Registered taxpayers This is a measure of the effectiveness in detecting
Potential taxpayers unregistered taxpayers who are not in the taxsystem
2 Tax retums filed This measures the extent of the non-filers - thoseTax retums due taxpayers who are in the system and have an
obligation to file retums, but have not done so
3 Tax paid This is the delinquent taxpayer problem. TheTax declared difference between tax declared in tax returns and
tax paid is the level of tax arrears
4. Tax declared This measures the level of tax evasion and theTax legally payable effectiveness of the audit activity
In the case of Thailand, only some of these data are readily available. For ratio (1), the number of registered taxpayers is known forthe different tax types, but no estimates are available for the potential numbers of taxpayers (see earlier discussion of this issueabove). Data for ratio (2) should be available, but the computer system cannot identify the levels of non-filers for most taxes at thecurrent stage of development. There are different ways of measuring ratio (3). A simple approach is to calculate the ratio as follows:
Therefore, Revenue collected (1999) Baht 452.3 billionPlus debt at end 1999 Baht 94.1 billionMinus debt at end 1998 Baht 87.3 billionRevenue payable (1999) Baht 459.1 billionRevenue collected/ Revenue payable 98.5 percent
Obviously this ratio depends heavily on the movement in the stock of arrears, but as described above, the arrears includes variousuncollectible components, some of which have been accumulating for more than 10 years. Data for ratio (4) are also difficult to obtainas there does not appear to be any current studies on the size of the black economy in Thailand. The ratios described above identifythe compliance improvement gaps where the Revenue Department should focus its efforts. They indicate where further study needs tobe done to quantify the size of these gaps, and where the system needs improvement to produce relevant data for management.
Public Expenditures and Development Outcomes 35
III. PUBLIC EXPENDITURES AND DEVELOPMENTOUTCOMES
1. INTRODUCTION
3.1 Thailand has achieved notable progress in allocating expenditures to its developmentpriorities. Public expenditures have helped achieve remarkable gains in such critical areas as thetransition rates to both lower- and upper-secondary school, the coverage of health care and thequality of road construction and rehabilitation projects. While budgetary resources expandedrapidly prior to the crisis, the crisis sharply tightened constraints, changed priorities and broughtabout a reallocation of budgeted expenditures in FY98 and FY99. Did institutional constraints onfiscal policy circumscribe the strategic prioritization of expenditures prior to and during thecrisis? How well have expenditure priorities been implemented, especially during the crisis?Given concerns for fiscal sustainability, what improvements can be made to enhance theefficiency and effectiveness of public sector resource use over the medium term?
3.2 This Chapter is divided into five sections. Section 2 considers the adequacy of the currentbudget presentation and examines shifts in the allocation of government expenditures in the fiveyears prior to the crisis. Section 3 analyzes the Government's budgetary response to the crisis.Section 4 reviews performance in four key sectors covered by the budget-education, health,agriculture and transportation/roads-and recommends improvements in the effectiveness of theGovernment's efforts. Section 5 summarizes the main conclusions and recommends potentialimprovements in government expenditures, which include:
* the importance of improved budget coverage and presentation to more effective publicexpenditure planning (addressed in more detail in Chapter IV);
* the weaknesses in establishing and implementing expenditure priorities, particularly duringthe economic crisis;
* the need to continue the rationalization of public expenditures in directions established beforethe onset of the crisis; and
* the scope for larger and more effective programs in key economic and social sectors througha better division of labor between the public and private sectors and the increased use of costrecovery.
The Sectoral Composition of Central Government Expenditures
3.3 Thailand's expenditure allocation among sectors has broadly reflected its developmentpriorities. By comparison with other middle income countries in the region and elsewhere (SeeAnnex Table Al 1), Thailand allocates a relatively large share of government expenditures toagriculture, transportation and communication, health and education. By contrast, less is spent ondefense, social security and welfare and general public services.
36 Thailand: Public Finance Review
2. TRENDS IN THE COMPOSITION OF GOVERNMENT EXPENDITURE
Figure 3.1: The Sectoral Composition of Government Expenditures
FY 1993 EduIOn FY 1997Education~~~~~~~~~~~~~~~~~Eucto
21%o Education22%Others
31% Otfs/ \33%
Public Health
Public Health
iSoCal Services
Dt ccDcbt servi _Debt service N a9nal teeurr i% Soia Serice12% -- and lnt peace Nation Social Seiccs
21% ad tt. pace 15%17%
Source: Mokoro (1999)
3.4 In Thailand, the five-year National Plan specifies development priorities but does notdefine budget allocations. The pronounced shift in the composition of central governmentexpenditure (see Figure 3.1 and Annex Table A12) over the period FY93 to FY97 was largelyconsistent with overall development priorities. Defense and debt service declined sharply as ashare of total expenditure, from 15.9 to 12.1 percent and from 11.9 to 4.7 percent respectively. Asignificant decline was also recorded in the agriculture share (1.6 points). The main sectorsbenefiting from these shifts (with their corresponding gains) are: social services (7.2 percent),education (1.4 percent), health (1.3 percent), and transport and communication (0.7 percent).
3.5 Social development is clearly the most important area of expenditure, with almost half ofactual expenditures accounted for by education, social services and health. Education accounts forthe largest share of government expenditures (25.9 percent in FY98), in line with the 8'h Plan'sfocus on strengthening human resource potential. The proportion of education expendituresrelative to GDP (4 percent) is low compared to the OECD average (5.4 percent). Social services,which are designed to protect vulnerable groups and the poor, are the second largest expenditurecategory. Its share rose rapidly from FY93 to FY97, but then declined during the crisis (12.4percent in FY98). The public health share is comparatively small (8.6 percent in FY98), and lowrelative to GDP (1.4 percent versus an OECD average of 5.4 percent). Despite the large share ofsocial expenditures, little systematic evaluation is done by budgetary authorities as to whetherthese social development expenditures achieve their stated objectives and have a real impact onsocial welfare and poverty alleviation.
3.6 Except for FY98, the composition of central government actual expenditures is very closeto those planned (see Annex Table A13). From FY93 through FY97, the actual shares for mostsectors were very close to those planned in the budget, with deviations generally less than 0.2percentage points. The major exceptions are in transportation, education, and national securitywhere budget shares deviate in some years by I percentage point or more. In FY98, deviationsfrom the budget grew substantially (due in part to the surge in encumbrance spending) therebylessening the reliability of the budget in indicating government spending intentions. The upwarddeviations for transportation and national security are very large and come at the expense ofgeneral services and debt service.
Public Expenditures and Development Outcomes 37
Economic Composition of Expenditures
3.7 Thailand's budget integrates recurrent ("current") and development ("capital") budgets,which are frequently separate in other countries. Annex Table A14 shows the breakdown of
actual expenditures into its recurrent and capital components. The share of capital expenditureshas risen from about 26 percent in FY93 to over 35 percent in FY98. Significantly, encumbranceshave a much higher capital component than ordinary expenditures (typically 75 to .85 percent,compared with only 25 to 30 percent), largely because the implementation of investment projectsis frequently delayed into the next fiscal year.
3.8 The rapid expansion of capital expenditures during the boom years was premised uponthe continued rapid growth of the Thai economy and public resources. It represented a sharpreversal of the expenditure restraint during the late 1980s which led to a slowdown ofinfrastructure expenditures. During the 1990s, substantial funds were allocated to infrastructureimprovements in roads, communications, and utilities, which should facilitate Thailand's long-term growth prospects. However, the experience of Bangkok's transport system-characterizedby inadequate planning, misprocurement, collusion among bidders for public contracts andunclear risk sharing with private sector investors--highlights concerns over the efficiency ofincreased investment.
3.9 With hindsight, the Government's attempt to feed the economic boom and addressinfrastructure bottlenecks with ever-increasing public investments of declining efficiency appearsmisguided. This suggests that an investigation at the sector level (especially for those capital-intensive sectors as shown in Table 3.1) would be in order to determine whether imbalancesbetween current and capital expenditure are growing and whether the operation and maintenanceimplications of capital expenditure have been adequately planned for.
Table 3.1: Share of Capital in Total Expenditure
Broad Groups Average Broad Groups AverageFY93- FY93-98,98 in in percent
percentMiscellaneous and Unclassified Items 1.2 General Public Services 27.3
General Government Services 11.1 Mining, Manufacturing, and Construction Affairs and 28.5Services
Community and Social Services 23.6 Total 30.3
Economic Services 72.4 Religious, Cultural and Recreation Affairs and Services 44.1
Functions Fuel and Energy Affairs and Services 54.4Miscellaneous and Unclassified Items 1.2 Agriculture, Forestry and Fishery Affairs and Services 58.8
Social Security and Welfare Affairs 2.0 Other Economic Affairs and Services 66.8
and ServicesDefense Affairs and Services 3.7 Housing and Community Amenity Affairs and Services 82.4
Public Order and Safety Affairs 13.6 Transportation and Communication Affairs and Services 88.7
Education Affairs and Services 16.3Health Affairs and Services 21.0Source: Mokoro (1999)
3.10 Fiscal adjustment in Thailand has largely been achieved through capital expenditures.The Government has only occasionally frozen wages (1982 to 1989). By contrast, publicinvestment has risen proportionately more than public consumption during fiscal expansion andvice versa during contraction. Public investment maintained a high and stable proportion of totalcapital formation relative to income during the 1980s. Warr/Nidhiprabha (1996:158) found thatpublic investment tended to be postponed if increasing private investment resulted in inflationary
38 Thailand: Public Finance Review
pressure on capital good prices, principally those used in the construction industry. However, thestrong inverse relationship in the ratio of public and private investment to GDP ended with theexpansion of public investment during the 1990s. Only since the 1999 economic stimulus has are-emergence of accelerated public investment been seen during a time of depressed, albeitrecovering, private investment.
3.11 Annex Table A14 gives the breakdown of government expenditure by object. Severalconclusions emerge: first, Thailand's wage bill as a share of total expenditures is relatively highin international comparison (Figure 3.2). In fact, over the past few years, the number of publicemployees has increased steadily. Personnel costs vary greatly among sectors, with a much highershare for wages and salaries in education than in transport and communications. Nonetheless,containing the rising costs of providing government services has become one of the key elementsof Thailand's efforts to reformthe civil service as part of its Figure 3.2: Wages and Salaries as Percent of Total Expenditure 1970-98Public Sector Management for Selected Asian CountriesReform Program. Second, the -(
increased share of wages and ------
salaries following the 1c C D
economic crisis (from 43 2
percent in FY97 to 52.5 . -
percent in FY98) serves as a -5 - - -
warning signal that the balancebetween personnel costs and _ I.-oncs Philip
support costs may becomemisaligned during periods of 97 06 9721 914 976 1978 1980 1982 1984 9-96 196 S990199 21 9941 9961 998
budget squeeze. Overall, with Source: The World Bank East Asia: Recovery and Beyond, 200030 percent of the annualbudget allocated to salaries andwages, 30 percent to capital expenditures, and 13 percent to subsidies, other operation andmaintenance expenditures needed to run projects are likely to be limited.
3. THE BUDGETARY RESPONSE TO THE CRISIS
Overview
3.12 As discussed in Chapter 1, the Government cut the budget in response to the crisis. Inthree rounds between August and November 1997, Baht 182 billion was cut (or nearly 20percent) of the budget originally proposed for FY98 (Baht 982 billion). Later in FY98, the budgetwas raised to Baht 830 billion, with projects aimed at mitigating the social impact of the crisis.
3.13 Figure 3.3 shows how the Baht 95 billion budget cut was allocated among sectors: 48percent of the reduction was in social services (mainly rural development), national security, andagriculture. Other sectors (e.g. transport, public health) show relatively minor cuts and theeducation sector received a small increase. Examination of the proposed FY99 budget, which issimilar in magnitude to FY98, shows a continuation of the same pattern, but with a sharp fall(Baht 15 billion or 19 percent) in the allocation for transportation and a large increase (Baht 31billion or 70 percent) in the allocation for debt service. Note, however, that during the crisis, off-
Public Expenditures and Development Outcomes 39
budget expenditures increased significantly, since foreign-financed packages, which wereprimarily targeted at shielding the poor, are not reflected in the budget.
Figure 3.3: The Budget Cut, FY97-98 Figure 3.4: Actual Government Expenditures,FY97-98, billion Baht
Social Services r
Public Health 48% Debt Service4% p
General Services ITransportation
Coum,muication Agriculture
6% ,'Transport and
Communications
Public Health
16% Ed ucat_ion
budgtedof n no 84o tho 200 250
Other spndng taal Secant o5% 21% *FY1998 FY1997
Source: Bureau of the Budget Source: Mokoro (1999)
3.14 In any event, the FY98 budget outcome was substantially different than planned (seeAnnex Table A14). Actual expenditures at Baht 882 billion were 6.3 percent higher thanbudgeted. As only 84 percent of the budget was actually implemented, the increase reflected asurge in encumbrance spending to 21 percent of total expenditures -- the highest proportion overthe period FY93 to FY98. Only actual debt service expenditures were less than the budgetedamount (by 50 percent). In some sectors, actual spending substantially exceeded budgetedamounts: transportation (19 percent); education (5 percent); public health (10 percent); socialservices (9 percent); and national security (19 percent).
3.15 Spending in FY98 was planned to be 9 percent lower than FY97, whereas actualexpenditures declined by only 3 percent. Comparing the overall share of governmentexpenditures for selected sectors in FY97 (a pre-crisis year) and FY98 (the first full year of thecrisis) reveals declines in social services, agriculture, and debt service. All other sectorsincreased, especially transport and communication (11.6 percent) and education (7.8 percent) (seeFigure 3.4).
3.16 It is remarkable that Thailand was very effective in protecting expenditures on health andeducation during the crisis. In fact, evidence suggests a remarkably agile and resilient response, atthe family and government service level.' The severity of impacts expected at the outset of the
crisis have not materializedfor health and education. During the initial stages of the crisis, it was
feared that government social programs would be cut back, that prices of key social commoditiessuch as imported medicines would escalate, that families would reduce drastically theirexpenditures for health and education, and that education and health services would be out ofreach to a growing number of impoverished families.
3.17 However, families and government programs acted to cushion the impacts of the crisis inhealth and education. Although precise targeting of the poor and unemployed proved difficult toaccomplish, government programs and budgets appear to have preserved or improved pre-crisisefficiency levels for costs and revenue. The Ministries of Education and Public Health adjusted
' For a full analysis, see World Bank (1999b)
40 Thailand Public Finance Review
expenditure priorities and supplemented sensitive programs to sustain service availability at orabove pre-crisis levels and to contain out-of-pocket costs to Thai families. At the same time,households rapidly and substantially adjusted their spending and savings strategies to cope with
less income security and to preserve health and
Figure 3.5: Percentage Change in education attainments. As a result, health andExpenditures, FY96-FY98 education outcomes have shown little or no
discernible declines from past positive trends.1 Discretio-y Essential Savings The use of public health and education services
,t = I expanded during the crisis, including basic5s --- C L--- * services, and school dropouts in particular0 °t _ r~ ̂- 1 show a limited or negligible crisis response
depending on the data source.
-201 3.18 Figure 3.5 presents the changes in
Expenditure household expenditure categories between-El~loor9a "on-poor 1996 and 1998 (before and during the crisis).
Source: Socio-Economic Survey. This graph does not capture the sharp decline
Notes: Total real expenditures remained roughly constant from 1997 to 1998 in total householdbetween 1996 and 1998. expenditure, but it does show how familiesCategory I includes expenditurcs on alcohol and tobacco, reacted to that decline, by reducing luxurv andhousehold goods, personal care and other luxury items.Category 2 includes clothing and footwear, transportation non-essential expenditures and increasing orand communications, and medical services. maintaining more vital expenditures. Notably,Category 3 includes food and shelter expenditures. basic education and health expenditures wereCategory 4 includes education, medical supplies, and fuel. . . .
preserved or expanded by Thai families.
3.19 Figure 3.6 presents two measures of health and education utilization: total public schoolenrollments through upper secondary for education and outpatient visits to Ministry of PublicHealth facilities. Both measures showincreases during the crisis. Such Figure 3.6: Use of Education and Health Servicesincreasing utilization, however, for I 0,100 120000
both sectors is a strong indication of 0,000 ,. _ oosospositive crisis response. Parents did not c 9,900 800
withdraw their children in large m 9,S00 C
numbers and continued to pay the costs O60000 9'
of education; and families expanded ,40their use of basic public health 90
services, perhaps to limit costs but . Iclearly to maintain health outcomes. 1994 1995 1996 1997 1995
Although the crisis responsemechanisms t health ad ,ed on --Total school enrollments -Outpatient visits
mechanisms in health and education Suc:OE n OHhave been effective, it is not clear thatthey were sufficiently targeted andsustainable over the long term.
Expenditure Prioritization During Budget Cuts
3.20 How did the Government prioritize its expenditures during the crisis? With hindsight,encumbrance spending mitigated the effects of budget cutbacks, which. raises questions about theGovernment's ability to implement its stated priorities. Part of the increase in unplanned
Public Expenditures and Development Outcomes 41
expenditure was in low-priority areas (e.g., national defense). Had these expenditures beencontrolled better, the Government might have maintained higher-priority expenditures ineducation and health, social services (especially rural development), maintenance expendituresfor highways, rural roads, and programs to raise agricultural productivity.
3.21 As for the actual expenditure prioritization, the cuts were by and large administered bythe Bureau of the Budget (BOB) in a top-down fashion. The criteria guiding the budgetary cutsand reallocations were that education, health care, and regional development were to be protectedas were those expenditures that would generate employment, competitiveness and long-runrecovery. Projects most likely to be cut had a high-import content, had not yet received Cabinet orNESDB approval, or had a relatively low priority in the 8th Plan. Other practical considerationsalso drove the cuts, such as projects that had not yet started or projects with annual rather thanmulti-year contracts.
3.22 The cuts were administered across the board with little evidence of strategic selection.For example, in the three ministries for which cuts were reviewed, fewer than 10 percent ofprograms were reduced. At the other end of the spectrum, managers were reluctant to defer wholeprograms: fewer than 5 percent of programs were cut completely.
3.23 In practice, the BOB shifted cuts Figure 3.7: Budget Cuts by M inistries
onto those ministries that had a history Allocation of the Budgct cut in 1998 and
D isb-rsemnent rates by M inistrvof low disbursements relative to budget D -
allocations. The pattern is remarkablyconsistent (see Figure 3.7): those that g /
spent a smaller portion of their budget in m
1996 were hit hardest. Indeed, after the 5second round of reductions (but 7-
excluding the last round of Baht 23billion), only two ministries had FY98 D.
allocations less than their FY96 actual * * 7Oe, S 19 907
expenditures: Finance (93 percent) and Source: Mokoro (1999)
Foreign Affairs (97 percent).
Externally Financed Social Programs
3.24 The social impact of the crisis has been well documented, and the need for socialprotection was evident at an early stage. Three important, externally financed packages targetedat social protection were introduced in the period from March 1998 to March 1999:
* The Social Sector Program Loan (US$500 million equal to 2.3 percent of the FY99 budget);
* The Social Investment Project (US$462 million equal to 2.1 percent of the FY99 budget); and
* The Miyazawa Expenditure Package (Baht 53 billion equal to 6.4 percent of the FY99budget.)
It is too early for a thorough evaluation of their impact, but preliminary analysis suggests, that
* The packages were significant in magnitude-representing more than 10 percent of the
Government's budget-and contributed to cushioning the poor from the crisis.
42 Thailand: Public Finance Review
* There was a trade off between implementation speed and targeting.
* The measures were primarily targeted at shielding the poor from the impacts of the crisis, but
they could have long-term implications on budget allocations.
The ADB Social Sector Program Loan
3.25 This loan was approved by the Asian Development Bank in March 1998, and in the samemonth the first tranche of US$300 million was disbursed, while the second tranche was disbursedin November 1999. The aim of the program was to mitigate the short-term impacts of thefinancial crisis, to promote structural reforms aimed at enhancing competitiveness through humancapital development, and to reduce inefficiencies in the provision of social services. The programfocused on three areas: (i) labor and social welfare, (ii) education and (iii) health. Key activitiessupported were: a scholarship fund to keep some 200,000 vulnerable and primary and secondarystudents in school; provision of health care to low-income voluntary health care holders; and theextension of health, disability, death and maternity benefits for laid off workers from six totwelve months. The program focused on health and education for low-income families, whichcould have a longer term impact on expenditure prioritization within these sectors. Based onseveral review missions, the ADB considers the impact of the program to be satisfactory.
The Social Investment Project (SIP)
3.26 The aim of the SIP was two fold: (i) responding to the crisis by creating employmentopportunities and providing essential social services to the unemployed and poor, and (ii)supporting bottom-up service delivery through financing locally identified and manageddevelopment initiatives and promoting decentralization, local capacity building and communitydevelopment. Accordingly, the project was established with two channels: Channel I supportingexisting government programs aimed at providing jobs and priority basic social services to theunemployed and poor, and Channel 2 supporting decentralization and community building byfinancing locally generated projects through the loan-based Regional Urban Development Fund(RUDF) and the grant-based Social Investment Fund (SIF). While this World Bank-fundedproject was well targeted, it was slow in disbursing. As of the end of FY9, US$74 million hadbeen disbursed out of a planned US$136 million. Delayed effectiveness (November 1998) andWorld Bank procurement rules installed to ensure transparent and quality projects, as well has thenature of the projects themselves-typically small and operated at the community level-slowedthe pace of disbursements.
The Miyazawa Package
3.27 In the fall of 1998, the Government launched an economic stimulus package consistingof expenditure measures, tax reductions, and measures to lower energy prices. The expendituremeasures placed priority on creating employment and increasing incomes for those severelyaffected by the crisis in both rural and urban areas. The tax measures emphasized stimulatingprivate investment and consumption by increasing disposable income and reducing the price ofconsumption goods. Measures to reduce energy prices were aimed at lowering the cost of livingand manufacturing.
Public Expenditures and Development Outcomes 43
3.28 As discussed in Chapter I, these expenditure measures were financed by externalborrowing which did not require Parliamentary approval. In March 1999, the Cabinet approvedthe borrowing of additional US$1.45 billion, the so-called Miyazawa package which consisted ofUS$600 million from the World Bank (EFAL II), US$600 million from Japan EXIM bank, andUS$250 million from the OECF. The objective was to spend the money quickly to stimulate theeconomy through job creation and productive investments while at the same time cushioning thepoor from the crisis and creating a foundation for future competitiveness.
3.29 To meet these objectives, an interagency committee comprising the Ministry of Finance,the BOB, and the NESDB compiled a list of expenditure programs that combined lists of "top-down" programs developed by the central agencies and "bottom-up" projects suggested by theline ministries. The official criteria used in selecting additional expenditure programs werereasonable, but difficult to implement in practice. All selected projects were intended to:
* directly alleviate the social and economic problems of targeted groups
* be executed and disbursed quickly
* directly benefit people, and induce higher economic productivity
* be implemented within the existing capacity of responsible government agencies
* be executed in a transparent manner and be easily monitored
* minimize the fiscal burden, especially on current expenditures in subsequent fiscal years
* already required to be implemented by the Government within the next 1-2 years by thecurrent Constitution or other laws and regulations.
3.30 According to these criteria, proposals by relevant government agencies and stateenterprises and the eventual selections of individual program were allocated to the followingexpenditure categories (see Table 3.2).
Table 3.2: Expenditures under the Miyazawa Initiative
Billions of Baht (unless otherwise noted) As of November 15th, 1999Total Planned Planned Disburse Amount used Used/Expend FY99 FY00 ments by agencies Disburseditures Expendit Expendit
ures ures
Investment and job creation aimed at alleviating the 24.8 21.1 3.7 24.2 21.2 87.6%social impact of the economic crisis
Improvement in the quality of life 9.6 5.6 4.0 8.2 3.1 38.2
Improvement in the foundation of economic 7.2 3.2 4.0 4.5 4.2 92.9development
Improvement in the competitiveness of manufacturing 2.3 1.6 0.7 1.8 0.7 41.4and export industries
Improvement in basic infrastructure and the 0.9 0.7 0.2 0.8 0.2 24.5development of specific areas
Enhancing the effectiveness of public administration 8.8 7.0 1.8 8.8 6.2 70.9
Total 53.4 39.0 14.4 48.4 35.7 73.8
Source: Bureau of the Budget
44 Thailand: Public Finance Review
• Investment and job creation aimed at alleviating the social impact of the economic crisis inaccordance with conditions mutually established by the Government and the lendingagencies. This category of programs/projects includes job creation for both educated andunskilled workers (expected employment of approximately 86,000 man-years of educated and400,000 man-years of unskilled workers), and investment to alleviate the impact on the poor,including expansion of welfare benefits especially for the elderly and students.
* Improvement in the quality of life through expansion of public health, water resourcemanagement, and pollution and environment management.
* Improvement in the foundation of sustainable economic development with an emphasis onminimizing the impact of the economic crisis on education, improving agriculture andmanufacturing productivity, and stabilizing commodity prices.
* Improvement in the competitiveness of manufacturing and export industries, including thedevelopment of technology for greater productivity, and facilitating restructuring in theindustrial sector.
* Providing development in specific economic areas, border areas, and remote rural areas withthe objective of supporting job creation and promoting economic activities in these areas.
* Increasing the effectiveness ofpublic administration, including improving the effectivenessof database management, increasing court and judicial resources, as well as supporting theestablishment of institutions required by the present Constitution.
3.31 Projects under the Miyazawa Program were intended to stimulate both consumption andinvestment. Approximately Baht 39 billion were planned to be disbursed in FY99, but only 85percent or 33 billion were actually disbursed. Investment and job creation were given highpriority and accounted for almost half of the allocation. Improved quality of life, promotion ofeconomic development and public sector effectiveness were also important criteria.
3.32 Almost all of the ministries received thefunds that they requested. Disbursement ratios Figure 3.8: The Miyazawa Package:.. >> . . - . . . . ~~~Composition of Approved Expendituresdiffer significantly across ministries, ranging FY99from 16 to 99 percent, with a remarkably high PMO Ot.r EH.-Ace W
overall disbursement ratio of 70 percent as of the 01 3m
end of FY99, and by November 1999, 48 out of 3U,e. a
53 billion baht had been disbursed to the I% TfiI_
ministries, and 36 billion had actually been spent '\
P&li H.0(see Table 3.2). By far the largest share was 6%
allocated to the Ministry of Interior, whichallocated the funds to tambon administrative Eeheadc.c
units (Figure 3.8). The Ministries ofTransportation, Agriculture and Education alsoreceived large allocations.
Source: Bureau of the Budget.
3.33 Short-term, employment creation effortswere successful: 65,223 educated employees (76 percent of target) and 3,546,645 workers (80percent of target) had been hired at the end of FY99. The 3.5 million workers employed wereequivalent to 319,182 man years (of 200 days), with an average employment length of 18 days.Targets to reach the vulnerable have generally been reached:
Public Expenditures and Development Outcomes 45
* 2,000 villages received training and financial support from Department of CommunityDevelopment poverty alleviation projects
* 30,000 farmers received loans for community investments, and projects to increase non-agricultural incomes have trained 1,094 farmers and 350 groups
* Projects to provide meal for children, pay allowances to senior citizens, establish seniorcitizens service centers, provide family support and welfare have been offered to 1,271,495persons and 35,000 households; 200 senior citizens service centers were established
* Baht 10,000 in financial support was provided to 990 AIDs-affected persons.
* 1,553 water supply system projects to expand the irrigation systems of govemment agencieshave been identified; 252 are being constructed and 211 have been completed
* 735 healthcare centers have been identified
4. PERFORMANCE OF KEY ECONOMIC AND SOCIAL SECTORS
3.34 This section reviews the performnance in four key sectors-education, health, agriculture,and roads-which together constituted about 49 percent of the FY97 budget. While necessarilyconstrained by space and time, the analysis in each case attempts to identify each sector'ssuccesses and challenges, emphasizing the three criteria of allocative and technical efficiency,public and private sector roles, and poverty orientation.
Education
Eff ciency of Spending
3.35 The education sector has by far the largest budget share and that share has expanded overthe period FY93 to FY97 from 21 to 22.4 percent of public expenditures. The relatively higherbudgetary share than is characteristic of other Asian countries reflects the relatively small privateeducation sector in Thailand. Fifty percent is spent directly on primary education, 25 percent onsecondary, and 17 on tertiary, while the remaining share cannot be broken down by level ofeducation. Performance in the education sector is notable for a number of impressiveachievements:
* a 91 percent enrollment rate at the primary level in 1997;
* an increase in transition rates to secondary level education from 53.7 percent in 1990 to 90.2percent in 1996 (transition rates to higher secondary education are also high, reaching 91.1percent in 1996);
* low disparities between male and female enrollment rates (with female rates actually higherat the secondary and tertiary levels), and
* a number of improved qualitative indicators (e.g. 93.8 percent literacy in 1995, high numberof qualified teachers, and decreasing repetition rates).
3.36 Despite these achievements, the education sector is beset by growing pressures, which theeconomic crisis has highlighted. Tight budget resources are combined with increased demands onthe education budget stemming from (i) an expansion of basic education from 9 to 12 years as
46 Thailand: Public Finance Review
required by the new Constitution; (ii) demands for improvement in quality as well as reorientationof upper secondary and tertiary education to improve economic competitiveness; and (iii) theloss of fees and parental donations resulting from the crisis. Identifying areas for budget saving istherefore critical.
Role of the Private Sector
3.37 The role of the private sector in Thai education is relatively low by internationalstandards-10 percent of enrollments at the primary and secondary school level in 1995 ascompared with shares in regional countries of 20 percent and up. The Government hasencouraged private schools through budget contributions, tax incentives and subsidizing interestfor investment at secondary and tertiary levels outside Bangkok. Despite such support, the shareof private students has been falling apparently due to control on tuition fees and the expansion ofpublic schools in urban and rural areas. Owing to budgetary constraints, the Government shouldconsider more carefully targeting its subsidies toward lower-income areas outside of Bangkok.Further, private sector entry could be encouraged by abolishing fee ceilings and allowingcompetition to control the rise in fees. Further cost savings could be achieved by encouraging themove of public universities to autonomous status, thus creating institutions that are moreresponsive to opportunities for quality improvement and efficiency gains and that would beencouraged to raise cost recovery above the present relatively low level of 10 percent.
Poverty Orientation
3.38 The Thai Government has made a strong commitment to expanding access to educationand the achievement of near universal access to primary education; high female enrollment ratesand innovation in outreach and non-formal education programs are testimony to their efforts.However the Government recognizes that disparities in coverage and quality continue to exist atall levels, especially between urban and rural areas. For example, the lowest enrollment rates andlowest transition rates are to be found in the Northeast, the poorest region of the country. Inaddition, university education favors the wealthy because subsidies are absolutely andproportionally higher at this level and students from poor families seldom make it that far.Increased cost recovery would provide increased funding for the university and would freeresources for support to poorer students and areas. The Government has introduced targetedfinancial support through the Student Loan Scheme, which covers students from low-incomefamilies in secondary and tertiary education. Since its introduction in FY96, it has expanded toBaht 18.3 billion in FY98.
Box 3.1 Recommended Education Expenditure Priorities
* Reduce the use of public resources by promoting university autonomy and increasing costrecovery (presently less than 10 percent of recurrent cost.)
* Control increases in recurrent cost by reducing excess teacher and increasing student/teacherratios.
* Reduce administration cost by rationalizing the number of oversight agencies anddecentralization of responsibility for education.
Public Expenditures and Development Outcomes 47
Health
3.39 The share of public spending on health care has increased from 6.5 percent in FY93 to7.8 percent in FY97 (1.5 percent of GDP, which is less than the 2.5 percent of GDP spent by theaverage lower middle income country.) The foregoing figures do not include governmentcontributions to the Civil Service Medical Benefits Scheme nor the Social Security program,which are the equivalent of about 25 percent of these expenditures and which, if included, wouldraise health to about 10 percent of the budget. About 75 percent of health spending is for healthcenters and for district/provincial/general hospitals and could be classified as curative care.Health expenditures in the budget exclude those expenditures financed by external loans andgrants; beginning in FY98, these have been significant, with US$1.2 billion from the AsianDevelopment Bank for the voluntary health card scheme and US$ 1 billion from the World Bankfor providing health coverage for the unemployed under the Low Income Health Card and forsupporting AIDS/HIV control (together these amount are equivalent to 3 percent of the FY98budget.)
3.40 Over 70 percent of the population is covered by various health insurance schemes, mostlypublicly financed with some participant contribution as well. The main schemes are: (i) LowIncome Health Card-for poor, elderly, children and others who receive free medical care; cardsfor the poor are means tested (44 percent of the population); (ii) Voluntary Health Card-freemedical care for near-poor households financed by a 500 baht contribution from participants andthe Government (coverage 10 to 20 percent of the population); (iii) Compulsory HealthInsurance-the medical benefits under the Social Security Scheme and Workman'sCompensation Scheme (10 percent of the population); and (iv) Civil Servants Medical BenefitsScheme-free medical care in public facilities and subsidized medical care in private facilities forcivil servants and SOE employees (10 percent of population).
3.41 Government expenditure on health has been increasing rapidly, both in real terms and asa share of budget. This trend reflects rising per patient costs as well as increasing access to healthcare. In spite of cuts necessitated by the economic crisis, demands are likely to grow due topressures to cover more groups and the needs to counter growing incidence of AIDS, cancer,heart disease, and occupational diseases. While the amounts on health care are not out of line withother countries, budget constraints will likely necessitate making better use of existing resources.
Efficiency of Spending
3.42 Improvements in the allocation and technical efficiency of the health budget requireactions in four areas. First, while the incidence of communicable diseases has been decliningsignificantly, the decline in the share of the health budget devoted to disease prevention andhealth promotion should be reversed. Immunization programs should continue to keep diseaseincidence low and a greater effort should be made to prevent the spread of "new" diseases (AIDS,heart, cancer, and occupational diseases) that account for an increasing share of mortality.Prevention and promotion measures are the most cost effective way to accomplish this. Central tothis effort is the need to strengthen the program of Primary Health Care as these centers are thefirst contact point for medical care. Second, reducing the share going to the government provisionof curative care should be considered. Given that insurance is available, substitution of publicprovision for services available privately brings little gain in social welfare. While privateprovision would raise government insurance costs, it would also make transparent hiddensubsidies in public provision and enable more effective targeting of subsidies. Third, while
48 Thailand: Public Finance Review
admirable progress toward universal health has been achieved, the various schemes differ interms of the kinds of benefits offered, the amount of subsidy per beneficiary and the way they arefinanced and run. Better targeting of subsidies is vital to equity objectives and to controllingcosts. Subsidies under LIHC and VHC are poorly targeted and these schemes are under-fundedresulting in poor services or in cross-subsidies from other service. At the same time, escalatingcosts across a number of schemes must be controlled through better information bases andimproved monitoring. Fourth, centrally imposed rules and regulations apply to public hospitalexpenditure financed both from the budget and from their own resources. Lack of flexibility inmanaging personnel and in responding to local needs is a source of inefficiency. Greater hospitalautonomy in the context of available management and an improved information system couldbring considerable cost savings.
Role of the Private Sector
3.43 Approximately one quarter of the health budget is spent on services that are usually agovernment responsibility on public good/ externalities grounds: disease control and prevention(e.g., vector control, vaccinations), health promotion, consumer protection, and research. Theremainder is spent on curative care: supporting three levels of medical facilities and makingcontributions to health insurance. Lightly regulated, private clinics and hospitals have expandedrapidly, although mostly in the urban areas. More expensive than subsidized public care, privatefacilities were registering 40 to 60 percent occupancy rates even prior to the crisis. If the privatesector can provide health service efficiently and effectively, there is little welfare gain from theGovernment providing curative care instead of just regulating and financing private care. Thusthere is a case for Government reducing its role in secondary and tertiary health care (notprimary) and concentrating its effort more on prevention and promotion, providing some fundingfor health insurance, and regulating private care and insurance.
Poverty Orientation
3.44 Government health expenditures generally favor the middle and upper-income classes.The bulk of curative expenditure goes for secondary and tertiary facilities which are located inmore urban areas and thus favor higher income classes. Government subsidies for healthinsurance vary from 150 baht per beneficiary for the Voluntary Health Card to 1,700 baht for theCivil Service Medical Benefit Scheme, with the SSS receiving about 900 baht. There is nojustification for the poor (LIHC) and near-poor (VHC) receiving the lowest subsidies andsubsidies less than one-third as high as those for social security. On the other hand, evidence fromother countries shows that expenditures for disease control and health promotion tend to favorlow-income groups; this strengthens the public finance argument for favoring these expendituresin the budget.
Box 3.2 Recommended Health Expenditure Priorities
* Increase allocations for disease control and prevention, and health promotion.* Reduce the budget share for secondary and tertiary health care while increasing it for primary care.* Give poorer provinces greater emphasis in receiving resources for curative care, especially primary
health care.* Continue moving toward universal coverage in health insurance.. Reduce the difference in subsidies per beneficiary between the various insurance schemes
* Improve the targeting toward less well off persons in LIHC and VHC.
Public Expenditures and Development Outcomes 49
Agriculture
3.45 Over the past 30 years, agriculture has expanded at a rapid though declining rate. Despitethe slowdown, growth in the first half of this decade at 3.1 percent per year still greatly exceedsthat of middle income countries (0.9 percent) or the world (1.3 percent). While its share in GDPhas been falling, agriculture still employs 50 percent of the labor force and about 80 percent ofthe population live in rural areas. Until the early 1980s, agriculture expansion depended onincreased area (as well as other natural advantages), but when land became a constraint,expansion continued through productivity increases (e.g. irrigation, research). In recent years, twoadditional constraints have emerged - labor increasingly moving to higher wage sectors, andwater as industrial and household uses expand.
3.46 To the Government's long-standing objectives of raising agricultural competitiveness, the8th Plan added (i) improved natural resource management for sustainable development, and (ii)human resource development to increase the capacity of farmer and institutions to compete in aglobal environment. Efforts to increase competitiveness largely through movement toward highervalue added crops have included crop price supports, use of subsidized inputs and credit, supportfor research and extension, and investment in irrigation and other infrastructure. While pricesupports were phased out in 1996 (only to be reestablished in 1999), the Government still usessubsidized inputs and credit to support selected crops that it considers to have good potential.
3.47 In 1996, the Government spent 1 baht for every 6 baht of value-added in agriculture,somewhat more than the average for developing countries. Public expenditure on agriculture,however, fell from 10 percent to 8.2 percent of central government expenditure between FY93and FY97 and were further during the crisis. Irrigation is by far the biggest agriculture budgetexpenditure, maintaining a share of about 45 percent over the period. Over the same period,expenditure shares going to extension nearly doubled while these for financial assistance tofarming institutions, cooperatives and farmers and to subsidies (owing to the ending of outputprice supports) fell sharply.
Role of the Private Sector
3.48 A major part of the agriculture budget is for the provision of public goods: research,extension, and infrastructure and its maintenance. In research, there is also a significant privatepresence, supplying just under-half of total expenditure. While the marketing of inputs andoutputs is largely in private hands, the Government has been involved in subsidized inputs andcredit, in conjunction with efforts to restructure agricultural production. Moreover, while pricesupport programs have fallen sharply from their 1995 peak, the Government still intervenes ininput markets. In general, the Government has not provided a market-failure rationale for subsidyprograms and various studies have questioned their contribution to output and income. At 5percent of the total agriculture budget, their continued role requires critical review.
Efficiency of Spending
3.49 The large share of irrigation in the agriculture budget reflects the emphasis given to it as ameans of raising productivity. However, a lack of attractive sites and concerns aboutenvironmental and social impacts has made future investments more problematic. Relative toexpansion investment, improvements in the management of scarce water resources have received
50 Thailand: Public Finance Review
insufficient attention, especially in view of growing competition with industrial and householduses and growing water disputes. As water is largely free, there are few incentives to conserve useby switching to crops or technologies that are less water intensive. Water rights are not clearlyestablished, resulting in frequent disputes and preventing a market in water rights as analternative to water pricing. A water management policy that stressed more efficient use wouldlikely lead to pressures for increased allocations for maintenance and pressures to shiftresponsibility to users.
3.50 Return migration to rural areas as a result of the crisis is likely to bring only temporaryrelief from labor shortages and more emphasis should be placed on research into labor savingagricultural technology. While the Government's plan to double the research share in the budgetis welcome, such monies could be leveraged by attracting private research partnership.Government policies have supported an overuse of pesticides which has reduced thecompetitiveness of Thai agriculture and led to pollution. Research into Integrated PestManagement should be supported, especially in view of lack of private sector interest and farmersneed to be given information and incentives to make the switch from pesticides.
Poverty Orientation
3.51 Since poverty in Thailand is largely a rural phenomenon, agricultural programs could inprinciple have a substantial poverty impact but there is little evidence of projects benefiting thepoor. Subsidized credit goes mainly to creditworthy farmers; poor farmers cultivate mainlymarginal rain-fed land and hence do not benefit from irrigation; and input subsidies likely go tomore well off farmers. The one agriculture program directed specifically at poor farmers, "TheRevolving Fund to Assist Farmers and the Poor" was designed to help with debt relief and landpurchase; it has not been funded since 1997. Two further funds-the Agricultural Land ReformFund (1975) and the Land Fund (1992)-are designed to help landless farmers obtain land and tohelp them obtain resources, including credit, to farm it. Both programs have similar objectivesand run similar schemes: both have high administrative costs and high default rates, suggestingthat the programs are not cost effective, they do not establish viable agriculture activities, and/orthat loan supervision is weak.
Box 3.3 Recommended Agricultural Expenditure Priorities
• Rationalize the use of subsidies, especially moving from crop-specific to general subsidies (e.g. credit).• Move from the provision of large-scale irrigation projects toward small reservoirs and dams and
improve delivery and maintenance (especially with user participation).. Gradually introduce water charges and establish water rights and water management legislation.* Increase research on labor saving technologies and Integrated Pest Management.
. Reassess the operation of the Agricultural Land Reform Fund and the Land Fund.
* Review the deep cuts in rural infrastructure projects in 1998 and 1999.
Transport/Roads
3.52 Annual growth in the transport sector budget has been very high, raising its share in thenational budget from 8.7 to 9.4 percent between FY93 and FY97. The national and provincialhighways were combined into a single national road system by the Highway Act of 1992. Whilethe expansion of the total system has been relatively modest (2.3 percent per year), the rate ofimprovement has been very rapid. The former national highway system is almost entirelyimproved and most roads have sufficient capacity, except for those radiating from Bangkok,
Public Expenditures and Development Outcomes 51
where congestion continues to necessitate significant lane increases and improvements. Theformer provincial network still requires significant upgrading mostly on rural access roads wherethere is sizable underdesign. While the bulk of highway financing comes from the budget, there isalso significant foreign donor financing of highways. The Government has also encouragedprivate financing when feasible, using build, operate and transfer (BOT) schemes and using tollson urban expressways and on the first inter-city motorway which opened in 1998.
3.53 The rural road system is extensive but most of the roads are of low standard, withrelatively low traffic volumes and impassable in the rainy season. Construction of rural asphaltroads has seen considerable expansion in the last five years, beginning from about 2,000 km. peryear in the early 1990s and reaching 7,000 km. per year in 1996 and 1997. Budgets forconstruction and maintenance grew correspondingly until 1997. Planning and implementation ofrural roads is the responsibility of two agencies in the Ministry of Interior-the Public WorksDepartment and the Office of Accelerated Rural Development. The latter began from an objectiveof countering communist insurgency, mainly in the Northeast, but has now adapted a nationalfocus. Both distribute funds according to the same formula; 25 percent is shared equally byprovinces and 75 percent is based on population, scarcity of roads and income (weight 60:30:10).
3.54 The Department of Highways (DOH) prepares Five-year Plans (latest 1997-2001) in thecontext of the National Plan. Given the breadth of programs in the National Plan, it is likely thatroad plans are driven mainly by traffic demands and the quality of proposals from DOH fieldoffices. Proposals are roughly prioritized based on economic criteria. Planning for maintenanceprojects has improved considerably with the development of a Pavement Management Systemand the World Bank's HDM III model for maintenance of asphalt pavement.
Eff iciency of Spending
3.55 Overall, highway programs are recognized to be well planned and managed. Preliminaryanalysis by the World Bank points to high returns on past highway projects and on roadrehabilitation and upgrading projects. Maintenance expenditures have increased rapidly both inreal terms and as a share of the budget. During the 7th Plan (which ended in 1996), maintenanceexpenditure actually exceeded plans by 17 percent; sharp cuts in maintenance as the result of thecrisis have reversed this trend, however. Highway spending has been characterized by sharpshortfalls of actual from planned spending and quite large carryovers from one five-year plan tothe next. While carryovers for lengthy road projects are somewhat understandable, they reducethe flexibility of spending programs to respond to new situations and changed priorities. Anadditional disturbing feature of the Highway Program is the rapid increase in "administrativeexpenditure" which exceeded planned levels threefold and amounted to 22 percent of totaloutlays (compared with the 8 percent planned).
3.56 While data on construction and maintenance expenditure in the rural roads program arereadily available (although it is included in the "rural development" and not in the transport partof the budget), it is difficult to get consistent data on performance indicators and hence difficult toevaluate the program. Preliminary analysis also reveals sharp differences in the share ofexpenditure going to construction and maintenance between the Public Works Department(PWD) and the Office of Accelerated Rural Development (ARD). It suggests that PWD is notproviding sufficient amount for maintenance. In addition, PWD and ARD have very similarprograms and operations; while coordination between them is reportedly good, there is no clearrationale for two programs. Criteria for allocation of rural road funds includes factors for low
52 Thailand: Public Finance Review
income and road deprivation. Although no study has been made, rural roads have likely had a bigimpact on job creation and on poverty; hence the recent cut backs, resulting from the crisis,should be reconsidered.
Box 3.4 Recommended Transport Expenditure Priorities
* Reverse the cutbacks in rural road construction as quickly as possible.
. Complete the Ministry of Interior's review of potential cost savings from merging the ARD and PWDprograms.
5. CONCLUSIONS
3.57 This review of budgetary expenditures over the last six years supports three broadconclusions. First, the budget document, as it currently stands, is inadequate for showinggovernment's intentions: important types of government expenditures are omitted and the neglectof carryforwards from past authorizations means that spending intentions-both levels andcomposition-are not fully presented. Second, priorities for reallocating expenditures, in responseto the economic crisis that began in 1997 appear to have been appropriate but surges inencumbrance spending led to a level and composition of actual spending that differed from thatplanned. The planned pattern of expenditure reductions was intended to mitigate the effects of thecrisis by protecting expenditures that impacted human resources, generated employment orsupported regional development while cutting back mainly national security and some lowerpriority projects in agriculture and social services. Notably, government programs in educationand health successfully cushioned the impacts of the crisis. However, because of encumbrancespending, spending in virtually all sectors exceeded budget plans; had the large surges in nationalsecurity and transportation been anticipated, more of the resources absorbed could have beenreallocated to crisis mitigation efforts. Third, over the past six years, budgeted and actualspending have moved in directions more consistent with government development priorities.Shares of the budget devoted to national security have fallen sharply while gains have beenregistered in the key sectors of education, health, social protection and transportation. However,as will be shown below, further improvements are possible.
3.58 In the future, changes in budget practices and continued reallocations of expenditures areneeded to increase the effectiveness of public expenditures in meeting the Government'sobjectives. Two improvements in budget practices are necessary. First, the level and sectoralcomposition of accumulated encumbrances should be taken into account in annual budgetpresentations; otherwise spending intentions from new authorizations simply understate theGovernment's true spending plans for the year. The BOB's present data collection practices allowfor the presentation of detailed information on encumbrances (although the BOB might need toimprove its ability to forecast spending from encumbrances). Second, the coverage of the budgetmust be expanded to include expenditures financed from foreign aid and borrowing and (at aminimum) a presentation of the amounts and sectoral allocations of extra-budgetary funds.Without this expanded coverage, the picture of central government expenditure activities isincomplete. Still further, it would be highly desirable to set the central government's activities inthe context of other government actors-most importantly, the state operating enterprises andlocal government. Such a "consolidated" picture of public sector activities will become all themore important as the responsibility of local government for key areas of service deliveryexpands. These recommendations are considered in greater detail in Chapter IV.
Public Expenditures and Development Outcomes 53
3.59 In spite of progress made in recent years, further improvements are needed. Key changesare essential both overall and in the four sectors examined in detail in this report. First, experiencesuggests strongly that past budgets in Thailand have been too large. The fact that, year after year,actual expenditures fall short of budget plans and that when spending from encumbrances andfrom the budget are considered, the combined total still falls short of budget projections suggeststhat the budget process does not resolve allocation conflicts among sectors within the context of atight overall budget envelope that represents the Government's true spending intentions. It furthersuggests that implementing agencies may not have the capacity to implement the budget(especially if potential encumbrance spending is also considered). Improved projections ofspending from encumbrances and from budget allocations consistent with estimates of likelyavailable resources would likely mean relatively smaller budget allocations each year, a higherproportion of each budget actually implemented and smaller carryforwards of unexpendedamounts each year.
3.60 Second, continued progress in reducing the share of defense in the budget will beessential to continuing the shift in allocations towards Thailand's development priorities.Thailand faces no unusual security threats and yet its allocations to defense still are above theaverage for low- and middle-income countries. Third, continued enlargement of povertyalleviation programs will be critical to further reductions in the population of poor persons and toproviding better protection against periodic downswings in the economy. This recommendation isconditional on improvements in the targeting of such programs toward persons who are actuallypoor, however. Previous Bank reports have found Thailand's anti-poverty programs inadequate insize and without an obvious focus on persons or areas that are poor. This Chapter finds that,although the amounts allocated to these programs are growing, the lack of focus remains with theregional allocations of both overall government expenditures and key social sector expendituresvarying inversely with regional and provincial per capita incomes. The Government should makeincreased use of geographical or self-targeting in making its allocation decisions.
3.61 Fourth, in view of the likely tightness of budgetary resources in the near term, it will becritical to rationalize the use of public sector resources by focusing them on areas where theGovernment has a critical role to play, by developing a better division of labor between the publicand private sectors, and by relying more heavily on mechanisms for cost recovery. A forcefulimplementation of the recommendations below is likely to mean that more effective and perhapseven expanded government efforts are possible in the four sectors without the need to reallocateexpenditures from other sectors. The key measures are:
* in Education: reduce the use of public resources by promoting university autonomy andincreasing cost recovery at that level; encourage greater expansion of private schools withany government support focused on lower-income areas outside Bangkok; use additionalresources freed up in this fashion to support quantity and quality expansions at the primaryand secondary level and to provide support for poorer students.
* in Health, increase allocations for "public goods" (e.g. disease control, prevention, healthpromotion); reduce allocations for secondary and tertiary health care while increasingthem for primary care and focus allocations on the latter toward poorer provinces; improvetargeting in the various card schemes while expanding the coverage of health insurancesystems.
* in Agriculture, expand funding for "public goods" (e.g. research, extension, and ruralroads); move from larger irrigation projects to smaller dams and delivery systems;withdraw from input and output subsidy/price support programs which help mainly rich
54 Thailand: Public Finance Review
farmers; gradually introduce water charges and/or establish water rights so that watermarkets can develop.
* in Transport/Roads: continue support to important public goods by reversing the cutbacksin road maintenance and rural road construction as quickly as feasible.
Reforming Thailand's Expenditures and Risk Management 55
IV. REFORMING THAILAND'S EXPENDITURE ANDRISK MANAGEMENT
1. INTRODUCTION
4.1 Many of the components of a modern, performance-based, budget management systemalready exist in some form in Thailand. The strengths of the current budget process have enabledthe Government to perform well, most notably in managing aggregate fiscal discipline. Asdescribed in Chapters I and III, the Government consistently ran surpluses in the years prior to theonset of the economic crisis. However, the highly centralized, control-oriented process createddisincentives for using the budget process to empower line agencies and local governments toincrease the efficiency, effectiveness and equity of expenditure programs.
4.2 Thailand has launched a comprehensive expenditure modernization program that willaddress many of these shortcomings. Its intention is to design and implement gradual reforms thatwill ultimately modernize Thailand's expenditure management so that it promotes betterperformance and transparency. The Government has also recently established a Public DebtManagement Office (PDMO) that is responsible for managing the Government's liabilities.
4.3 This Chapter first reviews the institutional arrangements in support of expendituremanagement functions. While these arrangements have served Thailand well in the past, theymust be modernized to support the performance-based environment that is the foundation of theexpenditure reform program. The final section of this Chapter reviews the fiscal risks facing theGovernment and examines the role of the PDMO.
2. OVERVIEW OF FISCAL INSTITUTIONS
4.4 A sound public expenditure management system should achieve three, key objectives. Itshould:
* discipline fiscal policy,
* facilitate the allocation of resources to strategic priorities, and
* regulate agencies for effective and efficient public service delivery.
4.5 The Bureau of the Budget (BOB) is a key actor in building such a public expendituremanagement system in Thailand, with responsibility shared among the National Economic andSocial Development Board (NESDB), the Ministry of Finance (MOF), and the BOT (BOT). Asignificant responsibility of this "Gang of Four" is in establishing the macroeconomic frameworkfrom which aggregate expenditure ceilings are determined. Other fiscal roles of these and otherexecutive agencies are described in Box 4.1.
56 Thailand: Public Finance Review
Box 4.1. Roles of Executive Agencies in Fiscal Decision Making
* The BOB is primarily responsible for preparing the recurrent budget, and it formulates annualallocations for multi-year projects
* The NESDB is responsible for long-range planning and the development (i.e., investment)budget, for approving multi-year projects that are proposed by line agencies, and forprojecting the macroeconomic outlook
* The MOF exercises general budget control
* The Fiscal Policy Office (FPO) processes externally-financed projects and also externalborrowing (a function that is being assumed by the newly established Public DebtManagement Office - PDMO)
* The CGD controls government accounts, cash flow projections and domestic borrowing(though this function is being transferred to the PDMO)
* Debt is managed by a committee that includes the FPO, the Revenue Department (RD), theBOB, the NESDB and the BOT, and will soon be managed by the PDMO
* A consortium of agencies projects revenues, with the MOF deterrnining the final forecasts
4.6 In disciplining fiscal policy, the BOB shares responsibility with the FPO and CGD, theNESDB and the BOT. Although it has a key role in arguing for an extension of the focus of fiscalpolicy beyond the "cash flows of central government" to the "financial position of the whole ofgovernment" and in drawing attention to contingent liabilities, the ultimate responsibility forfiscal policy rests with the MOF.
4.7 The BOB's primary responsibility is facilitating the allocation of resources to strategicpriorities. The BOB is the pivotal actor between the Cabinet, line ministries and programmanagers for facilitating the allocation of resources to strategic priorities. As part of the reformprogram, the BOB now has the opportunity to adopt a results-oriented approach to the budgetformulation process, to extend the coverage of the budget, to redefine the reporting requirementsof line ministries and program managers and to redefine its role in this responsibility.
4.8 In regulating the efficiency and economy of agencies' service delivery, the BOB sharesresponsibility with the Office of the Civil Service Commission (OCSC) and the CGD. The recentpassage of the Autonomous Public Organizations (APOs) bill and creation of a new type ofservice delivery organization presents an opportunity for the BOB to redefine its regulations foreffective and efficient service delivery.
3. WEAKNESSES iN THAILAND'S EXPENDITURE MANAGEMENT
Budget Preparation
4.9 Planning and budgeting processes are not well integrated. The NESDB is oriented towardapproving multi-year projects without regard to budgetary implications while the BOB is focusedon annual expenditures without full consideration of long-run costs. In addition, the budget policyguidelines that are provided to spending agencies are not directly related to the sectoral prioritiesreflected in the National Development Plan. Coordination among major agencies in budgetplanning is also generally weak. Revenue projections are not well synchronized with thedetermination of the budget ceiling nor budget allocations. There is little coordination indeveloping the capital budget that is financed internally with that financed by donors.
Reforming Thailand's Expenditures and Risk Management 57
4.10 At present, budget planning does not take place within a formal, medium-termframework. With an annual budget framework, government agencies have little assurance aboutresource availability beyond one year, which creates uncertainty about resources and impedesplanning. Moreover, it complicates the consideration and funding of new projects: will resourcesbe available to fund them (especially if they are multi-year) and have the operation andmaintenance funding implication of such projects (and ongoing projects which are also beingimplemented) been estimated?
4.11 Forward estimates of development expenditures are published in budget documents.However, they appear to be of variable quality and they are not regarded as robust forwardestimates for BOB analysis and planning purposes. Forward estimates for other components ofexpenditure are not available. More realistic budgetary planning would require that plans forspending carryovers from past budgets be included in budget plans and that expenditure plans betailored more carefully to the actual implementation capacity of government agencies. Twoimportant benefits would be gained from more accurate tax and expenditure plans. First, thebudget would provide a clearer picture to market participants in the real and financial sectors(both domestic and international) of the Government's actual spending intentions and fiscalstance, which would enhance the "credibility" of government policy. Second, the budget wouldprovide a firmer basis for planning and managing government expenditures, both in the aggregateand for individual sectors.
4.12 Prior to the current budget reform, Thai budget processes were strongly centralized by thestandards of well-performing countries. For each work plan and project, separate budget ceilingswere provided for up to seven different categories of operating costs. Since there are normallymany work plans and/or projects in a single programn, the number of separate budget ceilings fordifferent cost components within a single program was often very high. This input focuscompromises the effectiveness of the budgeting process in several respects:
* limited flexibility of program managers to direct budget funds to those uses that will generatethe highest returns for their programs
* inadequate justification for new project proposals and project selection
* limited project monitoring, other than through the cash allotment process
* lack of systematic re-prioritizing between the baseline recurrent budget and new policyproposals.
4.13 During the agency budget request phase, budget analysts play a limited role in assistingline ministries and departments in preparing the analysis of agency budgets. The budget analysts'activities focus on manual processing to ensure that the numbers presented by agencies are withinthe budget ceiling and the arithmetic is correct. This over-attention to line-item details comes atthe expense of attention to larger policy issues that determine the Government's overall fiscaldirection and strategy.
4.14 Although the Thai budget is set up by program areas (e.g. education, transportation) andthese programs are linked by common themes, they are not cost centers; they are implemented bymany different agencies and often across several ministries; and no single manager is accountablefor program outcomes. Hence, the budget structure is essentially used for line-item budgetingwhich fosters micro-management and control over details but which offers little assurance aboutwhether progress toward government objectives is being achieved. The structure is based on aconventional coding system used by several countries, which allows budget information to bereported consistently at all levels.
58 Thailand: Public Finance Review
4.15 As noted in Chapter III, budget coverage is incomplete. Many extra-budgetary activities,including externally-funded investment projects and other activities (such as those of localgovernments) are not included in the budget. Some 66 extra-budgetary funds exist under thejurisdiction of various ministries whose expenditure activities are included only to the extent thattheir expenses are partly covered by transfers from the budget. In addition, quasi-fiscal activitiesconducted by the central bank and state enterprises (e.g., subsidized lending, business rescueoperations, exchange rate guarantees, subsidized exchange risk insurance, below-cost charges,etc.) are not disclosed. Similarly, tax expenditures and contingent liabilities are not disclosed.Expenditures financed by foreign aid or foreign borrowing are not included in planned nor actualbudget expenditure. A crude estimate of the size of foreign financing and extra-budgetaryactivities suggests that their inclusion would increase the size of FY97 actual budgetaryexpenditures from about 19 percent to 21 percent of GDP.
Budget Adoption
4.16 For oversight purposes, the Parliament does not have good and timely information on theeconomic and fiscal impact of budget policies. Furthermore, the line-item information provided inBOB budget documents invites micro-management questions from the Parliament. Informationsuch as macroeconomic and revenue reviews, projected deficit levels, budget ceiling calculationsand rationales for sectoral priorities, foreign and domestic loans for government agencies andstate enterprises, debt management issues, development and performance of multi-year projects,etc. are either absent or not delivered in a timely fashion during the parliamentary deliberation ofthe budget.
4.17 Parliamentary budget review is a largely a passive process. The Parliament dependscompletely on the executive branch for information and staffing during the budget adoptionprocess. Information is provided by either central or line agencies. During the budget session, theBudget Scrutiny Committee is staffed by the executive branch. The MOF serves as the Chairman,the BOB Director as secretary, and BOB budget analysts as fiscal staff.
4.18 The parliamentary process is limited to the central budget only. Projects involvingexternal loans or foreign assistance (e.g., infrastructure or social adjustment loans) bypass thenormal legislative process. These projects are approved by the Cabinet, then processed by theBOB and subsequently reflected in budget documents.
Budget Execution
4.19 The budget execution process is highly fragmented. The allotment process is in manyways a commitment authorization, which precedes the contract or commitment stage. Theallotment process also appears to be a second attempt at budget preparation, to more thoroughlyreview and confirm expenditure proposals that were already approved or budgeted, but whichwere not adequately developed when the budget was prepared. The CGD's practice ofreplenishing department accounts on a transaction-by-transaction basis runs contrary toestablishing and enforcing financial management standards.
4.20 The complex and time-consuming transfer system appears to have been generated toaccommodate the detailed appropriation structure. There is little flexibility within theappropriation structure for managers to re-deploy funds to accommodate changing circumstances,without applying formal rules to ensure that legal requirements and associated record keeping iscorrect.
Reforming Thailand's Expenditures and Risk Management 59
4.21 The carry-over process for small expenditures, where invoices have been received, isconsistent with a modified accrual accounting approaches. However when the process is appliedto larger amounts (either from projects or capital contracts) it means that expenditure in any oneyear applies both to that year's budget and previous years' budgets. The ability to carryoverappropriated funds presents another opportunity to correct deficiencies in earlier budget analysisstages. The sequential process of preparation, allotment and carryover provides a mechanism forcentral agencies to progressively scrutinize and correct inadequate project preparation, and tointroduce proposals into the budget which, at the time of budget preparation and fundingapproval, were inadequately developed. This approach fragments budget control and budgetpriority setting, since the budget preparation process sets priorities for the budget year at the sametime that Cabinet separately sets priorities for carryovers into the budget year.
4.22 There is no institutional mechanism for a mid-year review of economic assumptions andfor adjusting revenue and expenditure levels relative to the original budget request. Such amechanism could potentially avoid unfundable expenditures at the beginning of a new fiscal year;and last-minute budget cuts due to revenue shortfall at the end of the fiscal year.
Monitoring, Evaluation and Audit
4.23 Although an evaluation system is in place in the Evaluation Office of the BOB, it focuseson compliance issues rather than examining the cost effectiveness of program outputs andoutcomes. In addition, the links between the Evaluation Office and the Analysts Officesresponsible for individual ministries are weak.
4.24 Budget documents include physical output levels for each work plan as well as associatedfinancial allocations. However, these physical output levels are not used as a control device inbudget execution, because the BOB does not measure outputs. Since this physical and financialinformation is not linked to activity costing, it is impossible to ensure that budget funds are usedeffectively.
4.25 Program activities are not systematically reviewed. Projects and work plans havegenerally been continuously and incrementally funded, without systematic and periodicevaluation and review. As such, their use for budgeting purposes, their performance, theirhistorical funding trends, their service delivery capabilities, and the quality and usefulness of theirservices are undocumented. Moreover, due to the lack of clear definition, projects and workLANs, have in some cases gradually become "accounting conveniences" for storing specific ormiscellaneous accounting information. Little feedback exists between program evaluation and theNational Development Plan. As a result, inforrration on program effectiveness is notsystematically used to modify development plans.
4.26 The BOB does not have an adequate information technology system to support thebudget process. Furthermore there is no IT connection between BOB for budget preparation,Parliament for budget adoption, and the CGD for budget execution and monitoring. Without acomputerized system to track budget account balances, it is not technically feasible for the BOBto have up-to-date knowledge of budget and fund balances.
4.27 To ensure accountability for resources used, and to determine the efficiency andeffectiveness of programs relative to government priorities, monitoring, evaluation and auditshould be integrated to provide a coherent framework for analysis and evaluation of governmentactivities. Outputs from these processes should feed into the budget process to ensure that lessonslearned during program implementation are reflected in future financial allocations and thatmethods for meeting priorities are optimized. To ensure this feedback, internal audit should being
60 Thailand. Public Finance Review
responsive to agency heads, the evaluation process should be designed to guide resourceallocation, and external audit activities should be reported separately to the Parliament as a meansof insuring accountability.
4.28 Relative to this framework, the present Thai process displays some shortcomings. First,the Office of Auditor General (OAG) reporting structure is inappropriate. Prior to the revisedAudit Act, the OAG reported to the Prime Minister, which is inconsistent with best practice forexternal audit conducted by a Supreme Audit Institution. Second, the audit of individual agenciesis incomplete. The process of auditing receipts and expenditures of individual agencies does notaddress the fundamental requirement to audit the performance of an economic entity inconducting its business--which is largely due to the incomplete financial reporting requirementsspecified for agencies. Internal audit activities are directed toward providing audit facilities andreports to external agencies for accountability purposes. This is inconsistent with an internal auditfunction which is designed to advise and assist management to meet its compliance obligations,and to perform more efficiently. In this sense there is a conflict of roles assigned to the internalauditor.
4.29 Ex post evaluation is limited to capital projects. The evaluation process addresses projectperformance issues, but does not cover on-going nor recurrent budget activities. To this extent, alarge component of government expenditure is not systematically evaluated for effectiveness,efficiency nor to confirm continuing relevance.
Fiscal Transparency
4.30 The IMF defines "fiscal transparency" as follows:
"Fiscal transparency means being open to the public about the structure andfunctions of government, fiscal policy intentions, public sector accounts, andfiscal projections... Fiscal transparency strengthens accountability and ... cantherefore enhance credibility, the benefits of which will be reflected in lowerborrowing costs and stronger support for sound macroeconomic policies by awell-informed public."
4.31 The Fiscal Transparency Code is based on four general principles: (i) clarity of roles andresponsibilities; (ii) public availability of information; (iii) open budget preparation, execution,and reporting; and (iv) independent assurances of integrity. Responsibility for promoting theseprinciples is shared among numerous fiscal agencies in Thailand, including the MOF, BOB,CGD, NESDB, OAG, and the BOT.
4.32 Generally there is a clear separation of the predominantly noncommercial activities ofgeneral government from the rest of the public sector and the private sector so roles andresponsibilities are defined clearly. The Thai Government is highly centralized, with sufficientpowers allocated to executive central agencies to control fiscal aggregates. The organizationalboundaries between the three major, executive agencies that share the powers of fiscalmanagement - the NESDB, the BOB, and the MOF - are very clear, each regulates a differentdomain and these domains are well harmonized across fiscal management processes.
4.33 At present, fiscal transparency in Thailand falls short of international good practices onthe three other general principles:
* Public Availability of Information The key principle is that the public should be providedwith full information on the government's past, current, and projected fiscal activity. As
Reforming Thailand's Expenditures and Risk Management 61
noted in Chapter III and above, in Thailand, neither the budget nor the public accountspresent a full picture of government finances.
* Open Budget Preparation, Execution, and Reporting. The major weakness is in thespecification of fiscal policy objectives, macroeconomic framework, the policy basis andmajor fiscal risks. As noted above, the scope of fiscal planning is narrowly focused on centralgovernment budget and excludes all off-budget fiscal operations and the fiscal planninghorizon is only for one year.
* Independent Assurances of Integrity. Problems arise in micro accountability mechanisms;particularly in the procedures and reporting of off-budget operations. At the entity level, thelack of a common accounting system that covers all entity operations (especially off-budgetoperations) distorts financial accountability. Organizations face many complex regulations,and various regulators try to regulate different financial management environments for thesame entity. In addition, the modified cash accounting base excludes contingent liabilities andpublic assets, and government accounting systems are not integrated.
4. STRATEGIES FOR REFORMING EXPENDITURE MANAGEMENT
4.34 As described above, in the past, Thai public organizations have exhibited low levels offinancial and performance accountability. Budget formulation processes are being reformed toprovide performance incentives by granting greater budgetary flexibility to public organizationsin return for improving their performance and financial management systems. Reforms of publicreporting frameworks are also critical to improve the fiscal and financial transparency at all levelsof government. Over the next few years, and as part of the Public Sector Reform Program, theGovernment has committed to: (i) improve the capability of strategic planning of sectorministries, (ii) introduce performance-based budgeting for line ministries, (iii) strengthen thecapability of central agencies to review and evaluate sector policies and performance, (iv)improve fiscal transparency, and (v) establish a medium-term fiscal strategy..
Improve the Capability for Strategic Planning of Sector Ministries
4.35 A key to promoting better resource allocation is the establishment of strategic resultsareas and key results areas for each ministry. A ministry must have a clear vision of its role,which depends in part on the Govemment's overall vision for the public sector. Strategic resultsareas are medium-term objectives for the public sector that contribute significantly to theGovernment's longer-term policy goals and objectives. Establishing a corporate plan that includesthe vision and mission statements along with key results areas and performance indicators willenable ministries to specify clear strategies for moving towards a results-oriented public service.
4.36 The reforms begin by identifying strategic priorities across the Government: keyministries, departments and public organizations will be required to produce strategic plansshowing their objectives and desired outcomes, outputs, performance standards, managementplans and resource requirements. These plans will be published and disseminated widely. Centralagencies will review these strategic plans as part of the budget formulation process to determinewhether they reflect the government-wide priorities and whether they are well prepared.
Implement Performance-Based Budgeting for Line Ministries
4.37 The core objective of expenditure management reforms in Thailand is to delegate thenecessary flexibilities in resource use to managers at the service delivery level combined withimprovements in their financial and performance management (see Box 4.2). These flexibilities
62 Thailand: Public Finance Review
apply to the management of both financial and human resources, and the performance budgetingreforms that the Government has initiated must be closely coordinated with the Results BasedManagement initiatives underway in the Office of the Civil Service Commission's reformnprogram, as part of the overall public sector management reform program.
4.38 Once strategic plans have been reviewed, Resource Agreements (RAs) will be formedbetween the central agencies and line ministries where, for a given level of resource allocationand flexibility, the expected performance of a line ministry will be clearly defined and agreedupon. This RA provides the foundation for a new budget formulation process that focuses not oninputs but on outcomes and outputs. Central agencies would gradually devolve detailed line-itemcontrols to line ministries, monitor their performnance and hold them accountable for results.Management reforms within the line ministries would shift the management culture from"compliance" to "managing for results."
4.39 Improving the management of outputs and outcomes rather than input controls reliesprimarily on a shift toward performance. The BOB has defined a new "flexibility andaccountability" framework for sector ministries. Implementing this framework will involve threechanges to current budgeting arrangements:
* The BOB will 'broad band' existing, highly detailed line items in the budget (work plans andobjects of expenditure) to grant line ministries greater freedom in spending the funds they areallocated.
e In this more devolved environment, line ministries will develop greater responsibility for pro-actively improving their program outcomes. However, broad-banding line items in the budgetdoes not itself ensure that line ministries will actually re-prioritize their actions. It is likelythat a performance focus within line ministries will develop only slowly after financialdecontrol, increasing rather than reducing the possibility of waste and misuse of budget fundsin the de-controlled environment.
* Financial decontrol for individual spending agencies will therefore take place only when'threshold' financial control and performance reporting systems are in place in the agency(i.e. a 'hurdle' approach to financial decontrol). The hurdle approach provides both anincentive to line agencies to improve their management (in order to win the benefits offinancial decontrol by BOB) and a safeguard against misuse of the new freedoms.
4.40 The performance-based budgeting framework includes:
* clear rules for sector ministries to allocate resources to service delivery organizations
* principles, standards and guidelines issued by central agencies to implement sound financialmanagement systems at the service delivery level
* performance reporting requirements for service delivery units covering objectives, successfactors, performance indicators and service standards
* capacity building activities in BOB to improve its capability to monitor, review and evaluateperformance and analyze policy.
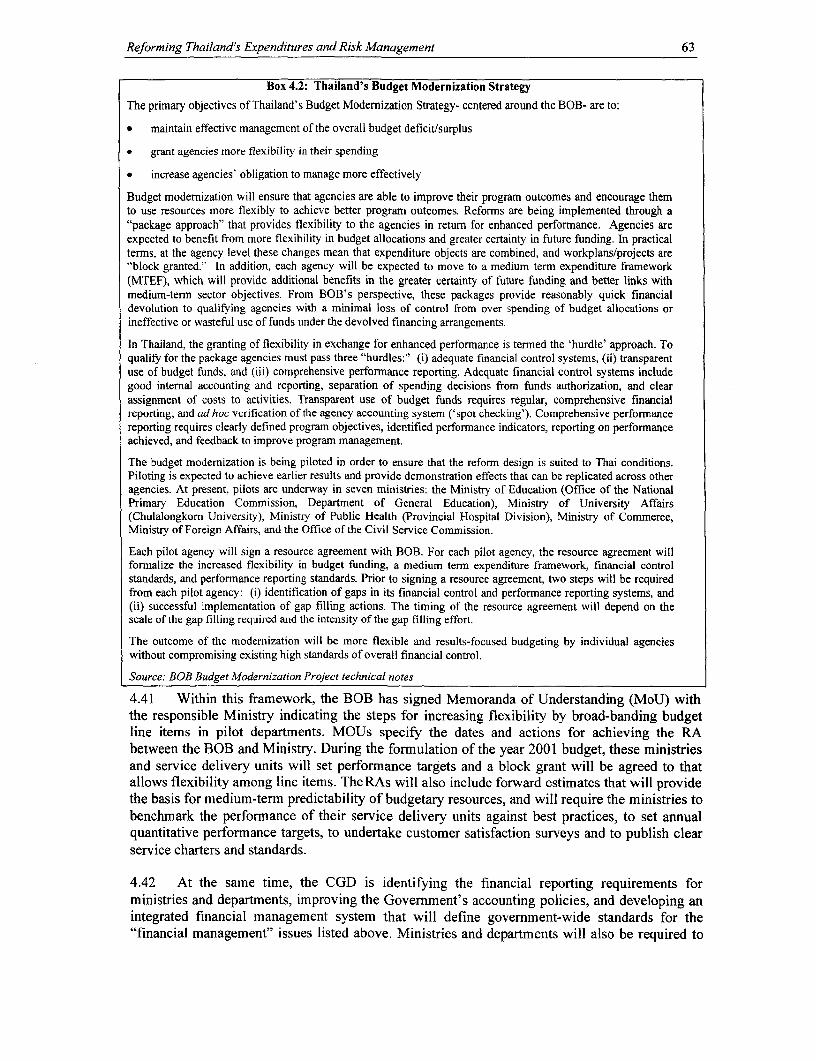
Reforming Thailand's Expenditures and Risk Management 63
Box 4.2: Thailand's Budget Modernization StrategyThe primary objectives of Thailand's Budget Modernization Strategy- centered around the BOB- are to:
* maintain effective management of the overall budget deficit/surplus
* grant agencies more flexibility in their spending
* increase agencies' obligation to manage more effectively
Budget modernization will ensure that agencies are able to improve their program outcomes and encourage themto use resources more flexibly to achieve better program outcomes. Reforms are being implemented through a"package approach" that provides flexibility to the agencies in return for enhanced performance. Agencies areexpected to benefit from more flexibility in budget allocations and greater certainty in future funding. In practicalterms, at the agency level these changes mean that expenditure objects are combined, and workplans/projects are"block granted." In addition, each agency will be expected to move to a medium term expenditure framework(MTEF), which will provide additional benefits in the greater certainty of future funding and better links withmedium-term sector objectives. From BOB's perspective, these packages provide reasonably quick financialdevolution to qualifying agencies with a minimal loss of control from over spending of budget allocations orineffective or wasteful use of funds under the devolved financing arrangements.
In Thailand, the granting of flexibility in exchange for enhanced performance is termed the 'hurdle' approach. Toqualify for the package agencies must pass three "hurdles:" (i) adequate financial control systems, (ii) transparentuse of budget funds, and (iii) comprehensive performance reporting. Adequate financial control systems includegood internal accounting and reporting, separation of spending decisions from funds authorization, and clearassignment of costs to activities. Transparent use of budget funds requires regular, comprehensive financialreporting; and ad hoc verification of the agency accounting system ('spot checking'). Comprehensive performancereporting requires clearly defined program objectives, identified performance indicators, reporting on performanceachieved, and feedback to improve program management.
The budget modernization is being piloted in order to ensure that the reform design is suited to Thai conditions.Piloting is expected to achieve earlier results and provide demonstration effects that can be replicated across otheragencies. At present, pilots are underway in seven ministries: the Ministry of Education (Office of the NationalPrimary Education Commission, Department of General Education), Ministry of University Affairs(Chulalongkorn University), Ministry of Public Health (Provincial Hospital Division), Ministry of Commerce,Ministry of Foreign Affairs, and the Office of the Civil Service Commission.
Each pilot agency will sign a resource agreement with BOB. For each pilot agency, the resource agreement willformalize the increased flexibility in budget funding, a medium term expenditure framework, financial controlstandards, and performance reporting standards. Prior to signing a resource agreement, two steps will be requiredfrom each pilot agency: (i) identification of gaps in its financial control and performance reporting systems, and(ii) successful implementation of gap filling actions. The timing of the resource agreement will depend on thescale of the gap filling required and the intensity of the gap filling effort.
The outcome of the modernization will be more flexible and results-focused budgeting by individual agencieswithout compromising existing high standards of overall financial control.
Source: BOB Budget Modernization Project technical notes
4.41 Within this framework, the BOB has signed Memoranda of Understanding (MoU) withthe responsible Ministry indicating the steps for increasing flexibility by broad-banding budgetline items in pilot departments. MOUs specify the dates and actions for achieving the RAbetween the BOB and Ministry. During the formulation of the year 2001 budget, these ministriesand service delivery units will set performance targets and a block grant will be agreed to thatallows flexibility among line items. TheRAs will also include forward estimates that will providethe basis for medium-term predictability of budgetary resources, and will require the ministries tobenchmark the performance of their service delivery units against best practices, to set annualquantitative performance targets, to undertake customer satisfaction surveys and to publish clearservice charters and standards.
4.42 At the same time, the CGD is identifying the financial reporting requirements forministries and departments, improving the Government's accounting policies, and developing anintegrated financial management system that will define government-wide standards for the"financial management" issues listed above. Ministries and departments will also be required to
64 Thailand: Public Finance Review
report their off-budget fiscal operations (e.g., revolving funds, extra-budgetary funds, foreignfinance projects and quasi-fiscal operations) as part of their financial statements.
4.43 With continuous review and refinement by the BOB and CGD, this performance-basedbudgeting framework will be extended progressively to other ministries and departments duringthe next three years, and eventually to all budget-funded entities. The expected outcomes of thesereforms are:
* improved performance accountability and transparency in key ministries
* policy objectives are linked with organizational objectives at the ministry and agency level
* budget formulation process is directed towards achieving results
* public resources are allocated to strategic priorities of ministries
* managers have more flexible resource use and BOB holds them accountable for probity andperformance.
Strengthen the Capability of Central Agencies to Review and Evaluate Sector Policies andPerformance
4.44 In the new performance framework, as central agencies relinquish line-item control theyfocus more on reviewing and evaluating the performance of ministries and departments and onanalyzing whether their polices are consistent with the Government's strategic priorities. Hence,another element of the "performance budgeting framework" is improving the capability of theBOB and NESDB to review and evaluate performance and policy.
4.45 The BOB and NESDB have agreed to prepare a joint evaluation work-program with theMinistries of Health and Education and to submit them to the Cabinet. This work program willserve as a vehicle to coordinate their actions with the sector ministries at the Cabinet level. Overtime, coordinated efforts between NESDB and BOB in reviewing and evaluating performanceand analyze policy should result in:
* transparent and effective government programs in key sectors such as health and education
* improved policy analysis and prioritization in these key sectors
* improved poverty alleviation focus to resource allocation process
* effective evaluation that provides feedback to decision-making
Improve Fiscal Transparency
4.46 Over the medium term, several changes are advisable to improve the transparency of thebudget process:
* extend budget coverage to include donor funded activities;
* improve whole-of-government reporting formats by publishing comprehensive GovernmentFinancial Statements;
* move to accrual budgeting, which would permit a clearer accounting and costing ofcontingent liabilities, and introduce incentives to set aside funds for risky behavior;
* use 'off the shelf' software to upgrade computing systems in BOB.
Reforming Thailand's Expenditures and Risk Management 65
4.47 Financial reporting requirements for governments have been established by theInternational Federation of Accountants, which is also preparing public-sector accountingstandards. Preparing these reports comprehensively for the Government as a whole, and inaccordance with internationally accepted accounting standards, will improve fiscal planning;preparing them at ministerial and agency levels can make the public sector more results-orientedand enhance accountability for performance.
4.48 The BOB and CGD are working to develop a policy to improve "financial transparency."The CGD has begun reviewing the international guidelines on government financial reportingrequirements in order to improve government financial reporting, accounting, policies andstandards along these guidelines. The BOB and CGD have also agreed to develop standards forreporting off-budget fiscal operations at the department, ministry and whole of government levelas part of budget documents and financial statements. BOB has begun compiling information onoff-budget fiscal operations like revolving funds, extra-budgetary funds, foreign financedactivities, quasi-fiscal operations and contingent liabilities. The BOB required the pilotdepartments in performance budgeting program to produce financial statements which include alloff-budget operations.
4.49 As part of the Public Sector Reform Program, and over the next three years, theGovernment plans to:
* include off-budget fiscal operations in budget documents and public accounts;
* publish a fiscal strategy that has a medium-term outlook and is based on governmentfinancial position; and
* issue new government-wide financial reporting and accounting standards.
4.50 This work is been conducted by the MOF and the BOB. These central agencies havealready established a joint steering group and a number of working groups to accomplish thesetasks.
4.51 The Government's reforms to introduce performance budgeting will require spendingagencies to report financial statements consistent with generally accepted accounting principles.These statements will also constitute the basis for expanding the coverage of budget and publicaccounts as well as preparing whole of central government accounts.
Establish a Medium-Term Fiscal Strategy
4.52 The introduction of a medium-term fiscal strategy would facilitate the link betweenpolicy, planning and budgeting (see Figure 4.1 below), by enabling medium-term fiscaladjustment objectives to be integrated with annual budget deficit/surplus targets in a systematicmanner. Under this strategy, the financial decontrol offered to the pilot agency is reinforced by aset of firm estimates of budget funding which BOB should make available to the agency over thesubsequent three years.
4.53 Moreover, the future spending implications of new policy decisions are made transparentin a multi year expenditure framework. For both reasons a medium term expenditure frameworkprovides a powerful instrument for macro-fiscal management. This has the further advantage offocusing budget preparation on policy changes as they relate to the next few years, which in turn,assists in closing the loop between the development of performance information at the departmentlevel and the budget preparation process. It also provides a role for the NESDB in the budgetpreparation process (assuming quality budget analysis can be performed).
66 Thailand: Public Finance Review
4.54 It is notable in the Thai budget reforms that a more comprehensive Medium-TermExpenditure Framework (MTEF) is being offered on an agency basis through ResourceAgreements with the pilot agencies (and along with block granting) in return for improvedfinancial and performance improvement standards. Eventually, the forward estimates for eachpilot agency should be underpinned by activity costing that will calibrate the estimates withphysical output assumptions (see Figure 4.1). This will be implemented through the ResourceAgreements drafted between each pilot agency and the BOB.
Figure 4.1: The Medium-Term Fiscal Strategy Design Process
TOP-DOWN
Medium Medium Term Policy Hearings Review and zTerm Macro Preliminary and Final Approval of Framework Ceilings Ceilings Estimates
- - - - - - - - - - - - - -- -
Costing and LPreparation of Updes from Priorization of Detailed Forward
Activities Estimates
BOTTOM-UP
5. MANAGING FISCAL RISKS
4.55 The Thai Government faces fiscal risks associated with its outstanding public debtobligations (stemming from interest rate, currency and refinancing risks, among others), and itscontingent liabilities. Some of these obligations are of a legal nature (for example, publiclyguaranteed borrowing), while others reflect policy commitments (for example, publicly non-guaranteed borrowing by state-owned enterprises and revolving funds to sustain price controls).Preliminary analysis conducted by the World Bank in consultation with the Ministry of Financesuggests that, in the afternath of the crisis, the Government faces increasing off-budgetobligations.' These off-budget obligations have accumulated primarily in the banking andenterprise sectors.
4.56 Recently, the Government's budget has been unable to cover claims arising from theseobligations. State-owned enterprises (such as the State Railway and Rubber Plantations) andextra-budgetary funds (namely the Sugar Cane Fund) have been allowed to incur furtherborrowing instead. If these enterprises and funds incur continued losses, this practice of allowingfurther borrowings (often with explicit government guarantees) only postpones the need forgovernment direct financing and increases the size of the Government's off-budget obligations.
4.57 A bigger problem still remains in the financial sector. FIDF liabilities include loans tofinancial institutions which were since intervened, losses in state banks and losses in intervenedbanks which must be covered in order to privatize those institutions, and any additional costs ofdepositor and creditor protection in finance companies and banks.
1 No major sources of fiscal risk (that is, of volatility in government financing and borrowing requirements) have beenidentified in the portfolio of government assets and revenues. The Government seems to face a downward trend ratherthan volatility in the value of its assets and future revenLes.
Reforming Thailand's Expenditures and Risk Management 67
4.58 The PDMO was recently established in the MOF to analyze and manage theGovemment's liabilities. The PDMO will collaborate closely with the BOT in developing acomprehensive, medium-term financial and debt management strategy. It will also assist in thecreation of short-, medium- and long-term borrowing plans that are consistent with the NESDB'sDevelopment Plan and the Government's fiscal and monetary stance. The PDMO is responsiblefor several functions including debt service forecasting; active debt management; cashmanagement; risk management (to hedge against currency, interest rate, funding and refinancing,credit and operational risk, among others); project finance related transactions; and tracking andpreparing to deal with contingent liabilities of Government. To undertake these tasks, the PDMOwill require a number of debt, cash, risk management and other systems. Once the PDMO is fullyestablished, it will be in a better position than the Committee that is currently managing theGovernment's debt to conduct comprehensive analysis of the Government's liabilities and tomanage its total risk exposure.
Contingent Liabilities
4.59 The Government's contingent liabilities are both explicit and implicit.Explicit contingentliabilities are commitments that are based on law and contracts, and primarily include guaranteeddebt and other liabilities of state-owned enterprises, and financing needs under price supportprograms. The Government's implicit contingent liabilities are commitments that are based onpolitical announcements, public expectations and possible interest-group pressures, and theymainly include:
* Obligations of FIDF (the result of the past and possibly future recapitalization actions,liquidity support and deposit insurance claims) and, indirectly, future recapitalization needsof the entire financial system
* Liabilities of extra-budgetary funds
* Possible negative net worth of the BOT
- Losses, non-guaranteed obligations, arrears and deferred maintenance of state-ownedenterprises (including concession agreements of state-owned utilities, arrears of StateRailways to PTT and deferred railway-track rehabilitation)
* Future possible commitments and obligations of sub-national governments (for example, vialosses of provincial Government-owned enterprises)
4.60 In managing these risks, it is unimportant from the Government's perspective whether theobligations are explicit or implicit. Most contingent liabilities are directly related to losses in statebanks, specialized financial institutions and intervened banks, which will have to be fiscalized inthe future. In the case of state-owned enterprises and funds that default on their non-guaranteeddebt, the recapitalization needs of some of these banks will rise. For instance, should the fiscalauthorities permit the Sugar Cane Fund to default on its non-guaranteed debt to the Bank forAgriculture and Agricultural Cooperatives, a new non-performing loan in the portfolio of thisalready undercapitalized financial institution would only increase its recapitalization needs. Withrespect to the financial sector, should the fiscal authorities be unable or unwilling (for a certaintime period) to cover any of the obligations of FIDF or any future bank recapitalization needs(e.g. state banks), the BOT may have to do so ex-post, thereby running down its net worth. Butthere does not appear to be an adequate cushion in the BOT's net worth to meet this contingencyand, eventually, public resources would be required to maintain its solvency and credibility. Inaddition, many enterprises and funds are critical for delivering public services, such as affordablepassenger transportation. Therefore, unless policy priorities change, the Government will
68 Thailand: Public Finance Review
eventually be forced to pay for the SOE's non-guaranteed as well as guaranteed liabilities, arrearsand deferred maintenance.
4.61 The risk associated with these contingent liabilities can be managed by the PDMO in twoways: (i) by developing the capability to evaluate the outstanding, off-budget obligations of theGovernment and their impact on future financing requirements; and (ii) by developingappropriate guidelines, institutional arrangements and capacities for the Government, through thePDMO, to monitor adequately, analyze and actively restrain fiscal risks. To this end, expertadvice will be needed to elaborate detailed guidelines and regulations for state-owned enterprises,banks, and government agencies and units, including the PDMO.
Guaranteed Debt in the State Enterprise Sector
4.62 The Government has provided guarantees on domestic and external borrowing to mostnon-financial enterprises and to selected financial institutions. At the end of 1999, the stock ofguaranteed debt surpassed I trillion Thai baht (see Figure 4.2 below). The stock of non-guaranteed debt by non-financial state-owned enterprises amounts to nearly 500 billion Thai baht.In addition to these reported amounts, several large enterprises have accumulated arrears (forexample, on the fuel cost and for deferred maintenance by the State Railway and the BangkokMass Transit Authority).
Figure 4.2: Guaranteed Debt Outstanding, Figure 4.3: Guaranteed Debt Repayment1999 Schedule
1250 - -
1250- Face values1000 - ___D _ 1 50- Risk-adjusted
. 750------- ___
o 500- __-| __ . . c= ~ z \ .WU
250
0 0;Face values Risk-adjusted FYOO FYOI FY02 FY03 FY04 FY05 FY06 FY07 FY08
Note: Includes scheduled principle repayment ondomestic and external guaranteed debt, and interestpayments on external guaranteed debt.
Source: Calculations by the author based on information provided by the PDMO and ArthurAndersen.
4.63 To estimate future, likely demands of state-owned enterprises on the Government budget,a World Bank mission analyzed the recent and expected financial and economic performance ofThailand. In order to establish a measure of "risk-adjusted guaranteed debt", State-OwnedEnterprises were grouped into four categories of risk and corresponding risk levels were assigned.For example, risk levels of 5 percent for best performers, 25 percent for enterprises likely to makeprofits, 50 percent for enterprises with fluctuating profit and investment performance, and 90percent for enterprises that have been showing continued losses and/or embarked on very riskyprojects. For each category, the outstanding liabilities of enterprises were then multiplied by theirrespective risk levels. By aggregating the risk-adjusted amounts of guaranteed liabilities ofenterprises, the total risk-adjusted level of guaranteed debt was estimated (see Figure 4.2). Toassess the future dynamics, the respective risk levels were also assigned to the repaymentschedules of their guaranteed debt. Figure 4.3 compares the face values of guaranteed debtrepayment schedules with the risk-adjusted amounts2 The risk-adjusted amount of guaranteed
2 Detailed information on the assigned enterprise risk levels and debt repayment schedules can be found in "DebtManagement Policy Note," World Bank, (2000).
Reforming Thailand's Expenditures and Risk Management 69
debt can be interpreted as the net present value3 of future expected fiscal cost of governmentguarantees, or as the amount of contingency reserves the Government should have accumulatedby the end- 1999 to cover future calls on the budget.
4.64 Fiscal risks in SOEs arise not only from borrowing, but also from the operations of state-owned enterprises. These risks emerge mainly due to government policy actions (e.g. pricecontrols that may give rise to operating losses) and the SOE's own investment decisions (such asambitious and risky projects).4 Once these risks surface and reach unsustainable proportions,there is an increasing pressure by the enterprises to call on the Government to provide additionalsubsidies or for additional government guaranteed borrowing. Such risks rise with increasinginterest rates and with baht depreciation. (To deal with this, many state-owned enterprises haverelied on increased short-term borrowing and/or further unhedged foreign liabilities).
Bank Recapitalization
4.65 The cost of past recapitalization programs, largely reflected in the liability portfolio ofFIDF, and further recapitalization needs of the Thai banking sector will significantly affect theamounts of future government borrowing. FIDF estimates that the fiscal authorities will need toprovide about Baht 1.1 trillion to cover its liabilities and operating costs. This amount is expectedto be paid from new government borrowing over the period 2000 to 2005. Other availableestimates range from Baht 1.1 to 1.4 trillion. This cost is sensitive to the recovery rate on non-performing loans in state banks and intervened banks. On top of the FIDF's financial institutionrescue and depositor/creditor protection program, the Government is expected to support therecapitalization and subsidy needs of Specialized Financial Institutions, such as the GovernmentHousing Bank and the Bank for Agriculture and Agricultural Cooperatives. Finally, any futurecosts of protecting depositor funds in private banks, net of insurance and bank fees will have to befiscalized.
4.66 Risk also emerges from the structure of the FIDF debt portfolio. FIDF has been pursuing"minimal cost" strategy with respect to its near-term debt service. Since the yield curve is steep inthe Thai domestic fixed income market, FIDF borrows almost exclusively short-term. TheFIDF'sborrowing strategy thus differs from the PDMO objective, which is to reduce liquidity risk andthus issue instruments with medium to long-term maturity.
4.67 The role of PDMO with respect to contingent liabilities could be defined as follows:
* Develop and maintain a complete database of government contingent liabilities
* Analyze contingent liabilities and estimate associated future borrowing needs and theirsensitivity to the underlying factors (scenario analysis)
* Reflect on analysis of contingent liabilities in borrowing and debt management strategy
* In the budget process, advise the Government of Thailand on future expected fiscal cost ofproposed policies that generate contingent liabilities
* Advise the Government of Thailand on how to structure its programs to minimizegovernment risk exposure
3In all instances, the government guarantees the entire principle and interest payments against all risks.4 For a detailed analysis of risks emerging at the enterprise level, see the Arthur Andersen report on Thailand - TheFiscal Costs of State Enterprises and Private Participation in Infrastructure.
70 Thailand: Public Finance Review
4.68 To fulfill such a role, the PDMO will need to work closely with several governmentagencies and units. For example, PDMO should be able to obtain processed information andinitial risk analysis of enterprise performance from the CGD, and alternative scenarios for thefiscal component of bank recapitalization needs from FIDF. Formal rules and guidelines toestablish close working relationships may be needed. Further, to reduce the emergence of fiscalrisks, the Government will need to:
* Define its risk management objectives (the degree of risk aversion) and make PDMO (andFIDF and other agencies if necessary) responsible for their implementation
* Define reporting requirements for financial institutions and enterprises according to thePDMO risk management needs and objectives, and assign responsibility for providingrequested information to PDMO.
* Issue guidelines for financial management and risk exposure of financial and non-financialenterprises, and enforcement responsibilities
* Encourage risk management capacity building in financial institutions and enterprises, as wellas in BOT, OAG, and CGD
Fiscal Decentralization 71
V. FISCAL DECENTRALIZATION
1. INTRODUCTION
5.1 Thailand is a unitary government, that at present, has a highly centralized fiscal systemthat grants limited local autonomy in terms of functions, area, staffing, funding and decisionmaking.
* The central government spends 93 percent of total general expenditures and collects 95percent of general tax revenues.1
* Only 25 percent of municipal revenues are locally collected and retained.* The central government appoints most chief local officials, determines local salaries and
approves local budgets.
5.2 Over the past decade, various means of decentralizing authority and responsibility tolocal governments have been discussed. It was broadly recognized that local government capacitywould need to be strengthened considerably if the central government were to lessen its role inthe intergovernmental fiscal system. Most Thai local governments must strengthen their capacityin financial management, planning and service delivery, and generally lack adequate resources todeliver services effectively or to provide needed investment. While many proposals had been putforth, the Government's decentralization agenda gained momentum when the new Constitutionwas passed in 1997.
5.3 International experience shows that decentralization can be a key means to improvegovernance, provided that it is well designed. By clearly defining what level of government isresponsible for providing and financing various services and delegating appropriate authority,responsibility and resources, local services may be provided more effectively and localaccountability may be enhanced. The success of Thailand's decentralization will depend on theextent to which its political and economic institutions promote local accountability andresponsible fiscal policies. Because these institutions are nascent in Thailand, a strong system oflocal accountability must be developed, since greater resources devolved to local governmentscan lead to misused or wasted funds. Similarly, without an appropriate balance betweenexpenditures and revenues, public service levels may deteriorate in a decentralized context. Andfinally, unless local governments pursue responsible fiscal policies, macroeconomic instabilitymay arise in the form of higher overall fiscal deficits or central government "bailouts" of weaklocal governments.
5.4 Reducing the role of the central government and moving toward a decentralized fiscalsystem will require significant changes in existing Thai institutions, processes and culture. TheMinistries of Public Health and Education are decentralizing service delivery to local entities (i.e.,Local Education Authorities and Provincial Hospitals), that in the future may be transferred tolocal governments. Changes in the intergovernmental transfer system that improve the targetingof subsidies to the poor can enhance the delivery of services. And effective decentralization isimpossible without broader reforms in financial and human resource management that areunderway as part of the Government's Public Sector Management Reform Program.
IMF, Government Finance Statistics Yearbook, 1999.
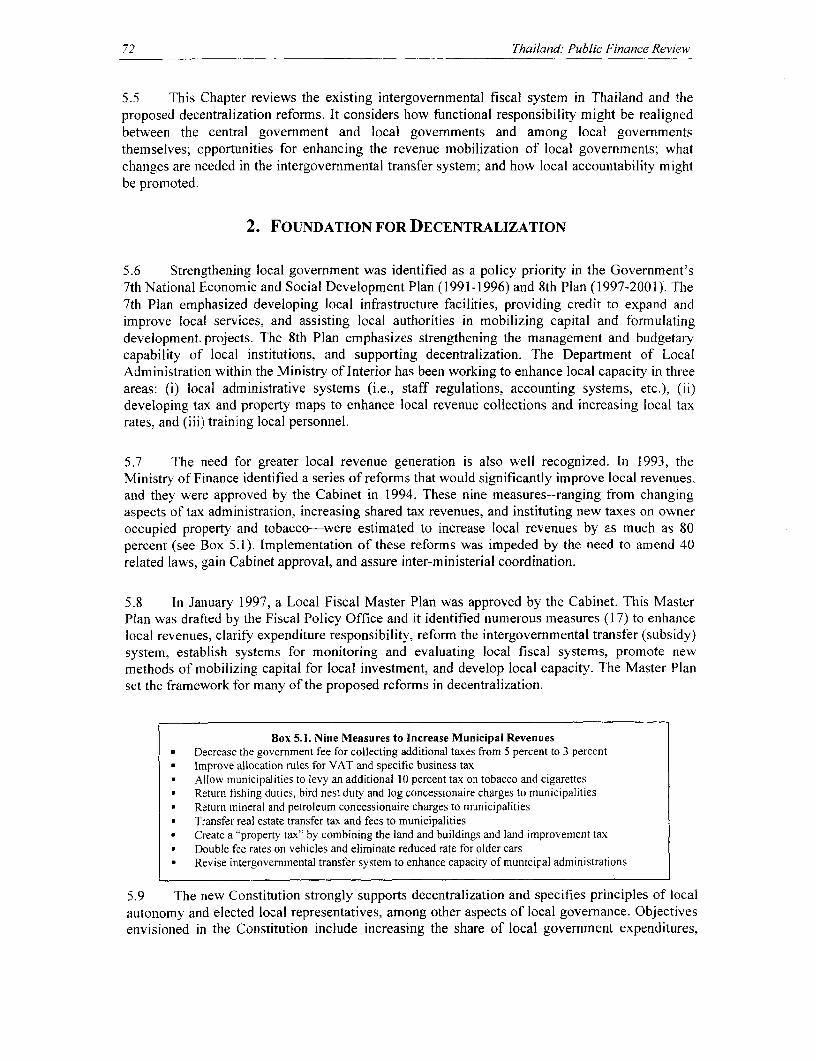
72 Thailand.: Public Finance Review
5.5 This Chapter reviews the existing intergovernmental fiscal system in Thailand and theproposed decentralization reforms. It considers how functional responsibility might be realignedbetween the central government and local governments and among local governmentsthemselves; opportunities for enhancing the revenue mobilization of local governments; whatchanges are needed in the intergovernmental transfer system; and how local accountability mightbe promoted.
2. FOUNDATION FOR DECENTRALIZATION
5.6 Strengthening local government was identified as a policy priority in the Government's7th National Economic and Social Development Plan (1991-1996) and 8th Plan (1997-2001). The7th Plan emphasized developing local infrastructure facilities, providing credit to expand andimprove local services, and assisting local authorities in mobilizing capital and formulatingdevelopment. projects. The 8th Plan emphasizes strengthening the management and budgetarycapability of local institutions, and supporting decentralization. The Department of LocalAdministration within the Ministry of Interior has been working to enhance local capacity in threeareas: (i) local administrative systems (i.e., staff regulations, accounting systems, etc.), (ii)developing tax and property maps to enhance local revenue collections and increasing local taxrates, and (iii) training local personnel.
5.7 The need for greater local revenue generation is also well recognized. In 1993, theMinistry of Finance identified a series of reforms that would significantly improve local revenues,and they were approved by the Cabinet in 1994. These nine measures--ranging from changingaspects of tax administration, increasing shared tax revenues, and instituting new taxes on owneroccupied property and tobacco-were estimated to increase local revenues by as much as 80percent (see Box 5.1). Implementation of these reforms was impeded by the need to amend 40related laws, gain Cabinet approval, and assure inter-ministerial coordination.
5.8 In January 1997, a Local Fiscal Master Plan was approved by the Cabinet. This MasterPlan was drafted by the Fiscal Policy Office and it identified numerous measures (17) to enhancelocal revenues, clarify expenditure responsibility, reform the intergovemmental transfer (subsidy)system, establish systems for monitoring and evaluating local fiscal systems, promote newmethods of mobilizing capital for local investment, and develop local capacity. The Master Planset the framework for many of the proposed reforms in decentralization.
Box 5.1. Nine Measures to Increase Municipal Revenues* Decrease the government fee for collecting additional taxes from 5 percent to 3 percent* Improve allocation rules for VAT and specific business tax* Allow municipalities to levy an additional 10 percent tax on tobacco and cigarettes* Return fishing duties, bird nest duty and log concessionaire charges to municipalities* Return mineral and petroleum concessionaire charges to municipalities* Transfer real estate transfer tax and fees to municipalities* Create a "property tax" by combining the land and buildings and land improvement tax* Double fee rates on vehicles and eliminate reduced rate for older cars* Revise intergovernmental transfer system to enhance capacity of municipal administrations
5.9 The new Constitution strongly supports decentralization and specifies principles of localautonomy and elected local representatives, among other aspects of local governance. Objectivesenvisioned in the Constitution include increasing the share of local government expenditures,
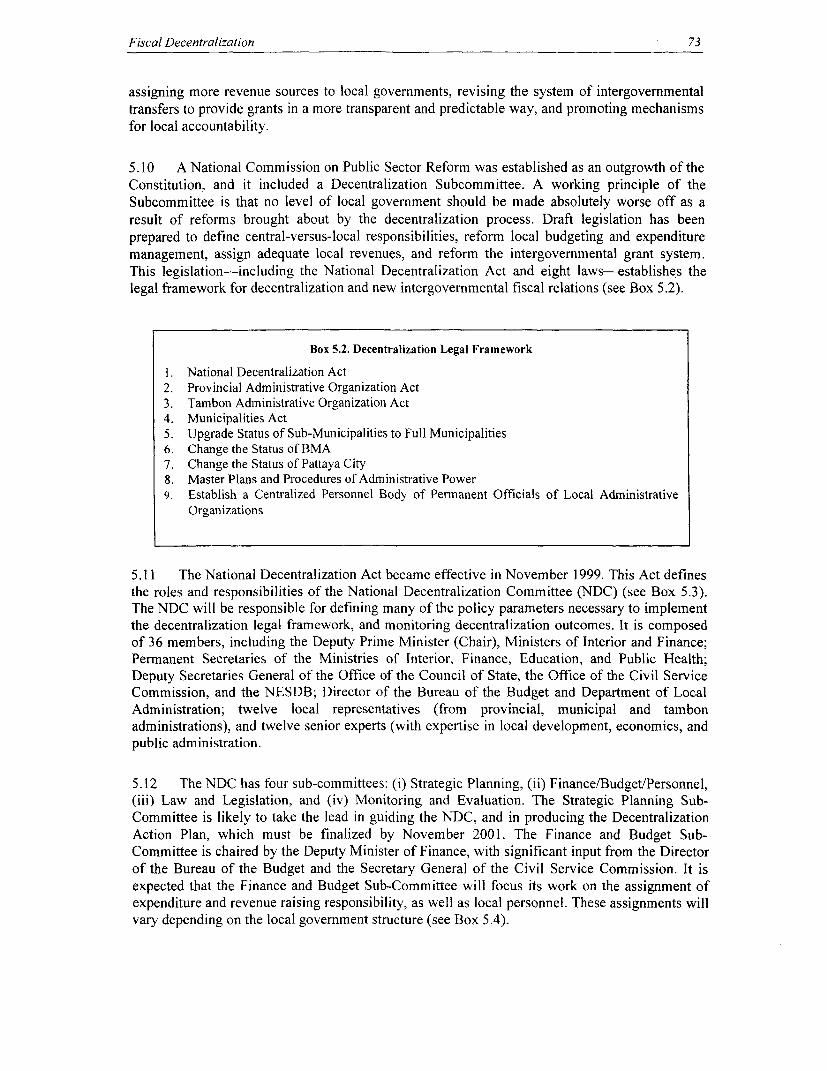
Fiscal Decentralization 73
assigning more revenue sources to local governments, revising the system of intergovernmentaltransfers to provide grants in a more transparent and predictable way, and promoting mechanisms
for local accountability.
5.10 A National Commission on Public Sector Reform was established as an outgrowth of theConstitution, and it included a Decentralization Subcommittee. A working principle of theSubcommittee is that no level of local government should be made absolutely worse off as aresult of reforms brought about by the decentralization process. Draft legislation has beenprepared to define central-versus-local responsibilities, reform local budgeting and expendituremanagement, assign adequate local revenues, and reform the intergovernmental grant system.This legislation-including the National Decentralization Act and eight laws-establishes thelegal framework for decentralization and new intergovernmental fiscal relations (see Box 5.2).
Box 5.2. Decentralization Legal Framework
1. National Decentralization Act2. Provincial Administrative Organization Act3. Tambon Administrative Organization Act4. Municipalities Act5. Upgrade Status of Sub-Municipalities to Full Municipalities6. Change the Status of BMA7. Change the Status of Pattaya City8. Master Plans and Procedures of Administrative Power9. Establish a Centralized Personnel Body of Permanent Officials of Local Administrative
Organizations
5.11 The National Decentralization Act became effective in November 1999. This Act definesthe roles and responsibilities of the National Decentralization Committee (NDC) (see Box 5.3).The NDC will be responsible for defining many of the policy parameters necessary to implementthe decentralization legal framework, and monitoring decentralization outcomes. It is composedof 36 members, including the Deputy Prime Minister (Chair), Ministers of Interior and Finance;Permanent Secretaries of the Ministries of Interior, Finance, Education, and Public Health;Deputy Secretaries General of the Office of the Council of State, the Office of the Civil ServiceCommission, and the NESDB; Director of the Bureau of the Budget and Department of LocalAdministration; twelve local representatives (from provincial, municipal and tambonadministrations), and twelve senior experts (with expertise in local development, economics, andpublic administration.
5.12 The NDC has four sub-committees: (i) Strategic Planning, (ii) Finance/Budget/Personnel,(iii) Law and Legislation, and (iv) Monitoring and Evaluation. The Strategic Planning Sub-Committee is likely to take the lead in guiding the NDC, and in producing the DecentralizationAction Plan, which must be finalized by November 2001. The Finance and Budget Sub-Committee is chaired by the Deputy Minister of Finance, with significant input from the Directorof the Bureau of the Budget and the Secretary General of the Civil Service Commission. It isexpected that the Finance and Budget Sub-Committee will focus its work on the assignment ofexpenditure and revenue raising responsibility, as well as local personnel. These assignments willvary depending on the local government structure (see Box 5.4).
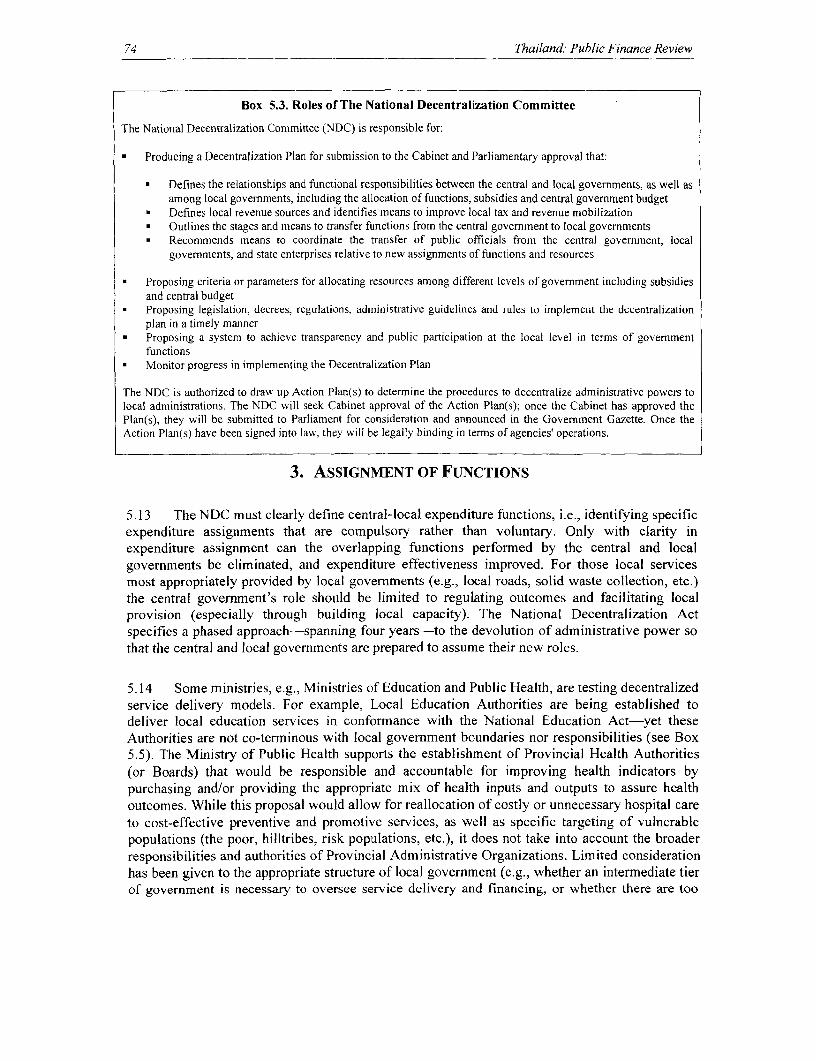
74 Thailand: Public Finance Review
Box 5.3. Roles of The National Decentralization Committee
The National Decentralization Committee (NDC) is responsible for:
• Producing a Decentralization Plan for submission to the Cabinet and Parliamentary approval that:
* Defines the relationships and functional responsibilities between the central and local governments, as well asamong local governments, including the allocation of functions, subsidies and central govemment budget
* Defines local revenue sources and identifies means to improve local tax and revenue mobilization* Outlines the stages and means to transfer functions from the central government to local governments* Recommends means to coordinate the transfer of public officials from the central govemment, local
governments, and state enterprises relative to new assignments of functions and resources
* Proposing criteria or parameters for allocating resources among different levels of govemment including subsidiesand central budget
* Proposing legislation, decrees, regulations, administrative guidelines and rules to implement the decentralizationplan in a timely manner
* Proposing a system to achieve transparency and public participation at the local level in tenns of govemmentfunctions
* Monitor progress in implementing the Decentralization Plan
The NDC is authorized to draw up Action Plan(s) to determine the procedures to decentralize administrative powers tolocal administrations. The NDC will seek Cabinet approval of the Action Plan(s), once the Cabinet has approved thePlan(s), they will be submitted to Parliament for consideration and announced in the Government Gazette. Once theAction Plan(s) have been signed into law, they will be legally binding in terms of agencies' operations.
3. ASSIGNMENT OF FUNCTIONS
5.13 The NDC must clearly define central-local expenditure functions, i.e., identifying specificexpenditure assignments that are compulsory rather than voluntary. Only with clarity inexpenditure assignment can the overlapping functions performed by the central and localgovernments be eliminated, and expenditure effectiveness improved. For those local servicesmost appropriately provided by local governments (e.g., local roads, solid waste collection, etc.)the central government's role should be limited to regulating outcomes and facilitating localprovision (especially through building local capacity). The National Decentralization Actspecifies a phased approach-spanning four years-to the devolution of administrative power sothat the central and local governments are prepared to assume their new roles.
5.14 Some ministries, e.g., Ministries of Education and Public Health, are testing decentralizedservice delivery models. For example, Local Education Authorities are being established todeliver local education services in conformnance with the National Education Act-yet theseAuthorities are not co-terminous with local government boundaries nor responsibilities (see Box5.5). The Ministry of Public Health supports the establishment of Provincial Health Authorities(or Boards) that would be responsible and accountable for improving health indicators bypurchasing and/or providing the appropriate mix of health inputs and outputs to assure healthoutcomes. While this proposal would allow for reallocation of costly or unnecessary hospital careto cost-effective preventive and promotive services, as well as specific targeting of vulnerablepopulations (the poor, hilltribes, risk populations, etc.), it does not take into account the broaderresponsibilities and authorities of Provincial Administrative Organizations. Limited considerationhas been given to the appropriate structure of local government (e.g., whether an intermediate tierof government is necessary to oversee service delivery and financing, or whether there are too
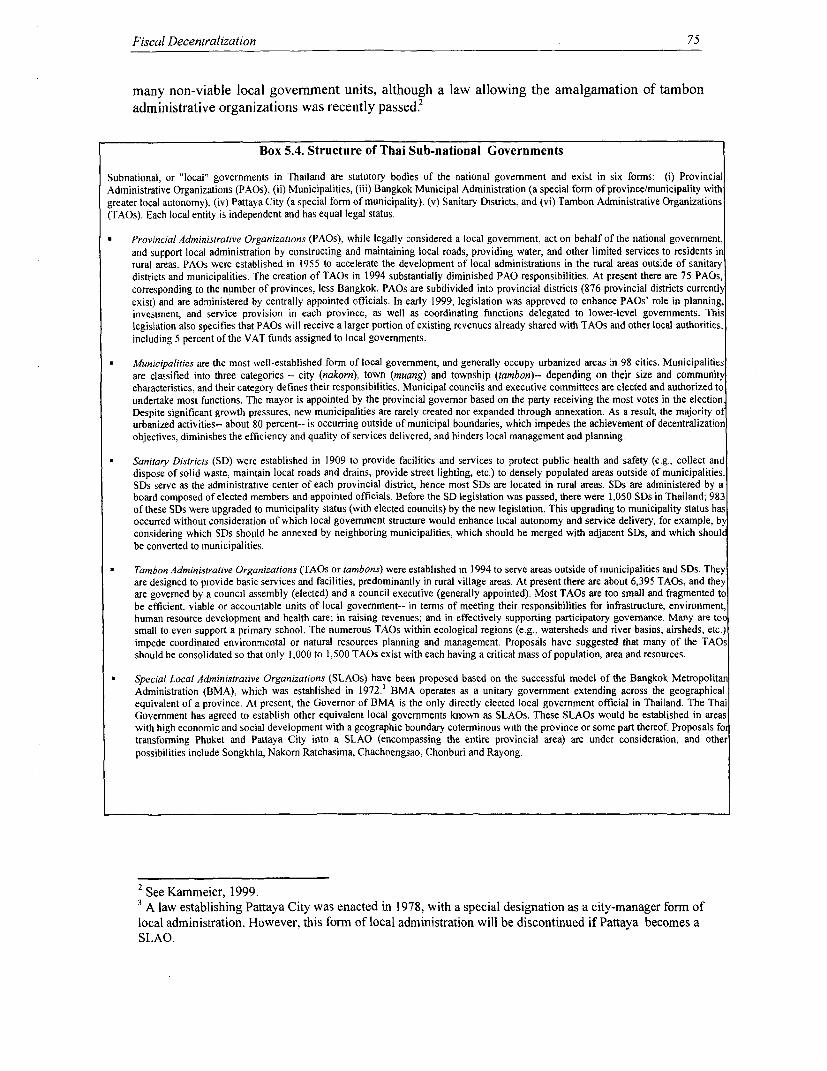
Fiscal Decentralization 75
many non-viable local government units, although a law allowing the amalgamation of tambonadministrative organizations was recently passed'
Box 5.4. Structure of Thai Sub-national Governments
Subnational, or "local" governments in Thailand are statutory bodies of the national government and exist in six forms: (i) ProvincialAdministrative Organizations (PAOs), (ii) Municipalities, (iii) Bangkok Municipal Administration (a special form of province/municipality withgreater local autonomy). (iv) Pattaya City (a special form of municipality), (v) Sanitary Districts, and (vi) Tambon Administrative Organizations(TAOs). Each local entity is independent and has equal legal status.
Provincial Administrative Organizations (PAOs), while legally considered a local government, act on behalf of the national government,and support local administration by constructing and maintaining local roads, providing water, and other limited services to residents inrural areas. PAOs were established in 1955 to accelerate the development of local administrations in the rural areas outside of sanitarydistricts and municipalities. The creation of TAOs in 1994 substantially diminished PAO responsibilities. At present there are 75 PAOs,corresponding to the number of provinces, less Bangkok. PAOs are subdivided into provincial districts (876 provincial districts currentlexist) and are administered by centrally appointed officials. In early 1999, legislation was approved to enhance PAOs' role in planning,investment, and service provision in each province, as well as coordinating functions delegated to lower-level governments. Thislegislation also specifies that PAOs will receive a larger portion of existing revenues already shared with TAOs and other local authorities,including 5 percent of the VAT funds assigned to local governments.
Municipalities are the most well-established form of local government, and generally occupy urbanized areas in 98 cities. Municipalitiesare classified into three categories - city (nakorn). town (muang) and township (tambon)-- depending on their size and communitycharacteristics, and their category defines their responsibilities. Municipal councils and executive committees are elected and authorized toundertake most functions. The mayor is appointed by the provincial govemor based on the party receiving the most votes in the election.Despite significant growth pressures, new municipalities are rarely created nor expanded through annexation. As a result, the majority ourbanized activities-- about 80 percent-- is occurring outside of municipal boundaries, which impedes the achievement of decentralizationobjectives, diminishes the efficiency and quality of services delivered, and hinders local management and planning.
Sanitary Districts (SD) were established in 1909 to provide facilities and services to protect public health and safety (e.g., collect anddispose of solid waste, maintain local roads and drains, provide street lighting, etc.) to densely populated areas outside of municipalities.SDs serve as the administrative center of each provincial district, hence most SDs are located in rural areas. SDs are administered by aboard composed of elected members and appointed officials. Before the SD legislation was passed, there were 1,050 SDs in Thailand; 983of these SDs were upgraded to municipality status (with elected councils) by the new legislation. This upgrading to municipality status hasoccurred without consideration of which local government structure would enhance local autonomy and service delivery, for example, bconsidering which SDs should be annexed by neighboring municipalities, which should be merged with adjacent SDs, and which shoulbe converted to municipalities.
Tambon Administrative Organizations (TAOs or tambons) were established in 1994 to serve areas outside of municipalities and SDs. Theyare designed to provide basic services and facilities, predominantly in rural village areas. At present there are about 6,395 TAOs, and theyare govemed by a council assembly (elected) and a council executive (generally appointed). Most TAOs are too small and fragmented tobe efficient, viable or accountable units of local government-- in terms of meeting their responsibilities for infrastructure, environment,human resource development and health care; in raising revenues; and in effectively supporting participatory govemance. Many are tosmall to even support a primary school. The numerous TAOs within ecological regions (e.g., watersheds and river basins, airsheds, etc.)impede coordinated environmental or natural resources planning and management. Proposals have suggested that many of the TAOsshould be consolidated so that only 1,000 to 1,500 TAOs exist with each having a critical mass of population, area and resources.
Special Local Administrative Organizations (SLAOs) have been proposed based on the successful model of the Bangkok MetropolitanAdministration (BMA), which was established in 1972.3 BMA operates as a unitary govemment extending across the geographicalequivalent of a province. At present, the Governor of BMA is the only directly elected local govemment official in Thailand. The ThaiGovernment has agreed to establish other equivalent local govemments known as SLAOs. These SLAOs would be established in areaswith high economic and social development with a geographic boundary coterminous with the province or some part thereof. Proposals fotransforming Phuket and Pattaya City into a SLAO (encompassing the entire provincial area) are under consideration, and otherpossibilities include Songkhla, Nakom Ratchasima, Chachoengsao, Chonburi and Rayong.
2 See Kammeier, 1999.3 A law establishing Pattaya City was enacted in 1978, with a special designation as a city-manager fonn oflocal administration. However, this form of local administration will be discontinued if Pattaya becomes aSLAO.
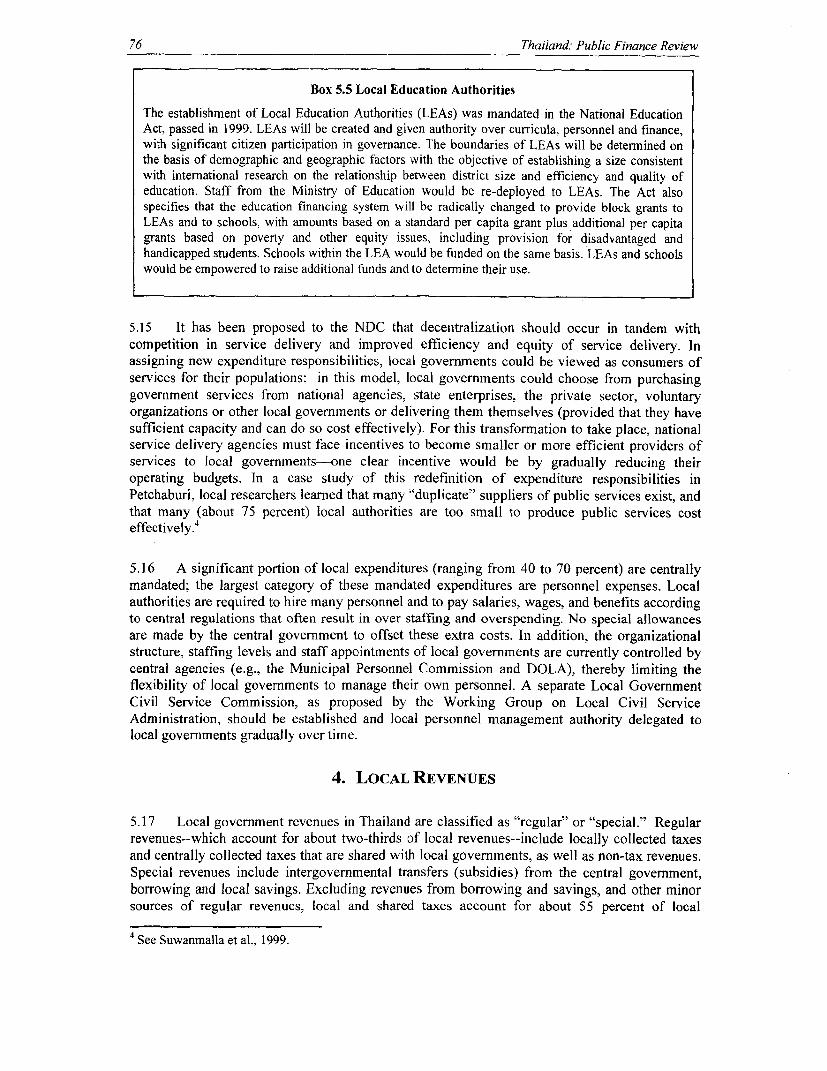
76 Thailand: Public Finance Review
Box 5.5 Local Education Authorities
The establishment of Local Education Authorities (LEAs) was mandated in the National EducationAct, passed in 1999. LEAs will be created and given authority over curricula, personnel and finance,with significant citizen participation in governance. The boundaries of LEAs will be determined onthe basis of demographic and geographic factors with the objective of establishing a size consistentwith international research on the relationship between district size and efficiency and quality ofeducation. Staff from the Ministry of Education would be re-deployed to LEAs. The Act alsospecifies that the education financing system will be radically changed to provide block grants toLEAs and to schools, with amounts based on a standard per capita grant plus additional per capitagrants based on poverty and other equity issues, including provision for disadvantaged andhandicapped students. Schools within the LEA would be funded on the same basis. LEAs and schoolswould be empowered to raise additional funds and to determine their use.
5.15 It has been proposed to the NDC that decentralization should occur in tandem withcompetition in service delivery and improved efficiency and equity of service delivery. Inassigning new expenditure responsibilities, local governments could be viewed as consumers ofservices for their populations: in this model, local governments could choose from purchasinggovernment services from national agencies, state enterprises, the private sector, voluntaryorganizations or other local governments or delivering them themselves (provided that they havesufficient capacity and can do so cost effectively). For this transformation to take place, nationalservice delivery agencies must face incentives to become smaller or more efficient providers ofservices to local governments-one clear incentive would be by gradually reducing theiroperating budgets. In a case study of this redefinition of expenditure responsibilities inPetchaburi, local researchers learned that many 'duplicate" suppliers of public services exist, andthat many (about 75 percent) local authorities are too small to produce public services costeffectively.4
5.16 A significant portion of local expenditures (ranging from 40 to 70 percent) are centrallymandated; the largest category of these mandated expenditures are personnel expenses. Localauthorities are required to hire many personnel and to pay salaries, wages, and benefits accordingto central regulations that often result in over staffing and overspending. No special allowancesare made by the central government to offset these extra costs. In addition, the organizationalstructure, staffing levels and staff appointments of local governments are currently controlled bycentral agencies (e.g., the Municipal Personnel Commission and DOLA), thereby limiting theflexibility of local governments to manage their own personnel. A separate Local GovernmentCivil Service Commission, as proposed by the Working Group on Local Civil ServiceAdministration, should be established and local personnel management authority delegated tolocal governments gradually over time.
4. LOCAL REVENUES
5.17 Local government revenues in Thailand are classified as "regular" or "special." Regularrevenues--which account for about two-thirds of local revenues--include locally collected taxesand centrally collected taxes that are shared with local governments, as well as non-tax revenues.Special revenues include intergovernmental transfers (subsidies) from the central government,borrowing and local savings. Excluding revenues from borrowing and savings, and other minorsources of regular revenues, local and shared taxes account for about 55 percent of local
4 See Suwanmalla et al., 1999.
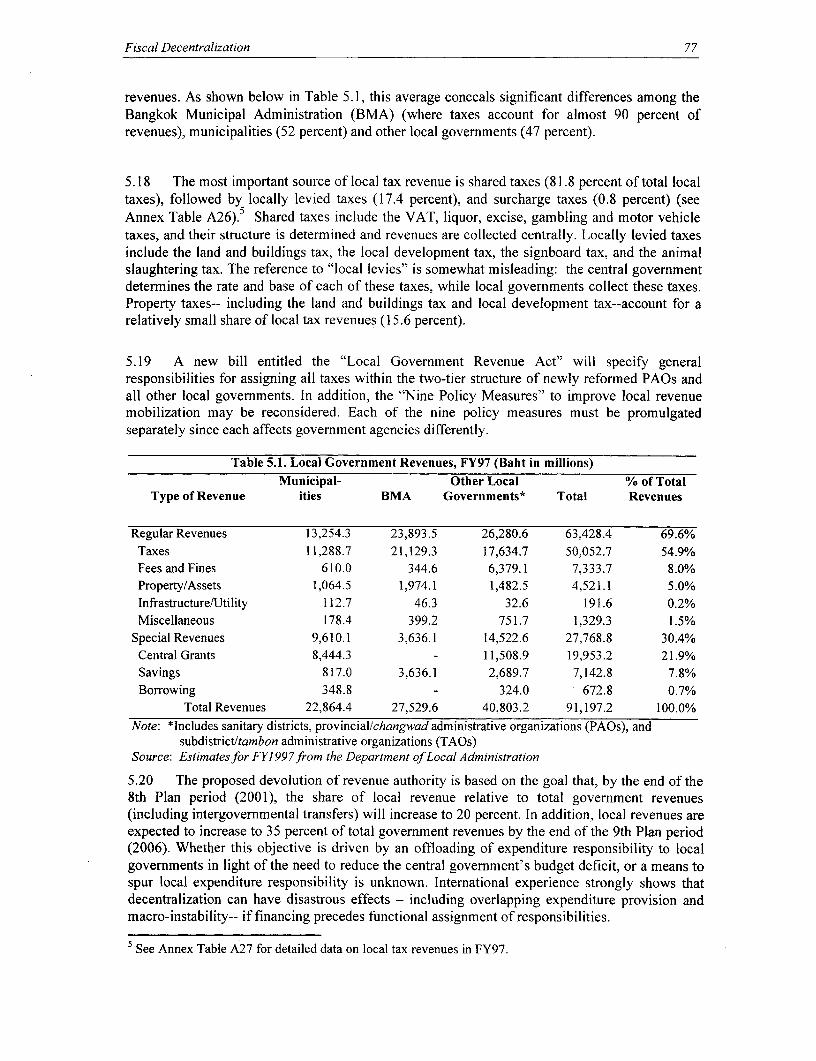
Fiscal Decentralization 77
revenues. As shown below in Table 5.1, this average conceals significant differences among theBangkok Municipal Administration (BMA) (where taxes account for almost 90 percent ofrevenues), municipalities (52 percent) and other local governments (47 percent).
5.18 The most important source of local tax revenue is shared taxes (81.8 percent of total localtaxes), followed by locally levied taxes (17.4 percent), and surcharge taxes (0.8 percent) (seeAnnex Table A26). Shared taxes include the VAT, liquor, excise, gambling and motor vehicletaxes, and their structure is determined and revenues are collected centrally. Locally levied taxesinclude the land and buildings tax, the local development tax, the signboard tax, and the animalslaughtering tax. The reference to "local levies" is somewhat misleading: the central governmentdetermines the rate and base of each of these taxes, while local governments collect these taxes.Property taxes-- including the land and buildings tax and local development tax--account for arelatively small share of local tax revenues (15.6 percent).
5.19 A new bill entitled the "Local Government Revenue Act" will specify generalresponsibilities for assigning all taxes within the two-tier structure of newly reformed PAOs andall other local governments. In addition, the "Nine Policy Measures" to improve local revenuemobilization may be reconsidered. Each of the nine policy measures must be promulgatedseparately since each affects government agencies differently.
Table 5.1. Local Government Revenues, FY97 (Baht in millions)Municipal- Other Local % of Total
Type of Revenue ities BMA Governments* Total Revenues
Regular Revenues 13,254.3 23,893.5 26,280.6 63,428.4 69.6%Taxes 11,288.7 21,129.3 17,634.7 50,052.7 54.9%Fees and Fines 610.0 344.6 6,379.1 7,333.7 8.0%Property/Assets 1,064.5 1,974.1 1,482.5 4,521.1 5.0%Infrastructure/Utility 112.7 46.3 32.6 191.6 0.2%Miscellaneous 178.4 399.2 751.7 1,329.3 1.5%
Special Revenues 9,610.1 3,636.1 14,522.6 27,768.8 30.4%Central Grants 8,444.3 - 11,508.9 19,953.2 21.9%Savings 817.0 3,636.1 2,689.7 7,142.8 7.8%Borrowing 348.8 - 324.0 672.8 0.7%
Total Revenues 22,864.4 27,529.6 40,803.2 91,197.2 100.0%Note: *Includes sanitary districts, provincial/changwad administrative organizations (PAOs), and
subdistrict/tambon administrative organizations (TAOs)Source: Estimatesfor FY1997from the Department ofLocal Administration
5.20 The proposed devolution of revenue authority is based on the goal that, by the end of the8th Plan period (2001), the share of local revenue relative to total government revenues(including intergovernmental transfers) will increase to 20 percent. In addition, local revenues areexpected to increase to 35 percent of total government revenues by the end of the 9th Plan period(2006). Whether this objective is driven by an offloading of expenditure responsibility to localgovernments in light of the need to reduce the central government's budget deficit, or a means tospur local expenditure responsibility is unknown. International experience strongly shows thatdecentralization can have disastrous effects - including overlapping expenditure provision andmacro-instability-- if financing precedes functional assignment of responsibilities.
5 See Annex Table A27 for detailed data on local tax revenues in FY97.
78 Thailand: Public Finance Review
5.21 The goal of a 20 percent local share of revenues may be achievable, if appropriaterevenues are transferred or devolved to local governments. For example, a doubling of national-to-local transfers would account for 15 percent of total revenues. Financing the increasedtransfers to local governments could be achieved by applying surcharges to existing central taxes(e.g., excise taxes on tobacco, alcohol, cars, appliances; the VAT, or petroleum taxes);government officials have noted that excise taxes would be the most likely revenue source to beincreased, followed by the VAT.6 Given other demands on the budget (i.e., the deficit andincreased debt service payments), increasing these transfers would require higher overall taxes,unless accompanied by reductions in other central government expenditures.
5.22 The additional 5 percent of total revenues (to meet the 20 percent target) could begenerated by increased local government revenue mobilization - either through improvedadministration of existing revenue sources (i.e., charges and fees), restructuring existing taxes(e.g., creating a viable property tax from the land and building tax and local development tax) ordeveloping new sources of revenue. The possibility of establishing a viable local property tax isconsidered below.
Local Property Taxes
Land and Building Tax7
5.23 This tax has changed little since its introduction in the Land and Building Tax Act of1932 when it replaced taxes levied on market stalls, buildings, boats and rafts. It was initiallylevied only in Bangkok; its coverage was extended in 1944 and 1956 to include all municipalitiesand sanitary districts, and again in 1972 to include Changwad Administrative Organizations (orthe current PAOs).
5.24 The base of this tax includes houses, apartments and buildings (including structuraladditions) used for commercial or manufacturing purposes, or those unoccupied by their owners.Owner-occupied, residential houses and buildings are exempt from this tax, as are royal palacesowned by the crown, government-owned buildings used for public purposes, non-profit publichospitals and educational institutions, religious buildings, and buildings unoccupied for 12months or longer. The exemption of owner-occupied housing was originally intended to reducethe inequity and potential distortions arising from the incomplete coverage of the tax since somemunicipalities levied the tax while others did not.
5.25 The tax is calculated at a fixed rate of 12.5 percent of the annual value of these housesand buildings. Annual value is based on the rent received during the previous year as reported onthe owner's tax return, or is assessed by the local tax authority. Tax assessors may revise thereported rental figure if the rent appears too low--a provision which encourages the negotiation ofrental values and diminishes the uniformity of assessment. Gross non-reporting and under-reporting of rental income is common, which is further compounded by the lack of accurate andtimely valuation data that could be used to provide administrative checks for under-reporting.
6 A surcharge on income taxes would also generate significant revenue, although officials did not mentionthis tax base for a surcharge7 Also known as the House and Buildings Tax, the Buildings and Land Tax, the House and Land Tax, thePremises and Land Tax, and the House and Rent Tax.Houses and buildings occupied by relatives of the owner are taxed; see RTI (1991, p. 3-2).
Fiscal Decentralization 79
5.26 The land and building tax is the most important of the locally levied taxes of localgovernments (its share of local tax revenue generally accounts for 80 percent of smaller urbangovernments and 90 percent for BMA). Roughly two-thirds of this tax is collected in BMA, andrevenue increases generally reflect growth in commercial activity in BMA and Chiang Mai. Theelasticity of this tax with respect to GDP is 1.2.9 Despite its prominence as a local tax, the yield ofthe land and building tax is well below its potential due to the exemption of owner-occupiedproperty, its base of rental rather than capital value, and its poor tax administration. DOLAestimates that as much as 70 percent of the tax base is exempted as owner-occupied property.
5.27 Collections are low due to underreporting and evasion, inadequate databases and recordkeeping, and weak enforcement. For example, the rental base of the tax typically does not includerental payments for fumishings (paid separately), nor annual payments required to secure leases(also paid separately from rent). Taxpayers evade paying the tax since the rate is high and appliedunevenly. Studies of the property tax collection efficiency in selected Thai local governmentsshowed that improved tax administration would substantially increase collections in BMA(generating an additional Baht I billion annually) and Chiang Mai."0
5.28 The house and building tax is essentially a rent tax-- owner-occupied buildings generateno rent and therefore are not taxed. In Thailand's urban areas, rented dwellings are typicallyoccupied by lower-income people who are unable to afford their own homes. The owners of thesedwellings typically pass along the house and building tax to their tenants either by increasing therent and/or charging an up-front, annual payment in addition to the rent." Hence the house andbuilding tax is disproportionately paid by low-income households and is more regressive thanproperty taxes in many other countries.
5.29 Horizontal equity is also violated in that owner-occupied property is not taxed, whereasproperty occupied by the owner's immediate family is taxed. Public enterprises receive benefitsfrom the services provided by local governments, and charge local governments for the servicesthat they provide. Yet they do not pay the tax. Owner-occupiers also benefit from these localservices and infrastructure without paying for them.
5.30 Owners of taxable properties are legally required to submit a property statement to theirlocal government each year. This statement identifies the properties to be included in the list oftaxable properties and provides information on the assessed, rental value of each property, andthereby establishes the base of the tax. These lists are often incomplete because many ownersnever submit statements for their property. Even where local governments have undertaken taxmapping studies to map, classify and identify all taxable properties within each district, propertytax units often fail to use these maps in compiling the list of taxable properties."2
5.31 These unidentified properties could be included in the list of taxable properties if theproperty tax due were a charge against the property. However, in Thailand, unlike many othercountries, land and building tax liabilities do not accumulate as a debt against the land and areeasily avoided by transferring ownership. Another weakness is the highly manual nature of the
9 Detailed calculations of this elasticity are included in Annex Table A27.'° RTI analyzed the BMA case in 1987 and Louis Berger International analyzed the case in Chiang Mai in
1991." RTI (1991, p. 3-3).12 Archer, p. 12.
80 Thailand: Public Finance Review
administrative system: listing, filing, assessing, and billing, among other tasks are donemanually, in a time consuming and inefficient manner that is susceptible to omissions and losses.
Local Development Tax'3
5.32 This tax, which is based on the Local Development Tax Act of 1965, is levied against theassessed, capital value of land excluding structures and crops. All land owners are subject to thetax, unless specifically exempt. Exemptions are granted for owner-occupied residential land,agricultural land below specific sizes, government properties, and land with structures alreadysubject to the land and building tax. The assessed value of each property is determined by the areaof that property (denominated in units called wahs) and the assessed property value per unitwithin a particular jurisdiction as determined by a local committee. This committee is appointedby the local mayor or provincial governor, and it establishes a median unit value for each districtby averaging at least three recent sale prices of land within the district within the past yearwithout regard to value of structure or cultivation. Once determined, the assessed value issupposed to be used for a period of four years. However, a Royal Decree issued in 1982suspended the reassessment due at that time, so that the tax is based on assessed values based onland sales in 1978.'4
5.33 While the rate of this tax is progressively defined, and increases with the size of landholdings, the effective rate is regressive. A schedule of 34 rates applies to the median price oftaxable land, ranging from:
e Baht 0.50 per rai on land valued at Baht 200 per rai or less
- Baht 70 per rai on land valued up to Baht 30,000 per rai (effective rate of 0.50 percent)
* Baht 25 per rai for each additional Baht 10,000 per rai (effective rate of 0.25 percent)
5.34 The breadth of exemptions granted for this tax are shown by the low share of taxable landparcels to total land parcels (on average, only 15 percent of parcels are taxable). Henceelimination of the exemptions for owner-occupied residential land and properties already subjectto the land and building tax could increase tax revenues substantially. While local developmenttax revenues grew an average of 6.1 percent per year from 1980 to 1992 (due to the addition oflands not previously recorded in the base), this tax captured very little of the overall growth ineconomic activity. Losses from the lack of reassessment since 1981 have not been recorded.
5.35 Despite its "progressive" rate structure, this tax is regressive with regard to the value ofthe land since the rate applied declines as property values increase. Horizontal equity is alsoviolated in that owner-occupied land is not taxed. Like the land and buildings tax, the benefitsreceived criterion is violated since public enterprises and owner-occupiers also benefit from theselocal services and infrastructure without paying for them.
5.36 The low collections of this tax are hardly worth their cost: procedures and records areinadequate and median land values and tax rates are very low due to the restrictions on valuingland at 1981 levels. At present rates, a land parcel valued at Baht I million pays only Baht 2,500in tax per year. The exemption of properties subject to the land and buildings tax causes
'3 Also known as the Local Development Tax.4 Archer, Journal of Property Tax Assessment and Administration, p. 8.
Fiscal Decentralization 81
considerable administrative confusion. Because of weaknesses in tax mapping, and the fact thatmany rental buildings are constructed within the compound of an owner-occupied house, theserental properties are frequently treated as an owner occupied house and are not taxed."5 Also, lawsspecify that landowners are to informn local authorities of changes in land use within 30 days, yetthere is no penalty for non-compliance and enforcement of this requirement is very weak."6
International Comparisons of Property Tax Structures
5.37 International comparisons of property tax revenues show that local property taxes areunderutilized (see Annex Table A28). In Thailand, local property taxes account for 0.1 percent ofGDP, which is considerably less than other countries in the region--Malaysia (0.4 percent), China(0.2 percent), Indonesia (0.2 percent), the Philippines (0.3 percent)--or other industrializedcountries--Canada (3.3 percent), the United States (2.6 percent), New Zealand (1.7 percent), andAustralia (1.1 percent.)'"
5.38 The structural aspects of property taxes in selected industrialized and developingcountries are summarized in Annex Table A29 and reflect the work of Youngman and Malme(1994). The application of multiple property taxes as found in Thailand is quite common, asreflected in the experience of Australia, France, Japan, South Korea and the United Kingdom.Virtually all of the countries profiled tax immovable property in the form of land andimprovements (i.e., buildings). The United States is an exception in that the tax base often alsoincludes tangible personal property (e.g., business equipment, industrial machinery, transmissionunits and vehicles). Thailand differs from many other countries in basing its building and land taxon rental values rather than capital values, Many other countries--including Australia, Canada,Indonesia, Japan, South Korea and the United States--rely predominantly on capital value taxbases.
5.39 Thailand is an outlier in that it applies a very high tax rate (12.5 percent) to the land andbuildings tax. South Korea has the second highest nominal tax rate at 5 percent, but this rate islevied on land as a means to discourage property speculation. Many countries' nominal propertytax rates are in the 2-3 percent range. International comparisons of tax rates must be based oneffective tax rates, that is the nominal (statutory) tax rate adjusted for the appropriate assessmentratio. Once this adjustment is made, rates in other countries are even lower; for example,Indonesia's effective property tax rate drops to 0.1 percent when its 20 percent assessment ratio istaken into account.
5.40 Intergovernmental aspects of property taxes for those same countries are compared inAnnex Table A30. In aspects of enacting legislation, gathering data on property ownership andvaluation, appraising property, setting the tax rate, administering and collecting the tax, andreceiving the tax proceeds, Thailand is similar to many other countries included in the table. Inmany countries, the central government plays an important role in enacting legislation andcollecting data. It also often sets the tax rate and in some cases administers and collects the tax.Regional and local governments play more important roles in property taxation in industrialized
15 RTI, p. 3-6.16 See Department of Local Administration, Summary of Problems in Collecting Property and Land Tax,Local Development Tax and Sign Board Tax, 1998.17 Data are from the IMF's Government Finance Statistics Yearbook; see Annex Table A28. Property taxesin China, Indonesia and Malaysia are collected by state governments.
82 Thailand: Public Finance Review
countries, such as Australia, Canada, the United Kingdom and the United States--countries inwhich local governments also generally exercise more autonomy. In Australia, Canada and theUnited States, local governments exercise complete discretion in setting local property tax rates.
Property Tax Administration
5.41 Relative to local income or consumption taxes, property taxes may be easier toadminister: property is visible and immovable and can be clearly identified within a local area;possession is difficult to conceal; and the property can serve as a guarantee for the payment of thetax. Despite these potential administrative "handles," property taxes may be difficult or costly toadminister since substantial effort may be required in identifying and assessing the value ofproperty and in collecting revenues. Proper administration requires that: (i) all properties berecorded properly; (ii) values are up-to-date and accurate; (iii) taxes are levied on all eligibleproperties; and (iv) collections are diligent, uniform and fair. The administrative costs of propertytaxes will vary depending on the structure of the tax and quality of administration. For example,establishing a minimum threshold (or standard deduction) before the property tax is imposedreduces administrative costs and frees tax administration resources to be channeled to higher-yield properties. Complicated tax structures that exempt many properties or apply differential taxrates to various classes of property may be very costly to administer.
5.42 The administration of property taxes generally entails five steps: (i) identifying theproperty; (ii) calculating its relative value; (iii) assessing the tax liability; (iv) informing thetaxpayer of the liability due; and (v) collecting the tax. Weaknesses in one stage ofadministration--e.g., if a low proportion of properties are identified, or properties do not reflectmarket values, or tax liabilities are calculated incorrectly, or bills are not delivered in a timely orcomplete way, or collections are incomplete--can counteract strengths in other stages. It shouldalso be noted that the sequence of administration should be ongoing rather than static; sustainedincreases in property tax revenues require that the full sequence be repeated annually.
5.43 The purpose of discovery and identification is to discover all properties subject totaxation and to collect the information needed to impose the tax. Discovery may take placethrough self declaration (where the taxpayer is compelled to provide the information to the taxauthority) or government inventory (where the tax authority obtains the information). Thailanduses self declaration, which is an inexpensive though frequently unsuccessful method ofdiscovery. Self declaration succeeds only where the tax authority is able to induce taxpayers tofile full and accurate property declarations. All countries relying on this method use penalties toinduce compliance. These penalties must be credible, however, if they are to achieve taxpayercompliance.
5.44 The most common approach to discovery is the inventory system, where the tax authorityworks in the field to obtain the data needed to administer the tax. An inventory system requires ageographical referencing system to ensure that all properties are identified and assigned a uniqueidentification code. Industrialized countries typically rely on parcel maps created by taxauthorities or other government agencies. Because these parcels maps frequently do not exist inan advanced form in many developing countries, less stringent mapping characteristics are used.To meet the key characteristics of the identification function, the map must enable the taxingauthority to account for all properties and identify them in a way that cannot be eradicated by thetaxpayer.
Fiscal Decentralization 83
5.45 Programs to upgrade the efficiency of tax mapping and property registration for localgovernments have been underway since 1977. The Ministry of Interior has mandated thatmunicipalities nationwide conduct property registration in order to enhance tax collection andexpedite tax payments; in practice, operational guidelines regarding this program are stillunclear."8
5.46 Within the framework of the UNDP-Thai Regional Urban Development Programme,implemented by the Local Government Affairs Division of the Ministry of Interior, two pilotprojects were conducted to apply Geographic Information Systems (GIS) to property taxes. Oneproject was carried out in Nakhom Ratchasima (Korat) and the other in Ban Bung municipality. Itwas expected that the introduction of GIS technology would improve the tax mapping capabilitiesof the pilot municipalities and thereby provide an adequate base for property valuation, taxationand collection. The consultants working in Ban Bung found its maps to be obsolete and of verypoor quality.'9 It is too early to tell whether the implementation of GIS systems will increaseproperty tax revenues. To date, analyses of the pilot projects has revealed that the implementationof the GIS was more costly than originally anticipated--in terms of systems, staff andmaintenance--the specific aspects of these costs are currently being analyzed. A greater challengeto be overcome was the resistance of local officials to view the mapping exercise as a means toimprove their tax administration and generate more revenues. According to a DOLA official,officials in these pilot municipalities are unaccustomed to using maps and are more comfortableusing traditional, ad hoc approaches.20
5.47 Property values are generally defined in one of two ways: (i) on the basis of the rent thatthe property would be expected to yield (or annual rental value); or (ii) according to its expectedsales price (or capital value.) As noted earlier, Thailand relies on the rental value approach for theland and buildings tax and the capital value approach for the local development tax. Non-value-based property taxes are also common in other countries, which rely on area-based or othermeasures.
5.48 Of greater concern than the base of value is how value is derived. Valuation is often themost difficult and costly element of property tax administration. Many developed countries oftenassign the task of valuing land and buildings to central government valuation agencies. Thismodel significantly reduces bargaining possibilities, increases the efficiency of valuation, andassures that the same value is used for different property-related taxes. Regardless of whethervaluation is conducted centrally or locally, such systems should be objective (to reduce thelikelihood of dispute or collusion) and relatively easy to administer, especially with regard tolocal skills and available information. Valuation is typically conducted either based on directmarket information or by mass appraisal (where market values are extrapolated based on aformula and a sample of properties). Direct market information is often expensive to collect andmay be subject to bribery or other forms of corruption that limit its objectivity. This informationalso applies only to those properties that are sold, which are a subset of the full market. Massappraisal is based on an analysis of a sample of recent property transactions (sales or rentals) orconstruction data to identify the physical characteristics that determine a property's value. Thesecharacteristics are then quantified in a formula (or often a table), which are then used along with
18 Department of Local Administration, Report on Efficiency Upgrading, Improvements in Tax Mappingand Property Registration and Revenue Collection, 1998.'9 George G. van der Meulen, "Fiscal Cadastre: A Necessary Step Towards Decentralization, the Case ofBan Bung Municipality in Thailand," draft, p. 12.20 Based on an interview with K. Anucha in DOLA.
84 Thailand: Public Finance Review
the physical characteristics of each property in the jurisdiction's tax base to calculate valuationsfor individual properties. The valuation process should be dynamic and ongoing--changes inproperty characteristics (e.g., new construction or annexation), as well as changes in ownership,should be recorded regularly (although not necessarily annually)."
5.49 Once the valuation roll has been established, the nominal tax rate (and assessment ratio, ifapplicable) are applied to individual property values to determine the property tax liability. Thisliability (or property value) may be appealed by the property owner, and any difference must beresolved before revenues are collected.
5.50 Property tax revenue collections largely depend on knowing who owes what, and havingthe means and incentives to make those taxpayers pay. Collections also depend on the legalframework--defining what is liable for taxation, what constitutes notification, and what penaltiesmay be imposed-and collection administration--managing the production of bills, monitoringpayments and pursuing delinquents. As noted previously, land and building tax delinquencies inThailand are particularly challenging to collect since these liabilities do not accumulate as a debtagainst the land and are easily avoided by transferring ownership.
Opportunities for Reform
5.51 The salient aspects of the proposed reform are as follows:
* Introduce a single property tax for local government to replace the existing land and buildingtax and local development tax
* Base the combined property tax on the capital value, assessed at "market rates"* Property value would be declared by owners, with confirmation by the relevant local
government* Expand the tax base by removing many exemptions such as those applied to owner occupied
housing, while exempting manufacturing equipment (which is currently taxed at a 12.5percent rate under the land and buildings tax)
* Property tax rates would vary according to five local government classifications with some(limited) local discretion for setting the property tax rate
* A threshold would be established to exempt low-income properties--it has not beendetermined whether this exemption would apply to taxes due or the value of the property
5.52 Combining the two existing property taxes into a uniform property tax will greatlyenhance its ease of administration and should also enhance taxpayer compliance. A significantadvantage of moving to a capital value system is that it provides the same assessment basis forowner-occupied, rented and non-residential property, thereby substantially improving horizontaland vertical equity. The definition of the tax base in the draft legislation should be clarified andbased on the concept of "property" (i.e., land including all improvements and buildings on theland). Section 14 of the draft legislation defines the tax base for land with buildings as: "the landprice valuation and price assessment of the building without depreciation cost;" a preferreddefinition would rely on the capital value of property (as defined above) and would not separatethe value of land plus the value of building.
21 Even countries with highly efficient property tax systems, such as Denmark, do not attempt to valueevery plot of land and building every year. The essential requirement is to have a periodic re-valuation(preferably every 2-4 years), with automatic inflation adjustments in-between valuation years.
Fiscal Decentralization 85
5.53 Self declaration of property values has not worked well in other countries. It will need tobe matched with substantial improvements in property (and improvement/building) informationfor it to succeed in Thailand, especially since there is so little experience in valuingimprovements. Even the private sector has limited experience in this area. The Central ValuationAuthority in the Department of Land could play a key role in professionally determining theassessed value of property (including land and improvements and buildings).
5.54 Including owner-occupied buildings in this tax would not only enhance revenues, but alsoenhance the administration and equity of the tax since all buildings--whether occupied by ownersor renters--would be subject to the same tax. DeVoy (1997) estimated that if all residential,commercial and industrial properties were assessed at full market value and taxed at a I percentproperty tax rate, with full compliance, the property tax could yield at least 10 times morerevenue to municipalities than the combined house and buildings tax and local development taxcurrently yield.22 If the rate were only 0.5 percent and only 75 percent of potential collectionswere collected, revenues from such property taxes would still increase at least 300 percent.Potential concerns in Thailand are to change the mindset of local govemment and taxpayers awayfrom operating within a system riddled by tax loopholes to one with a broadly defined base andmore uniform compliance, and to avoid repeating the legacy of relying on tax loopholes.
5.55 Applying a system of multiple tax rates will greatly complicate tax administration,without obvious benefits in terms of tax collections. A preferred approach would be to establish alimit (perhaps by province) and to allow local governments discretion in setting the tax rate up tothe defined limit, based on their overall fiscal position--i.e., based on a costing of the services tobe provided locally and the availability of other resources to finance these services.
5.56 Allowing local discretion in setting property tax rates is an important tool to promotelocal autonomy. A key justification for decentralization is to improve accountability--in order forlocal officials to be held accountable, they must have some control over the revenues that theycollect. Allowing some discretion in setting property tax rates is a key step in promoting thisaccountability.
5.57 Exempting a minimum threshold of property values is used in many countries to addressequity concerns of taxing low-income groups and also to enhance administrative effectiveness(the costs of collecting revenues from low-value properties often exceed the revenues collected).It is generally more cost effective to exempt a set property value (since taxpayers with propertiesbelow the value do not file returns) than to exempt a share of the property tax (since there is anadministrative cost associated with calculating the exempt share for each taxpayer).
5.58 Reform efforts should not generally be overloaded with policy objectives; thefundamental objective should be to raise revenue. Thailand's objective of promoting efficientland use by doubling property tax rates on vacant land to discourage speculation may be betterachieved through land use planning and zoning than through the property tax system.
5.59 Property tax structures and valuation processes should be clearly separated (both toenhance the efficiency of the overall system and to diminish potential corruption). Valuationshould be conducted on a standardized (and professional basis). The proposed valuation bill could
22 DeVoy, Final Summary Report, p. 44.
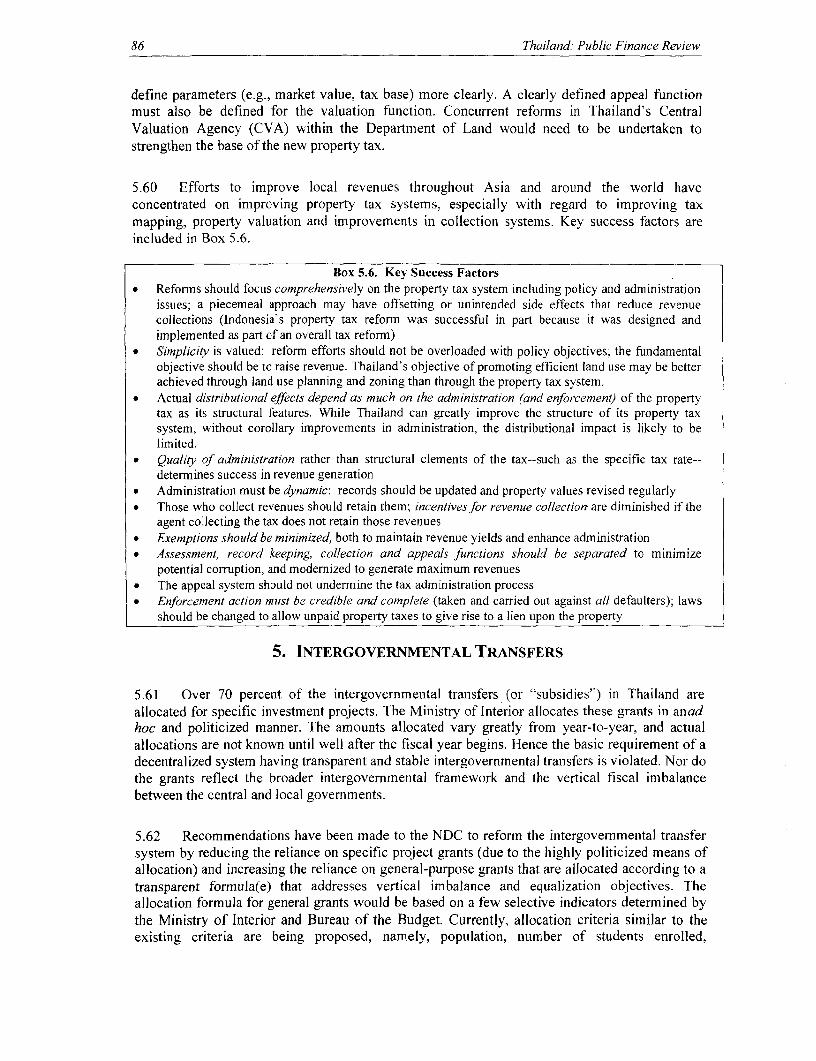
86 Thailand: Public Finance Review
define parameters (e.g., market value, tax base) more clearly. A clearly defined appeal functionmust also be defined for the valuation function. Concurrent reforms in Thailand's CentralValuation Agency (CVA) within the Department of Land would need to be undertaken tostrengthen the base of the new property tax.
5.60 Efforts to improve local revenues throughout Asia and around the world haveconcentrated on improving property tax systems, especially with regard to improving taxmapping, property valuation and improvements in collection systems. Key success factors areincluded in Box 5.6.
Box 5.6. Key Success Factors. Reforms should focus comprehensively on the property tax system including policy and administration
issues; a piecemeal approach may have offsetting or unintended side effects that reduce revenuecollections (Indonesia's property tax reform was successful in part because it was designed andimplemented as part of an overall tax reform)
* Simplicity is valued: reform efforts should not be overloaded with policy objectives; the fundamentalobjective should be to raise revenue. Thailand's objective of promoting efficient land use may be betterachieved through land use planning and zoning than through the property tax system.
. Actual distributional effects depend as much on the administration (and enforcement) of the propertytax as its structural features. While Thailand can greatly improve the structure of its property taxsystem, without corollary improvements in administration, the distributional impact is likely to belimited.
* Quality of administration rather than structural elements of the tax--such as the specific tax rate--determines success in revenue generation
* Administration must be dynamic: records should be updated and property values revised regularly. Those who collect revenues should retain them; incentives for revenue collection are diminished if the
agent collecting the tax does not retain those revenues* Exemptions should be minimized, both to maintain revenue yields and enhance administration* Assessment, record keeping, collection and appeals functions should be separated to minimize
potential corruption, and modernized to generate maximum revenues. The appeal system should not undermine the tax administration process* Enforcement action must be credible and complete (taken and carried out against all defaulters); laws
should be changed to allow unpaid property taxes to give rise to a lien upon the property
5. INTERGOVERNMENTAL TRANSFERS
5.61 Over 70 percent of the intergovernmental transfers (or "subsidies") in Thailand areallocated for specific investment projects. The Ministry of Interior allocates these grants in anadhoc and politicized manner. The amounts allocated vary greatly from year-to-year, and actualallocations are not known until well after the fiscal year begins. Hence the basic requirement of adecentralized system having transparent and stable intergovernmental transfers is violated. Nor dothe grants reflect the broader intergovemmental framework and the vertical fiscal imbalancebetween the central and local governments.
5.62 Recommendations have been made to the NDC to reform the intergovernmental transfersystem by reducing the reliance on specific project grants (due to the highly politicized means ofallocation) and increasing the reliance on general-purpose grants that are allocated according to atransparent formula(e) that addresses vertical imbalance and equalization objectives. Theallocation formula for general grants would be based on a few selective indicators determined bythe Ministry of Interior and Bureau of the Budget. Currently, allocation criteria similar to theexisting criteria are being proposed, namely, population, number of students enrolled,
Fiscal Decentralization 87
development levels based on revenue collection, etc. These grants could also promoteaccountability by being based on performance auditing. Matching grants would still be offered forspecific investments (though much smaller in overall magnitude), but a transparent andpredictable allocation formula would be used and the matching share would be increased topromote better projects. Earlier proposals to the Cabinet suggested that the total pool ofintergovernmental transfers be determined as a defined percentage of central governmentexpenditures, with that percentage declining over time local governments mobilize greater own-source revenues.
6. LOCAL BORROWING
5.63 While local govemments have the legal right to borrow, few do so because of limitedresources and experience, and cumbersome approval processes by the Ministry of Interior.International experience has shown that macroeconomic fiscal imbalances can arise if localgovernment borrowing is not managed carefully. Historically, local government borrowing hasbeen relatively unimportant in Thailand, in that much local infrastructure was funded throughtransfers from the central government or through local government savings?3 As decentralizationproceeds, local governments will need to assume greater responsibility for planning, financingand managing their own infrastructure, and borrowing may become an increasingly importantsource of financing this infrastructure.
5.64 Reforms underway include the development of the Regional Urban Development Fund(RUDF) as a financial intermediary that channels credit to creditworthy local governments. TheRUDF is operated by the Government Savings Bank, and it provides long-term lending at marketinterest rates to creditworthy local governments for viable, small-scale infrastructure projects. Aspart of establishing the RUDF, considerable technical assistance was provided to strengthen localgovernment's capabilities in preparing and managing projects, financial reporting, and enhancinglocal accountability. Establishing a framework for responsible borrowing would require futurereforms in: establishing aggregate limits on local indebtedness, local bankruptcy regulations andother mechanisms for promoting responsible local borrowing.
7. LOCAL ACCOUNTABILITY
5.65 Local accountability must be enhanced if decentralization is to succeed. Local residentsand organizations--local government, business, labor and neighborhoods--best know andunderstand local problems and their feedback--through civic fora and payment of local taxes andcharges-- is integral to assure high-quality, local decisions. Local governments must not onlyincorporate this collective wisdom into their decision making, but must also help neighborhoods,businesses, and labor participate more effectively in public affairs by increasing their access toand understanding of public information (including local budgets and development plans.
5.66 At present, local officials are not fully aware of their responsibilities and functions,especially in light of changes legislated in local administrative organization acts. TheGovernment will disseminate these revised acts to all local officials. Another prospect forenhancing local accountability is to require the direct election of all local officials. The Governorof BMA is currently the only directly elected local official (the Mayor of Pattaya City will
23 See World Bank Assessment Mission, 1997.
88 Thailand: Pzublic Finance Review
eventually be directly elected.) Unless the local citizens have a direct voice in choosing theirleaders, local accountability will not be fully achieved and mismanagement and corruption mayarise.
5.67 Other critical reforms to promote better local accountability are strengthening local fiscaland performance reporting, and enhancing local revenue mobilization. The substantial increasesin central-to-local subsidies anticipated as a means to increase local revenues may have theoffsetting effect of diminishing local accountability.
8. MONITORING THE STATUS OF DECENTRALIZATION AND LOCAL FISCALCONDITION
5.68 While it has only recently become possible-since the establishment of the NDC-tomonitor the status of decentralization reforms, the Government's overall decentralization policyframework is not clearly understood. A high priority is to assure that the NDC is adequatelystaffed and given sufficient resources to perform its duties. The central government must alsodevelop the capabilities of the NDC to monitor the status of decentralization--both in terms of itspotential macroeconomic impact and its achievement of decentralization objectives--anddisseminate information on local government finance on a regular basis. This information isimportant in encouraging local accountability, for monitoring the status of decentralizationinitiatives, and for introducing subsequent reforms in response to the dynamic nature ofintergovernmental fiscal relations.
5.69 In addition, local standards and benchmarks for monitoring and evaluating localperformance have only recently begun to be developed, e.g., indicators for infrastructure services,health, education, land use planning. The development and implementation of these indicatorsand norms will be critical for monitoring local performance, both during the initial phases ofdecentralization and in subsequent periods.
THAILAND'S REFORM STRATEGY
5.70 To achieve the objectives outlined above, the Public Sector Reform Program includes aseries of activities to promote decentralization; these tasks are listed in Box 5.7.
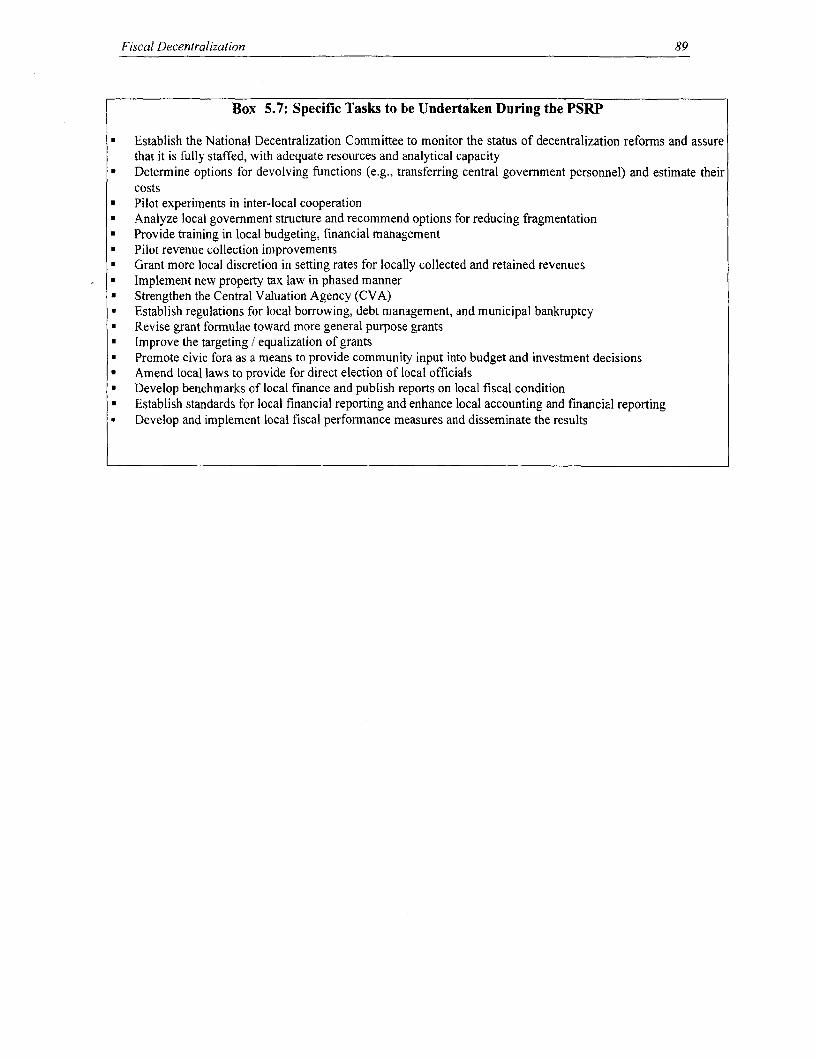
Fiscal Decentralization 89
Box 5.7: Specific Tasks to be Undertaken During the PSRP
* Establish the National Decentralization Committee to monitor the status of decentralization reforms and assurethat it is fully staffed, with adequate resources and analytical capacity
* Determine options for devolving functions (e.g., transferring central government personnel) and estimate theircosts
* Pilot experiments in inter-local cooperation* Analyze local government structure and recommend options for reducing fragmentation* Provide training in local budgeting, financial management* Pilot revenue collection improvements* Grant more local discretion in setting rates for locally collected and retained revenues* Implement new property tax law in phased manner* Strengthen the Central Valuation Agency (CVA)* Establish regulations for local borrowing, debt management, and municipal bankruptcy* Revise grant formulae toward more general purpose grants* Improve the targeting / equalization of grants* Promote civic fora as a means to provide community input into budget and investment decisions* Amend local laws to provide for direct election of local officials* Develop benchmarks of local finance and publish reports on local fiscal condition* Establish standards for local financial reporting and enhance local accounting and financial reporting* Develop and implement local fiscal performance measures and disseminate the results
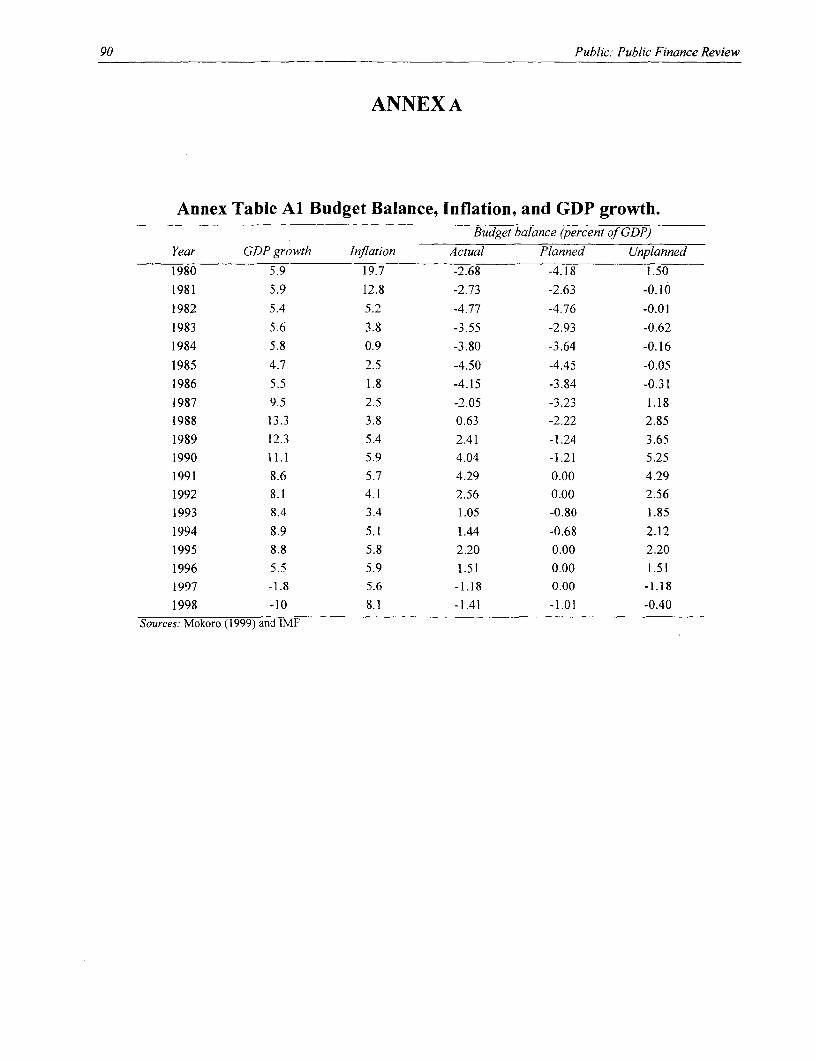
90 Public: Public Finance Review
ANNEX A
Annex Table Al Budget Balance, Inflation, and GDP growth.Budget balance (percent of GDP)
Year GDP growth Inflation Actual Planned Unplanned
1980 5.9 19.7 -2.68 -4.18 1.50
1981 5.9 12.8 -2.73 -2.63 -0.10
1982 5.4 5.2 -4.77 -4.76 -0.01
1983 5.6 3.8 -3.55 -2.93 -0.62
1984 5.8 0.9 -3.80 -3.64 -0.16
1985 4.7 2.5 -4.50 -4.45 -0.05
1986 5.5 1.8 -4.15 -3.84 -0.311987 9.5 2.5 -2.05 -3.23 1.181988 13.3 3.8 0.63 -2.22 2.85
1989 12.3 5.4 2.41 -1.24 3.651990 11.1 5.9 4.04 -1.21 5.251991 8.6 5.7 4.29 0.00 4.291992 8.1 4.1 2.56 0.00 2.561993 8.4 3.4 1.05 -0.80 1.85
1994 8.9 5.1 1.44 -0.68 2.12
1995 8.8 5.8 2.20 0.00 2.201996 5.5 5.9 1.51 0.00 1.511997 -1.8 5.6 -1.18 0.00 -1.18
1998 -10 8.1 -1.41 -1.01 -0.40Sources: Mokoro (1999) and IMF
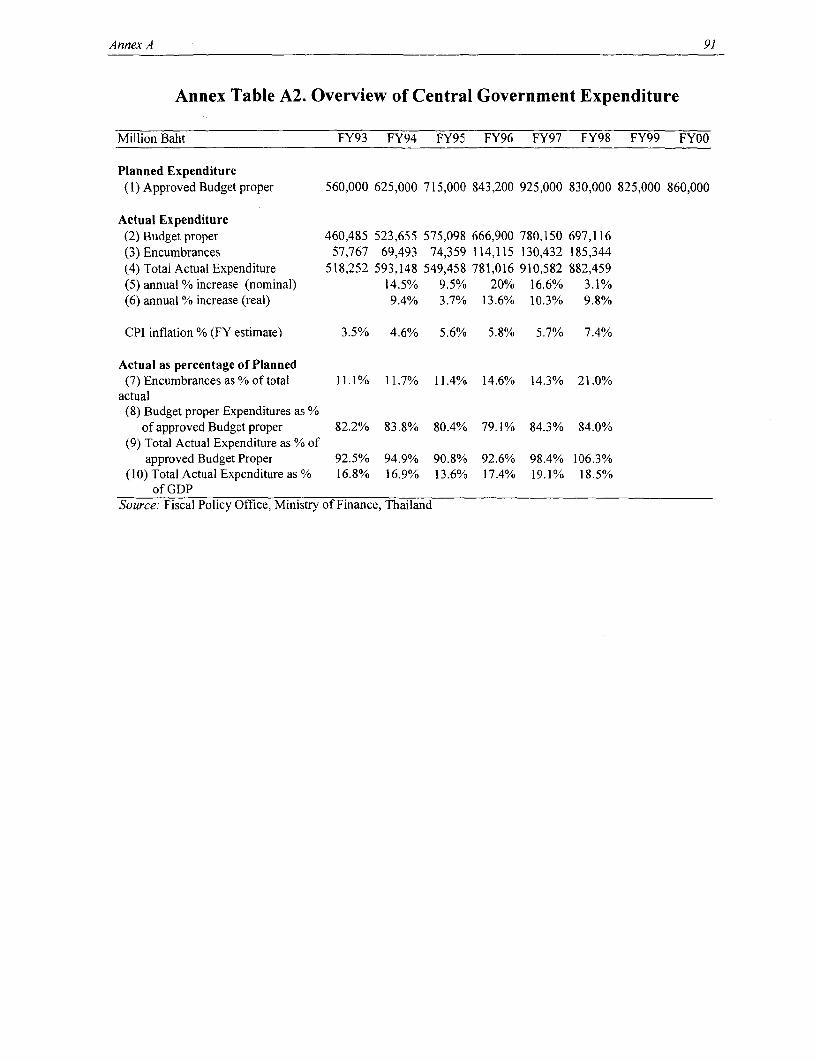
Annex A 91
Annex Table A2. Overview of Central Government Expenditure
Million Baht FY93 FY94 FY95 FY96 FY97 FY98 FY99 FY00
Planned Expenditure(1) Approved Budget proper 560,000 625,000 715,000 843,200 925,000 830,000 825,000 860,000
Actual Expenditure(2) Budget proper 460,485 523,655 575,098 666,900 780,150 697,116(3) Encumbrances 57,767 69,493 74,359 114,115 130,432 185,344(4) Total Actual Expenditure 518,252 593,148 549,458 781,016 910,582 882,459(5) annual % increase (nominal) 14.5% 9.5% 20% 16.6% 3.1%(6) annual % increase (real) 9.4% 3.7% 13.6% 10.3% 9.8%
CPI inflation % (FY estimate) 3.5% 4.6% 5.6% 5.8% 5.7% 7.4%
Actual as percentage of Planned(7)Encumbrancesas%oftotal 11.1% 11.7% 11.4% 14.6% 14.3% 21.0%
actual(8) Budget proper Expenditures as %
of approved Budget proper 82.2% 83.8% 80.4% 79.1% 84.3% 84.0%(9) Total Actual Expenditure as % of
approved Budget Proper 92.5% 94.9% 90.8% 92.6% 98.4% 106.3%(10) Total Actual Expenditure as % 16.8% 16.9% 13.6% 17.4% 19.1% 18.5%
of GDPSource: Fiscal Policy Office, Ministry of Finance, Thailand
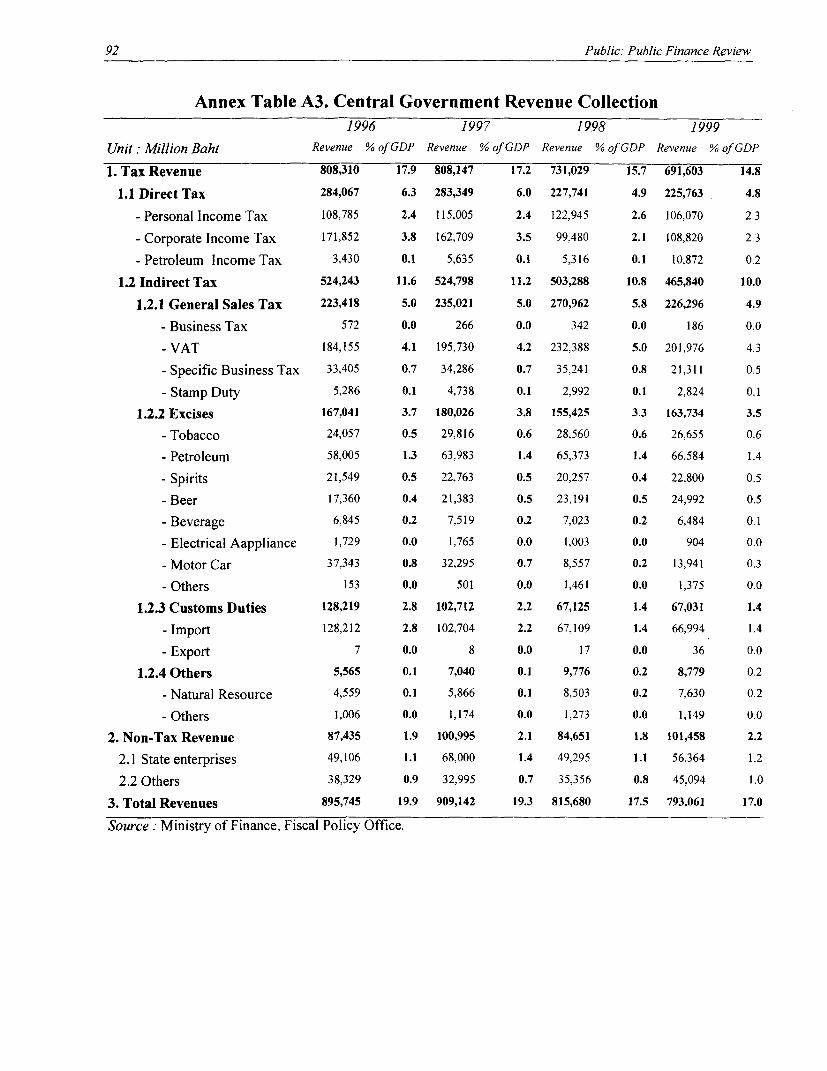
92 Public: Public Finance Review
Annex Table A3. Central Government Revenue Collection1996 1997 1998 1999
Unit: Million Baht Revenue % of GDP Revenue % of GDP Revenue % of GDP Revenue % of GDP
1. Tax Revenue 808,310 17.9 808,147 17.2 731,029 15.7 691,603 14.81.1 Direct Tax 284,067 6.3 283,349 6.0 227,741 4.9 225,763 4.8
- Personal Income Tax 108,785 2.4 115,005 2.4 122,945 2.6 106,070 2.3
- Corporate Income Tax 171,852 3.8 162,709 3.5 99,480 2.1 108,820 2.3- Petroleum Income Tax 3,430 0.1 5,635 0.1 5,316 0.1 10,872 0.2
1.2 Indirect Tax 524,243 11.6 524,798 11.2 503,288 10.8 465,840 10.01.2.1 General Sales Tax 223,418 5.0 235,021 5.0 270,962 5.8 226,296 4.9
- Business Tax 572 0.0 266 0.0 342 0.0 186 0.0- VAT 184,155 4.1 195,730 4.2 232,388 5.0 201,976 4.3- Specific Business Tax 33,405 0.7 34,286 0.7 35,241 0.8 21,311 0.5- Stamp Duty 5,286 0.1 4,738 0.1 2,992 0.1 2,824 0.1
1.2.2 Excises 167,041 3.7 180,026 3.8 155,425 3.3 163,734 3.5- Tobacco 24,057 0.5 29,816 0.6 28,560 0.6 26,655 0.6- Petroleum 58,005 1.3 63,983 1.4 65,373 1.4 66,584 1.4- Spirits 21,549 0.5 22,763 0.5 20,257 0.4 22,800 0.5- Beer 17,360 0.4 21,383 0.5 23,191 0.5 24,992 0.5
- Beverage 6,845 0.2 7,519 0.2 7,023 0.2 6,484 0.1- Electrical Aappliance 1,729 0.0 1,765 0.0 1,003 0.0 904 0.0
- Motor Car 37,343 0.8 32,295 0.7 8,557 0.2 13,941 0.3- Others 153 0.0 501 0.0 1,461 0.0 1,375 0.0
1.2.3 Customs Duties 128,219 2.8 102,712 2.2 67,125 1.4 67,031 1.4- Import 128,212 2.8 102,704 2.2 67,109 1.4 66,994 1.4- Export 7 0.0 8 0.0 17 0.0 36 0.0
1.2.4 Others 5,565 0.1 7,040 0.1 9,776 0.2 8,779 0.2- Natural Resource 4,559 0.1 5,866 0.1 8,503 0.2 7,630 0.2
- Others 1,006 0.0 1,174 0.0 1,273 0.0 1,149 0.02. Non-Tax Revenue 87,435 1.9 100,995 2.1 84,651 1.8 101,458 2.2
2.1 State enterprises 49,106 1.1 68,000 1.4 49,295 1.1 56,364 1.22.2 Others 38,329 0.9 32,995 0.7 35,356 0.8 45,094 1.0
3. Total Revenues 895,745 19.9 909,142 19.3 815,680 17.5 793,061 17.0
Source: Ministry of Finance, Fiscal Policy Office.
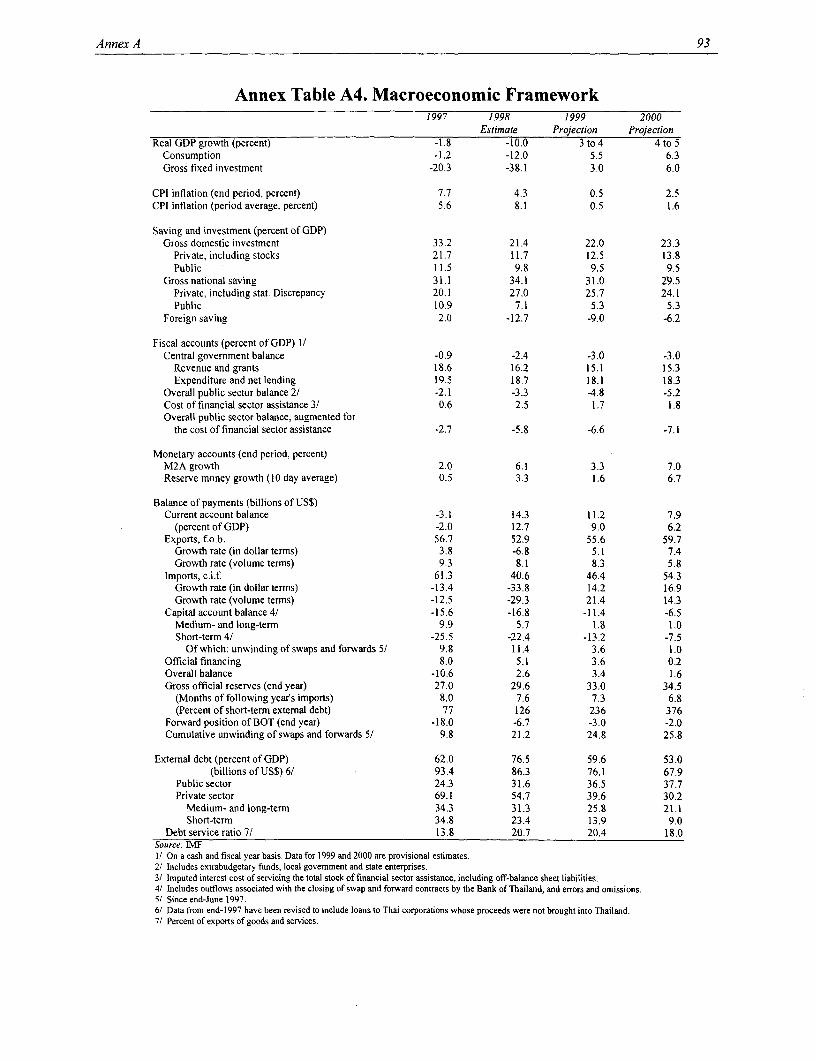
Annex A 93
Annex Table A4. Macroeconomic Framework1997 1998 1999 2000
Estimate Projection ProjectionReal GDP growth (percent) -1.8 -10.0 3 to 4 4 to 5
Consumption -1.2 -12.0 5.5 6.3Gross fixed investment -20.3 -38.1 3.0 6.0
CPI inflation (end period, percent) 7.7 4.3 0.5 2.5CPI inflation (period average, percent) 5.6 8.1 0.5 1.6
Saving and investment (percent of GDP)Gross domestic investment 33.2 21.4 22.0 23.3
Private, including stocks 21.7 11.7 12.5 13.8Public 11.5 9.8 9.5 9.5
Gross national saving 31.1 34.1 31.0 29.5Private, including stat. Discrepancy 20.1 27.0 25.7 24.1Public 10.9 7.1 5.3 5.3
Foreign saving 2.0 -12.7 -9.0 -6.2
Fiscal accounts (percent of GDP) 1/Central government balance -0.9 -2.4 -3.0 -3.0
Revenue and grants 18.6 16.2 15.1 15.3Expenditure and net lending 19.5 18.7 18.1 18.3
Overall public sector balance 2/ -2.1 -3.3 -4.8 -5.2Cost of financial sector assistance 3/ 0.6 2.5 1.7 1.8Overall public sector balance, augmented for
the cost of financial sector assistance -2.7 -5.8 -6.6 -7.1
Monetary accounts (end period, percent)M2A growth 2.0 6.1 3.3 7.0Reserve money growth (10 day average) 0.5 3.3 1.6 6.7
Balance of payments (billions of US$)Current account balance -3.1 14.3 11.2 7.9
(percent of GDP) -2.0 12.7 9.0 6.2Exports, fo.b. 56.7 52.9 55.6 59.7
Growth rate (in dollar terms) 3.8 -6.8 5.1 7.4Growth rate (volume terms) 9.3 8.1 8.3 5.8
Imports, c.i.f 61.3 40.6 46.4 54.3Growth rate (in dollar terms) -13.4 -33.8 14.2 16.9Growth rate (volume terms) -12.5 -29.3 21.4 14.3
Capital account balance 4/ -15.6 -16.8 -11.4 -6.5Medium- and long-term 9.9 5.7 1.8 1.0Short-term 4/ -25.5 -22.4 -13.2 -7.5
Of which: unwinding of swaps and forwards 5/ 9.8 11.4 3.6 1.0Official financing 8.0 5.1 3.6 0.2Overall balance -10.6 2.6 3.4 1.6Gross official reserves (end year) 27.0 29.6 33.0 34.5
(Months of following year's imports) 8.0 7.6 7.3 6.8(Percent ofshort-term extemal debt) 77 126 236 376
Forward position of BOT (end year) -18.0 -6.7 -3.0 -2.0Cumulative unwinding of swaps and forwards 5/ 9.8 21.2 24.8 25.8
Extemal debt (percent of GDP) 62.0 76.5 59.6 53.0(billions of US$) 6/ 93.4 86.3 76.1 67.9
Public sector 24.3 31.6 36.5 37.7Private sector 69.1 54.7 39.6 30.2
Medium- and long-term 34.3 31.3 25.8 21.1Short-term 34.8 23.4 13.9 9.0
Debt service ratio 7/ 13.8 20.7 20.4 18.0Source: IMF1/ On a cash and fiscal year basis, Data for 1999 and 2000 are provisional estimates.2/ Includes extrabudgetary funds, local govemment and state enterprises.3/ Imputed interest cost of servicing the total stock of financial sector assistance, including off-balance sheet liabilities.4/ Includes outflows associated with the closing of swap and forward contracts by the Bank of Thailand, and errors and omissions.5/ Since end-June 1997.6/ Data from end-1997 have been revised to include loans to Thai corporations whose proceeds were not brought into Thailand.7/ Percent of exports of goods and services.
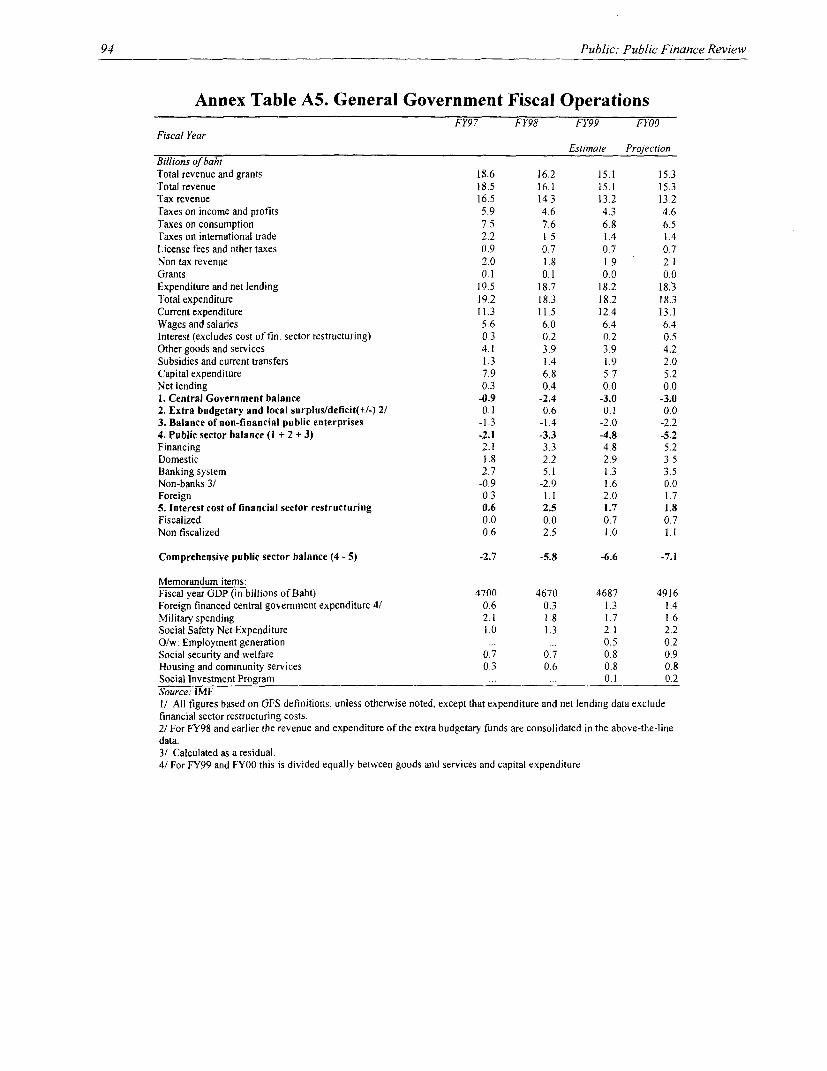
94 Public: Public Finance Review
Annex Table A5. General Government Fiscal OperationsFY97 FY98 FY99 FYOO
Fiscal YearEstimate Projection
Billions of bahtTotal revenue and grants 18.6 16.2 15.1 15.3Total revenue 18.5 16.1 15.1 15.3Tax revenue 16.5 14.3 13.2 13.2Taxes on income and profits 5.9 4.6 4.3 4.6Taxes on consumption 7.5 7.6 6.8 6.5Taxes on international trade 2.2 1.5 1.4 1.4License fees and other taxes 0.9 0.7 0.7 0.7Non tax revenue 2.0 18 19 2.1Grants 0.1 0.1 0.0 0.0Expenditure and net lending 19.5 18.7 18.2 18.3Total expenditure 19.2 18.3 18.2 18.3Current expenditure 11.3 11.5 12.4 13.1Wages and salaries 5.6 6.0 6.4 6.4Interest (excludes cost of fin. sector restructuring) 0.3 0.2 0.2 0.5Other goods and services 4.1 3.9 3.9 4.2Subsidies and current transfers 1.3 1.4 1.9 2.0Capital expenditure 7.9 6.8 5.7 5.2Net lending 0.3 0.4 0.0 0.01. Central Government balance -0.9 -2.4 -3.0 -3.02. Extra budgetary and local surplus/deficit(+/-) 2/ 0.1 0.6 0.1 0.03. Balance of non-financial public enterprises -1.3 -1.4 -2.0 -2.24. Public sector balance (1 + 2 + 3) -2.1 -3.3 -4.8 -5.2Financing 2.1 3.3 4.8 5.2Domestic 1.8 2.2 2.9 3.5Banking system 2.7 5.1 1.3 3.5Non-banks 3/ -0.9 -2.9 1.6 0.0Foreign 0.3 1.1 2.0 1.75. Interest cost of financial sector restructuring 0.6 2.5 1.7 1.8Fiscalized 0.0 0.0 0.7 0.7Non fiscalized 0.6 2.5 1.0 1.I
Comprehensive public sector balance (4 - 5) -2.7 -5.8 -6.6 -7.1
Memorandum items:Fiscal year GDP (in billions of Baht) 4700 4670 4687 4916Foreign financed central government expenditure 4/ 0.6 0.3 1.3 1.4Military spending 2.1 1.8 1.7 1.6Social Safety Net Expenditure 10 1.3 2.1 2.2O/w: Employment generation .. . 0.5 0.2Social security and welfare 0.7 0.7 0.8 0.9Housing and community services 0.3 0.6 0.8 0.8Social Investment Program ... ... 0.1 0.2Source: IMF1/ All figures based on GFS definitions, unless otherwise noted, except that expenditure and net lending data excludefinancial sector restructuring costs.2/ For FY98 and earlier the revenue and expenditure of the extra budgetary funds are consolidated in the above-the-linedata.3/ Calculated as a residual.4/ For FY99 and FY00 this is divided equally between goods and services and capital expenditure
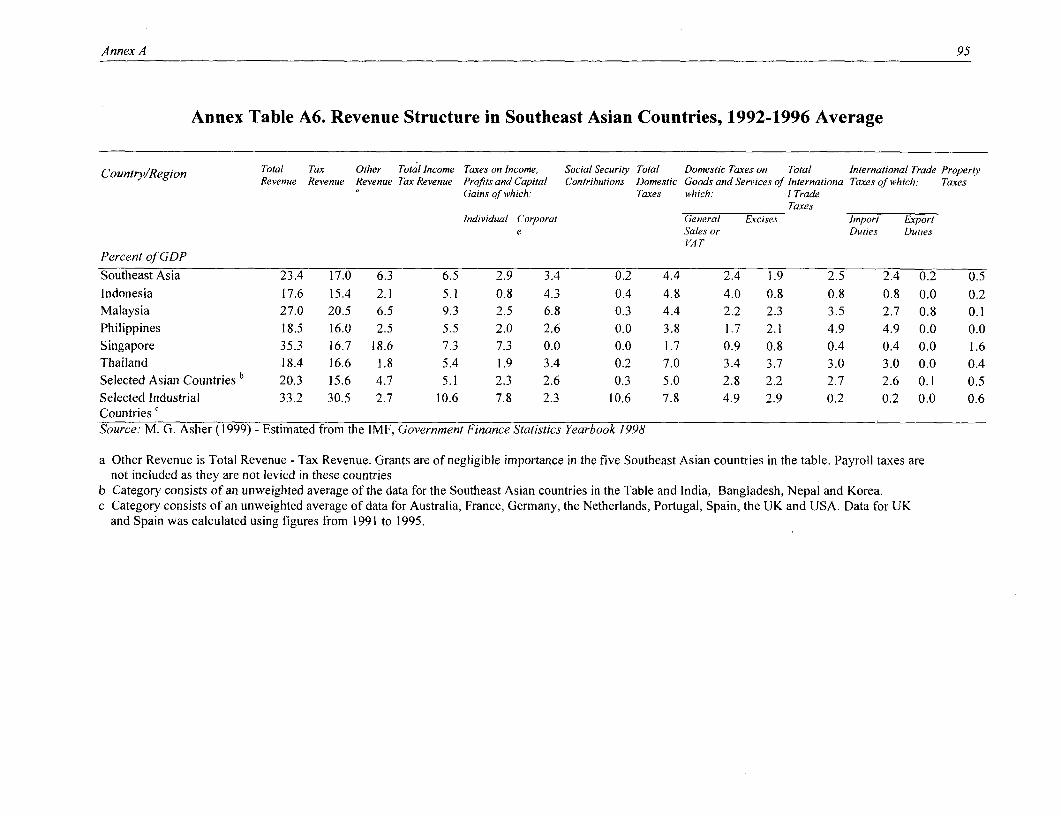
Annex A 95
Annex Table A6. Revenue Structure in Southeast Asian Countries, 1992-1996 Average
Countr,v/Region Total Tax Other Total Income Taxes on Income, Social Security Total Domestic Taxes on Total International Trade PropertyCountry/Region Revenue Revenue Revenue TaxRevenue Profitsand Capital Contributions Domestic Goods and Services of Internationa Taxes of which: Taxes
Gains of which: Taxes which: I TradeTaxes
Individual Corporal General Excises Import Exporte Sales or Duties Duties
Percent of GDP
Southeast Asia 23.4 17.0 6.3 6.5 2.9 3.4 0.2 4.4 2.4 1.9 2.5 2.4 0.2 0.5Indonesia 17.6 15.4 2.1 5.1 0.8 4.3 0.4 4.8 4.0 0.8 0.8 0.8 0.0 0.2Malaysia 27.0 20.5 6.5 9.3 2.5 6.8 0.3 4.4 2.2 2.3 3.5 2.7 0.8 0.1Philippines 18.5 16.0 2.5 5.5 2.0 2.6 0.0 3.8 1.7 2.1 4.9 4.9 0.0 0.0Singapore 35.3 16.7 18.6 7.3 7.3 0.0 0.0 1.7 0.9 0.8 0.4 0.4 0.0 1.6Thailand 18.4 16.6 1.8 5.4 1.9 3.4 0.2 7.0 3.4 3.7 3.0 3.0 0.0 0.4Selected Asian Countries b 20.3 15.6 4.7 5.1 2.3 2.6 0.3 5.0 2.8 2.2 2.7 2.6 0.1 0.5Selected Industrial 33.2 30.5 2.7 10.6 7.8 2.3 10.6 7.8 4.9 2.9 0.2 0.2 0.0 0.6CountriesSource: M. G. Asher (1999) - Estimated from the IMF, Government Finance Statistics Yearbook 1998
a Other Revenue is Total Revenue - Tax Revenue. Grants are of negligible importance in the five Southeast Asian countries in the table. Payroll taxes arenot included as they are not levied in these countries
b Category consists of an unweighted average of the data for the Southeast Asian countries in the Table and India, Bangladesh, Nepal and Korea.c Category consists of an unweighted average of data for Australia, France, Germany, the Netherlands, Portugal, Spain, the UK and USA. Data for UK
and Spain was calculated using figures from 1991 to 1995.
96 Public: Public Finance Review
Annex Table A7. Revenue Structure in South East Asian Countries, FY97Total Tax Taxes on Income, Profits, & Social Domestic Taxes on Goods International Trade Taxes Propert
Revenue Revenue Capital Gains Security, & Services y TaxesTotal Indivi- Corpo- Total General Excises Total Import Export
dual rate Sales orFY97 VAT
Thailand 18.8% 16.8% 6.0% 2.4% 3.4% 0.3% 8.0% 3.7% 3.9% 2.3% 2.2% 0.0% 0.2%Malaysia 23.7% 19.4% 8.6% 2.4% 6.1% 0.3% 6.2% 2.1% 2.3% 3.0% 2.6% 0.4% 0.2%Indonesia 16.1% 14.7% 9.2% 4.9% 4.3% 0.5% 4.5% 3.6% 0.7% 0.4% 0.4% 0.0% 0.1%Korea, Rep. 21.8% 18.6% 5.8% 3.5% 2.2% 2.0% 7.3% 4.6% 2.5% 1.4% 1.4% 0.0% 0.4%Philippines 19.4% 17.0% 6.8% 3.4% 2.5% 0.0% 5.5% 2.0% 2.6% 3.9% 3.9% 0.0% 0.0%Singapore 37.6% 15.9% 6.6% 0.0% 0.0% 0.0% 4.7% 1.5% 0.7% 0.3% 0.3% 0.0% 1.6%OECD average 35.5% 32.1% 10.6% 6.8% 2.7% 9.6% 10.3% 6.3% 3.2% 0.2% 0.2% 0.0% 0.9%Source. IMF, Government Finance Statistics.
Annex A 97
Annex Table A8. General Personal and Company Income Tax and VAT Ratesin South East Asia
(Applicable June 1999)
Rate StructureCoudntry Personal Income Tax Company Income Tax Value Added Tax
Indonesia 10-15-30 % 10-15-30 % 10(3 brackets) (3 brackets)
Malaysiaa 2-30 % 28 % na(9 brackets)
Philippines 5-34 % 34 % 10in 1999 toprate 33% in 1999 33%in 2000 and further in 2000 and further32% 32%
Singapore 2-28 % 26 % (but a 10% refund 3 %(10 brackets) is available for 1999)
Thailand 5-37 % 30 % 10(5 brackets)
Vietnam 10-60 % 10-50 % 5-10 (main rates)(six brackets) (standard rate of 32%,(foreigners residing in with numerousVietnam are taxed 10- exceptions and room50%) for interpretation)
Special rates forforeign investment(standard rate of 25%)
Sources: M. G. Asher (1999) and various others
Notes:Malaysia's 1999 Budget proposed that corporate and individual income tax for 1999 be waived. This is to bring taxpayments to a current year basis from the year 2000 onwards. Since before this change, there was a one year lag in thepayment of income tax (e.g. Income tax payable in 1999 is based on the income earned in 1998), this change will notaffect 1999 tax revenue flows materially. There will, hewever, be a considerable incentive to show higher profitabilityand individual incomes in 1999, thus giving rise to tax planning opportunities, possibly also affecting the tax base ofneighboring countries such as Singapore.
98 Public: Public Finance Review
Annex Table A9. Collection of Government Revenues in Comparison withForecasts of Revenues and GDP
Million Govern-ment's Increase Forecast of Collected Revenues in GDP Increase Rate Proportion of FlexibilityBaht, Fiscal Collected Rate (/%,) Revenues Comparison wvith Forecasts Collected Value of
Year Revenues of Income Revenues to CollectedGDP Revenues to
GDP
Difference Share (%)1988 250,180 26.6 199,500.0 50,679.5 25.4 1,560,000 20.1 16.0 1.31989 315,605 26.2 262,500.0 53,105.4 20.2 1,857,000 19.0 17.0 1.41990 404,939 28.3 310,000.0 94,939.1 30.6 2,191,000 18.0 18.5 1.61991 476,974 17.8 387,500.0 89,474.0 23.1 2,520,000 15.0 18.9 1.21992 525,367 10.1 460,400.0 64,967.4 14.1 2,833,000 12.2 18.5 0.81993 548,773 4.5 534,400.0 14,373.1 2.7 3,164,000 11.9 17.3 0.41994 647,210 17.9 600,000.0 47,210.1 7.9 3,635,000 13.8 17.8 1.31995 757,543 17.0 715,000.0 42,542.6 6.0 4,203,000 14.4 18.0 1.21996 846,665 11.8 843,200.0 3,464.6 0.4 4,599,000 13.7 18.4 0.91997 837,152 10.5 925,000.0 (87,847.8) (9.5) 4,804,000 14.3 17.4 0.7
Source: The Ministry of Finance, Fiscal Policy OfficeNote: The revenues from and after the Fiscal Year 1993 are net revenues.
Annex A 99
Annex Table A10. Revenue Forecast
Billions of baht FY98 FY99 FY99 FYOOprevious current forecast
Source forecast forecastRevenue Department 499.0 530.4 434.1 480.8Personal income tax 122.9 125.5 99.9 105.0Corporate income tax 99.5 77.1 101.6 135.0Value added tax 232.4 277.6 195.9 201.0Specific business tax 35.2 41.9 28.4 31.0Business tax 0.3 0.1 0.1 0.1Stamp duties 3.0 3.5 2.6 2.6Petroleum income tax 5.3 4.5 5.3 5.8Others 0.3 0.3 0.3 0.3Excise Department 155.6 165.1 159.0 160.1Tobacco 28.6 29.8 26.4 28.1Petroleum 65.4 70.7 65.3 67.1Spirits 20.3 20.6 20.6 10.5Beer 23.2 24.3 26.8 32.0Beverages 7.0 7.7 6.8 7.0Electrical appliances 1.0 0.9 0.8 0.8Cars 8.6 9.3 10.9 13.1Motorcycles 0.5 0.6 0.5 0.5Batteries 0.4 0.5 0.4 0.4Others 0.6 0.6 0.6 0.6Customs Department 69.3 80.5 65.3 73.9Import duties 67.1 79.0 63.6 72.2Export duties 0.0 0.0 0.0 0.0Others 2.2 1.5 1.7 1.7Other Departments 91.5 86.7 127.1 108.1Other agencies 42.2 41.0 54.0 52.0State owned enterprises 49.3 45.7 73.2 56.1GROSS REVENUE 815.4 862.7 785.5 822.9Less deductions:VAT refunds 63.9 50.0 65.9 60.2Income tax refunds 10.8 5.0 5.7 4.0Contribution to provinces 1.7 1.7Set aside for tax compensation 7.6 7.7 6.8 7.0
NET REVENUE 733.1 800.0 705.4 750.0
Source. Ministry of Finance, Thailand, budget figures
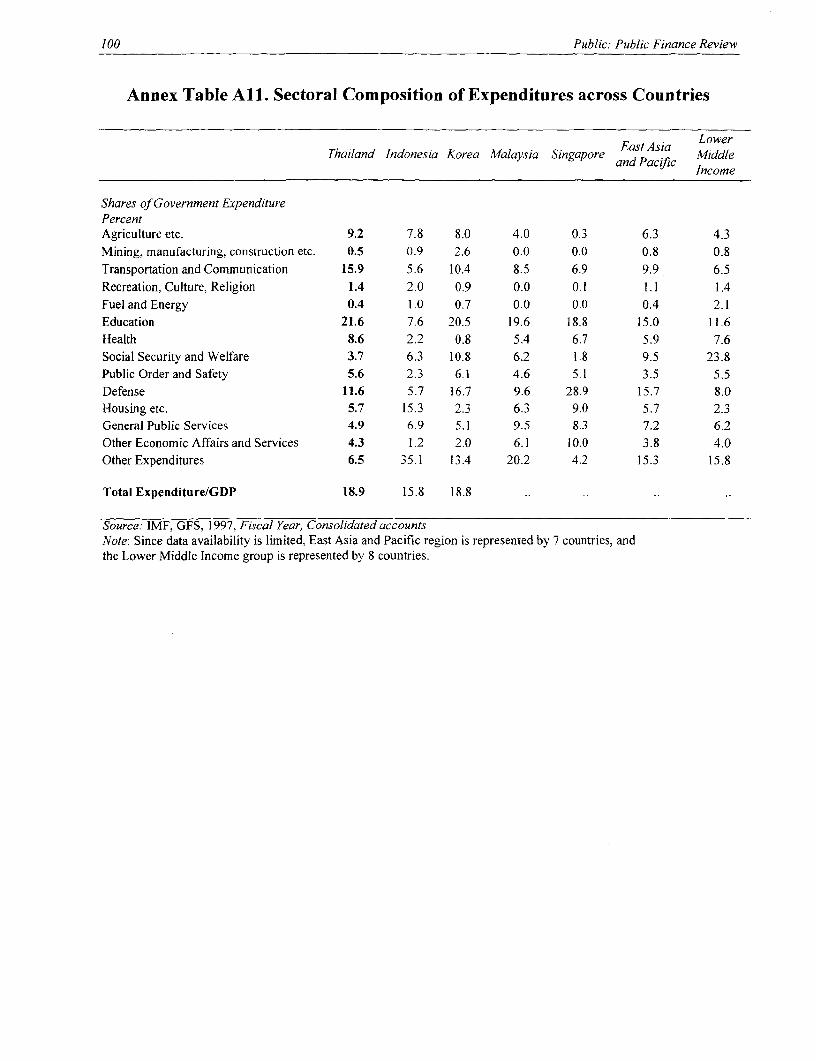
100 Public: Public Finance Review
Annex Table All. Sectoral Composition of Expenditures across Countries
East Asia LowerThailand Indonesia Korea Malaysia Singapore ad Pacf Middle
Income
Shares of Government ExpenditurePercentAgriculture etc. 9.2 7.8 8.0 4.0 0.3 6.3 4.3Mining, manufacturing, construction etc. 0.5 0.9 2.6 0.0 0.0 0.8 0.8Transportation and Communication 15.9 5.6 10.4 8.5 6.9 9.9. 6.5Recreation, Culture, Religion 1.4 2.0 0.9 0.0 0.1 1.1 1.4Fuel and Energy 0.4 1.0 0.7 0.0 0.0 0.4 2.1Education 21.6 7.6 20.5 19.6 18.8 15.0 11.6Health 8.6 2.2 0.8 5.4 6.7 5.9 7.6Social Security and Welfare 3.7 6.3 10.8 6.2 1.8 9.5 23.8Public Order and Safety 5.6 2.3 6.1 4.6 5.1 3.5 5.5Defense 11.6 5.7 16.7 9.6 28.9 15.7 8.0Housing etc. 5.7 15.3 2.3 6.3 9.0 5.7 2.3General Public Services 4.9 6.9 5.1 9.5 8.3 7.2 6.2OtherEconomicAffairsandServices 4.3 1.2 2.0 6.1 10.0 3.8 4.0Other Expenditures 6.5 35.1 13.4 20.2 4.2 15.3 15.8
Total Expenditure/GDP 18.9 15.8 18.8
Source: IMF, GFS, 1997, Fiscal Year, Consolidated accountsNote: Since data availability is limited, East Asia and Pacific region is represented by 7 countries, andthe Lower Middle Income group is represented by 8 countries.
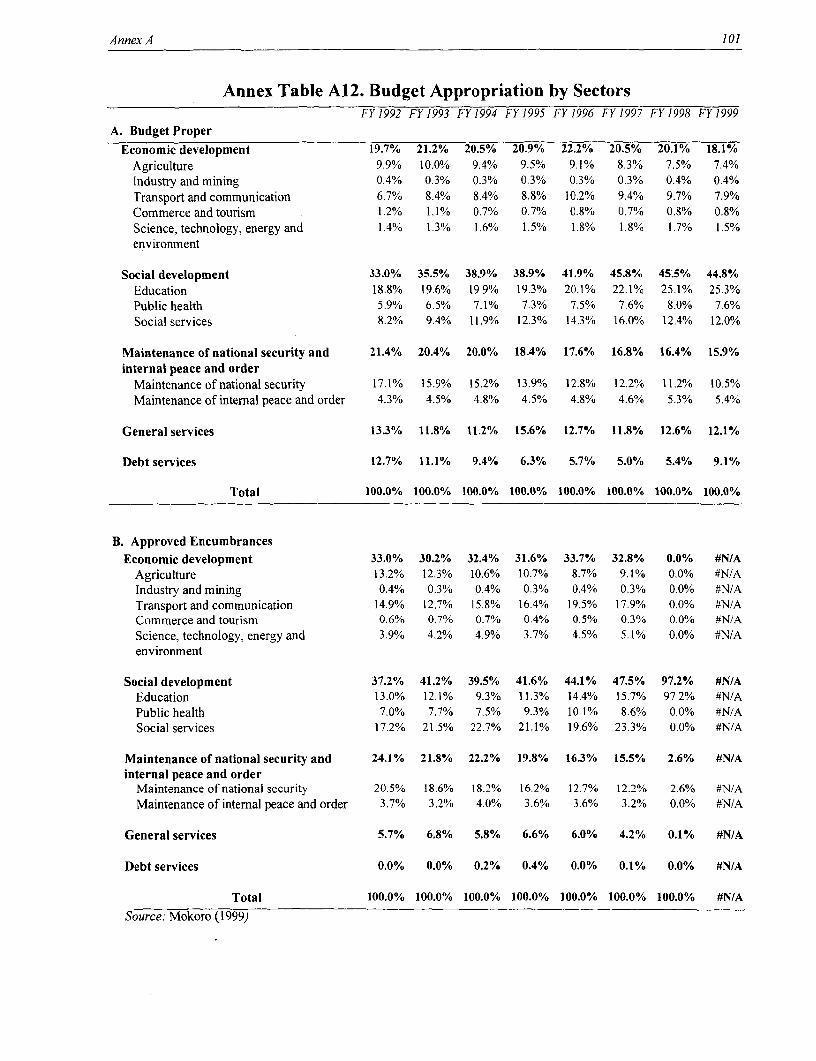
Annex A 101
Annex Table A12. Budget Appropriation by SectorsFY 1992 FY 1993 FY 1994 FY 1995 FY 1996 FY 1997 FY 1998 FY 1999
A. Budget ProperEconomic development 19.7% 21.2% 20.5% 20.9% 22.2% 20.5% 20.1% 18.1%
Agriculture 9.9% 10.0% 9.4% 9.5% 9.1% 8.3% 7.5% 7.4%Industry and mining 0.4% 0.3% 0.3% 0.3% 0.3% 0.3% 0.4% 0.4%Transport and communication 6.7% 8.4% 8.4% 8.8% 10.2% 9.4% 9.7% 7.9%Commerce and tourism 1.2% 1.1% 0.7% 0.7% 0.8% 0.7% 0.8% 0.8%Science, technology, energy and 1.4% 1.3% 1.6% 1.5% 1.8% 1.8% 1.7% 1.5%environment
Social development 33.0% 35.5% 38.9% 38.9% 41.9% 45.8% 45.5% 44.8%Education 18.8% 19.6% 19.9% 19.3% 20.1% 22.1% 25.1% 25.3%Public health 5.9% 6.5% 7.1% 7.3% 7.5% 7.6% 8.0% 7.6%Social services 8.2% 9.4% 11.9% 12.3% 14.3% 16.0% 12.4% 12.0%
Maintenance of national security and 21.4% 20.4% 20.0% 18.4% 17.6% 16.8% 16.4% 15.9%internal peace and order
Maintenance of national security 17.1% 15.9% 15.2% 13.9% 12.8% 12.2% 11.2% 10.5%Maintenance of internal peace and order 4.3% 4.5% 4.8% 4.5% 4.8% 4.6% 5.3% 5.4%
General services 13.3% 11.8% 11.2% 15.6% 12.7% 11.8% 12.6% 12.1%
Debt services 12.7% 11.1% 9.4% 6.3% 5.7% 5.0% 5.4% 9.1%
Total 100.0% 100.0% 100.0% 100.0% 100.0% 100.0% 100.0% 100.0%
B. Approved EncumbrancesEconomic development 33.0% 30.2% 32.4% 31.6% 33.7% 32.8% 0.0% #N/A
Agriculture 13.2% 12.3% 10.6% 10.7% 8.7% 9.1% 0.0% 4N/AIndustry and mining 0.4% 0.3% 0.4% 0.3% 0.4% 0.3% 0.0% #N/ATransport and communication 14.9% 12.7% 15.8% 16.4% 19.5% 17.9% 0.0% #N/ACommerce and tourism 0.6% 0.7% 0.7% 0.4% 0.5% 0.3% 0.0% #N/AScience, technology, energy and 3.9% 4.2% 4.9% 3.7% 4.5% 5.1% 0.0% #N/Aenvironment
Social development 37.2% 41.2% 39.5% 41.6% 44.1% 47.5% 97.2% #N/AEducation 13.0% 12.1% 9.3% 11.3% 14.4% 15.7% 97.2% #N/APublic health 7.0% 7.7% 7.5% 9.3% 10.1% 8.6% 0.0% #N/ASocial services 17.2% 21.5% 22.7% 21.1% 19.6% 23.3% 0.0% #N/A
Maintenance of national security and 24.1% 21.8% 22.2% 19.8% 16.3% 15.5% 2.6% #N/Ainternal peace and order
Maintenance of national security 20.5% 18.6% 18.2% 16.2% 12.7% 12.2% 2.6% #N/AMaintenance of internal peace and order 3.7% 3.2% 4.0% 3.6% 3.6% 3.2% 0.0% #N/A
General services 5.7% 6.8% 5.8% 6.6% 6.0% 4.2% 0.1% #N/A
Debt services 0.0% 0.0% 0.2% 0.4% 0.0% 0.1% 0.0% #N/A
Total 100.0% 100.0% 100.0% 100.0% 100.0% 100.0% 100.0% #N/ASource: Mokoro (1999)
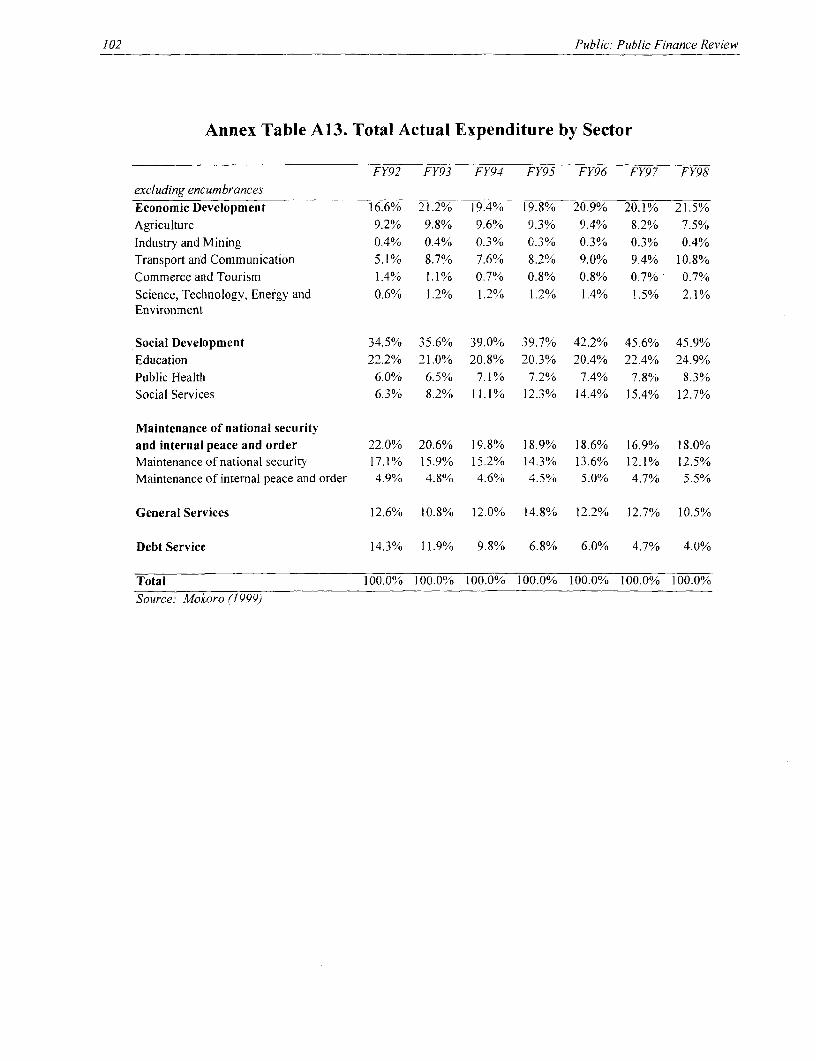
102 Public: Public Finance Review
Annex Table A13. Total Actual Expenditure by Sector
FY92 FY93 FY94 FY95 FY96 FY97 FY98
excluding encumbrancesEconomic Development 16.6% 21.2% 19.4% 19.8% 20.9% 20.1% 21.5%Agriculture 9.2% 9.8% 9.6% 9.3% 9.4% 8.2% 7.5%
Industry and Mining 0.4% 0.4% 0.3% 0.3% 0.3% 0.3% 0.4%
Transport and Communication 5.1% 8.7% 7.6% 8.2% 9.0% 9.4% 10.8%Commerce and Tourism 1.4% 1.1% 0.7% 0.8% 0.8% 0.7% 0.7%Science, Technology, Energy and 0.6% 1.2% 1.2% 1.2% 1.4% 1.5% 2.1%Environment
Social Development 34.5% 35.6% 39.0% 39.7% 42.2% 45.6% 45.9%Education 22.2% 21.0% 20.8% 20.3% 20.4% 22.4% 24.9%Public Health 6.0% 6.5% 7.1% 7.2% 7.4% 7.8% 8.3%Social Services 6.3% 8.2% 11.1% 12.3% 14.4% 15.4% 12.7%
Maintenance of national securityand internal peace and order 22.0% 20.6% 19.8% 18.9% 18.6% 16.9% 18.0%Maintenance of national security 17.1% 15.9% 15.2% 14.3% 13.6% 12.1% 12.5%Maintenance of internal peace and order 4.9% 4.8% 4.6% 4.5% 5.0% 4.7% 5.5%
General Services 12.6% 10.8% 12.0% 14.8% 12.2% 12.7% 10.5%
Debt Service 14.3% 11.9% 9.8% 6.8% 6.0% 4.7% 4.0%
Total 100.0% 100.0% 100.0% 100.0% 100.0% 100.0% 100.0%
Source: Mokoro (1999)
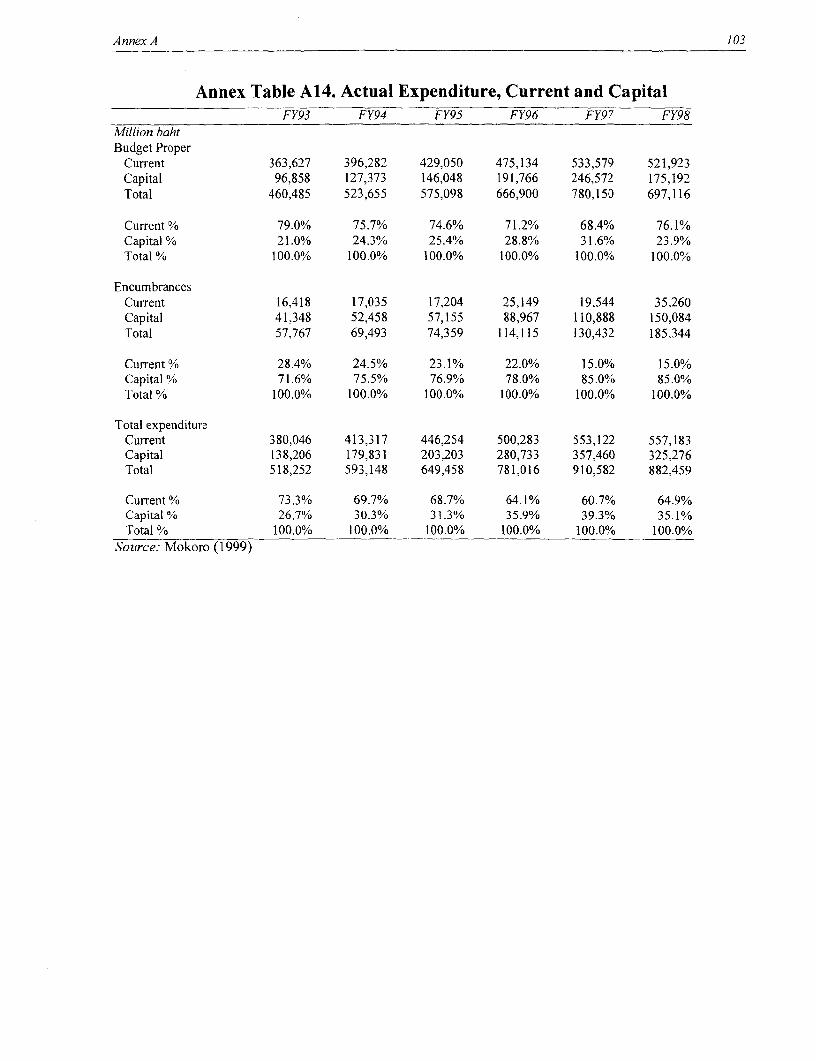
Annex A 103
Annex Table A14. Actual Expenditure, Current and CapitalFY93 FY94 FY95 FY96 FY97 FY98
Million bahtBudget Proper
Current 363,627 396,282 429,050 475,134 533,579 521,923Capital 96,858 127,373 146,048 191,766 246,572 175,192Total 460,485 523,655 575,098 666,900 780,150 697,116
Current % 79.0% 75.7% 74.6% 71.2% 68.4% 76.1%Capital % 21.0% 24.3% 25.4% 28.8% 31.6% 23.9%Total % 100.0% 100.0% 100.0% 100.0% 100.0% 100.0%
EncumbrancesCurrent 16,418 17,035 17,204 25,149 19,544 35,260Capital 41,348 52,458 57,155 88,967 110,888 150,084Total 57,767 69,493 74,359 114,115 130,432 185,344
Current % 28.4% 24.5% 23.1% 22.0% 15.0% 15.0%Capital % 71.6% 75.5% 76.9% 78.0% 85.0% 85.0%Total % 100.0% 100.0% 100.0% 100.0% 100.0% 100.0%
Total expenditureCurrent 380,046 413,317 446,254 500,283 553,122 557,183Capital 138,206 179,831 203,203 280,733 357,460 325,276Total 518,252 593,148 649,458 781,016 910,582 882,459
Current % 73.3% 69.7% 68.7% 64.1% 60.7% 64.9%Capital % 26.7% 30.3% 31.3% 35.9% 39.3% 35.1%Total % 100.0% 100.0% 100.0% 100.0% 100.0% 100.0%
Source: Mokoro (1999)
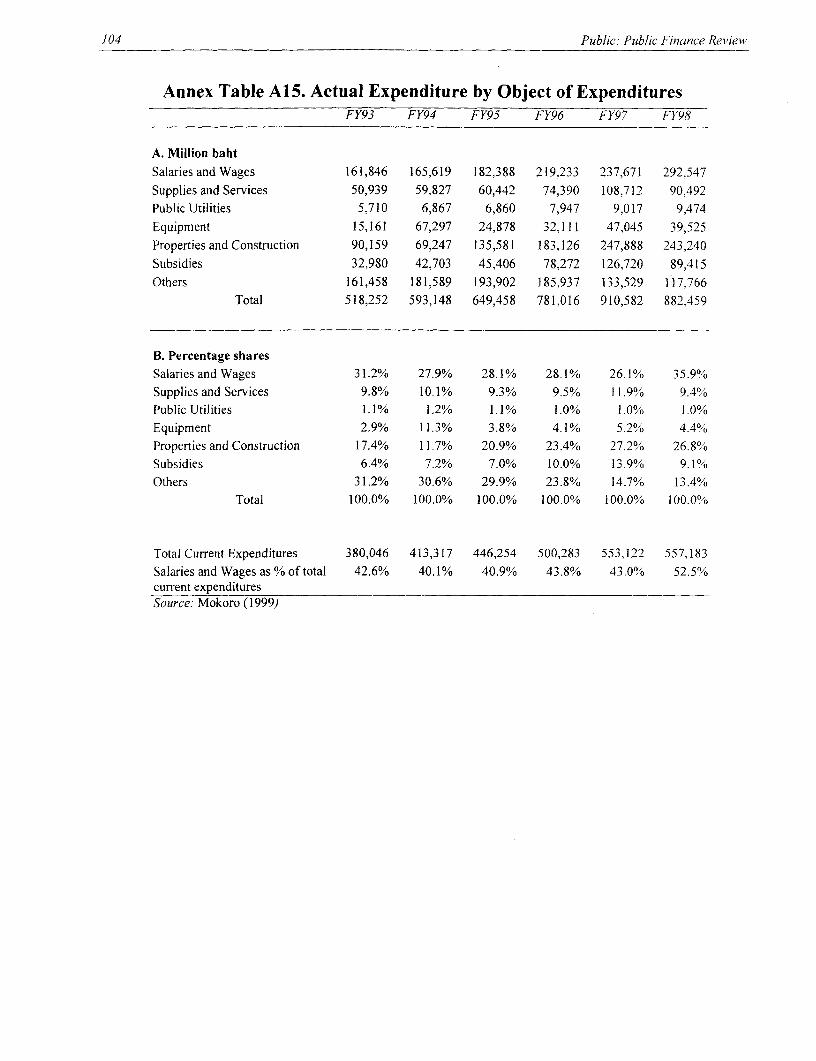
104 Public. Public Finance Review
Annex Table A15. Actual Expenditure by Object of ExpendituresFY93 FY94 FY95 FY96 FY97 FY98
A. Million bahtSalaries and Wages 161,846 165,619 182,388 219,233 237,671 292,547Supplies and Services 50,939 59,827 60,442 74,390 108,712 90,492Public Utilities 5,710 6,867 6,860 7,947 9,017 9,474Equipment 15,161 67,297 24,878 32,111 47,045 39,525Properties and Construction 90,159 69,247 135,581 183,126 247,888 243,240Subsidies 32,980 42,703 45,406 78,272 126,720 89,415
Others 161,458 181,589 193,902 185,937 133,529 117,766Total 518,252 593,148 649,458 781,016 910,582 882,459
B. Percentage sharesSalaries and Wages 31.2% 27.9% 28.1% 28.1% 26.1% 35.9%Supplies and Services 9.8% 10.1% 9.3% 9.5% 11.9% 9.4%Public Utilities 1.1% 1.2% 1.1% 1.0% 1.0% 1.0%Equipment 2.9% 11.3% 3.8% 4.1% 5.2% 4.4%Properties and Construction 17.4% 11.7% 20.9% 23.4% 27.2% 26.8%Subsidies 6.4% 7.2% 7.0% 10.0% 13.9% 9.1%Others 31.2% 30.6% 29.9% 23.8% 14.7% 13.4%
Total 100.0% 100.0% 100.0% 100.0% 100.0% 100.0%
Total Current Expenditures 380,046 413,317 446,254 500,283 553,122 557,183Salaries and Wagesas%oftotal 42.6% 40.1% 40.9% 43.8% 43.0% 52.5%current expendituresSource: Mokoro (1999)
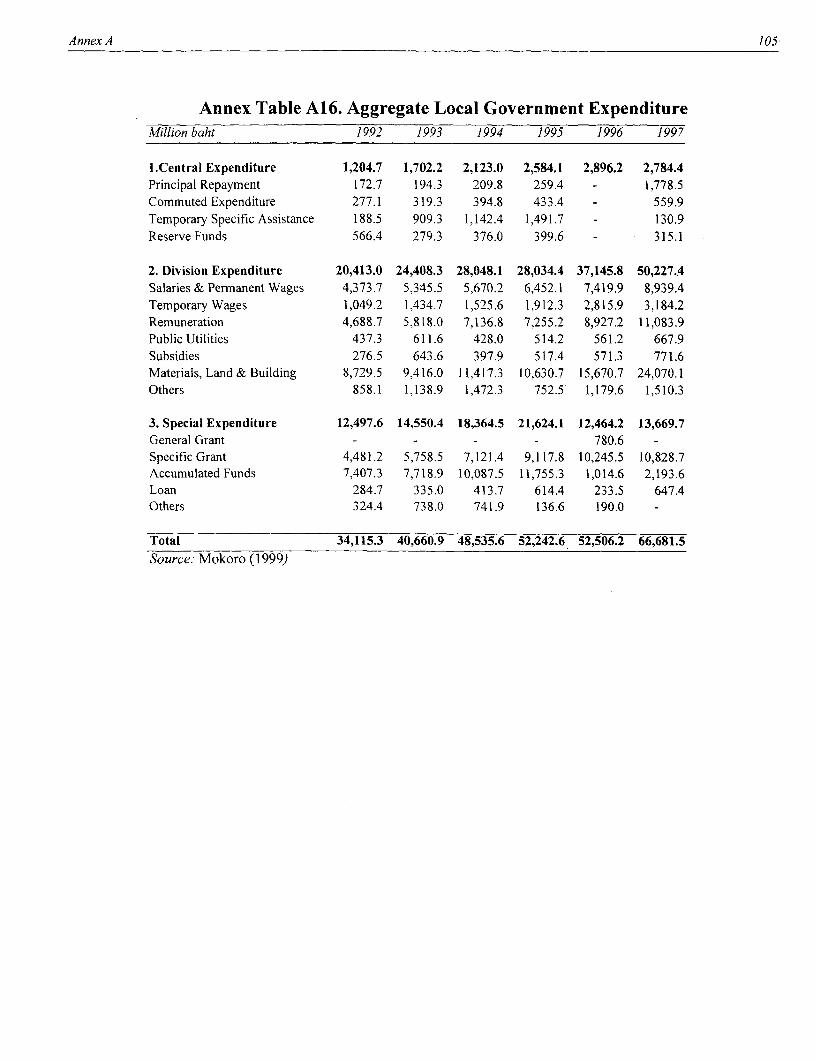
Annex A 105
Annex Table A16. Aggregate Local Government ExpenditureMillion baht 1992 1993 1994 1995 1996 1997
I.Central Expenditure 1,204.7 1,702.2 2,123.0 2,584.1 2,896.2 2,784.4Principal Repayment 172.7 194.3 209.8 259.4 - 1,778.5Commuted Expenditure 277.1 319.3 394.8 433.4 - 559.9Temporary Specific Assistance 188.5 909.3 1,142.4 1,491.7 - 130.9Reserve Funds 566.4 279.3 376.0 399.6 - 315.1
2. Division Expenditure 20,413.0 24,408.3 28,048.1 28,034.4 37,145.8 50,227.4Salaries & Permanent Wages 4,373.7 5,345.5 5,670.2 6,452.1 7,419.9 8,939.4Temporary Wages 1,049.2 1,434.7 1,525.6 1,912.3 2,815.9 3,184.2Remuneration 4,688.7 5,818.0 7,136.8 7,255.2 8,927.2 11,083.9Public Utilities 437.3 611.6 428.0 514.2 561.2 667.9Subsidies 276.5 643.6 397.9 517.4 571.3 771.6Materials, Land & Building 8,729.5 9,416.0 11,417.3 10,630.7 15,670.7 24,070.1Others 858.1 1,138.9 1,472.3 752.5 1,179.6 1,510.3
3. Special Expenditure 12,497.6 14,550.4 18,364.5 21,624.1 12,464.2 13,669.7General Grant - - - - 780.6 -
Specific Grant 4,481.2 5,758.5 7,121.4 9,117.8 10,245.5 10,828.7Accumulated Funds 7,407.3 7,718.9 10,087.5 11,755.3 1,014.6 2,193.6Loan 284.7 335.0 413.7 614.4 233.5 647.4Others 324.4 738.0 741.9 136.6 190.0 -
Total 34,115.3 40,660.9 48,535.6 52,242.6 52,506.2 66,681.5Source. Mokoro (1999)
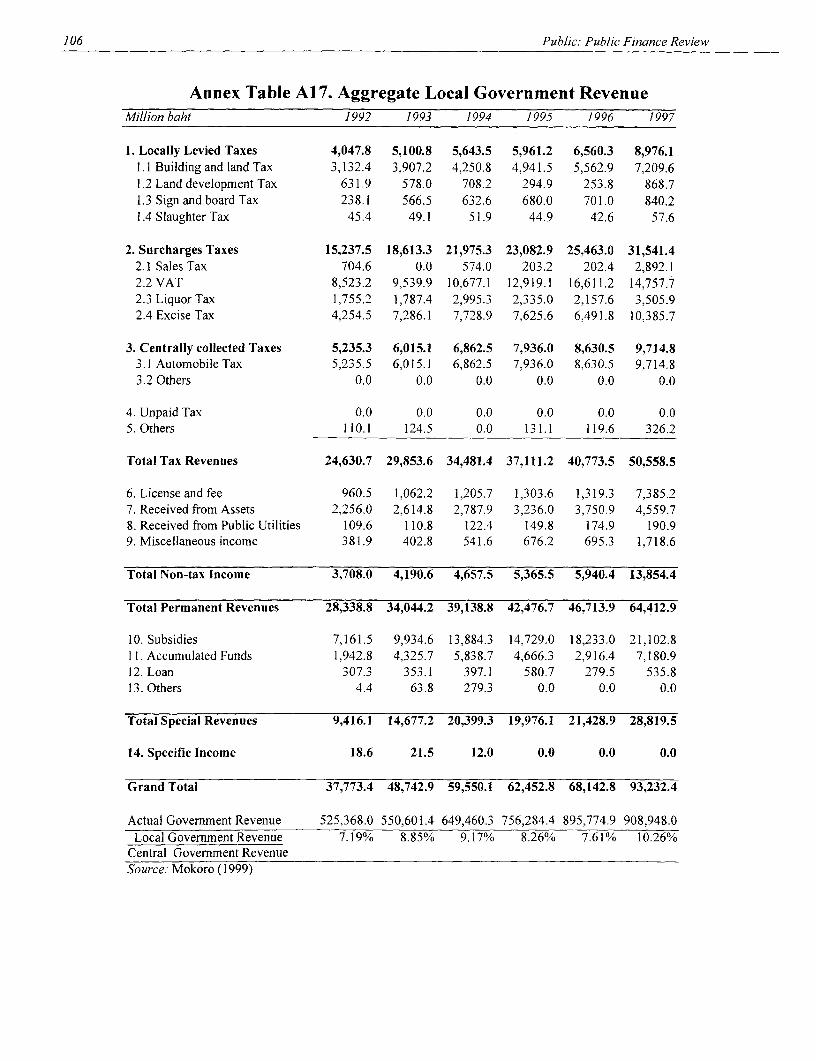
106 Public: Public Finance Review
Annex Table A17. Aggregate Local Government RevenueMillion baht 1992 1993 1994 1995 1996 1997
1. Locally Levied Taxes 4,047.8 5,100.8 5,643.5 5,961.2 6,560.3 8,976.11.1 Building and land Tax 3,132.4 3,907.2 4,250.8 4,941.5 5,562.9 7,209.61.2 Land development Tax 631.9 578.0 708.2 294.9 253.8 868.71.3 Sign and board Tax 238.1 566.5 632.6 680.0 701.0 840.21.4 Slaughter Tax 45.4 49.1 51.9 44.9 42.6 57.6
2. Surcharges Taxes 15,237.5 18,613.3 21,975.3 23,082.9 25,463.0 31,541.42.1 Sales Tax 704.6 0.0 574.0 203.2 202.4 2,892.12.2 VAT 8,523.2 9,539.9 10,677.1 12,919.1 16,611.2 14,757.72.3 Liquor Tax 1,755.2 1,787.4 2,995.3 2,335.0 2,157.6 3,505.92.4 Excise Tax 4,254.5 7,286.1 7,728.9 7,625.6 6,491.8 10,385.7
3. Centrally collected Taxes 5,235.3 6,015.1 6,862.5 7,936.0 8,630.5 9,714.83.1 Automobile Tax 5,235.5 6,015.1 6,862.5 7,936.0 8,630.5 9,714.8
3.2 Others 0.0 0.0 0.0 0.0 0.0 0.0
4. Unpaid Tax 0.0 0.0 0.0 0.0 0.0 0.05.Others 110.1 124.5 0.0 131.1 119.6 326.2
Total Tax Revenues 24,630.7 29,853.6 34,481.4 37,111.2 40,773.5 50,558.5
6. License and fee 960.5 1,062.2 1,205.7 1,303.6 1,319.3 7,385.27. Received from Assets 2,256.0 2,614.8 2,787.9 3,236.0 3,750.9 4,559.78. Received from Public Utilities 109.6 110.8 122.4 149.8 174.9 190.99. Miscellaneous income 381.9 402.8 541.6 676.2 695.3 1,718.6
Total Non-tax Income 3,708.0 4,190.6 4,657.5 5,365.5 5,940.4 13,854.4
Total Permanent Revenues 28,338.8 34,044.2 39,138.8 42,476.7 46,713.9 64,412.9
10. Subsidies 7,161.5 9,934.6 13,884.3 14,729.0 18,233.0 21,102.811. Accumulated Funds 1,942.8 4,325.7 5,838.7 4,666.3 2,916.4 7,180.912. Loan 307.3 353.1 397.1 580.7 279.5 535.813. Others 4.4 63.8 279.3 0.0 0.0 0.0
Total Special Revenues 9,416.1 14,677.2 20,399.3 19,976.1 21,428.9 28,819.5
14. Specific Income 18.6 21.5 12.0 0.0 0.0 0.0
Grand Total 37,773.4 48,742.9 59,550.1 62,452.8 68,142.8 93,232.4
Actual Government Revenue 525,368.0 550,601.4 649,460.3 756,284.4 895,774.9 908,948.0
Local GovernmentRevenue 7.19% 8.85% 9.17% 8.26% 7.61% 10.26%Central Government RevenueSource: Mokoro (1999)
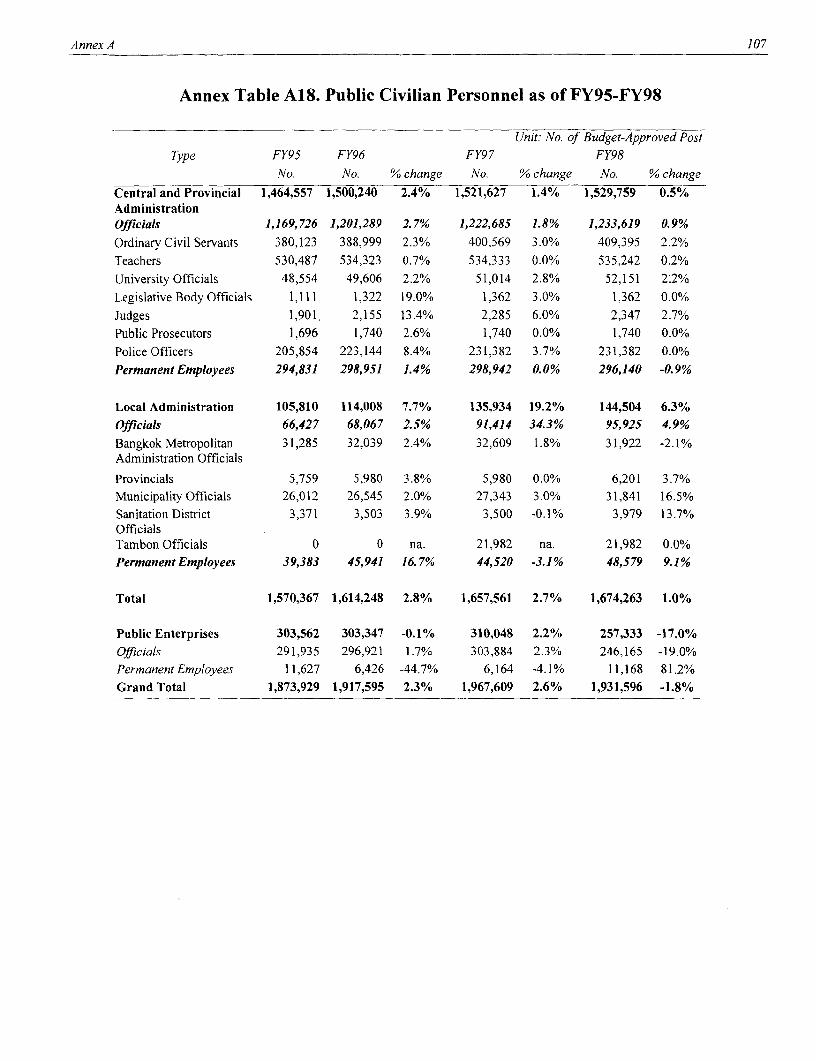
Annex A 107
Annex Table A18. Public Civilian Personnel as of FY95-FY98
Unit: No. of Budget-Approved Post
Type FY95 FY96 FY97 FY98
No. No. % change No. % change No. % change
Central and Provincial 1,464,557 1,500,240 2.4% 1,521,627 1.4% 1,529,759 0.5%AdministrationOfficials 1,169,726 1,201,289 2.7% 1,222,685 1.8% 1,233,619 0.9%
Ordinary Civil Servants 380,123 388,999 2.3% 400,569 3.0% 409,395 2.2%Teachers 530,487 534,323 0.7% 534,333 0.0% 535,242 0.2%
University Officials 48,554 49,606 2.2% 51,014 2.8% 52,151 2:2%
Legislative Body Officials 1,111 1,322 19.0% 1,362 3.0% 1,362 0.0%Judges 1,901. 2,155 13.4% 2,285 6.0% 2,347 2.7%Public Prosecutors 1,696 1,740 2.6% 1,740 0.0% 1,740 0.0%
Police Officers 205,854 223,144 8.4% 231,382 3.7% 231,382 0.0%
Permanent Employees 294,831 298,951 1.4% 298,942 0.0% 296,140 -0.9%
Local Administration 105,810 114,008 7.7% 135,934 19.2% 144,504 6.3%Officials 66,427 68,067 2.5% 91,414 34.3% 95,925 4.9%Bangkok Metropolitan 31,285 32,039 2.4% 32,609 1.8% 31,922 -2.1%Administration Officials
Provincials 5,759 5,980 3.8% 5,980 0.0% 6,201 3.7%Municipality Officials 26,012 26,545 2.0% 27,343 3.0% 31,841 16.5%Sanitation District 3,371 3,503 3.9% 3,500 -0.1% 3,979 13.7%OfficialsTambon Officials 0 0 na. 21,982 na. 21,982 0.0%Permanent Employees 39,383 45,941 16.7% 44,520 -3.1% 48,579 9.1%
Total 1,570,367 1,614,248 2.8% 1,657,561 2.7% 1,674,263 1.0%
Public Enterprises 303,562 303,347 -0.1% 310,048 2.2% 257,333 -17.0%Officials 291,935 296,921 1.7% 303,884 2.3% 246,165 -19.0%Permanent Employees 11,627 6,426 -44.7% 6,164 -4.1% 11,168 81.2%Grand Total 1,873,929 1,917,595 2.3% 1,967,609 2.6% 1,931,596 -1.8%
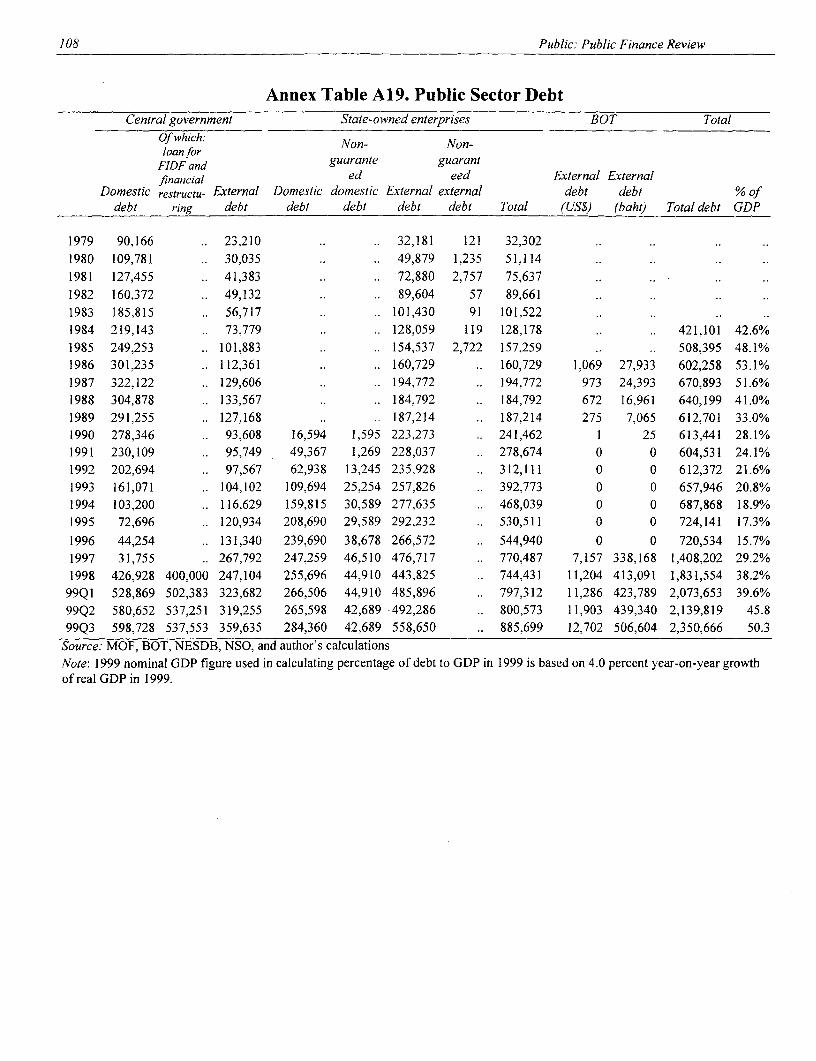
108 Public: Public Finance Review
Annex Table A19. Public Sector DebtCentral government State-owned enterprises BOT Total
Of which: Non- Non-loan for
FIDF and guarante guarantfinancial ed eed External External
Domestic restructu- External Domestic domestic External external debt debt % ofdebt ring debt debt debt debt debt Total (US$) (baht) Total debt GDP
1979 90,166 .. 23,210 .. .. 32,181 121 32,302 ..
1980 109,781 .. 30,035 .. .. 49,879 1,235 51,114 ..
1981 127,455 .. 41,383 .. .. 72,880 2,757 75,637 ..
1982 160,372 .. 49,132 .. .. 89,604 57 89,661 ..
1983 185,815 .. 56,717 .. .. 101,430 91 101,522 ..
1984 219,143 .. 73,779 .. .. 128,059 119 128,178 .. .. 421,101 42.6%
1985 249,253 .. 101,883 .. .. 154,537 2,722 157,259 .. .. 508,395 48.1%
1986 301,235 .. 112,361 .. .. 160,729 .. 160,729 1,069 27,933 602,258 53.1%
1987 322,122 .. 129,606 .. .. 194,772 .. 194,772 973 24,393 670,893 51.6%
1988 304,878 .. 133,567 .. .. 184,792 .. 184,792 672 16,961 640,199 41.0%
1989 291,255 .. 127,168 .. .. 187,214 .. 187,214 275 7,065 612,701 33.0%
1990 278,346 .. 93,608 16,594 1,595 223,273 .. 241,462 1 25 613,441 28.1%
1991 230,109 .. 95,749 49,367 1,269 228,037 .. 278,674 0 0 604,531 24.1%
1992 202,694 .. 97,567 62,938 13,245 235,928 .. 312,111 0 0 612,372 21.6%
1993 161,071 .. 104,102 109,694 25,254 257,826 .. 392,773 0 0 657,946 20.8%
1994 103,200 .. 116,629 159,815 30,589 277,635 .. 468,039 0 0 687,868 18.9%
1995 72,696 .. 120,934 208,690 29,589 292,232 .. 530,511 0 0 724,141 17.3%
1996 44,254 .. 131,340 239,690 38,678 266,572 .. 544,940 0 0 720,534 15.7%
1997 31,755 .. 267,792 247,259 46,510 476,717 .. 770,487 7,157 338,168 1,408,202 29.2%
1998 426,928 400,000 247,104 255,696 44,910 443,825 .. 744,431 11,204 413,091 1,831,554 38.2%99Q1 528,869 502,383 323,682 266,506 44,910 485,896 .. 797,312 11,286 423,789 2,073,653 39.6%99Q2 580,652 537,251 319,255 265,598 42,689 492,286 .. 800,573 11,903 439,340 2,139,819 45.899Q3 598,728 537,553 359,635 284,360 42,689 558,650 .. 885,699 12,702 506,604 2,350,666 50.3
Source: MOF, BOT, NESDB, NSO, and author's calculationsNote: 1999 nominal GDP figure used in calculating percentage of debt to GDP in 1999 is based on 4.0 percent year-on-year growthof real GDP in 1999.
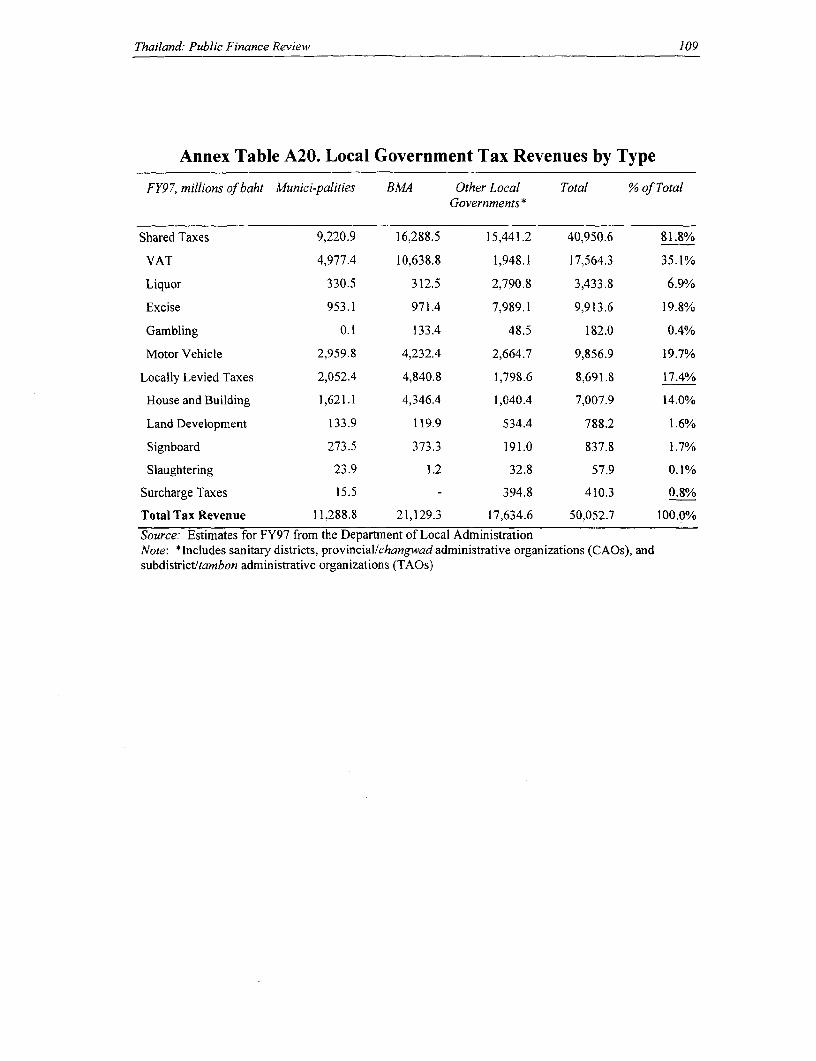
Thailand: Public Finance Review 109
Annex Table A20. Local Government Tax Revenues by Type
FY97, millions of baht Munici-palities BMA Other Local Total % of TotalGovernments*
Shared Taxes 9,220.9 16,288.5 15,441.2 40,950.6 81.8%
VAT 4,977.4 10,638.8 1,948.1 17,564.3 35.1%
Liquor 330.5 312.5 2,790.8 3,433.8 6.9%
Excise 953.1 971.4 7,989.1 9,913.6 19.8%
Gambling 0.1 133.4 48.5 182.0 0.4%
Motor Vehicle 2,959.8 4,232.4 2,664.7 9,856.9 19.7%
Locally Levied Taxes 2,052.4 4,840.8 1,798.6 8,691.8 17.4%
House and Building 1,621.1 4,346.4 1,040.4 7,007.9 14.0%
Land Development 133.9 119.9 534.4 788.2 1.6%
Signboard 273.5 373.3 191.0 837.8 1.7%
Slaughtering 23.9 1.2 32.8 57.9 0.1%
Surcharge Taxes 15.5 - 394.8 410.3 0.8%
Total Tax Revenue 11,288.8 21,129.3 17,634.6 50,052.7 100.0%
Source: Estimates for FY97 from the Department of Local AdministrationNote: *Includes sanitary districts, provincial/changwad administrative organizations (CAOs), andsubdistrict/tambon administrative organizations (TAOs)
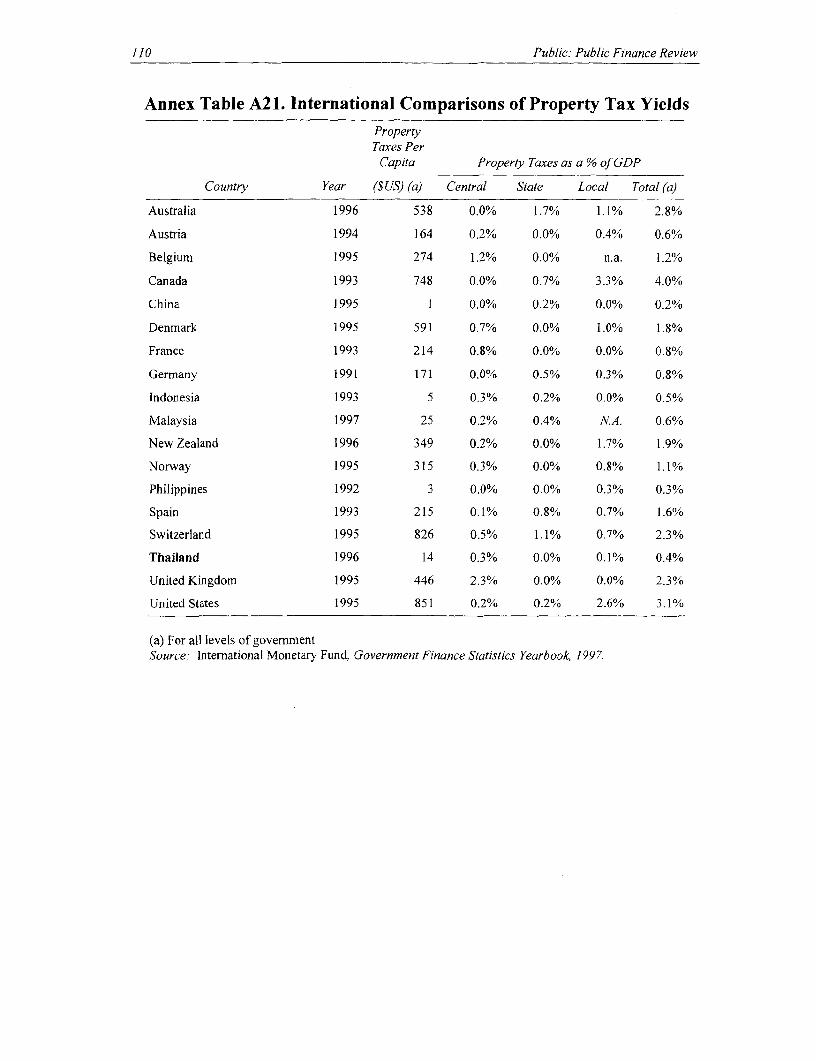
I1o Public: Public Finance Review
Annex Table A21. International Comparisons of Property Tax YieldsPropertyTaxes Per
Capita Property Taxes as a % of GDP
Country Year ($US) (a) Central State Local Total (a)
Australia 1996 538 0.0% 1.7% 1.1% 2.8%
Austria 1994 164 0.2% 0.0% 0.4% 0.6%
Belgium 1995 274 1.2% 0.0% n.a. 1.2%
Canada 1993 748 0.0% 0.7% 3.3% 4.0%
China 1995 1 0.0% 0.2% 0.0% 0.2%
Denmark 1995 591 0.7% 0.0% 1.0% 1.8%
France 1993 214 0.8% 0.0% 0.0% 0.8%
Germany 1991 171 0.0% 0.5% 0.3% 0.8%
Indonesia 1993 5 0.3% 0.2% 0.0% 0.5%
Malaysia 1997 25 0.2% 0.4% NA. 0.6%
New Zealand 1996 349 0.2% 0.0% 1.7% 1.9%
Norway 1995 315 0.3% 0.0% 0.8% 1.1%
Philippines 1992 3 0.0% 0.0% 0.3% 0.3%
Spain 1993 215 0.1% 0.8% 0.7% 1.6%
Switzerland 1995 826 0.5% 1.1% 0.7% 2.3%
Thailand 1996 14 0.3% 0.0% 0.1% 0.4%
United Kingdom 1995 446 2.3% 0.0% 0.0% 2.3%
United States 1995 851 0.2% 0.2% 2.6% 3.1%
(a) For all levels of governmentSource: International Monetary Fund, Government Finance Statistics Yearbook, 1997.
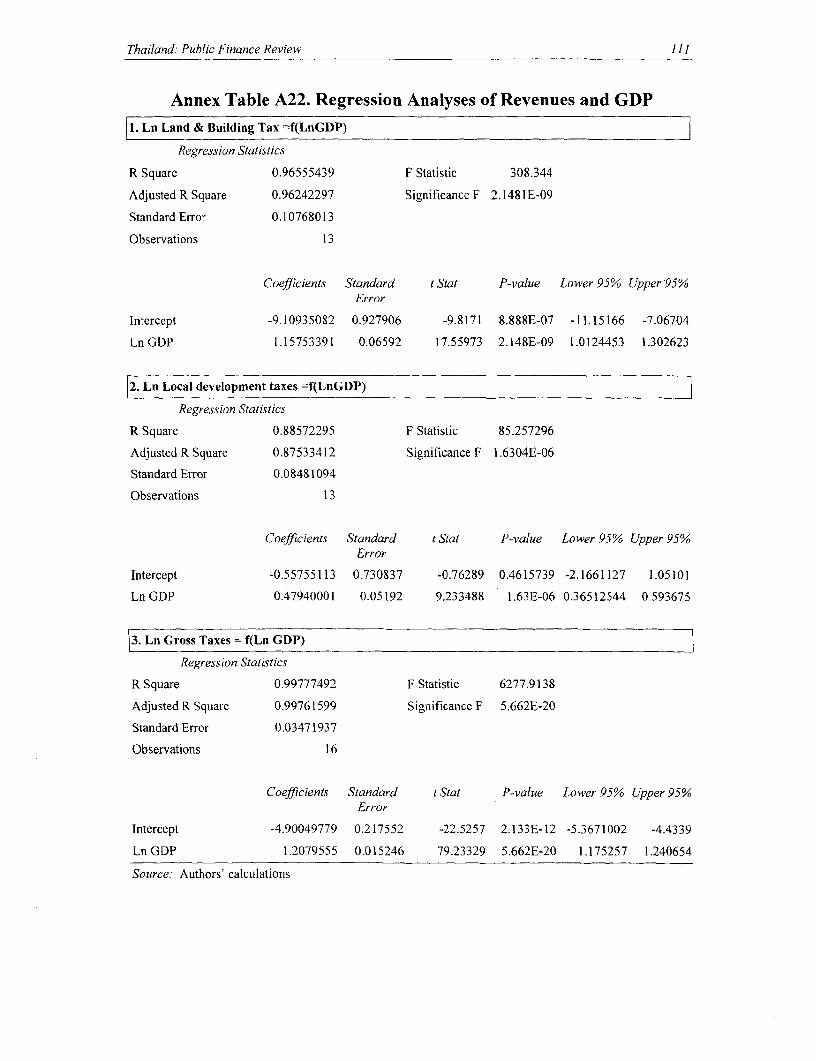
Thailand: Public Finance Review III
Annex Table A22. Regression Analyses of Revenues and GDP1. Ln Land & Building Tax =f(LnGDP)
Regression Statistics
R Square 0.96555439 F Statistic 308.344
Adjusted R Square 0.96242297 Significance F 2.1481E-09
Standard Error 0.10768013
Observations 1 3
Coefficients Standard t Stat P-value Lower 95% Upper 95%Error
Intercept -9.10935082 0.927906 -9.8171 8.888E-07 -11.15166 -7.06704
Ln GDP 1.15753391 0.06592 17.55973 2.148E-09 1.0124453 1.302623
2. Ln Local development taxes =f(LnGDP)
Regression Statistics
R Square 0.88572295 F Statistic 85.257296
Adjusted R Square 0.87533412 Significance F 1.6304E-06
Standard Error 0.08481094
Observations 13
Coefficients Standard t Stat P-value Lower 95% Upper 95%Error
Intercept -0.55755113 0.730837 -0.76289 0.4615739 -2.1661127 1.05101
Ln GDP 0.47940001 0.05192 9.233488 1.63E-06 0.36512544 0.593675
3. La Gross Taxes = f(Ln GDP)
Regression Statistics
R Square 0.99777492 F Statistic 6277.9138
Adjusted R Square 0.99761599 Significance F 5.662E-20
Standard Error 0.03471937
Observations 16
Coefficients Standard t Stat P-value Lower 95% Upper 95%Error
Intercept -4.90049779 0.217552 -22.5257 2.133E-12 -5.3671002 -4.4339
Ln GDP 1.2079555 0.015246 79.23329 5.662E-20 1.175257 1.240654
Source: Authors' calculations
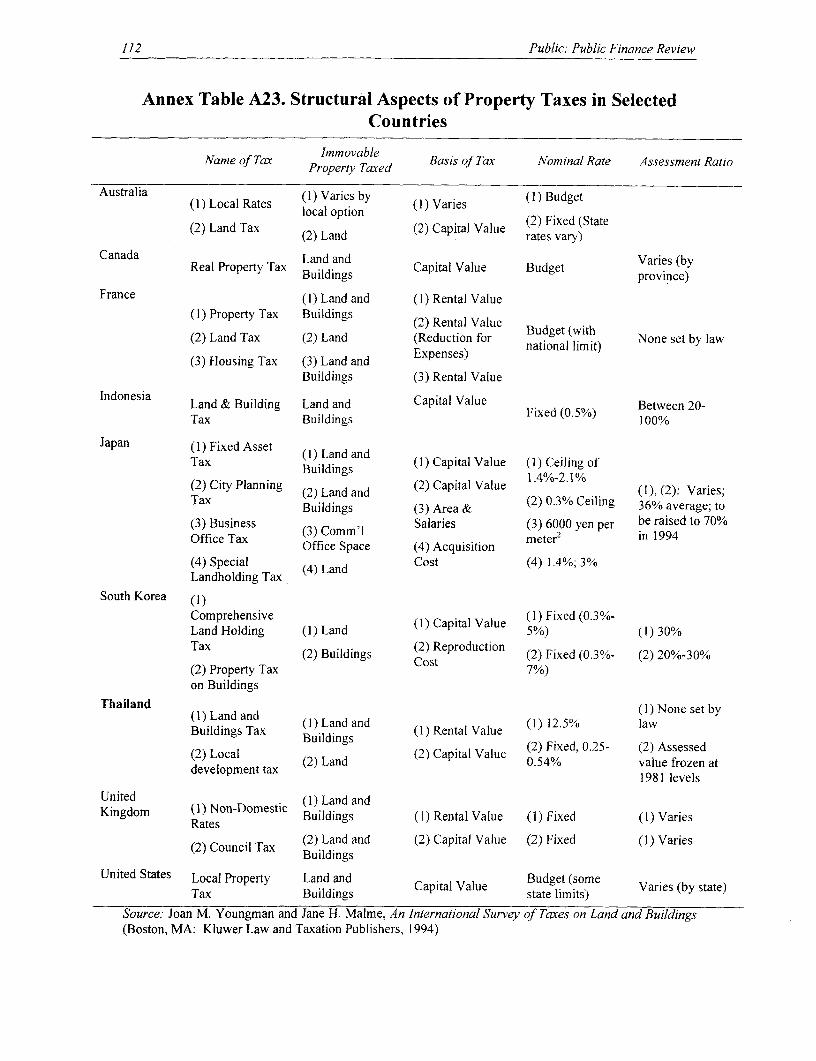
112 Public: Public Finance Review
Annex Table A23. Structural Aspects of Property Taxes in SelectedCountries
Name of Tax Property Taxed Basis of Tax Nominal Rate Assessment Ratio
Australia (1) Varies by (I) Budget(1) Local Rates local option (1) Varies t
(2) Land Tax (2) Land (2) Capital Value rates vary)
Canada Real Property Tax Land and Capital Value Budget Varies (byBuildings province)
France (I) Land and (1) Rental Value(1) Property Tax Buildings (2) Rental Value
(2) Land Tax (2) Land (Reduction for Budget (wlith None set by law
(3) Housing Tax (3) Land and Expenses)Buildings (3) Rental Value
Indonesia Land & Building Land and Capital Value Between 20-Tax Buildings Fixed (0.5%) 100%
Japan (1) Fixed Asset il Land andTax Buildings (I) Capital Value (I) Ceiling of
(2) City Planning (2) Land and (2) Capital Value (1), (2): Varies;Tax Buildings (3) Area & (2) 0.3% Ceiling 36% average; to
(3) Business 3 Co 'l Salaries (3) 6000 yen per be raised to 70%Office Tax (3) omm's meter2 in 1994
Office Space (4) Acquisition mtr(4) Special (4) Land Cost (4) 1.4%; 3%Landholding Tax
South Korea (I)
Comprehensive (I) Capital Value (1) Fixed (0.3%-Land Holding (1) Land ( 5%) (1) 30%Tax (2) Buildings (2) Reproduction (2) Fixed (0.3%- (2) 20%-30%
(2) Property Tax Cost 7%)on Buildings
Thailand (I) Land and (1) None set by
Buildings Tax (1) Land and (1) Rental Value (1) 12.5% lawBuildings Tax Buildings (2) Fixed, 0.25- (2) Assessed
(2) Local (2) Land (0) P l .54% value frozen at
1981 levels
United (1) Non-Domestic (I) Land and
Rates Buildings (1) Rental Value (1) Fixed (I) Varies
(2) Council Tax (2) Land and (2) Capital Value (2) Fixed (1) VariesBuildings
United States Local Property Land and Capital Value Budget (someTax Buildings state limits) Varies (by state)
Source. Joan M. Youngman and Jane H. Malme, An International Survey of Taxes on Land and Buildings(Boston, MA: Kluwer Law and Taxation Publishers, 1994)
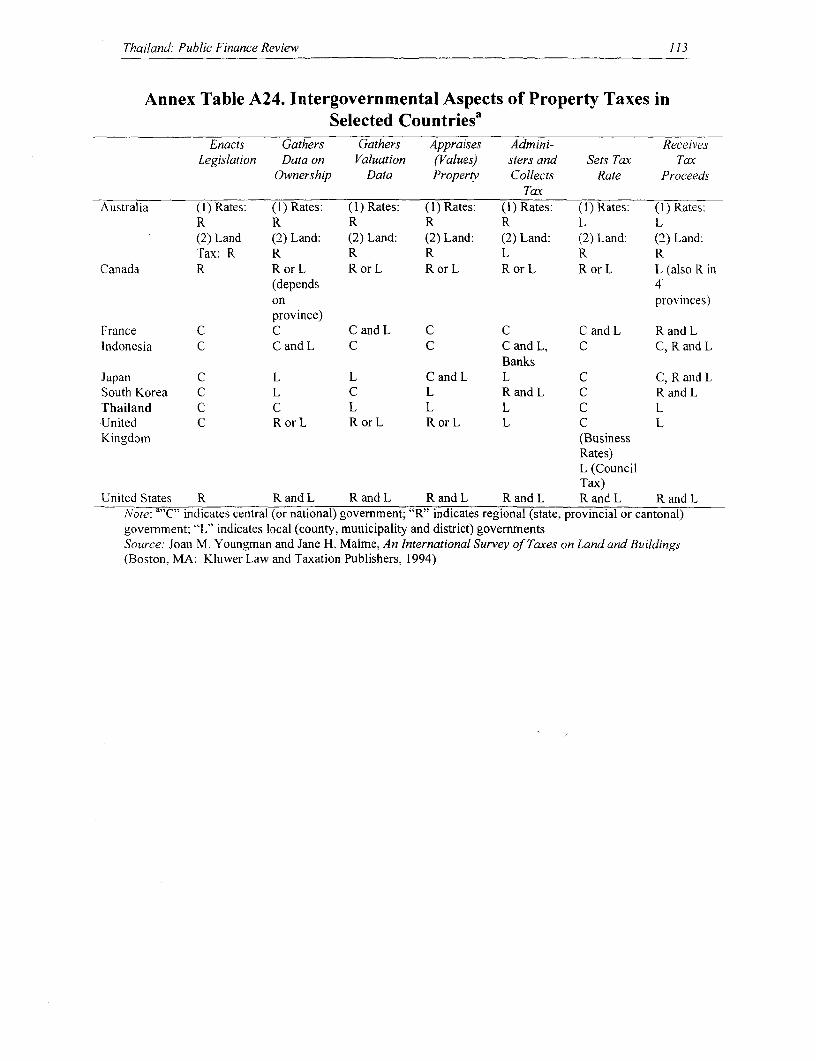
Thailand: Public Finance Review 113
Annex Table A24. Intergovernmental Aspects of Property Taxes inSelected Countriesa
Enacts Gathers Gathers Appraises Admini- ReceivesLegislation Data on Valuation (Values) sters and Sets Tax Tax
Ownership Data Property Collects Rate ProceedsTax
Australia (I) Rates: (1) Rates: (1) Rates: (1) Rates: (I) Rates: (1) Rates: (1) Rates:R R R R R L L(2) Land (2) Land: (2) Land: (2) Land: (2) Land: (2) Land: (2) Land:Tax: R R R R L R R
Canada R Ror L RorL RorL RorL R or L L (also R in(depends 4on provinces)province)
France C C C and L C C C andL RandLIndonesia C C andL C C C andL, C C, Rand L
BanksJapan C L L C andL L C C, Rand LSouth Korea C L C L Rand L C RandLThailand C C L L L C LUnited C R or L R or L R or L L C LKingdom (Business
Rates)L (CouncilTax)
United States R R and L R and L R and L R and L R and L R and LNote: a"C, indicates central (or national) government; "R" indicates regional (state, provincial or cantonal)government; "L" indicates local (county, municipality and district) governmentsSource: Joan M. Youngman and Jane H. Malme, An International Survey of Taxes on Land and Buildings(Boston, MA: Kluwer Law and Taxation Publishers, 1994)
114 Thailand: Public Finance Review
BIBLIOGRAPHY
Abed, G., J. Norregaard, K. Heeden, R. Gropp, and J. Walsh. 1998. "Thailand: Improving theStructure and Performance of the Revenue System". IMF, Fiscal Affairs Department.
Archer, R. W. 1973. "Land Speculation and Scattered Development; Failures in the Urban-FringeLand Market," Urban Studies, 10, 367-372.
Archer, R. W. 1995. "An Outline and A Bibliography on Local Govemment Property TaxReform in Thailand," The Journal of Property Tax Assessment and Administration, 1, 5-28.
Arthur Andersen Consultants. 1999. "Thailand: The Fiscal Costs of State Enterprises AndPrivate Participation in Infrastructure". Draft Final Report (Bangkok: WorldBank/Ministry of Finance).
Bahl, R. and J. Linn. 1992. "Property Tax Systems: Practice and Performance," Chapter 4 inUrban Public Finance in Developing Countries (The World Bank, Washington, D.C.,April 1992).
Bureau of the Budget (1999).
Brockman, R. A. C. 1996. "An Overview of Urban Finance in the Region", prepared for theAsian Development Bank's Urban Infrastructure Finance Seminar, 16-18 April 1996.
Chaihat, C. and K. Techarungniran. 1998. "An Analysis of Property and Land Taxes, draft."
Choi, K. 1997. "Tax Policy and Tax Reforms in Korea," in Tax Reform for Developing Countries,edited by Wayne Thirsk (The World Bank, Washington, D.C., December 1997).
Cooper, J. 1998. "Property Taxation in Australia", draft note.
Department of Local Administration. 1998. Report on "Efficiency Upgrading, Improvements inTax Mapping and Property Registration and Revenue Collection. "
DeVoy, R. S. 1997. "Final Summary Report", prepared for the Royal Thai GovernmentDepartment of Local Administration and United Nations Development Programme, 12December 1997.
Dillinger, W. 1991. Urban Property Tax Reform: Guidelines and Recommendations (The WorldBank, Washington, D.C, June 1991).
Hanisch, H. 1999. "Mission Report, Annex A-F".
IMF. 1999. " 8 th Review under the Stand By Arrangement".
Kakwani, N. and Pothong J. 1999. "Impact of Economic Crisis on the Standard of Living inThailand." Asian Development Bank and the Development Evaluation Division, NationalEconomic and Social Development Board.

Bibliography 115
Kelly, R. 1993a. "A Collection-Led Property Tax Reform Strategy: the Case of Indonesia,"Development Discussion Paper No. 449, Tax Research Series No. 12 (Cambridge, MA;Harvard Institute for International Development, May 1993).
Kelly, R. 1993b. "Implementing Property Tax Reform in Developing Countries: Lessons fromthe Property Tax in Indonesia," Development Discussion Paper No. 450, Tax ResearchSeries No. 13 (Cambridge, MA; Harvard Institute for International Development, May1993).
Kelly, R. 1993c. "The Evolution of a Property Tax Information Management System (SISMIOP):The Case of Indonesia," Development Discussion Paper No. 458, Tax Research Series No.14 (Cambridge, MA; Harvard Institute for International Development, May 1993).
Kelly, R. 1989. "Property Taxation," in Financing Local Government in Indonesia, edited byNick Devas, Ohio University Monographs in International Studies, Southeast Asia Series,No. 84.
Krongkaew, M. 1975. "The Income Distributional Effects of Taxes and Public Expenditures inThailand: An Intertemporal Study", PhD Dissertation, Michigan State University.
Krongkaew, M. 1976. "Tax and Revenue Burden and Household Income Distribution, 1969", inNarongchai Akrasanee and Rangsun Thanapornpun (eds.) Love Thailand, (Rak Thai) vol.2, Social Science Association of Thailand, Bangkok (in Thai).
Likitkijsomboon, P. 1985. "Taxation and Income Distribution in Thailand: A Case Study for1981", MA Thesis, Faculty of Economics, Thammasat University, Bangkok.
McCleary and Sakol. 1999. "Review of Public Expenditures in Thailand: Budget Plans andOutcomes (draft)". Thammasat University, Faculty of Economics.
Ministry of Finance, Thailand. 1999. "Fiscal Report of 1997". Fiscal Policy Office, translated forthe World Bank.
Ministry of Finance, Thailand. 1999. "Thailand's Economic Reform: From Crisis to Recovery."Progress Report. November 1999.
Mokoro Ltd. 1999. "Thailand Public Expenditure Review". Report prepared for the Bureau ofthe Budget, Government of Thailand, February 1999.
Ninnanahaeminda, T., 1999. "Thailand's Economic Reform: From Crisis to Recovery." ProgressReport. (Bangkok: Ministry of Finance, Thailand).
Research Triangle Institute and Land Institute Foundation. 1991. "Property Tax Reform inThailand", prepared for Royal Thai Government Fiscal Policy Office and the U.S. Agencyfor International Development, 15 October 1991.
Robson, M. 1999. "Tax Policy Reform in Thailand, An Interim Report of 7 May 1999".
Shah, A. and J. Whalley. 1990. "An Alternative View of Tax Incidence Analysis for DevelopingCountries," Public Economics Working Papers, WPS 462 (The World Bank, Washington,D.C., July 1990).
116 Thailand: Public Finance Review
Shirley, M. 1997. "The Economics and Politics of Government Ownership." Journal ofInternational Development, 9(6), 849-64.
Shirley, Mary M. 1983. Managing State-Owned Enterprises. (Washington, DC: The WorldBank).
Sussangkarn, C., P. Tinakorn and T. Chongpeerapien. 1988. "The Tax Structure in Thailand andits Distrubutional Implications", Thailand Development Research Institute, Bangkok,October 1998.
Sussangkam, C., F. Flatters and S. Kittiprapas. 1999. "Social Impacts of the Asian EconomicCrisis in Thailand, Indonesia, Malaysia and the Philippines." Thailand DevelopmentResearch Institute.
Detlef-Kammeier, Hans. 1999. "Thailand's Incomplete Decentralization Process," RegionalDevelopment Dialogue, 20 (2), Autumn 1999: 77-102
Suwanmalla, Charas. 1999. "Local Fiscal Capability, Thailand: Cases of SubdistrictAdministrative Organizations," Regional Development Dialogue, 20 (2), Autumn 1999:106-116
Suwanmala, Charas. 1999. "Central-Local Government: Who Should Provide What PublicServices?" The Thailand Research Fund
Thailand Development Research Institute. 1998. "Characteristics of Distribution of Tax Burdenand Expenditure Benefit in Thailand". Report submitted to Fiscal Policy Office, Ministry ofFinance, Government of Thailand, Natural Resources and Environment Division, February1998 (in Thai).
Varanyuwatana, S. 1995. "Non-Land Based Sources of Municipal Revenues: Case of Thailand"Draft, February 1995.
Warr, Peter G. forthcoming. "Fiscal Incidence and Poverty Targeting," draft 1999.
Warr P. and B. Nidhiprabha. 1996. "Thailand's Macroeconomic Miracle" (The World Bank,Washington, D.C., October 1996).
World Bank: 2000. "Debt Management Policy Note," World Bank Thailand Office.
World Bank. 1999a. "Thailand Social Monitor: Challenge for Social Reform." World BankThailand Office, January 1999.
World Bank. 1999b. "Thailand Social Monitor II: Coping with the Crisis in Education andHealth." World Bank Thailand Office, July 1999.
World Bank, 1999c. "Thailand Economic Monitor", various issues, World Bank Thailand Office.
World Bank. 1998a. East Asia: "The Road to Recovery." Washington, D.C., September 1998.
World Bank. 1998b. "Social Consequences of the East Asian Financial Crisis." Washington,D.C.
Bibliography 117
World Bank Assessment Mission. 1997. "Report of Assessment Mission: Urban DevelopmentUnder the 8th and 9th Plans," Prepared for the National Economic and Social DevelopmentBoard of the Royal Thai Government, Bangkok, Thailand.
World Bank: 1994 Thailand: Increasing Private Sector Participation and Improving Efficiency inState Enterprises. (Washington, DC: The World Bank).
Youngman, J. and J. H. Malme. 1994. "An International Survey of Taxes on Land and Buildings"(Boston, MA: Kluwer Law and Taxation Publishers).
Ziderman, A. 1999. "The Student Loans Scheme in Thailand: A Review and Recommendationsfor Efficient and Equitable Functioning of the Scheme." Report prepared for UNESCO-Bangkok as part of the Asian Development Bank Social Sector Program Loan.


![Land Acquisition Act, 1894...Land Acquisition Act, 1894 ၁၈၉၄ ၁၉၆၀ ၀ Burma Land Acquisition Manual, 1947 ၁၉၃၄ ၃1 THE LAND ACQUISITION ACT [ACT I, 1894] (1st](https://img.pdfslide.fr/doc/110x75/6002be9f983db76f6a708206/land-acquisition-act-1894-land-acquisition-act-1894-.jpg)