Embed Size (px)
Citation preview
Insérer ici le titre de votre Utilisation d’un diagnostic en
ligne pour le pilotage de
Procédé plasma thermique 3-5 Juin 2009
interventionligne pour le pilotage de propriétés de dépôts
M. VardelleSPCTS (UMR 6638) Univ. of Limoges, France
Thermal Spray ProcessThermal Spray Process
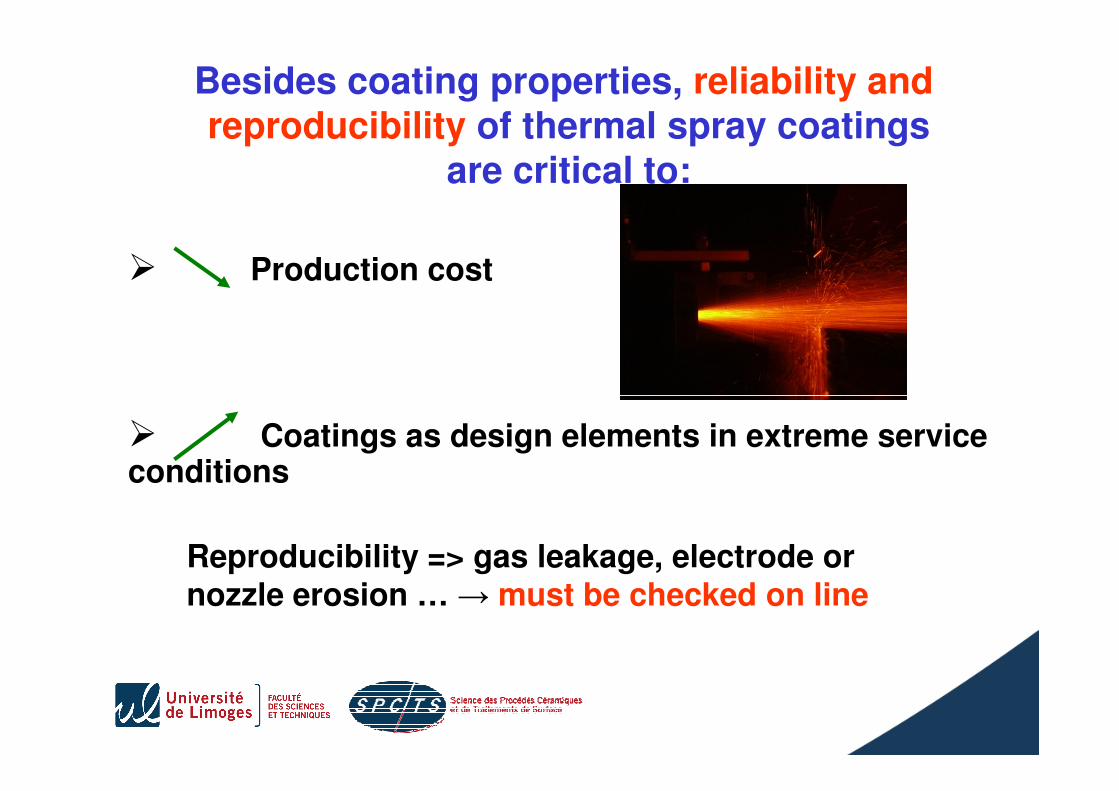
� Production cost
Besides coating properties, reliability andreproducibility of thermal spray coatings
are critical to:
� Coatings as design elements in extreme service conditions
Reproducibility => gas leakage, electrode ornozzle erosion … → must be checked on line
Coating properties and structure Coating properties and structure ����������������
Macroscopic spray parameters Macroscopic spray parameters
1. Substrate preparation
2. Torch working parameters + injector position
+ carrier gas flow rate
3. Kinematics torch/substrate 3. Kinematics torch/substrate
4. Substrate and coating mean temperature
evolution before, during and after spraying
5. Elimination of dust redeposited between
successive passes (3+4)
Monitoring of spray parameters
Carrier gas leakage, injector clogging… not
detected by monitoring macroscopic parameters
Detected by monitoring microscopic parameters
(T , v , fluxes of hot and cold particles, d ?) (Tp, vp, fluxes of hot and cold particles, dp?)
If sensor fixed on the torch or the torch regularly
positioned in front of the sensor during spraying
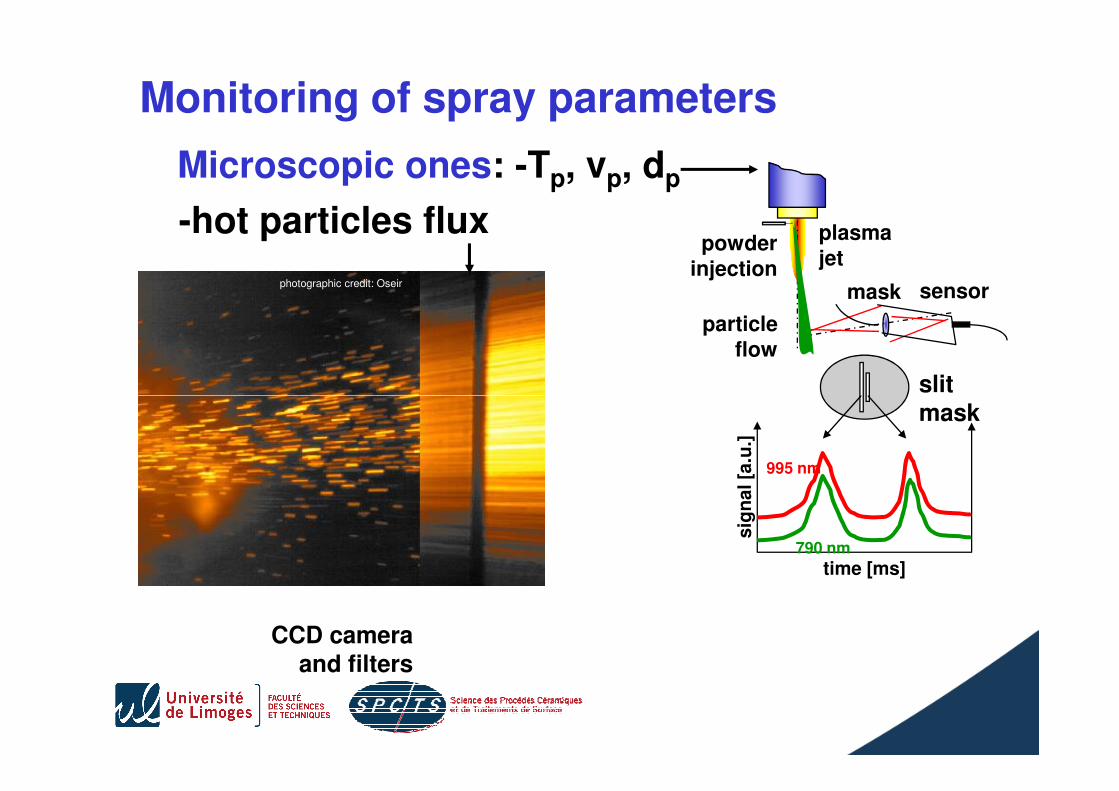
Monitoring of spray parameters
Microscopic ones: -Tp, vp, dp
slit
powderinjection
plasmajet
sensormask
particleflow
photographic credit: Oseir
-hot particles flux
slitmask
time [ms]
sig
nal [a
.u.]
995 nm
790 nm
CCD cameraand filters
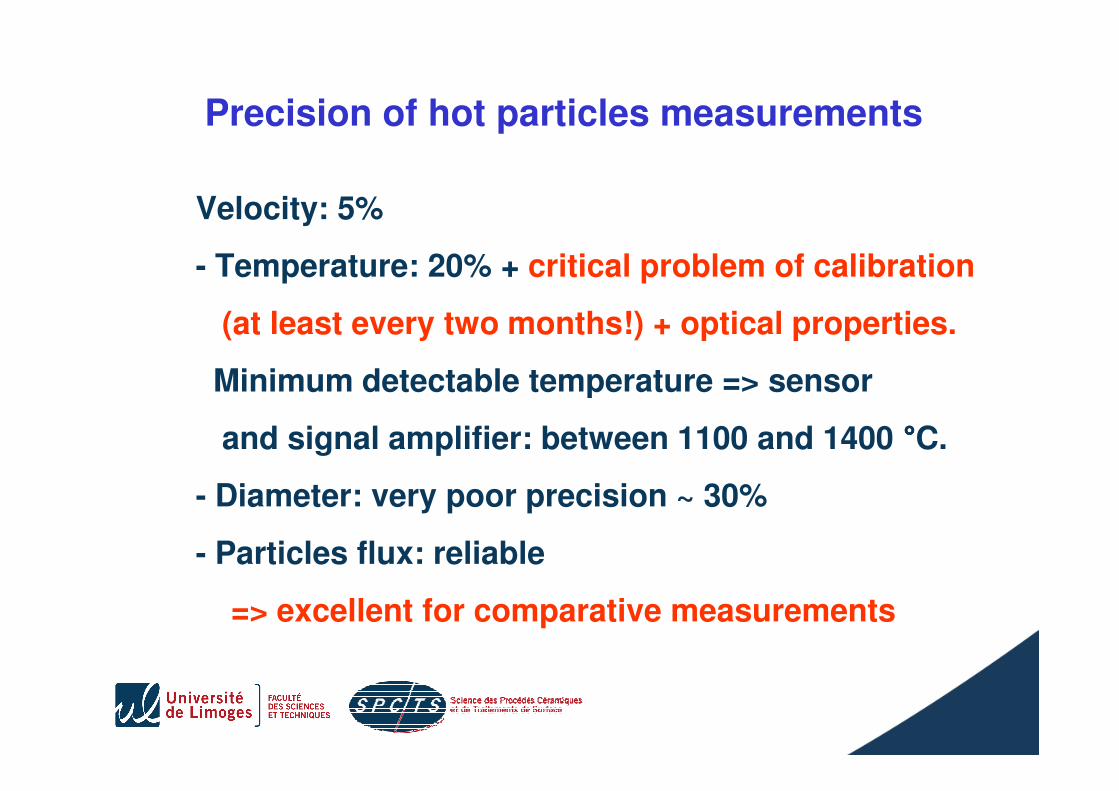
Precision of hot particles measurements
Velocity: 5%
- Temperature: 20% + critical problem of calibration
(at least every two months!) + optical properties.
Minimum detectable temperature => sensor Minimum detectable temperature => sensor
and signal amplifier: between 1100 and 1400 °°°°C.
- Diameter: very poor precision ~ 30%
- Particles flux: reliable
=> excellent for comparative measurements
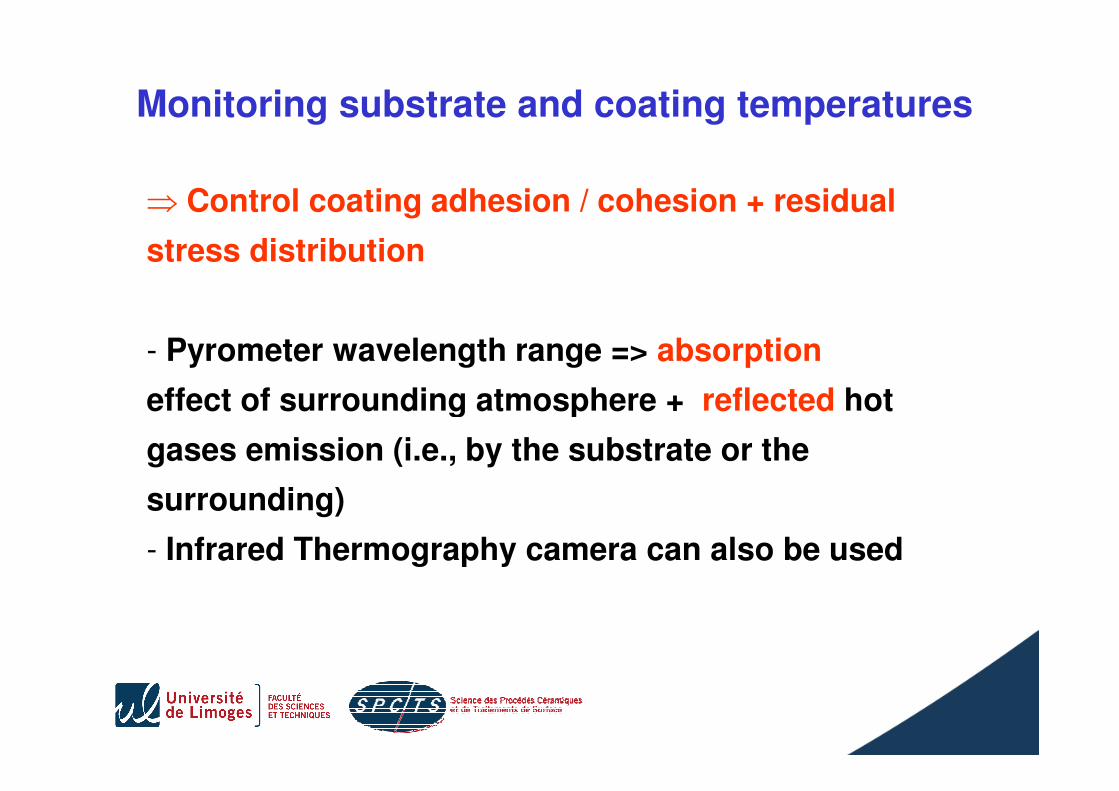
⇒ Control coating adhesion / cohesion + residual
stress distribution
- Pyrometer wavelength range => absorption
effect of surrounding atmosphere + reflected hot
Monitoring substrate and coating temperatures
effect of surrounding atmosphere + reflected hot
gases emission (i.e., by the substrate or the
surrounding)
- Infrared Thermography camera can also be used
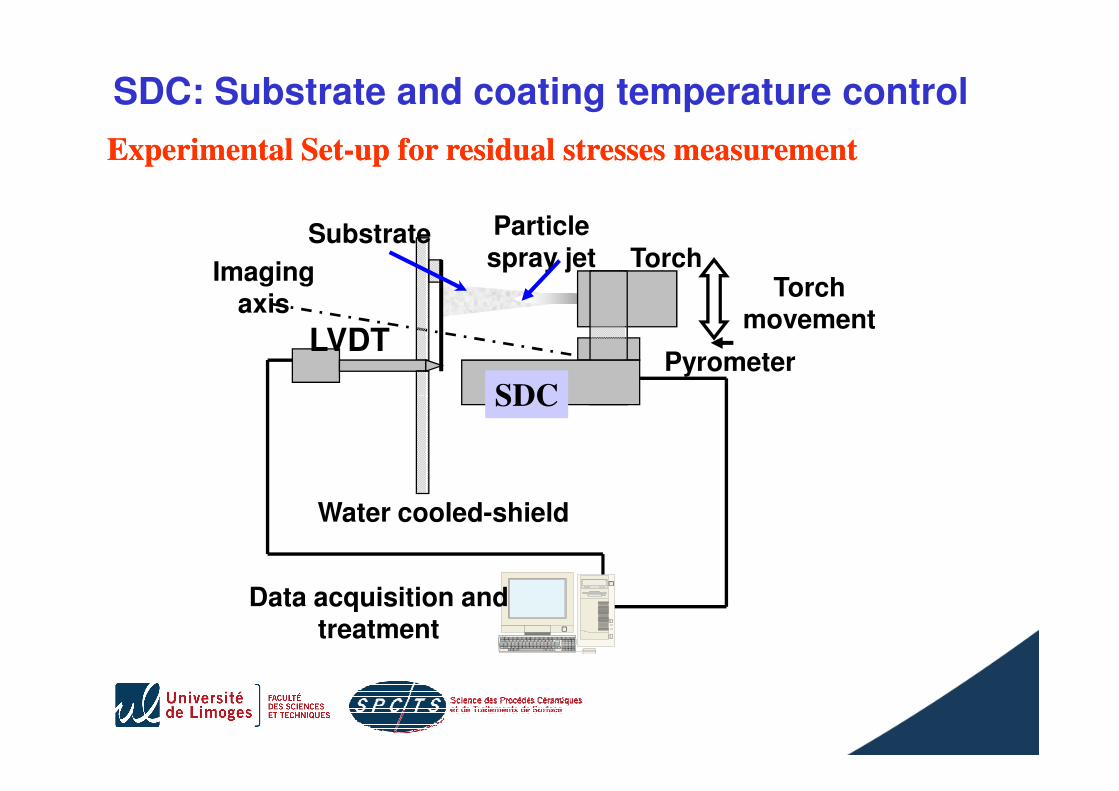
SDC: Substrate and coating temperature control
Experimental SetExperimental Set--up for residual stresses measurementup for residual stresses measurement
LVDT
Torch movement
TorchImaging
axis
Substrate Particle spray jet
SDCPyrometer
Data acquisition and treatment
Water cooled-shield
SDC
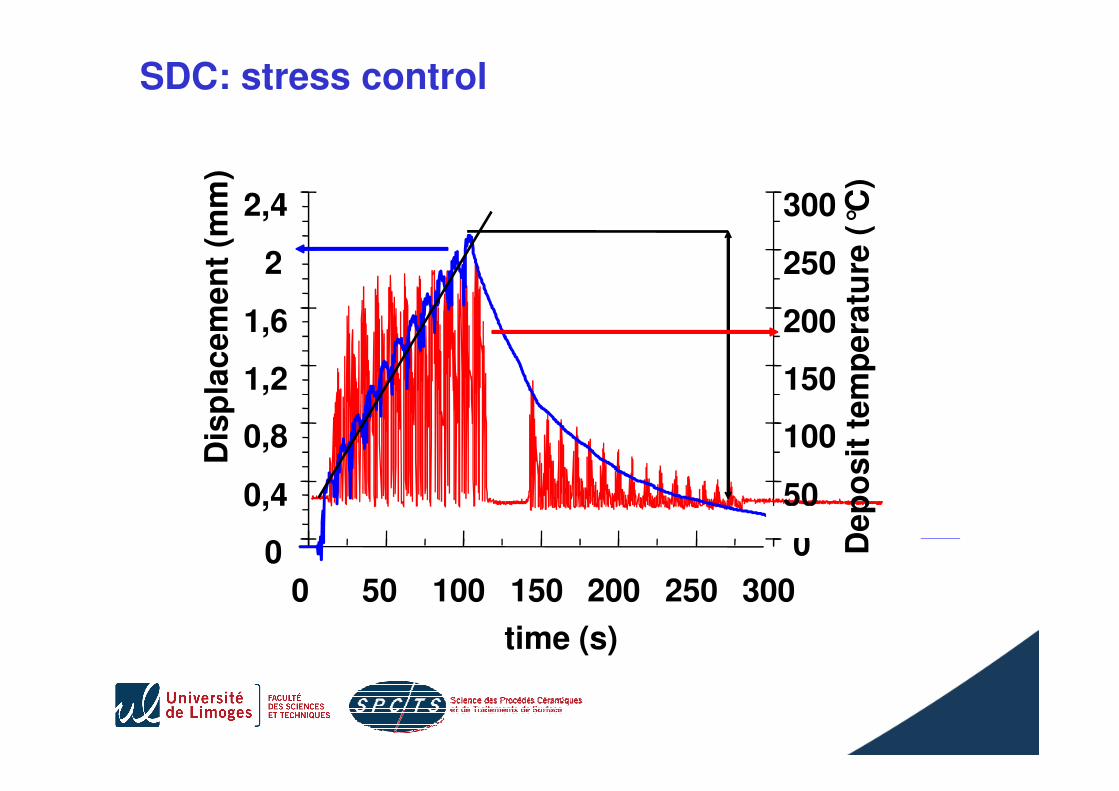
SDC: stress control
1,2
1,6
2
2,4D
isp
lacem
en
t (m
m)
150
200
250
300
Dep
osit
tem
pera
ture
(°C
)
00
0,4
0,8
1,2
0 50 100 150 200 250 300
time (s)
Dis
pla
cem
en
t (m
m)
50
100
150
Dep
osit
tem
pera
ture
(
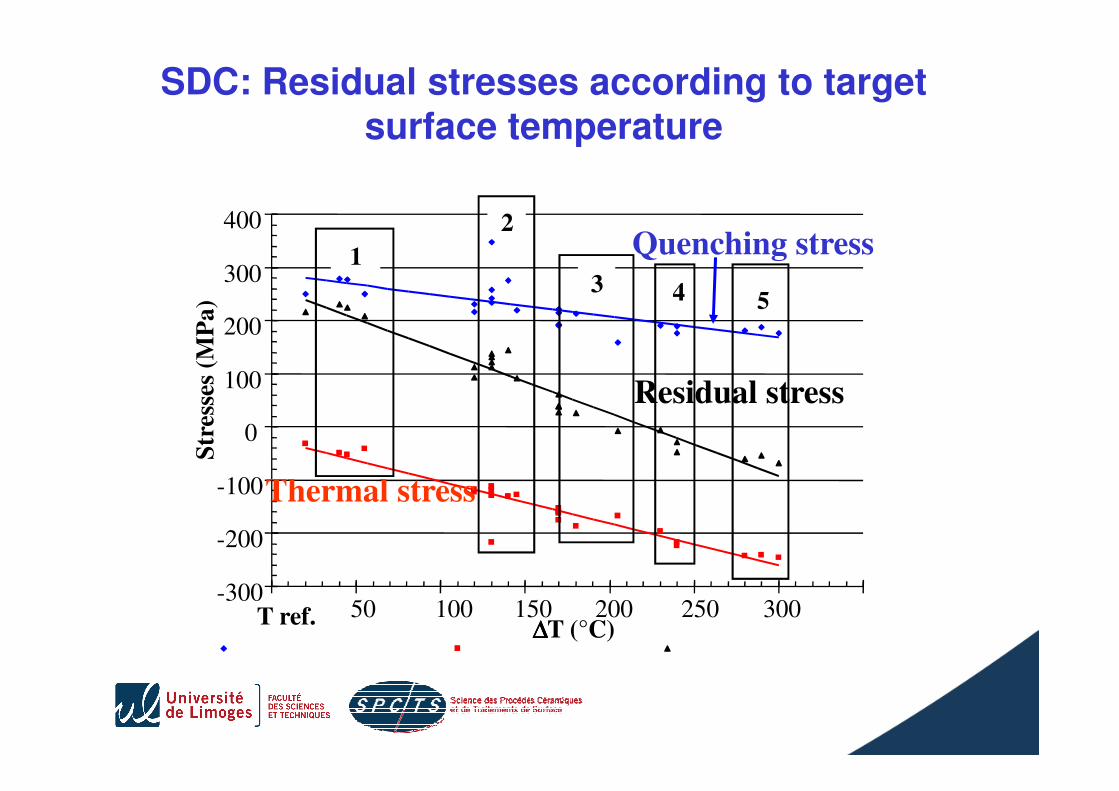
SDC: Residual stresses according to target surface temperature
100
200
300
400S
tres
ses
(MP
a)
Quenching stress
Residual stress
1
2
543
-300
-200
-100
0
∆∆∆∆T (°C)
Str
esse
s (M
Pa)
Thermal stress
Residual stress
10050 300250200150T ref.
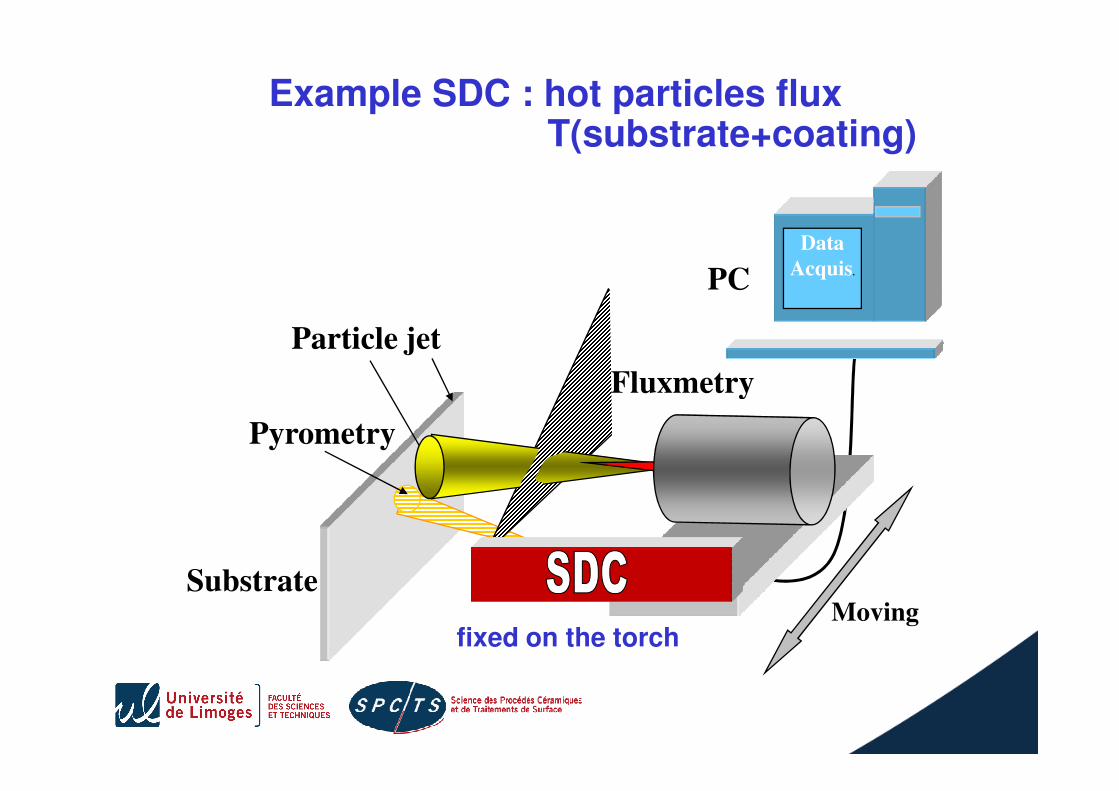
Example SDC : hot particles flux T(substrate+coating)
Particle jet
Fluxmetry
Data
Acquis.PC
Torch
MovingSubstrate
Pyrometry
Fluxmetry
fixed on the torch
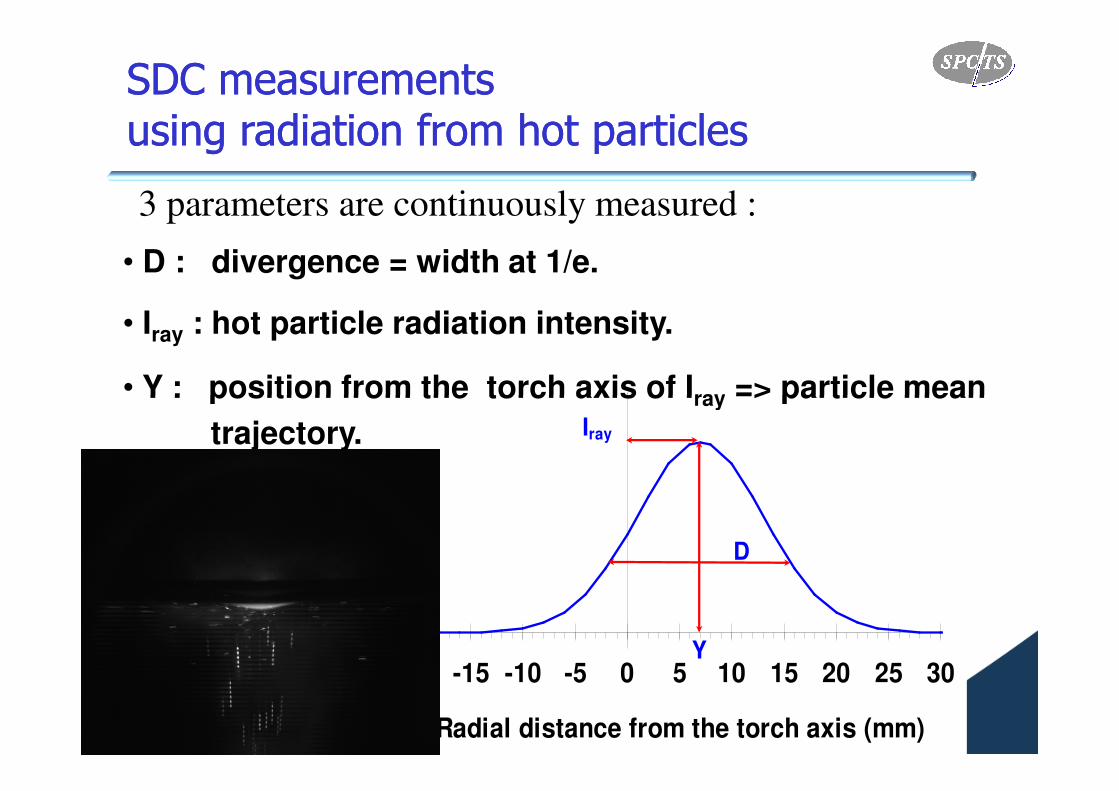
SDC measurementsSDC measurementsusing radiation from hot particlesusing radiation from hot particles
• D : divergence = width at 1/e.
• Iray : hot particle radiation intensity.
• Y : position from the torch axis of Iray => particle mean
3 parameters are continuously measured :
-20 -15 -10 -5 0 5 10 15 20 25 30
Radial distance from the torch axis (mm)
Iray
Y
D
• Y : position from the torch axis of Iray => particle mean
trajectory.
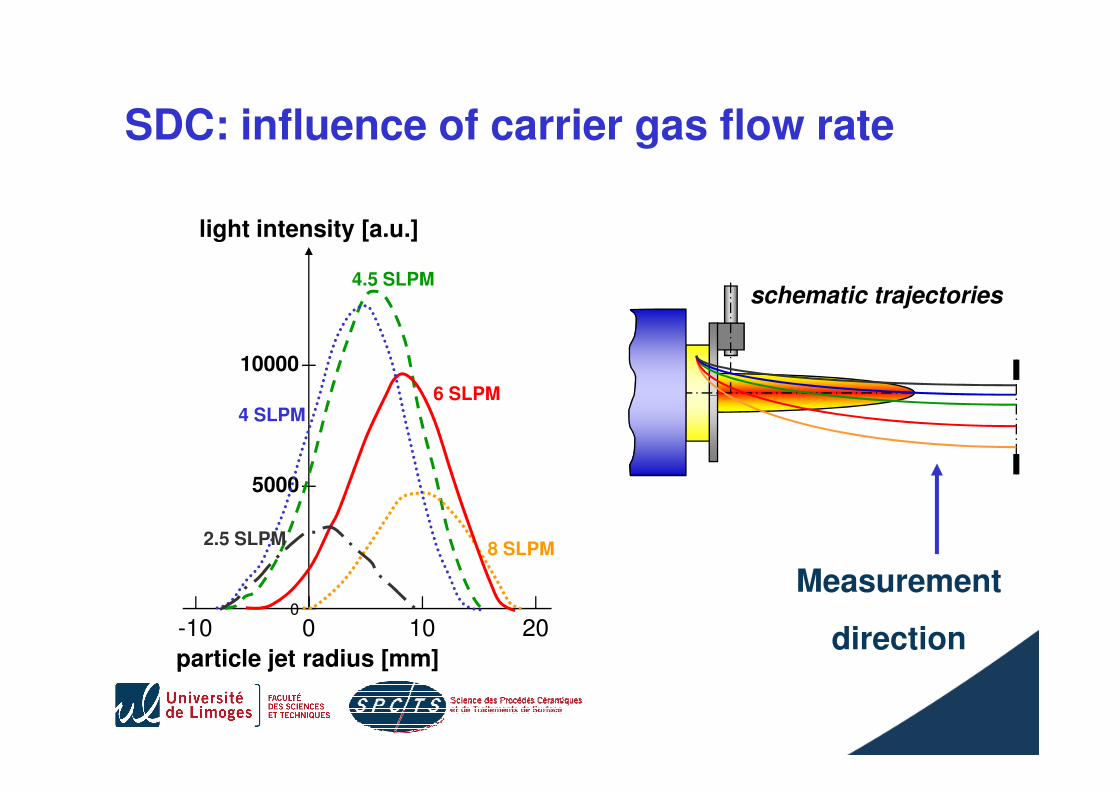
schematic trajectories
SDC: influence of carrier gas flow rate
10000
light intensity [a.u.]
4.5 SLPM
6 SLPM
5000
0
-10 0 10 20
particle jet radius [mm]
8 SLPM
6 SLPM4 SLPM
2.5 SLPM
Measurement
direction
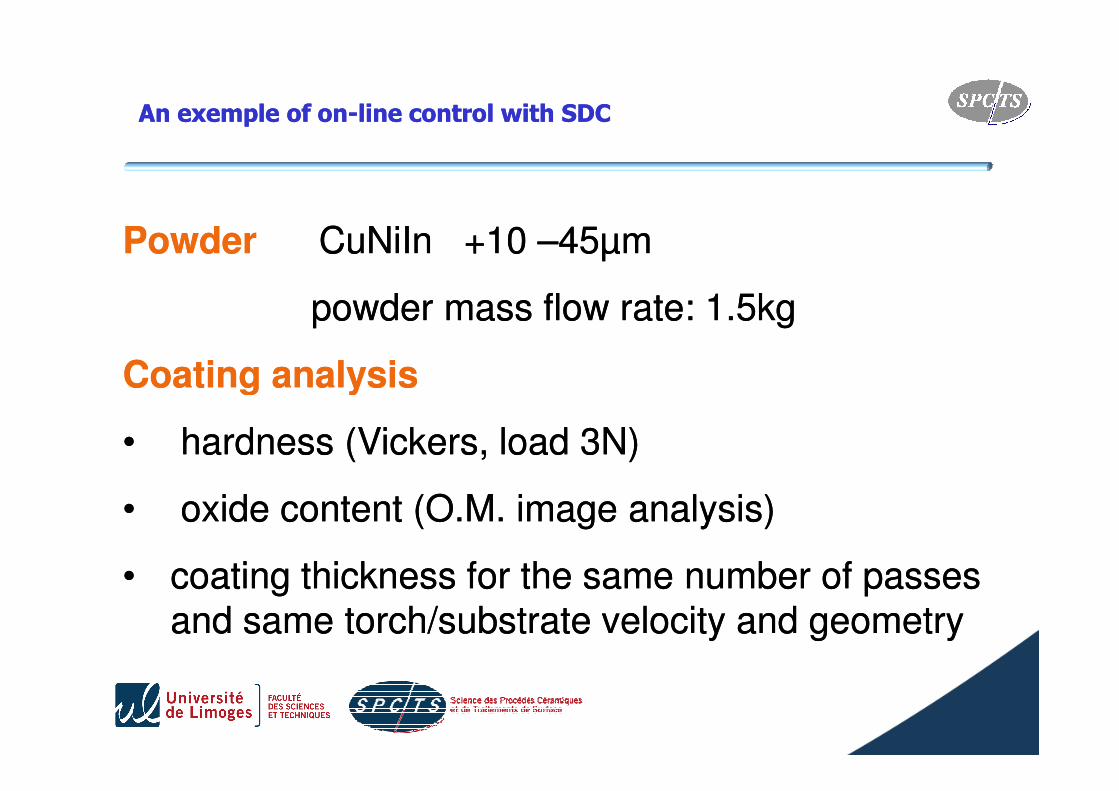
PowderPowder CuNiIn +10 CuNiIn +10 ––45µm45µm
powder mass flow rate: 1.5kgpowder mass flow rate: 1.5kg
Coating analysisCoating analysis
An exemple of onAn exemple of on--line control with SDCline control with SDC
•• hardness (Vickers, load 3N)hardness (Vickers, load 3N)
•• oxide content (O.M. image analysis)oxide content (O.M. image analysis)
•• coating thickness for the same number of passes coating thickness for the same number of passes
and same torch/substrate velocity and geometry and same torch/substrate velocity and geometry
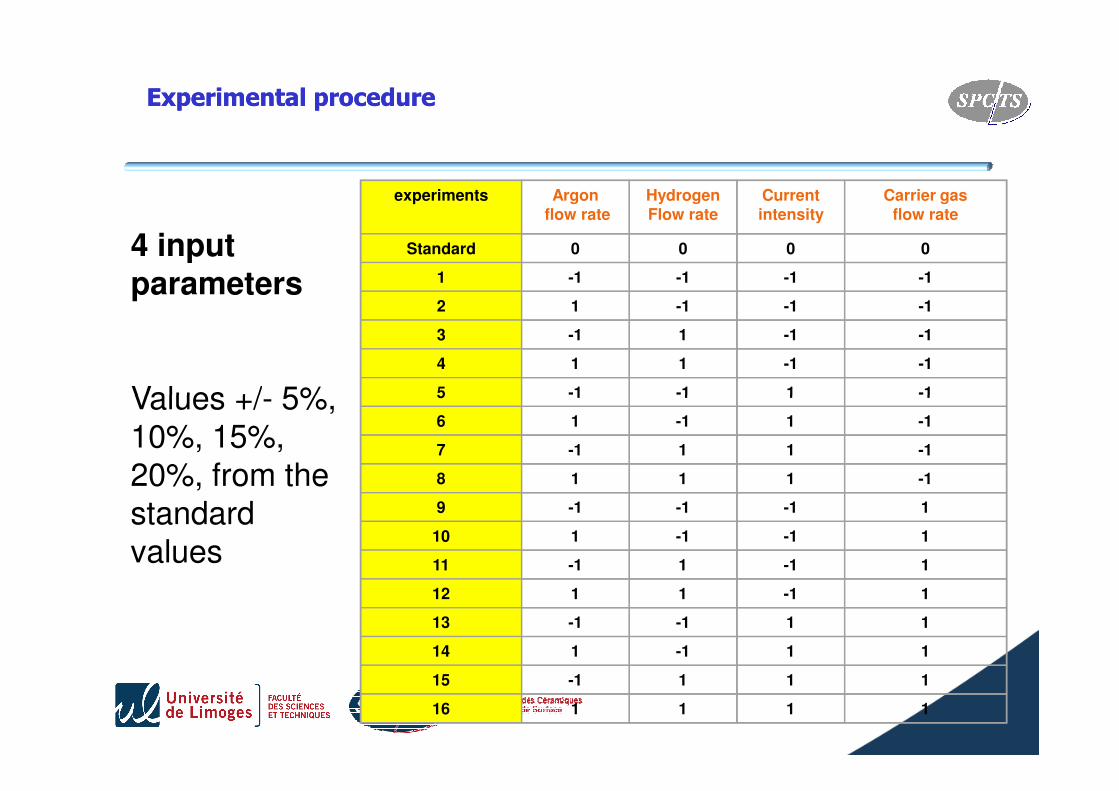
experiments Argonflow rate
HydrogenFlow rate
Current intensity
Carrier gasflow rate
Standard 0 0 0 0
1 -1 -1 -1 -1
2 1 -1 -1 -1
3 -1 1 -1 -1
4 1 1 -1 -1
5 -1 -1 1 -1
4 input parameters
Values +/- 5%,
Experimental procedure Experimental procedure
5 -1 -1 1 -1
6 1 -1 1 -1
7 -1 1 1 -1
8 1 1 1 -1
9 -1 -1 -1 1
10 1 -1 -1 1
11 -1 1 -1 1
12 1 1 -1 1
13 -1 -1 1 1
14 1 -1 1 1
15 -1 1 1 1
16 1 1 1 1
Values +/- 5%, 10%, 15%, 20%, from the standard values
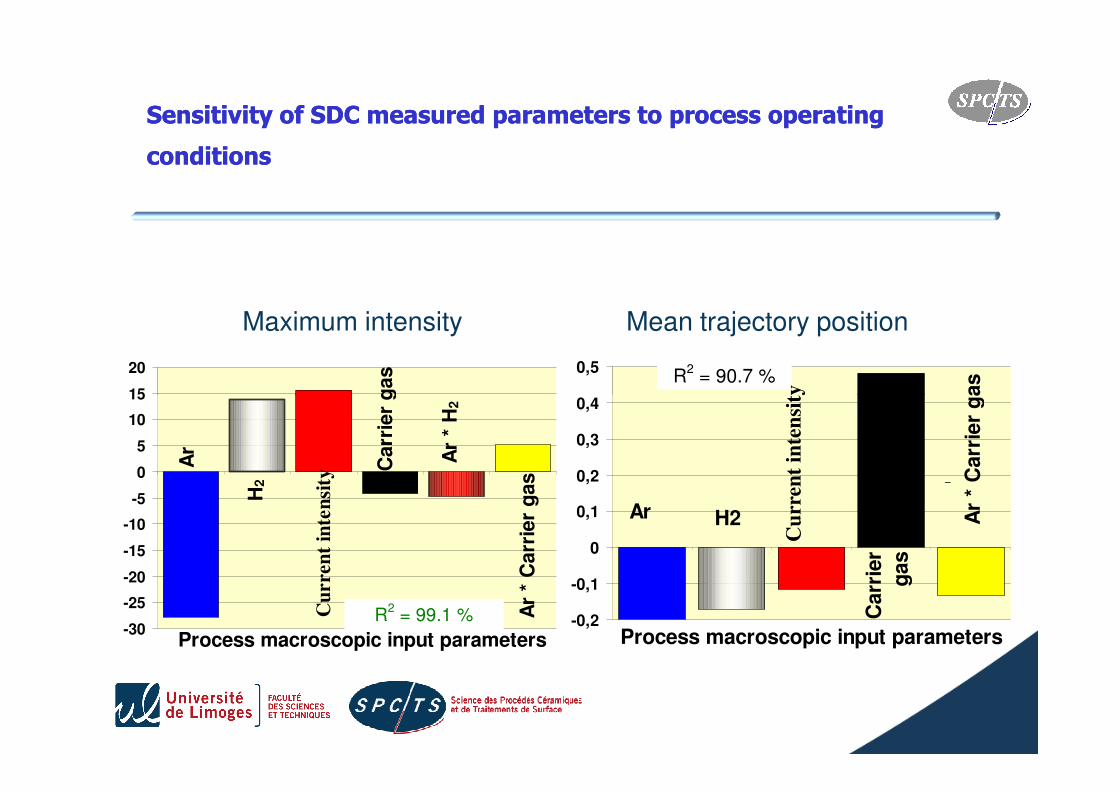
Sensitivity of SDC measured parameters to process operating Sensitivity of SDC measured parameters to process operating
conditionsconditions
Maximum intensity Mean trajectory position
15
20
Carr
ier
gas
0,4
0,5R
2 = 90.7 %
Ar
* C
arr
ier
gas
Cu
rren
t in
ten
sity
-30
-25
-20
-15
-10
-5
0
5
10
15
Process macroscopic input parameters
R2 = 99.1 %
Carr
ier
gas
Ar
* H
2
Ar
H2
Ar
* C
arr
ier
gas
Cu
rren
t in
ten
sity
-0,2
-0,1
0
0,1
0,2
0,3
0,4
Process macroscopic input parameters
Carr
ier
gas
I
Ar
* C
arr
ier
gas
Ar H2
Cu
rren
t in
ten
sity
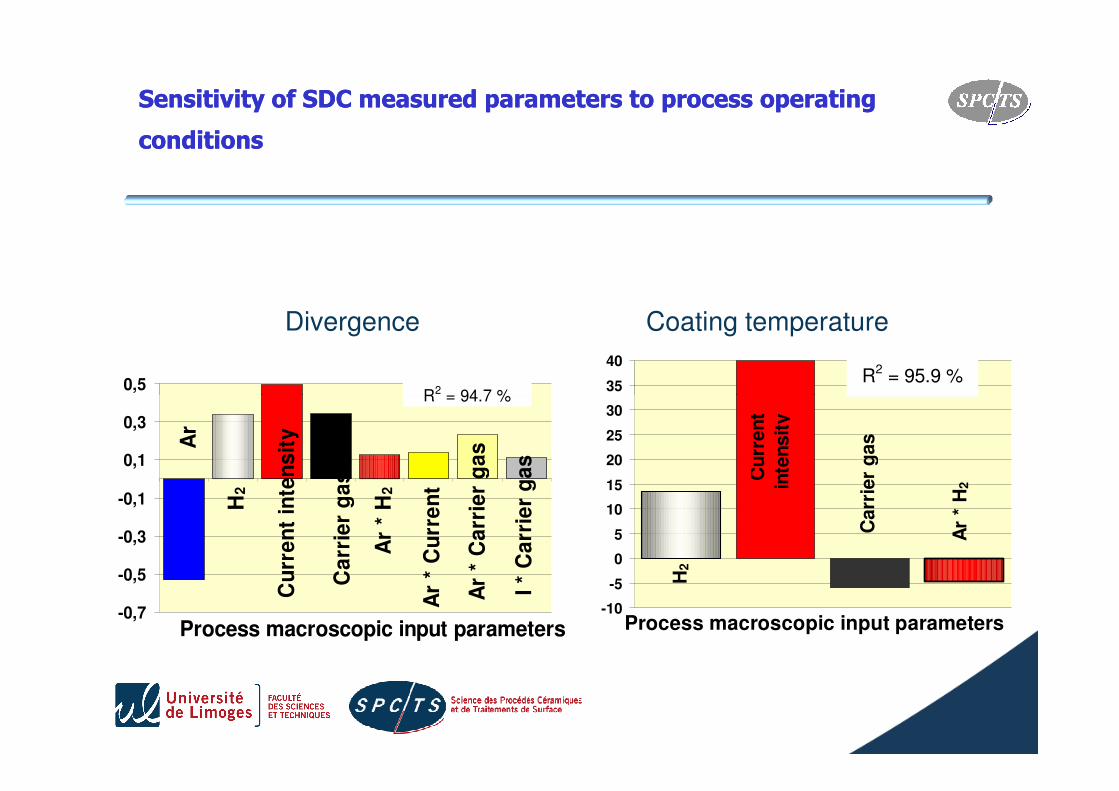
Divergence Coating temperature
0,5R2 = 94.7 %
35
40R2 = 95.9 %
Sensitivity of SDC measured parameters to process operating Sensitivity of SDC measured parameters to process operating
conditionsconditions
-0,7
-0,5
-0,3
-0,1
0,1
0,3
Process macroscopic input parameters
R2 = 94.7 %
Ca
rrie
r g
as
Ar
* H
2
Ar
H2
Cu
rre
nt
inte
ns
ity
Ar
* C
urr
en
t
Ar
* C
arr
ier
ga
s
I *
Ca
rrie
r g
as
-10
-5
0
5
10
15
20
25
30
Process macroscopic input parameters
Carr
ier
gas
Ar
* H
2
H2
Cu
rren
t
inte
nsit
y
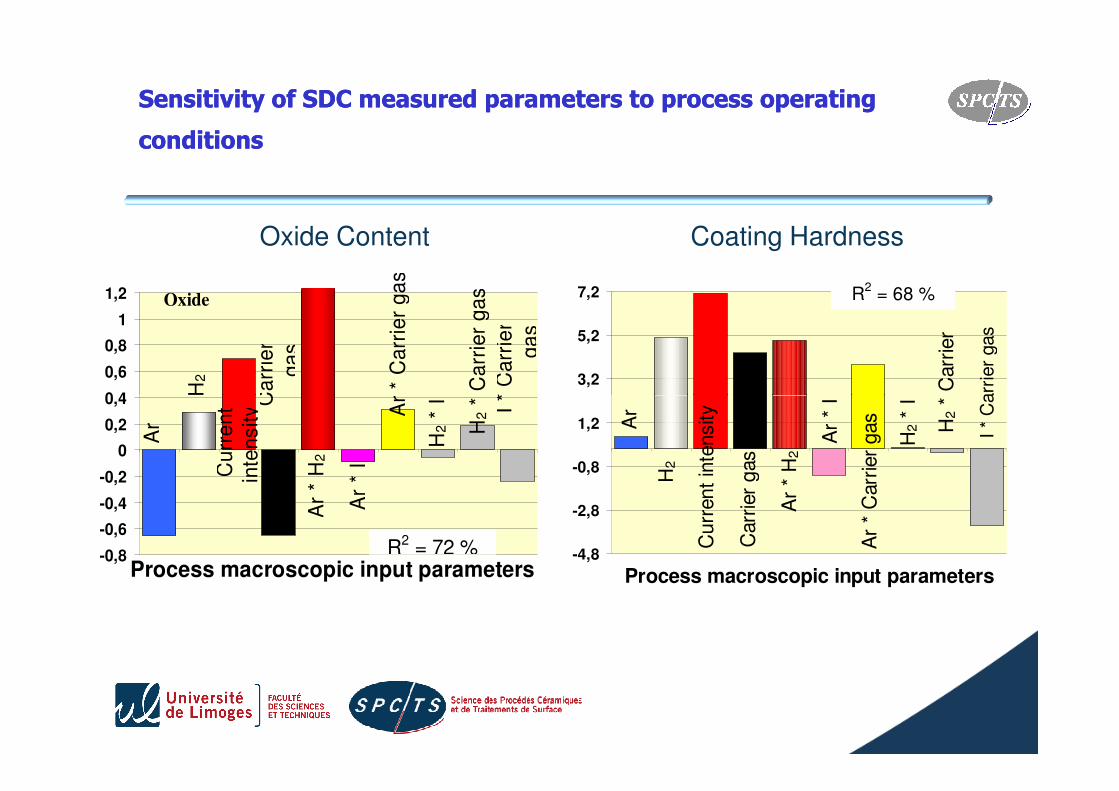
Oxide Content Coating Hardness
0,4
0,6
0,8
1
1,2
Ca
rrie
r
ga
s
H2
Ar
* C
arr
ier
ga
s
I *
Ca
rrie
r
ga
s
* C
arr
ier
ga
sOxide
3,2
5,2
7,2 R2 = 68 %
I *
Carr
ier
gas
* C
arr
ier
Sensitivity of SDC measured parameters to process operating Sensitivity of SDC measured parameters to process operating
conditionsconditions
-0,8
-0,6
-0,4
-0,2
0
0,2
0,4
Process macroscopic input parametersR2 = 72 %
Ca
rrie
r
Ar
* H
2
Ar
H
Cu
rre
nt
inte
nsity
H2 *
I
Ar
* I
Ar
* C
arr
ier
ga
s
I *
Ca
rrie
r
H2 *
Ca
rrie
r g
as
-4,8
-2,8
-0,8
1,2
Process macroscopic input parameters
Carr
ier
gas
Ar
* H
2
Ar
H2
Curr
ent
inte
nsity
H2 *
I
Ar
* I
Ar
* C
arr
ier
gas
I *
Carr
ier
gas
H2 *
Carr
ier
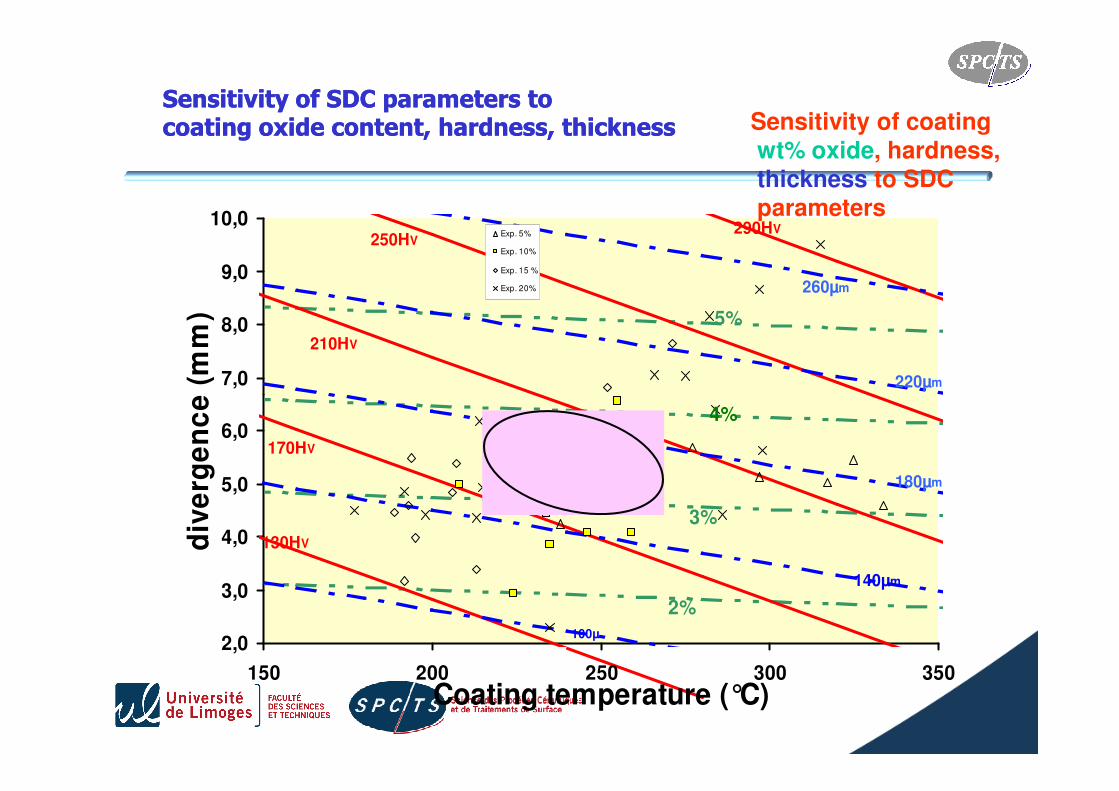
The evolution of : The evolution of :
-- the maximum intensitythe maximum intensity
-- the mean trajectory positionthe mean trajectory position
-- the divergence of the particle spray jet the divergence of the particle spray jet
are represented are represented versus the mean coating temperatureversus the mean coating temperature
Definition of area of good working parametersDefinition of area of good working parameters
are represented are represented versus the mean coating temperatureversus the mean coating temperature
On these graphs are plotted according to the On these graphs are plotted according to the correlations obtained with the factorial design, correlations obtained with the factorial design, the the lineslines corresponding to different corresponding to different values of oxide values of oxide content, hardness, and thicknesscontent, hardness, and thickness
The area of good working conditions is defined by The area of good working conditions is defined by the pink spotthe pink spot
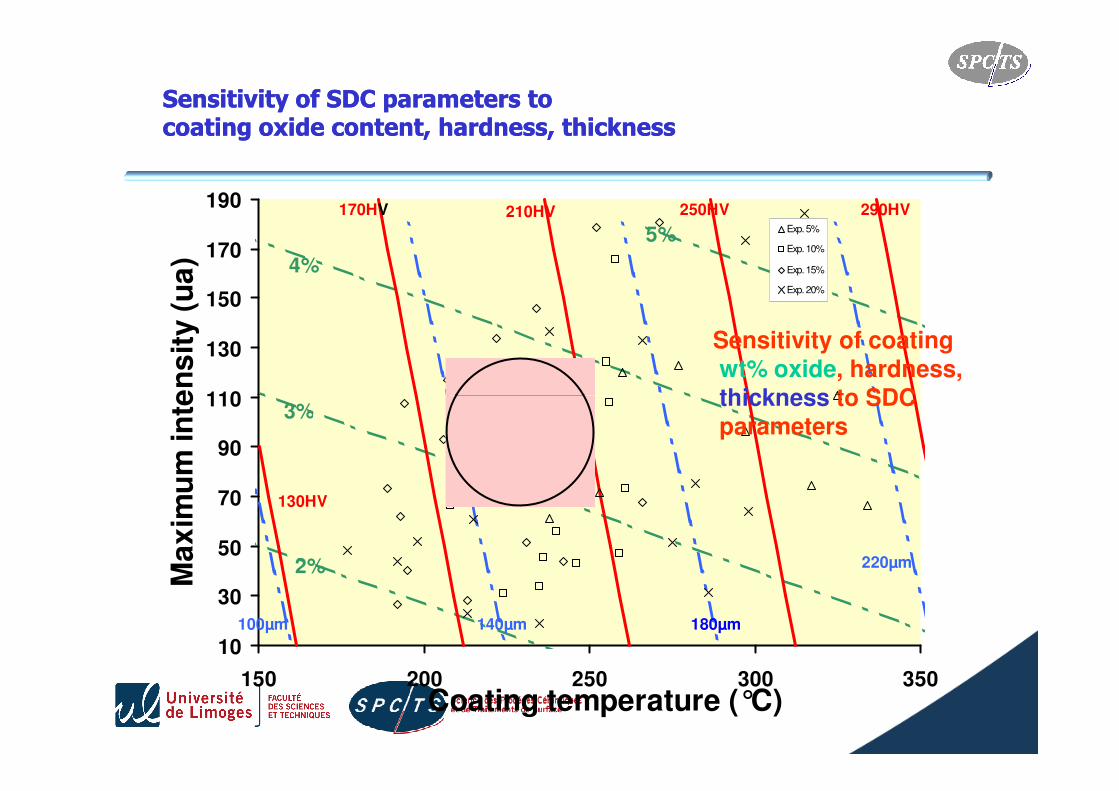
Sensitivity of SDC parameters to Sensitivity of SDC parameters to coating oxide content, hardness, thicknesscoating oxide content, hardness, thickness
110
130
150
170
190M
ax
imu
m in
ten
sit
y (
ua
)
Exp. 5%
Exp. 10%
Exp. 15%
Exp. 20%
5%
4%
170HV 210HV 250HV 290HV
Sensitivity of coatingwt% oxide, hardness,thickness to SDC
10
30
50
70
90
110
150 200 250 300 350Coating temperature (°C)
Ma
xim
um
in
ten
sit
y (
ua
)
3%
2%
130HV
140µm 180µm
220µm
100µm
thickness to SDCparameters
0
0,5
1
1,5
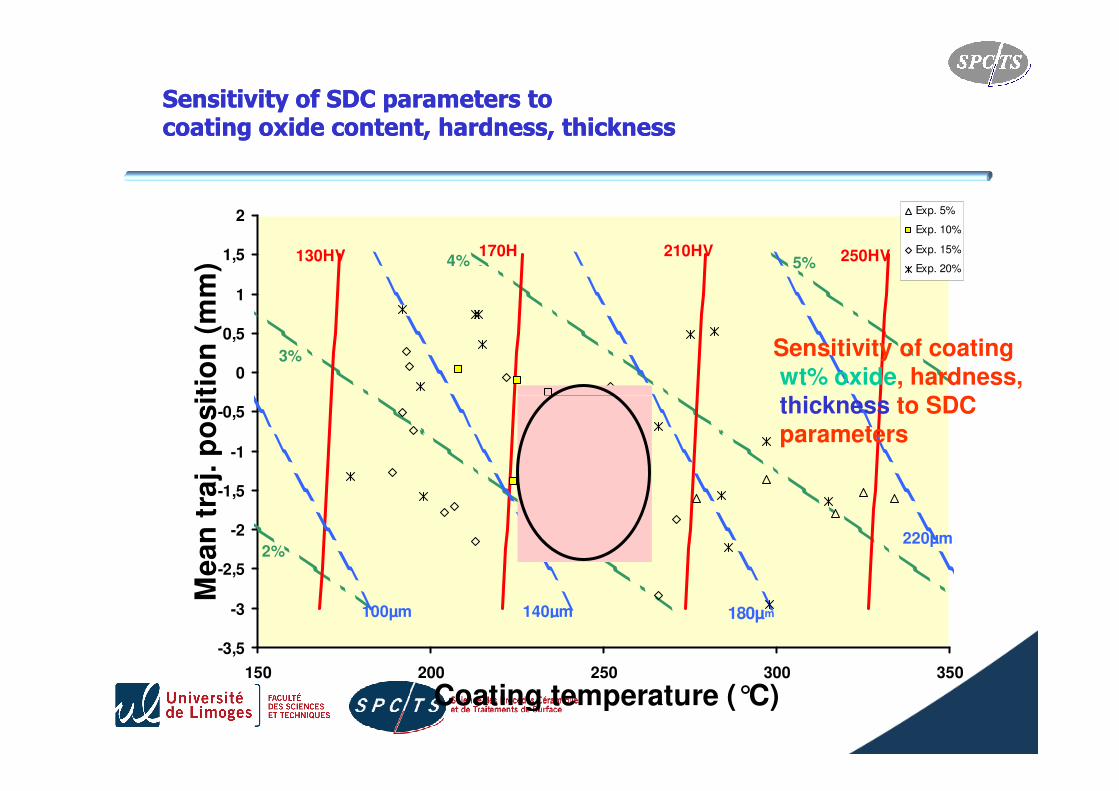
2M
ean
tra
j. p
osit
ion
(m
m)
Exp. 5%
Exp. 10%
Exp. 15%
Exp. 20%130HV
3%
4% 5%170H
V
210HV 250HV
Sensitivity of SDC parameters to Sensitivity of SDC parameters to coating oxide content, hardness, thicknesscoating oxide content, hardness, thickness
Sensitivity of coatingwt% oxide, hardness,thickness to SDC
-3,5
-3
-2,5
-2
-1,5
-1
-0,5
150 200 250 300 350
Coating temperature (°C)
Me
an
tra
j. p
osit
ion
(m
m)
2%
100µm 140µm 180µm
220µm
thickness to SDCparameters
7,0
8,0
9,0
10,0d
ive
rge
nc
e (
mm
)Exp. 5%
Exp. 10%
Exp. 15 %
Exp. 20%
5%210HV
250HV
220µm
260µm
290HV
Sensitivity of SDC parameters to Sensitivity of SDC parameters to coating oxide content, hardness, thicknesscoating oxide content, hardness, thickness Sensitivity of coating
wt% oxide, hardness,thickness to SDCparameters
2,0
3,0
4,0
5,0
6,0
150 200 250 300 350
Coating temperature (°C)
div
erg
en
ce
(m
m)
4%
3%
2%
130HV
170HV
100µ
140µm
180µm
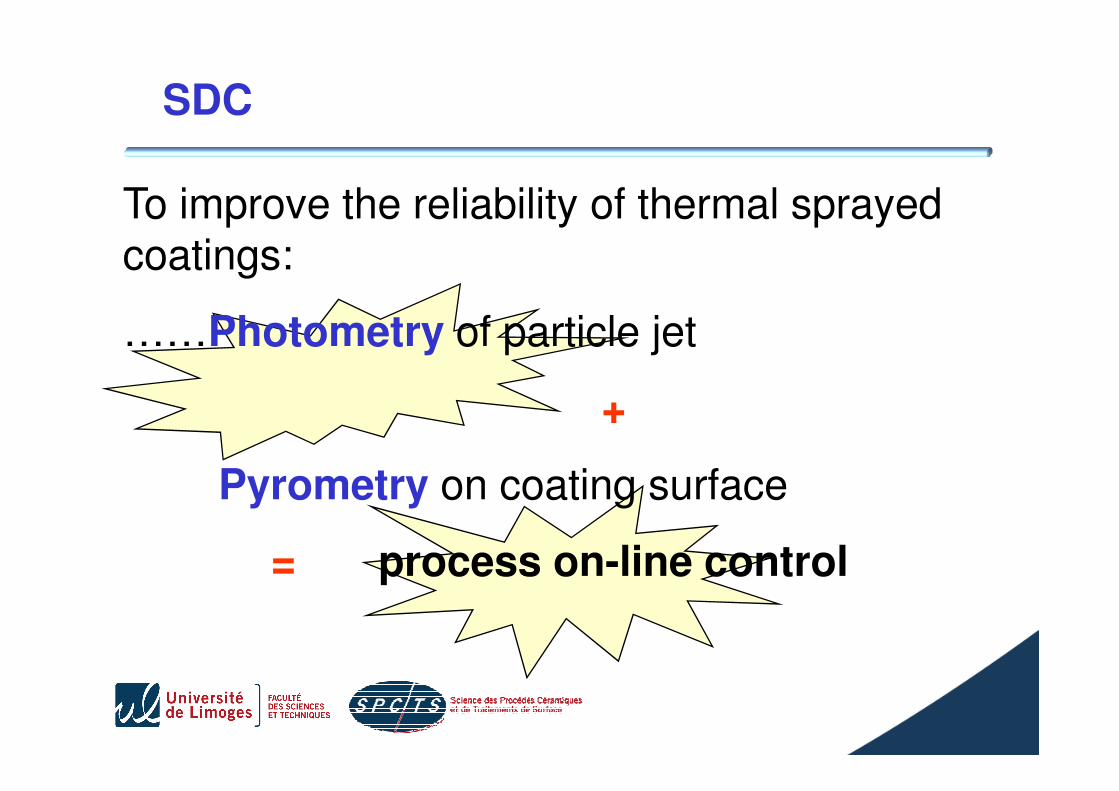
To improve the reliability of thermal sprayed coatings:
……Photometry of particle jet
+
SDC
+
Pyrometry on coating surface
= process on-line control
Factorial design shows that:Factorial design shows that:
•• SDC parameters are SDC parameters are very sensitivevery sensitive to spray to spray
input parametersinput parameters
•• SDC parameters evolve with Hardness, oxide SDC parameters evolve with Hardness, oxide
content, deposit thickness content, deposit thickness content, deposit thickness content, deposit thickness
•• DivergenceDivergence is a very interesting parameter to is a very interesting parameter to
monitor oxide content and coating thickness monitor oxide content and coating thickness
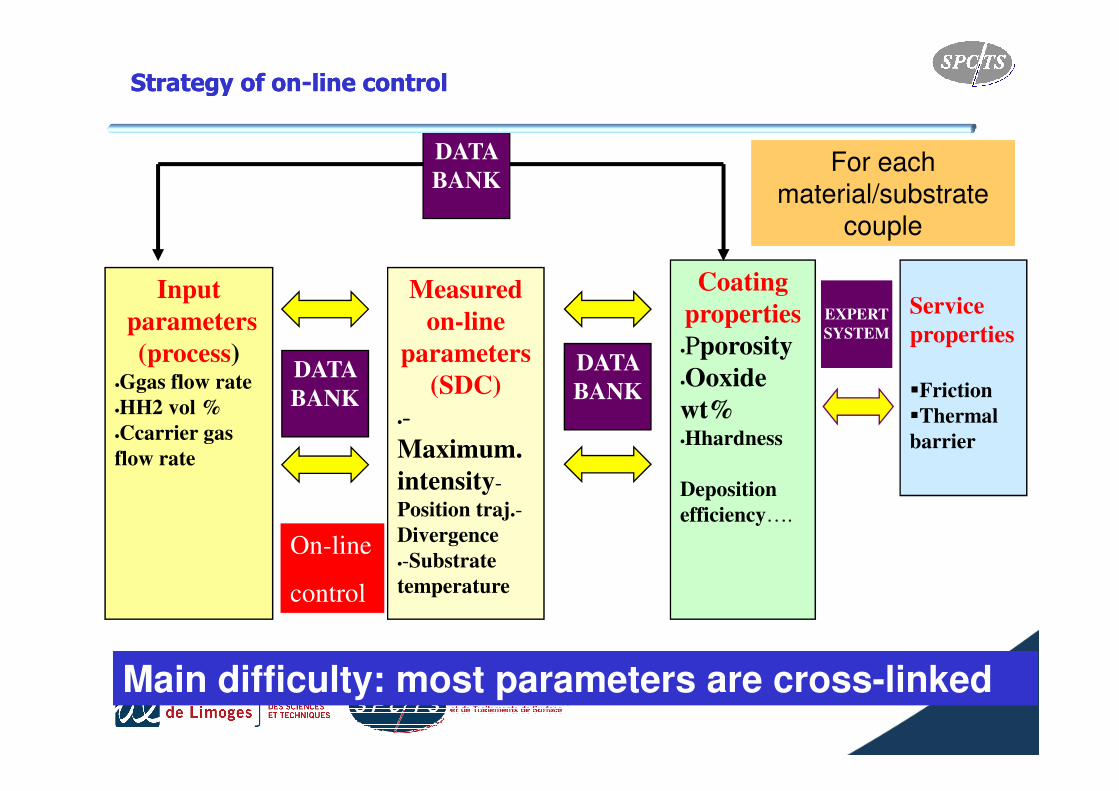
Strategy of onStrategy of on--line controlline control
Measured
on-line
parameters
(SDC)
Coating
properties
•Pporosity
•Ooxide
wt%
Service
properties
�Friction
EXPERT
SYSTEM
DATA
BANKDATA
BANK
Input
parameters
(process)•Ggas flow rate
HH2 vol %
DATA
BANKFor each
material/substrate couple
(SDC)
•-
Maximum.
intensity-
Position traj.-
Divergence
•-Substrate
temperature
wt%•Hhardness
Deposition
efficiency….
�Friction
�Thermal
barrier
BANKBANK•HH2 vol %
•Ccarrier gas
flow rate
Main difficulty: most parameters are cross-linked
On-line
control
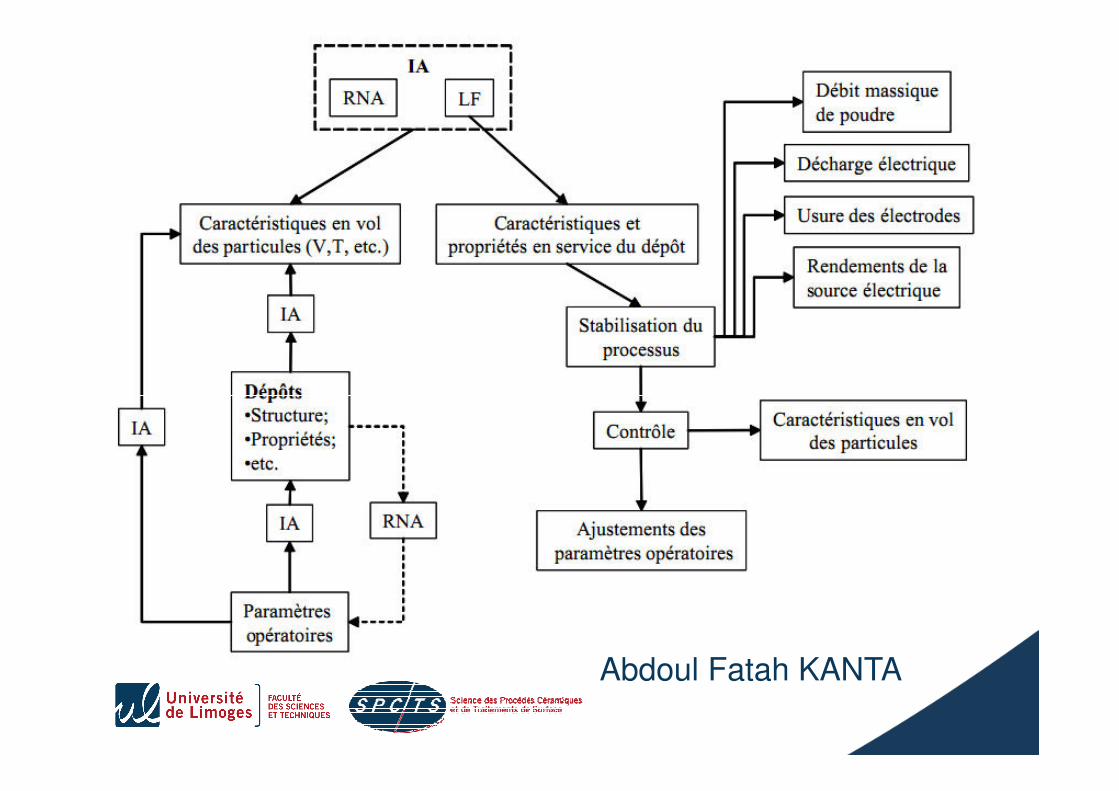
Systéme expert basé sur des méthodes d’intelligence artificielle
2 méthodes:
- Réseaux de neurones artificiels (RNA): prédiction des paramétres opératoires pour des conditions données
- Logique Flou (LF) : definition d’une stratégie de régulation des paramétres opératoires en tenant compte des instabilitées…
Abdoul Fatah KANTA (LERMPS)
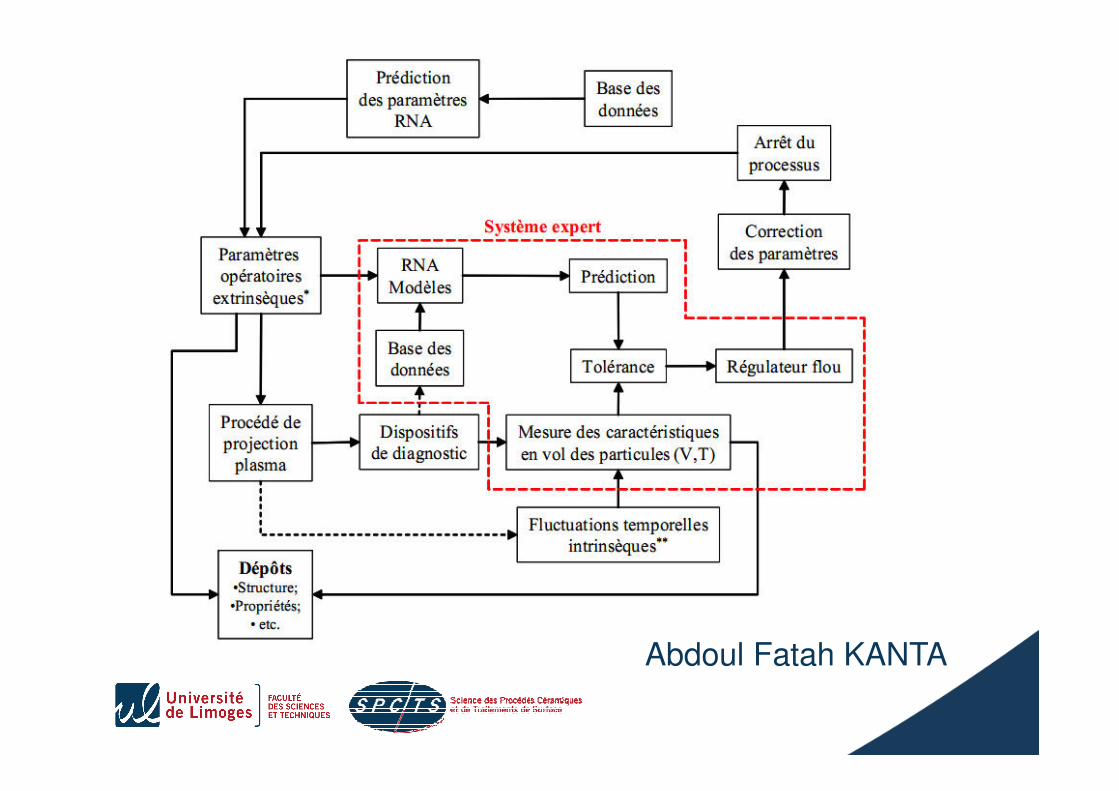
Abdoul Fatah KANTA

ConclusionsConclusions
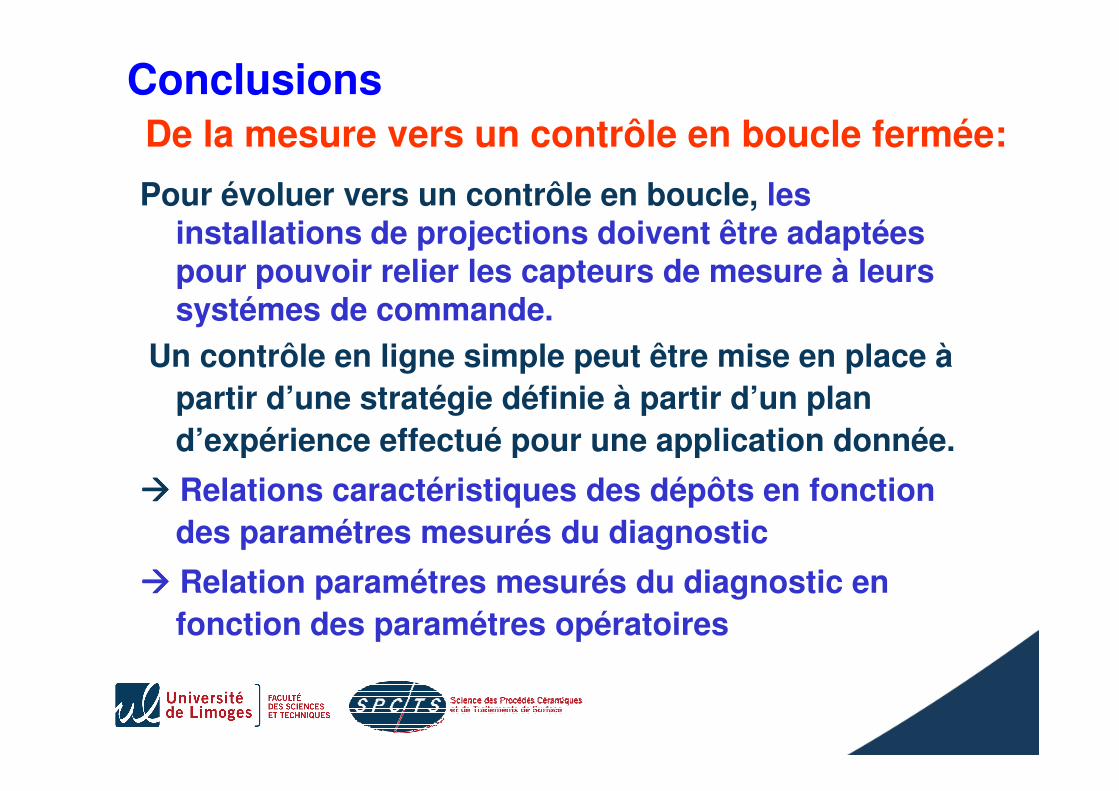
Pour évoluer vers un contrôle en boucle, lesinstallations de projections doivent être adaptées pour pouvoir relier les capteurs de mesure à leurs systémes de commande.
Un contrôle en ligne simple peut être mise en place à
partir d’une stratégie définie à partir d’un plan
Conclusions
De la mesure vers un contrôle en boucle fermée:
partir d’une stratégie définie à partir d’un plan
d’expérience effectué pour une application donnée.
���� Relations caractéristiques des dépôts en fonction
des paramétres mesurés du diagnostic
���� Relation paramétres mesurés du diagnostic en
fonction des paramétres opératoires
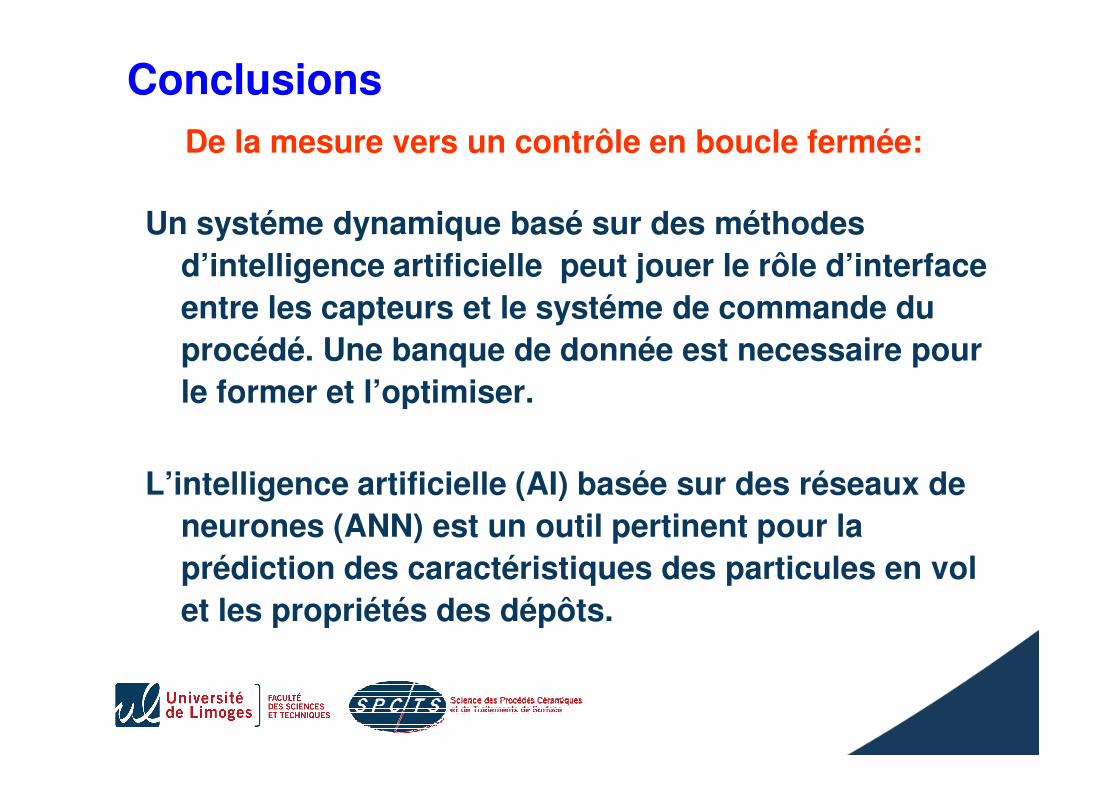
Un systéme dynamique basé sur des méthodes
d’intelligence artificielle peut jouer le rôle d’interface
entre les capteurs et le systéme de commande du
procédé. Une banque de donnée est necessaire pour
le former et l’optimiser.
Conclusions
De la mesure vers un contrôle en boucle fermée:
le former et l’optimiser.
L’intelligence artificielle (AI) basée sur des réseaux de
neurones (ANN) est un outil pertinent pour la
prédiction des caractéristiques des particules en vol
et les propriétés des dépôts.

Insérer ici votre texte
Insérer ici le titre de votre diapo
Thank you

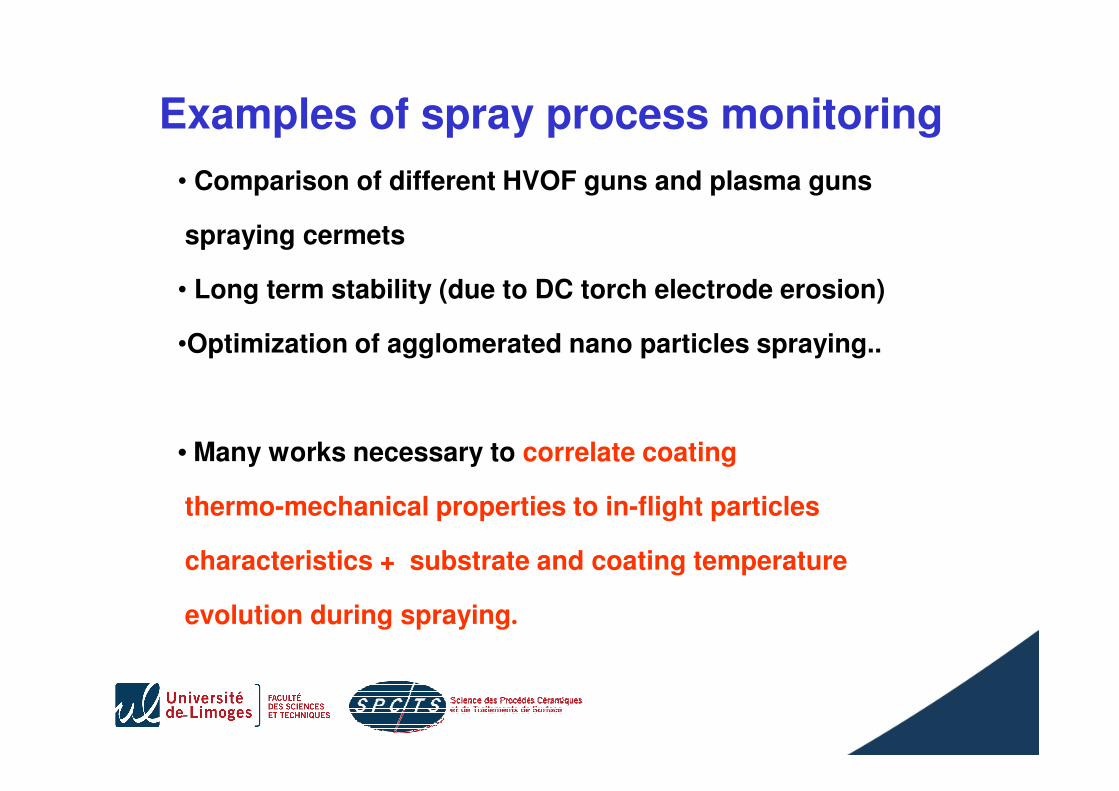
Examples of spray process monitoring
• Comparison of different HVOF guns and plasma guns
spraying cermets
• Long term stability (due to DC torch electrode erosion)
•Optimization of agglomerated nano particles spraying..
• Many works necessary to correlate coating
thermo-mechanical properties to in-flight particles
characteristics + substrate and coating temperature
evolution during spraying.
-
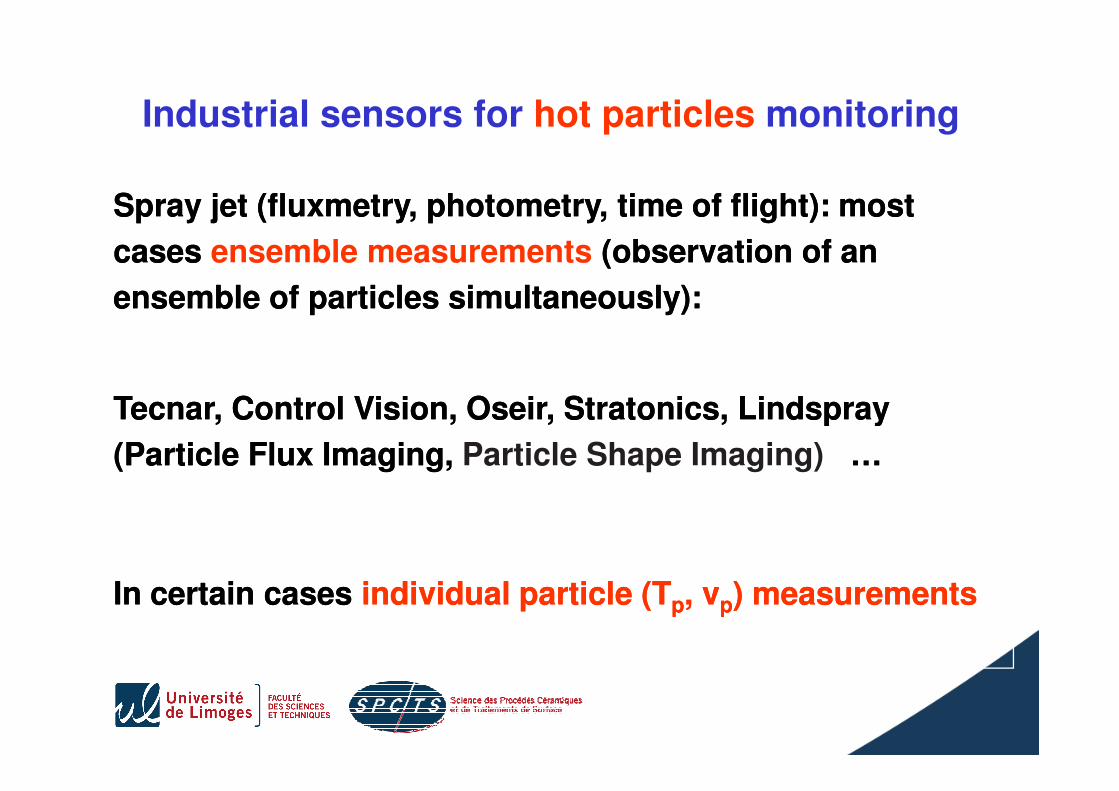
Spray jet (fluxmetry, photometry, time of flight): most Spray jet (fluxmetry, photometry, time of flight): most
cases cases ensemble measurements ((observation of an observation of an
ensemble of particles simultaneously):ensemble of particles simultaneously):
Tecnar, Control Vision, Oseir, Stratonics, Lindspray Tecnar, Control Vision, Oseir, Stratonics, Lindspray
Industrial sensors for hot particles monitoring
Tecnar, Control Vision, Oseir, Stratonics, Lindspray Tecnar, Control Vision, Oseir, Stratonics, Lindspray
(Particle Flux Imaging, (Particle Flux Imaging, Particle Shape Imaging) ……
In certain casesIn certain cases individual particle (Tindividual particle (Tpp, v, vpp) measurements) measurements
Abdoul Fatah KANTA