Embed Size (px)
Citation preview
����������������� ��������
����������������� ���������������� � ����������������� ��� �������������������������������������������
� ��
�������������� ������� ������������������������ ���
�
�� ����������� ��������� � � � ������� ��������������� !"�#����$%&' ()�%#�"* ��!+�$%!( !"� � ������� ��� ��� �������
������������������������������������
� ���!������"�#����$����
�
�
�
%#����&��$���"�!���"�#��������&�����#����������
'(�����)�#�'**+������
�&���&�)��%���� �����#&�!��!�&��&,���-!��!.�
�#������/�'**(�

The proceedings as well as other relevant material are available on www.biodiv.be/macolloq
Overview 5 Philippe BOURDEAU, Edwin ZACCAÏ The Millennium Ecosystem Assessment and other global environmental assessments 11 Edwin ZACCAÏ The Millennium Ecosystem Assessment: Overview of Findings 23 Walter V. REID The Millennium Assessment – methodology and framework 35 Jean-Paul MALINGREAU Ecosystem services: a key element in protecting biodiversity of wetlands, rivers and estuaries 41 Patrick MEIRE, Stefan VAN DAMME, Eric STRUYF, Tom MARIS, Hans BACKX Forest Ecosystem Assessment in Flanders – a selective review 57 Martin HERMY, Bart MUYS, Kris VERHEYEN, Jos VAN ORSHOVEN La forêt wallonne, réalités, enjeux et prospective 75 Jacques RONDEUX Les espaces ruraux et agricoles belges : opportunités d’une approche d’évaluation écosystémique 89 Marc MORMONT Ecosystem services and the MA methodology applied to the Belgian Part of the North Sea 99 Magda VINCX, Sofie DEROUS, Steven DEGRAER Les animaux dénaturés : la bonne question ? 115 Emmanuël SERUSIAUX The Millennium Ecosystem Assessment: Implications for research 119 Jurgen TACK Belgium’s National Biodiversity Strategy: what links with the Millennium Ecosystem Assessment? 121 Marianne SCHLESSER List of participants 129

7
Overview
Philippe Bourdeau 1 and Edwin Zaccaï 2
1 SCOPE, 2 Université Libre de Bruxelles - IGEAT [email protected], [email protected]
Introduction The Millennium Ecosystem Assessment1 is a major international project launched by the
UN in 2001 and completed in 2005. It was designed to meet the needs of decision makers and the public for scientific information concerning the consequences of ecosystem change for human well-being and options for responding to those changes, at the turn of the millennium. The MA aims also at providing tools for planning, management and foresight concerning the consequences of decisions affecting ecosystems. More than 1300 scientists from 100 countries have been involved in the work to synthesize information from the scientific literature, datasets, and scientific models, and to include knowledge held by the private sector, practitioners, local communities and indigenous people.
One year after the publication of the reports, the survey of initial impacts (2006)2 of the
MA has shown that several institutions, regions, countries and sectors had already been significantly influenced by the results. Most of them recognize the MA as a helpful instrument to identify priorities for action and to build individual and institutional capacity to undertake integrated ecosystem assessments.
In Europe in particular, the MA reports have generated a great deal of interest in several
countries (e.g. France, Germany, the United Kingdom), which have undertaken studies on the advisability and feasibility of MA - like assessments at national scale. The European Environment Agency has included in its programme the coordination of a European-wide ecosystem assessment to be completed in 2012. In July 2007, the European Commission has listed MA-type studies in its funding priorities for environmental research in the 7th RTD Framework Programme.
In Belgium, the National SCOPE Committee (Scientific Committee on Problems of the
Environment of ICSU, the International Council for Science)3 and the National Committee of Biological Sciences of the Belgian Royal Academies undertook to disseminate the results of MA in Belgium. For this purpose, they convened a Conference, entitled “The Millennium Ecosystem Assessment: implications for Belgium” which took place on October 27th, 2006, at the Palace of the Academies in Brussels4. It brought together scientists, administrators,
1.http://www.MAweb.org 2 http://www.millenniumassessment.org/documents/Document.798.aspx.pdf. See also Reid in this volume. 3 http://www.icsu-scope.org/ 4 http://www.biodiv.be/macolloq. See list of participants at the end of this volume.
8
decision makers, representatives of the private sector and of environmental NGO’s, and a wider audience interested in ecosystem management, to discuss potential implications of the MA for Belgium and, in particular, how it may be of importance in their present and future work.
The program was focussed on selected major ecosystems in Belgium, and the relevance of
the MA for environmental policy and research strategies in order to study their evolution (see the original program in Appendix 1). In each case the following questions were submitted as guidelines for the presentations:
1. What ecosystem services, as defined in the MA methodology, are supplied? 2. How did the ecosystem change over the last 50 years? 3. What are the consequences of ecosystem change for its services? 4. How will the ecosystem services change under current practice? 5. Which priority measures should be taken to remediate ecosystem services losses? 6. Is the MA methodology an appropriate approach to evaluate ecosystem change and
ecosystem services? The conference ended with a panel discussion involving representatives of various
categories of stakeholders and the audience, concentrating on three questions: a) what is the importance of the MA approach for actual environmental and sustainable
policies? b) which changes in the organisation of the policy response should be recommended, in
the light of MA conclusions? c) which research strategies should be recommended in order to underpin the MA
approach?
Overview Following is a brief overview of the papers that were presented. Edwin Zaccai discusses the characteristics of the main global environmental assessments
published in the last 30 years (Limits to Growth, the Brundtland report, the GEO reports, especially GEO-3, the Environmental Sustainability Index, the Living Planet reports) and analyses the factors which have determined their influence. He concludes that the MA is likely to have a growing influence because of its emphasis on the contribution of ecosystem services to human well-being. This anthropocentric approach is likely to be more successful in mediating conflicts between environmental protection and socio-economic concerns, as decisions regarding the environment involve increasingly major policy makers.
An overview of the MA and its findings is offered by Walter V. Reid, who was directly
involved in its preparation. He also summarised the impact of MA one year after the release of the core findings.
In his paper, Jean-Paul Malingreau examines critically the methodology and the
framework of the MA. Its key features are multiscale analyses and integration of knowledge. The multiscale approach, facilitated by the use of GIS (geographical information systems) is
9
needed because of the frequent mismatch between the scales of ecosystemic service provision, response options and decision making. Moreover this approach enables the detection of interactions between far and proximate causes of change, or between local ecological factors and national socio-economic parameters. In addition, it is more efficient because findings at a given scale are improved by information obtained at other scales. Integration of knowledge through interdisciplinarity is an absolute necessity in global change studies. It has been achieved in the MA through the adoption of systems analysis. The author concludes that the MA is a new approach to support good governance at various levels of decision making. It should not be a one-off event.
Patrick Meire, Stefan Van Damme, Eric Struyf, Tom Maris and Hans Backx have
been using the concept of ecosystem services in protecting biodiversity in wetlands and rivers in the Belgian Scheldt estuary and Nete catchment. Human activities have produced marked changes in geomorphology, hydrodynamics and hydrology, with a deepening of the water courses, reduction of the floodplain, increased tidal amplitude, lowering of the water table, marsh erosion, polder subsidence, loss of biodiversity, increased nitrogen output to the sea, etc. The authors have set up a restoration plan based on the quantification of ecosystem services, such as reduction of nutrient loads, flood control, prevention of algal blooms. This enabled them to estimate the areas needed for marshes, tidal flats, non-tidal wetlands. The plan, including tidal control, was approved by the Flemish government and is being implemented. The authors advocate the extension of their approach to whole basins, in compliance with the European Water Framework Directive.
Martin Hermy, Bart Muys, Kris Verheyen and Jos Van Orshoven discuss forests in
Flanders in a MA perspective. In this densely populated and highly industrialized region, the multifunctional aspect of forest management must be stressed and is indeed prescribed by the Flemish Bosdecreet of 1990. Forest area (11 % of total) has been stable in the last two centuries but it is very fragmented and its spatial distribution has changed, with a concentration on wet and sandy soils. The main services of forest ecosystems are the protection of biodiversity (e.g. bird populations, which have increased due to longer rotation times) and recreation, rather than wood production and hunting grounds or carbon storage.
A comprehensive overview of forestry in Wallonia is given by Jacques Rondeux. Forests
cover about one third of the land area and are expanding (plus 16 % in the last 50 years). There has been a large increase in conifer plantings which is now stopped, coppices have been replaced to a large extent by high forest stands, biomass by ha has gone up (net productivity exceeds harvesting). The primary service has been, and still is, wood production but, since the 1980’s, the multifunctional role of the forest has been recognized. A hierarchy of these functions (economical, ecological and social) must be set for each zone, rather than a specialization per zone. This is facilitated by the permanent regional forest inventory, which now includes data on biodiversity. The implementation of the European Natura 2000 Directive involves now 30 % of the forest area. The MA methodology is applicable, provided specific, and not global, models are used and appropriate criteria and indicators are agreed.
Marc Mormont’s paper is focussed on the ecosystemic evaluation approach for rural and
agricultural areas in a country like Belgium but it includes also general considerations on the MA. Three important features are discussed: the global evaluation of biodiversity, which
10
posits the existence of common interests in its protection; the anthropocentric character of ecosystem services, and the economic language used in this respect, even though there is no common instrument to compare the various types of service; the accent put on trade-offs rather than on rules and regulations.
With regard to agricultural systems in Belgium and in Europe in general, the global MA
analysis, as it was carried out, does not appear too useful. Rural systems here are complex and evolve less rapidly than in other parts of the world. Moreover there are already incentives and regulations to protect neighbouring ecosystems. However, the MA conceptual framework, applied at the right scale, could be put to good use, through re-examining the reference states for biodiversity in various environmental and agricultural policies and helping in the integrated implementation of these policies. It would also be useful in converting the European agricultural policy into a rural policy and in improving governance of the rural environment.
Magda Vincx, Sofie Derous and Steven Degraer discuss the coastal ecosystems of the
Belgian part of the North Sea (BPNS). These provide various services, some of which can be monetarised, others not: fishing, sand and gravel resources, bioremediation of waste and nutrient cycling, biologically mediated habitats, cognitive benefits, cultural heritage and recreational opportunities. Landings of cod, herring, sole and plaice have decreased over the years but serious attempts have been made to achieve sustainability, particularly for the demersal species (sole and plaice). In this respect, marine reserves proved to have beneficial effects, in addition to their main function of nature protection. The numerous shipwrecks of the area have created special biotopes of high biodiversity. Vincx and her team have produced a decision support system in the form of biological valuation maps for the whole BPNS.
In his presentation, Jurgen Tack attempts to list what was perceived as research needs for
Belgium and the EU in order to improve ecosystem assessments. They cover the whole gamut from ecosystem functions to impacts of ecosystem services on human well-being.
Emmanuël Sérusiaux, in his intervention in the panel reflects on the conditions of a
humanistic approach to conservation and development. One of the points he stresses is the fact that often the preservation of biodiversity will represent a cost. In the MA approach the flow of goods and services from ecosystems to the users are considered to be sustainable if they don’t compromise the renewal of the resources, but this approach does not guarantee that biodiversity would be maintained.
Marianne Schlesser, who was involved in the preparation of Belgium’s National
Biodiversity (NBS) Strategy, in application of the United Nations Convention on Biological Diversity, is showing that the ecosystem approach, taken from the MA, is used as one of the overarching principles which should guide the implementation of the NBS, while this Strategy is also referring to the classification of ecosystems services proposed by the MA, which in a way leads to a significant widening of the original biodiversity concept.
11
Conclusions The Conference provided a useful opportunity to discuss, in concrete terms, the
implications of the Millennium Ecosystem Assessment and how its results could be applied in Belgium.
In particular, the MA approach, by focusing on the contribution of ecosystems to human
well-being, may be considered as a useful aid in decision making in the context of sustainable development.
In general, the papers presented reveal that, even if the approach of treating
simultaneously the different ecosystem services, from purely economic functions to various ecological aspects, is well grounded in the research that was reported, more specific references to the concepts introduced by the MA are still not widespread.
Inasmuch as these concepts should be applied in future for specific ecosystems in the
Belgian context, the conference has also stressed the importance of such key points as interconnected scale questions and the relationship between the specific protection of biodiversity and economic exploitation.
The various contributions have also shown how the protection of ecosystems is interlinked
to existing local (or European) strategies and policies. In addition, they have brought out the significant influence of the MA for the recently approved National Strategy for the conservation of biodiversity.
It is hoped that specific MA-type projects may be carried out in Belgium in conjunction
with the EU- wide assessment prepared by the European Environment Agency for 2012 and that they will be supported by research funding authorities at federal and regional levels as well as through EU multi-partner projects.
Acknowledgements The organisers gratefully acknowledge the financial support of the Koninklijke Vlaamse
Academie van België, the Académie Royale de Belgique, the Université Libre de Bruxelles (Institut de Gestion et d’Aménagement du Territoire), and the substantial help in kind received on several occasions from the Royal National Institute of Natural Sciences. The panel session has generated rich and animated discussion thanks to Hans Bruyninckx Jacques de Gerlache, Rudy Herman, Gérard Jadoul, Roland Moreau, Emmanuel Sérusiaux and Rudi Verheyen, who presented and discussed their points of view, and to the expertise of Wim De Vos who has kindly accepted to prepare and chair this session. We are grateful to all of them. Céline Dessaucy has been involved in the practical organisation of the event, with Céline Curvers, who has also finalised the manuscript of these proceedings. Many thanks for these contributions.
12
The scientific committee of the Conference included the following colleagues which we also would like to thank for their involvement in the preparation of the event:
• Philippe Bourdeau (President, SCOPE National Committee, Université libre de Bruxelles)
• Luc Hens (Vrije Universiteit Brussel)
• Maurice Hoffmann (Instituut voor Natuur- en Bosonderzoek / Ghent University)
• Eric Lambin (Université Catholique de Louvain)
• Jean-Paul Malingreau (European Commission)
• Marianne Schlesser (Royal Belgian Institute of Natural Sciences / National Focal Point to the Convention on Biological Diversity)
• Emmanuël Sérusiaux (Université de Liège)
• Jean-Jacques Symoens (President, National Committee of Biological Sciences, Vrije Universiteit Brussel)
• Jurgen Tack (Instituut voor Natuur- en Bosonderzoek / Belgian Biodiversity Platform)
• Oscar Vanderborght (Vice-president, SCOPE National Committee, UA)
• Aline van der Werf (Belspo)
• Jackie Van Goethem (Royal Belgian Institute of Natural Sciences / National Focal Point to the Convention on Biological Diversity)
• Edwin Zaccaï (Université Libre de Bruxelles)
13
The Millennium Ecosystem Assessment and other global environmental assessments
Edwin Zaccaï
Université Libre de Bruxelles (ULB) Institut de Gestion de l'Environnement et d'Aménagement du Territoire (IGEAT)
In this introductory paper, we would like to address the following questions. First, how is the MA be seen in relation with the series of global environment assessment reports published in the last decades? Second, since a central aim of the conference was to consider its possible influence in a single country, namely Belgium, can one identify factors which may have an impact on the influence of such reports? Then, keeping in mind the interactions between the scientific and policy approaches, we try to sketch out some key features of the MA approach, and to introduce some elements on its actual impact.
1. Global environmental assessments Since environmental challenges were brought to the forefront in the late 1960’s, quite a
number of global assessments were published, some of which clearly influenced the representations of problems and solutions at the time. In a way, it might seem spurious to compare key global reports, as each one has to be understood within its own institutional and societal context. Some were launched as part of series, some others were more of the “one-off” type; some were backed and/or rooted in strong public networks of authorities and scientists whereas some others, while always based on sound scientific ground, were produced by specific stakeholders groups. Still, at a certain level, they all strived to deliver assessments that could be taken as references, and a perspective taken on their success in this respect might be instructive if we want to situate the MA and its possible influence.
In order to do this, we may look at five major reports covering the entire scope of current
global environmental concerns, and notice that, if they all stress the massive degradations inflicted to nature by man’s activities, they also differ in some of their characteristics.
Hardly any fundamental book that discusses the evolution of environmental policies fails to mention the importance of Limits to growth (Meadows et al., 1972), the report to the Club of Rome, which popularised the ideas of "overshooting and collapse", according to its repeated formula about the future of the Earth system. The report was translated in 29 languages, and 9 million copies were sold, mostly in industrial countries. As a matter of fact, the idea of a continuing era of growth similar to that which occurred after World War II, was definitely put into question in large segments of the industrial societies. As we will see later, this report has been strongly criticised for its weaknesses on data and its use of simple models, but it has to be understood within the context of its period. In fact, whilst the development of data on the state of the environment has been very impressive since the
14
early 70s, the information available at that time was much poorer, and the strong intuition to consider the planet as a single system, especially with regard to its natural resources and their use by humankind in a widely publicised report proved to be a very powerful innovation.
Fifteen years later, another bestseller of a different kind deeply contributed to re-thinking
the models of growth, by launching in an authoritative way a global project of sustainable development. The Brundtland Report (WCED, 1987), produced by the official, UN-entitled World Commission on Environment and Development, chaired by Gro Harlem Brundtland, was widely disseminated and discussed. It then paved the way for the UN conference on Environment and Development, held in Rio in 1992, a high stage of mobilisation in global politics, which generated itself countless assessments of the environmental problems of the world, as well as international conventions on the protection of climate and biodiversity.
These two reports are only two major steps in a series of global environmental
assessments which has not stopped, and on the contrary seems to accelerate. Clark et al. (2006: 5) list a dozen such reports, published between 2000 and 2003. Some consider the full scope of environmental change (UNEP, GEO-3, Global Environmental Report, 2002; World Resources Institute, World Resources Report, biannual). Most of them address broad environmental topics, such as those of the Intergovernmental Panel on Climate Change (IPCC), UNESCO (Water), FAO (Forests, dry lands, genetic resources), but in this paper we consider only those reports which cover the whole spectrum of environmental change, such as the MA.
GEO-3 (UNEP, 2002), which probably shares the most characteristics with the MA in this
group,coincided with the World Summit on Sustainable Development held in Johannesburg in 2002. Benefiting from the input of numerous experts, it was published by UNEP as the third in a series, and provided a detailed assessment of the state of the environment, on a broad continental basis. Its aim was to support policy changes, and it designed various scenarios, with an emphasis on major impacts on major basic needs (such as, for instance, food supply). For GEO-4 to be published in late 2007, the scenarios exercises – which are also a key feature of the IPCC reports on climate change – are undergoing some refinement (Gosh, 2006).
The reports on the Environmental Sustainability Index (ESI) YCELP and CIESIN (2005)
took quite a different approach. The first issue was published in 2001 by the Global Leaders for Tomorrow, Environment Task Force, in collaboration with the Yale Centre for Environmental Law and Policy (YCELP), Yale University, and the Centre for International Earth Science Information Network (CIESIN), Columbia University1. This major initiative was built on the growing importance of sustainability indicators in global policies (Hak et al., 2007). The ESI indicators, while considering various items of environmental state and pressure, did not neglect some key relations between the environment and basic needs (like the availability of drinking water, for example). On average, industrialised countries perform
1 In 2000 a pilot was launched. After 2001, new editions have been published, which can be found on the website www.ciesin.columbia.edu/indicators/ESI/. The recent edition of ESI is referred to, on this site (in Feb 2007), as an Initiative of the Yale Centre for Environmental Law and Policy (YCELP) and the Centre for International Earth Science Information Network (CIESIN) of Columbia University, in collaboration with the World Economic Forum and the Joint Research Centre of the European Commission.
15
better than southern countries for this Index. The publication of the first such report at the Davos Forum of Global leaders in January 2001 has not only provided a wide echo to it, but this economic forum was receptive to one of the key messages of ESI, i.e. that economic development may be reconciled with environmental sustainability, provided appropriate policies are implemented.
We may add that Belgium ranked very low in this survey because, inter alia, some of the
indicators were not adapted to small, very densely populated industrial countries and that some of the key data used were obsolete. In this case, as for other similar cases (Mexico, South Korea, United Arab Emirates) (YSELP and CIESIN, 2005, pp. 33-34), the influence of this report was undeniable, though it seems mainly to have fostered a better management, update and communication of environmental data on behalf of the authorities (Beco, 2006).
Using also an index allowing country benchmarking, and published since 1998, the Living
Planet Reports (LPR) (WWF, annual) of WWF deliver, however, somewhat different messages. This index, the ecological footprint, first used for a LPR in 2000, has met recently with a growing success. Its highly aggregated design attracts a great deal of scrutiny among academics and experts (Boisvert, 2005; Ledant, 2005), but its basic orientation stands in empathy with the growing perception within industrial societies that they are over-consuming natural resources, and the rest of the world cannot develop with a similar eco-bulimic appetite. Although they differ in some conclusions, the ESI and the Living Planet reports show similarities in several features: they both point out the environmental unsustainability of many countries, they are (like the Club of Rome reports before them) produced by/for non governmental institutions, and they provide the public not so much with global assessments as with technical indicators aiming at ranking countries, or other entities, on their environmental performance.
16
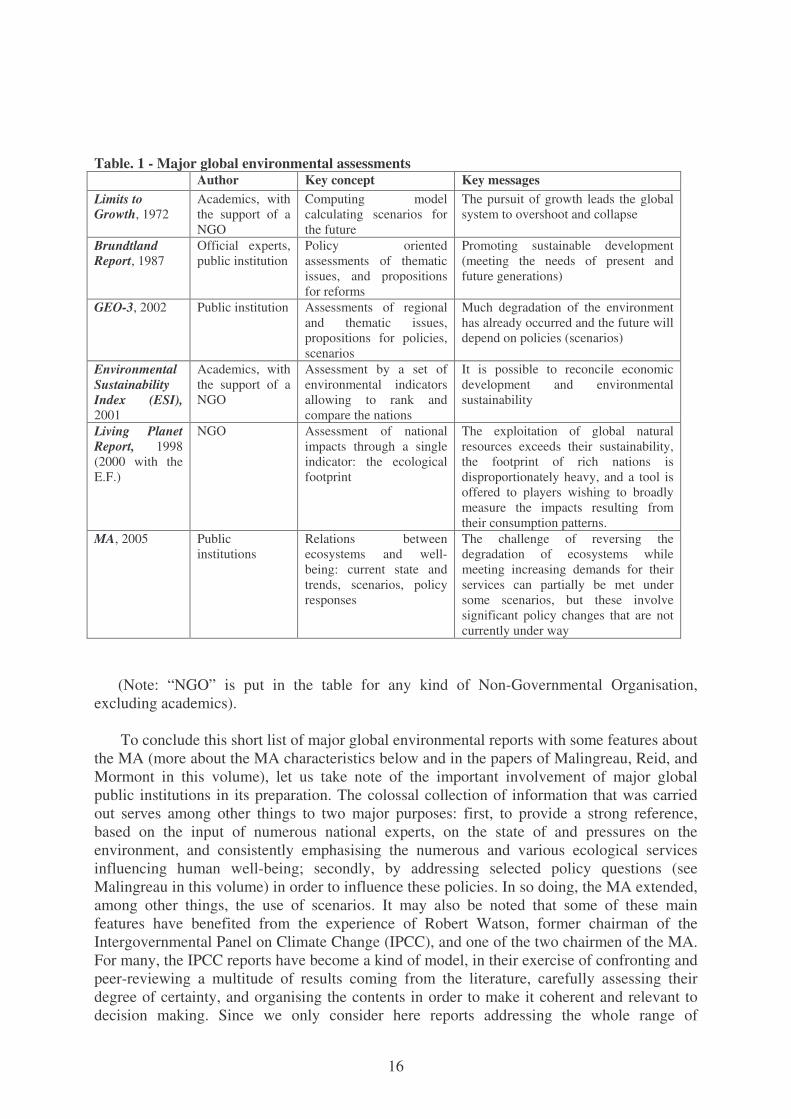
Table. 1 - Major global environmental assessments Author Key concept Key messages Limits to Growth, 1972
Academics, with the support of a NGO
Computing model calculating scenarios for the future
The pursuit of growth leads the global system to overshoot and collapse
Brundtland Report, 1987
Official experts, public institution
Policy oriented assessments of thematic issues, and propositions for reforms
Promoting sustainable development (meeting the needs of present and future generations)
GEO-3, 2002 Public institution Assessments of regional and thematic issues, propositions for policies, scenarios
Much degradation of the environment has already occurred and the future will depend on policies (scenarios)
Environmental Sustainability Index (ESI), 2001
Academics, with the support of a NGO
Assessment by a set of environmental indicators allowing to rank and compare the nations
It is possible to reconcile economic development and environmental sustainability
Living Planet Report, 1998 (2000 with the E.F.)
NGO Assessment of national impacts through a single indicator: the ecological footprint
The exploitation of global natural resources exceeds their sustainability, the footprint of rich nations is disproportionately heavy, and a tool is offered to players wishing to broadly measure the impacts resulting from their consumption patterns.
MA, 2005 Public institutions
Relations between ecosystems and well-being: current state and trends, scenarios, policy responses
The challenge of reversing the degradation of ecosystems while meeting increasing demands for their services can partially be met under some scenarios, but these involve significant policy changes that are not currently under way
(Note: “NGO” is put in the table for any kind of Non-Governmental Organisation,
excluding academics). To conclude this short list of major global environmental reports with some features about
the MA (more about the MA characteristics below and in the papers of Malingreau, Reid, and Mormont in this volume), let us take note of the important involvement of major global public institutions in its preparation. The colossal collection of information that was carried out serves among other things to two major purposes: first, to provide a strong reference, based on the input of numerous national experts, on the state of and pressures on the environment, and consistently emphasising the numerous and various ecological services influencing human well-being; secondly, by addressing selected policy questions (see Malingreau in this volume) in order to influence these policies. In so doing, the MA extended, among other things, the use of scenarios. It may also be noted that some of these main features have benefited from the experience of Robert Watson, former chairman of the Intergovernmental Panel on Climate Change (IPCC), and one of the two chairmen of the MA. For many, the IPCC reports have become a kind of model, in their exercise of confronting and peer-reviewing a multitude of results coming from the literature, carefully assessing their degree of certainty, and organising the contents in order to make it coherent and relevant to decision making. Since we only consider here reports addressing the whole range of
17
environmental change, no further comment will be made on the IPCC reports. One might guess that the undertaking would be more difficult in the former case than in the latter, though even if a report is focussed on climate change, it must also address a wide range of ecological issues and disciplines.
2. Factors affecting the influence of assessments In their attempt to evaluate the influence of global environmental assessments, Clark et
al. (2006) have presented several conclusions and recommendations. We will apply here some of their findings as interpretative tools to analyse the success of the reports listed above, and especially the variation in three of their attributes: salience, credibility and legitimacy.2
Salience addresses the perception that the users have of the importance, the relevance, or
the usefulness of the report. In the shortlist that we used, at least two major tools seem to be used to foster saliency. These are first, the indicators, with their ability to summarise information, to make it comparable, etc (especially for the ESI and LPR reports), and second the scenarios, especially for the reports of UN-institutions, in the context of major policy orientations, (GEO, MA, and also the orientation of the Millennium Development Goals3 in which 10 or 20-year time objectives are essential). Exploring possibilities of long-term sustainable development scenarios for a Belgian public institution, a recent research has underlined the qualities of integrative views and dealing with uncertainties in separate domains that prospective exercise may bring for decision makers (Mutombo et al., 2007).
Credibility is a matter more frequently dealt with in scientific works. It increases by
"careful attention to issues involving data reliability, methods used, the validity of inferential claims, identification of pitfalls and rival hypotheses, and independent peer review" (Clark et al., 2006: 15). It is in the UN-institutions reports, using networks of hundreds of experts, that most efforts are spent to fulfil this type of conditions. Among the different works listed above, the most contested in this respect has probably been the model of Limits to Growth. V. Smil, who has very interestingly analysed forecast exercises of the past in the energy field (Smil, 2003) expresses many criticisms on "modelling the world’s fate in a few hundred lines of software", (Smil, 2005).
On legitimacy, Clark et al. write: "scientific information must overcome distrust from
those who suspect experts of using information to lead them to adopt behaviours that serve the self-interests of those experts or those to whom they answer" (2006: 15). This kind of critique will apply more frequently to works published by or for non-governmental organizations (in our list, the Club or Rome, the WWF, the WEF), even though the approaches adopted in any report are dependent of hypotheses and in the long-run of some values. For instance, the ecosystem services approach used in the MA may be criticised by conservation biologists (see Sérusiaux in this report), a position similar to that found in the biological community reluctant
2 For a discussion of this model, and its applicability to sustainable development indicators, see Bauler (2007). 3 Adopted by the UN General Assembly in 2000, these human objectives, aimed at relieving from poverty and satisfying basic needs, have become since the major reference for international development policy, in the United Nations Development Program (UNDP), and more widely, as in the MA.
18
towards sustainable development, and for the same sort of reasons (Newton and Freyfogle, 2005) (fear of trade-offs in favour of economical values at the expense of biological, non economic values).
Although saliency, credibility and legitimacy, are recognised as positive factors to foster
the influence of reports, it should not be concluded therefore that all three should be present each time at a high degree. For instance, Smil himself notes about Limits to Growth that "Undoubtedly, the report’s appearance was perfectly timed as the ground for its acceptance was prepared by the culmination of new-found environmental concerns (the first Earth Day took place in 1970, the UN’s first Conference on the Human Environment two years later) and as some of its conclusions seemed to be turning into realities shortly after its publication (OPEC-driven crude oil price increases, beginning in 1973, appeared to confirm one of the report’s key tenets (…))" (2005). We could speak here of saliency, in the form of a coincidence with preoccupations in the society. This might also be the case with the ecological footprint approach which benefits, at the present time, from being in phase with the unmet need of measuring the excess of our impacts on the Earth. Even if this composite index suffers from many shortcomings in the eye of experts, it proved to be popular in some fringes of the population which use it in raising personal concern and even in orientating some choices of consumption.
Clark et al. (2006: 19) underline also that "assessments vary in the type of influence that
they have, not just the amount of their influence" and that "assessment influence varies significantly across different audiences and or potential users groups". Among the few examples cited above, it is noteworthy that books such as Limits to Growth or the Brundtland Report have marked their time with fundamental ideas (some would say "paradigms"), while exercises such as the ESI or the Living Planet Reports, essentially give indicators to monitor a country performance. The MA, with its complex frameworks of analyses, will most probably be more influential among academics than a single aggregative instrument aimed primarily at wide awareness raising, such as the ecological footprint, but its main audience is probably to be found among international agencies and public institutions. A report on the MA impact, one year after launching, reveals its significant impact on some of these institutions, and on international conventions (see Reid in this volume).
To end up with some findings of Clark et al. (2006) let us introduce a series of
considerations about the process of assessment. Five "lessons" are indeed proposed to foster the influence of Global Environmental Assessment, in which this process – opposed to the "result" – is seminal: "Focus on the process, not the report. Focus on salience and legitimacy as well as credibility. Assess with multiple audiences in mind. Involve stakeholders and connect with existing networks. Develop influence over time" (2006: 20). Even if their authors had not read these lessons, we would certainly find numerous applications of them in the success stories of the reports listed above. We can also apply them also in our particular context, and that is to analyse the objectives and design of the conference organised on the MA in Brussels (though we had not read yet the analysis reported above), to which we come in the next session.
19
3. Belgium, the MA and its influence It is indeed time to enter now a bit more into the approach that we have set up for this
conference which was meant, first of all, to discuss the influence (actual, potential and future) of the MA in Belgium.
"Involve the stakeholders" is one of the guidelines appearing above. The conference has
indeed invited some of their representatives (mostly in academic circles), in the Belgian context, to involve themselves by asking them to read, comment the report, and discuss its relevance for their specific field. By so doing, by the way, they might also contribute to its "salience, credibility and legitimacy".
"Multiple audiences": here again, checking the applications of the MA approach at a
national scale, the conference could perhaps contribute to its notoriety. Although there are numerous examples in the MA itself of regional or local results, it is mostly considered as a global report, and Clark et al. observe on other examples that "the attributions of salience, credibility, and legitimacy have particular difficulty traversing from global to local scale" (2006: 20).
To help this process "connect with existing networks", another "lesson" mentioned above,
may be of interest. The conference was convened by two standing academic networks in environmental sciences, and it is by no means coincidental that some speakers are among the few Belgian authors involved in MA, allowing thus a connection with existing MA networks.
Though several factors said to underpin the influence of a global report were in some way
present, our objective was not so much to boost the influence of the report, than to make it known in order to allow a discussion of its results and their relevance for the work of academics and other stakeholders. Moreover, we also had the impression (and the future will tell if we were right), that the MA will probably "develop its influence" (to cite a last time one of the "lessons") during the coming years in the relevant research community.
Three lines of arguments makes us inclined to do so: the overall influence that policy
approaches and choices have on scientific work; the influence of global approaches on national approaches in the context of sustainable development (which seems to be confirmed by the launching of a series of works directly referred to the MA, see Reid in this volume); the hypothesis that some key-features of MA are concordant with contemporary needs for the assessment of the relations between ecology and development.
First, the overall influence of policy approaches, values, questions, and even preferences
or preconceptions on scientific work will hardly be a surprise for a reader of the 21st century, after decades of social studies of sciences (Pestre, 2006) which produced numerous analyses in this respect, revealing both theoretically and empirically the permeability of these spheres, in contrast with the "island-state" vision of scientific work, popular in the first half of the 20st century and before. Though extensive theoretical and field research, T. Forsyth (2003) has detailed the very large extent to which concepts used in environmental science are connected to policy assumptions. He points out how some of these influences may sometimes lead to
20
counterproductive approaches in environmental management (especially in Southern countries, where the practical approaches of native populations were overlooked by some ecologically- minded approaches). Another, much more contested, case abundantly showing how the use of scientific assessment can be closely interlinked to policy judgements can be found in the book of B. Lomborg (2001), and the many analyses it has provoked (see Zaccaï, Goor and Kestemont, 2004). By carefully selecting approaches and data, this work has been entirely set up in order to advocate that a business-as-usual approach would be, in the author’s view, the best attitude to adopt towards global “over-estimated” environmental problems. Environmental assessments and policy options do indeed have connections, and within the orientations of scientific programs and work, major reports like the MA could certainly exert an influence.
Actually, scientific research is certainly influenced by the design of financing programs,
which in turn are endorsed by institutions, even if scientists do participate in their formulations. As W. Reid, the MA director, puts it for this report (2005: 21): "Science assessments are not undertaken with a research audience in mind, but effective assessments inevitably influence scientific research for a number of reasons. First, they help to identify important research and information gaps, particularly those most relevant to decision-makers. Second, they influence priorities of research funders. Third, they create opportunities for new interdisciplinary interactions and these often stimulate new collaborative research".
Secondly, concerning the influence of studies at global level, the approaches to
sustainable development, like other activities in our globally-driven contemporary world, are most evidently determined by a global, and even in many important cases, a UN-approach. The definition of sustainable development, its most important principles, some of its keywords (Agenda 21), or of its main national policy guidelines (to establish sustainable development strategies, to use indicators), found their origin at this level. In climate change issues, as well as in biodiversity, or development goals, the global level sets the tune. As mentioned earlier some reports are more influential than others. In this respect the MA seems to prove its productivity, if we look at some exercises that it already inspired since its publication in 2005 (see Reid, already cited). More generally, recent surveys of scientific papers seem to confirm the fast growing use of the concept of "ecosystem services" (Costanza, 2006).
The third kind of factors which tend to enhance the potential influence of the MA are
more hypothetical. This has to do with the fact that the MA was the first global assessment to appear (in 2005) after its most closely related type of assessment, the 2002 GEO-3 report and thus satisfied a hunger for fresh information on the environment. Moreover, it was endorsed not only by UNEP but by other major international institutions, and its budget and the amount of its findings were higher than for GEO-3. It was presented as a "unique" undertaking (labelled as "Millennium"). It will be interesting to see how GEO-4, to be published in 2007, will affect the influence of the MA.
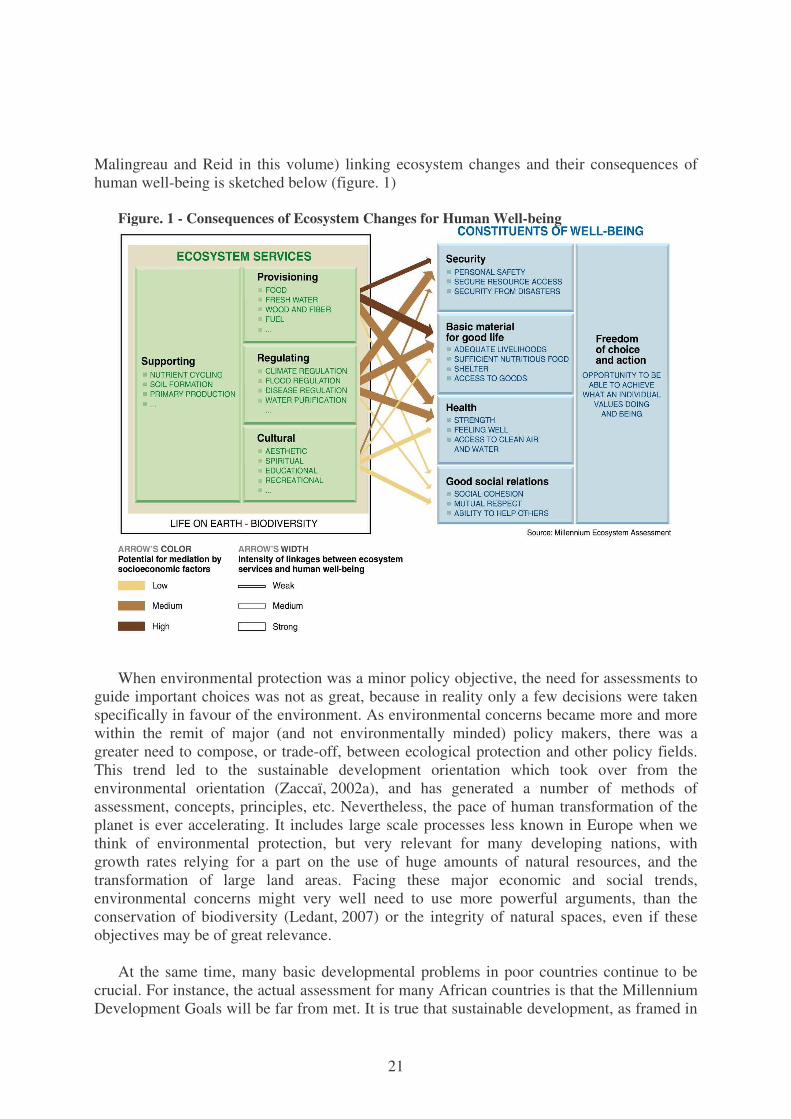
More importantly, we formulate the hypothesis that the MA framework, linking
ecosystem services to human well-being, has become more necessary in orienting the choices of measures and policies to protect the environment. The overall framework (see also
21
Malingreau and Reid in this volume) linking ecosystem changes and their consequences of human well-being is sketched below (figure. 1)
Figure. 1 - Consequences of Ecosystem Changes for Human Well-being
When environmental protection was a minor policy objective, the need for assessments to
guide important choices was not as great, because in reality only a few decisions were taken specifically in favour of the environment. As environmental concerns became more and more within the remit of major (and not environmentally minded) policy makers, there was a greater need to compose, or trade-off, between ecological protection and other policy fields. This trend led to the sustainable development orientation which took over from the environmental orientation (Zaccaï, 2002a), and has generated a number of methods of assessment, concepts, principles, etc. Nevertheless, the pace of human transformation of the planet is ever accelerating. It includes large scale processes less known in Europe when we think of environmental protection, but very relevant for many developing nations, with growth rates relying for a part on the use of huge amounts of natural resources, and the transformation of large land areas. Facing these major economic and social trends, environmental concerns might very well need to use more powerful arguments, than the conservation of biodiversity (Ledant, 2007) or the integrity of natural spaces, even if these objectives may be of great relevance.
At the same time, many basic developmental problems in poor countries continue to be
crucial. For instance, the actual assessment for many African countries is that the Millennium Development Goals will be far from met. It is true that sustainable development, as framed in
22
the Brundtland Report and in Rio, has introduced concern for some social basic needs preoccupation within its scope, but still, as W.M. Adams puts it "In this view, the chief issue of sustainable development is seen to be the global environment, and particularly problems of biodiversity depletion and climate change, rather than global poverty or North-South inequality" (2001: 103). When the MA puts human well-being as the fundamental measure of its assessment, it accomplishes one more step towards an anthropocentric approach to environmental protection, a direction already taken by sustainable development, as shown demonstratively in the first sentence of the first Principle of the Rio Declaration (Human beings are at the centre of concerns for sustainable development.) The arguments of this further move, beside the evident importance of meeting basic needs, are linked to those already widely used in the field of environmental economics, which take human well-being, with specific approaches, as a key concept for assessing measures and policies. And that is entering in the language of social policy and decision, fundamentally anthropocentric, and also very sensitive to economical "values".
4. Pointing possible limitations for the MA Though it would be beyond the scope of this paper to really point out some of the possible
shortcomings of the MA, and we would rather refer to the presentation of its framework (see Malingreau in this volume) and to detailed findings in the different contributions, we would like now to briefly comment on three peculiar topics of further investigation in this regard: the discussion about possible biases in favour of an economicist approach; the orientations taken about the situation in developing countries; the unequal participation of regional experts in the MA works.
The focus on ecological services is often associated in the report with economic valuation.
There are several possible approaches in order to quantify these monetary amounts, and all of them can be discussed. In general, they are very sensitive to contexts, and their juxtaposition to economic values coming from the market (which are also sensitive to contexts) often may overlook the fact that these various "prices" are built on very different bases.
Another criticism of this valuation has been introduced above, by pointing at the
reluctance that traditional approaches to conservation might express towards a dominant use of economically based decisions, be it ecologically corrected (see Sérusiaux in this volume). Though this topic has to be analysed within different cases, it should be reminded here that, in spite of its extended use of economic valuation of ecosystems services, the MA has no intention to take these evaluations as the one and only indicator for their possible protection. Issues like intrinsic, cultural or traditional values of ecosystems are also taken into account in many cases.
Regarding developing countries, the reader of the MA understands very soon that the
general approach is putting an important emphasis on their situation. Issues like the "alleviation of poverty" for instance are integrated in the very way some key questions are asked. Many problems related to basic needs such as drinking water, sanitation capacities, the relations of the Millennium Development Goals with the future of ecosystems, and more generally "poor people dependent from ecosystems services", a situation that is much more
23
common in poor than in rich countries, receive an extended coverage in the reports. This being so, to further assess the relevance of the MA approach to Belgium or other highly industrialised countries, one has to consider carefully some of the concepts and approaches that have been developed (see Mormont in this volume).
Returning to the assessment of the situation within developing countries themselves, the
MA experts have conducted a number of participative exercises, some with non scientific participants or indigenous people. These advancements can certainly give more credibility to the central issue of human well-being assessment, taking into account the irreplaceable perception and knowledge of these people. They may thus partially respond to the criticism voiced by T. Forsyth cited above, regarding some biases in environmental science approaches to Southern contexts, though the same author points out the difficulty of such participative assessments in order to really modify expert instituted policy options, with a call to further "democratizing science and networks" (2003: 231-265).
Finally let us briefly note that the geographical distribution of participating experts was
very unbalanced, which was also true for local assessments. In the latter case, European countries were poorly represented. This has to be taken into account in further work on the MA.
References
Adams, W.M. 2001. Green development. Environment and sustainability in the Third
World. –Routledge, London. Bauler, T. 2007. Indicators for sustainable development: A discussion of their usability, PhD
thesis. –Université Libre de Bruxelles, IGEAT, Brussels. Beco, M. 2006. L’expertise comme influence: impact de systèmes d’indicateurs
environnementaux sur la prise de décision en Belgique en matière d’environnement. Master Thesis.-Université Libre de Bruxelles, IGEAT, Brussels.
Boisvert, V. 2005. L’empreinte écologique: un indicateur de développement durable? In: Maréchal J-P., Le développement durable. Une perspective pour le XXIème siècle.-Presses Universitaires de Rennes, pp. 165-183.
Clark, W.C., Mitchell, R.B. and Cash, D.W. 2006. Evaluating the Influence of Global Environmental Assessments. In: R.B. Mitchell, W.C. Clark and N.M. Dickson (Eds.), Global Environmental Assessments: Information and Influence.-MIT Press, Cambridge USA.
Costanza, R. 2006. The value of hurricane protection functions and other ecosystem services in coastal Louisiana: A post-Katrina analysis. Presentation at the Ninth Biennial Conference of the International Society for Ecological Economics (ISEE).-Delhi
Forsyth, T. 2003. Critical Political Ecology. -Routledge, London. Global Leaders for Tomorrow, Environment Task Force, in collaboration with: Yale Center
for Environmental Law and Policy (YCELP) Yale University and the Centre for MIT Press, International Earth Science Information Network (CIESIN), Columbia University. 2001. 2001 Environmental Sustainability Index. http://sedac.ciesin.columbia.edu/es/esi/
Gosh, N. 2006. A methodological framework of scenarios development: some reflections from the Global Environmental Outlook experiences. Presentation at the Ninth Biennial Conference of the International Society for Ecological Economics (ISEE).-Delhi
24
Hak, T., Moldan, B. and Dahl, A.L. 2007. Sustainability indicators: a scientific assessment (SCOPE).- Island press, Washington D.C.
Ledant, J-P. 2005. L’empreinte écologique: un indicateur de quoi? -Institut pour un Développement Durable, http://www.iddweb.eu/ (IDD/J-P.L. 30/12/2005).
Ledant, J-P. 2007. Faut-il vraiment maximaliser la biodiversité? -Institut pour un Développement Durable, http://www.iddweb.eu/ (Analyses, July 2007).
Lomborg, B. 2001. The Skeptical Environmentalist. -Cambridge University Press, Cambridge.
Meadows, D.H., Meadows, D.L., Randers, J. and Behrens III W.H. 1972. The Limits to Growth (Report to the Club of Rome).-Universe Books, New York.
Mutombo, E., Bauler, T. and Wallenborn, G. 2006. Méthodes participatives de prospective et de planification pour un développement durable. Analyse d'approches et de réalisations. Report for the Belgian Federal Public Service for Sustainable Development.-Université Libre de Bruxelles, Brussels. www.ulb.ac.be/igeat/cedd
Newton, J.L. and Freyfogle, E.T. 2005. Sustainability: a Dissent-Conservation Biology, 19, 1: 23-32.
Pestre, D. 2006. Introduction aux Science studies.-La Découverte, Paris. Reid, W. 2006. Millennium Ecosystem Assessment. Survey of initial impacts.
www.millenniumassessment.org/documents/Document.798.aspx.pdf Smil, V. 2005. Limits to Growth revisited: A Review Essay.-Population and Development
Review 31(1) (March 2005): 157-164. Smil, V. 2003. Energy at the crossroads. -MIT Press, Cambridge, USA. United Nations Environment Program (UNEP) 2002. Global Environment Outlook 3, GEO-3-
Earthprint.com. WCED. 1987. Our common future (The Brundtland Report).-Oxford University Press,
Oxford. WWF. Living Planet Report, annual, since 1998.
http://www.panda.org/news_facts/publications/living_planet_report/index.cfm YCELP and CIESIN in collaboration with the World Economic Forum and the JRC of the
EC. 2005. 2005 Environmental Sustainability Index. http://www.yale.edu/esi/ESI2005_Main_Report.pdf
Zaccaï, E. 2002a. Le développement durable. Dynamique et constitution d’un projet. -Peter Lang, Bern-Brussels.
Zaccaï, E. 2002b. De quelques visions mondiales des limites de l’environnement.-Développement durable & Territoires, Dossier 1, http://revue-ddt.org/
Zaccaï, E., Goor, F. and Kestemont, B. 2004. Quelle importance à l'environnement? Enseignements du cas. Lomborg.-Natures, Sciences, Sociétés, 12: 42-49.
25
The Millennium Ecosystem Assessment: Overview of Findings
Walter V. Reid
The David and Lucile Packard Foundation Director, Conservation and Science Program
Los Altos, California [email protected]
Introduction1 The Millennium Ecosystem Assessment (MA) was carried out between 2001 and 2005 to
assess the consequences of ecosystem change for human well-being and to establish the scientific basis for actions needed to enhance the conservation and sustainable use of ecosystems and their contributions to human well-being. The MA was called for by United Nations Secretary-General Kofi Annan in 2000 in his report to the UN General Assembly, We the Peoples: The Role of the United Nations in the 21st Century (Annan, 2000). The assessment responded to government requests for information received through four international conventions—the Convention on Biological Diversity (CBD), the United Nations Convention to Combat Desertification (CCD), the Ramsar Convention on Wetlands, and the Convention on Migratory Species—and was designed to also meet needs of other stakeholders, including the business community, the health sector, nongovernmental organizations, and indigenous peoples. The MA was conducted under the auspices of the United Nations, with the secretariat coordinated by the United Nations Environment Programme. It was governed by a multistakeholder board that included representatives of international institutions, governments, business, NGOs, and indigenous peoples.
The MA was established in response to demands from both policymakers and scientists
for an authoritative assessment of the state of world’s ecosystems and of the consequences of ecosystem change for human well-being. By the mid-1990s, many individuals involved in the work of international conventions such as the CBD and CCD had come to realize that the extensive needs for scientific assessments within the conventions were not being met through the mechanisms then in place. In contrast, other international environmental conventions such as the Framework Convention on Climate Change and the Vienna Convention on Substances that Deplete the Ozone did have effective assessment mechanisms – the Intergovernmental Panel on Climate Change (IPCC), and the Ozone Assessment, respectively – that were proving to be important assets to these treaties.
The scientific community was also encouraging the establishment of an IPCC-like process
to establish scientific consensus on issues related to biodiversity and ecosystems in the belief
1 This overview is adapted from: Millennium Ecosystem Assessment (MA), 2005, Millennium Ecosystem Assessment Synthesis. Island Press, Washington D.C.
26
that the urgency of the problem of ecosystem degradation demanded such an assessment. The major advances that had been made in ecological sciences, resource economics and other fields during the 1980s and 1990s, were poorly reflected in policy discussions concerning ecosystems (Reid, 2000, Ayensu et al., 2000). Moreover, the scientific community was concerned that existing sectoral assessments (focused on climate, ozone, forests, agriculture, etc.) were insufficient to address the interlinkages among different environmental problems and among their solutions (Watson et al., 1998).
When the idea for the MA first arose in early 1988, it could have been accurately
described to be an “IPCC for Ecosystems and Human Well-being.” The assessment that was finally launched in 2001, however, differed in several important ways from the IPCC, in particular in relation to scale and knowledge systems. First, the MA was a multi-scale assessment; that is, it included analysis at various levels of organization from the local to national to international. By contrast, the IPCC is a global assessment, although it increasingly includes regional analyses. In addition to the global component, the MA included 33 sub-global assessments carried out at the scale of individual communities, watersheds, countries, and regions. The sub-global assessments were not intended to serve as representative samples of all ecosystems; rather, they were designed to meet the needs of decision-makers at the scales at which they were undertaken. At the same time, it was anticipated that the global assessment could be informed by findings of the sub-global assessments and vice versa.
Second, the MA included a mechanism allowing use of both published scientific
information and traditional, indigenous, and practitioner’s knowledge, while the IPCC uses only published scientific information. A significant amount of local and traditional knowledge was incorporated into many of the local MA sub-global assessments using this mechanism. While the mechanism allowed, in principle, for local, traditional and practitioner’s knowledge to also be incorporated into the global assessment products, this was quite rare in practice and only occurred to any significant extent in the global report prepared by the MA Sub-global Working Group.
Overview of Findings The assessment produced a conceptual framework report (MA, 2003), four technical
volumes including summaries for decision-makers (MA, 2005 a, b, c, d) and six synthesis reports for ease of use by specific audiences: general synthesis (MA, 2005e), biodiversity synthesis, desertification synthesis, wetlands synthesis, business and industry synthesis, and health synthesis (available at http://www.MAweb.org). In addition, the MA has released an edited volume of papers exploring the challenges of bridging scales and knowledge systems in integrated assessments (Reid et al., 2007). The following are the four core findings of the assessment, as detailed in the synthesis report (MA, 2005e).
27
Over the past 50 years, humans have changed ecosystems more rapidly and extensively than in any comparable period of time in human history, largely to meet rapidly growing demands for food, fresh water, timber, fiber and fuel. This has resulted in a substantial and largely irreversible loss in the diversity of life on Earth.
Everyone in the world depends completely on Earth’s ecosystems and the services they
provide, such as food, water, disease management, climate regulation, spiritual fulfilment, and aesthetic enjoyment. Over the past 50 years, humans have changed these ecosystems more rapidly and extensively than in any comparable period of time in human history. For example, more land was converted to cropland in the thirty years after 1950 than in the eighteenth and nineteenth centuries combined. More than two thirds of the area of 2 of the world’s 14 major terrestrial biomes and more than half of the area of 4 other biomes had been converted by 1990, primarily to agriculture. Over the past few hundred years, humans have increased the species extinction rate by as much as 1000 times over background rates typical over the planet’s history (medium certainty). Some 10–30 % of mammal, bird, and amphibian species are currently threatened with extinction (medium to high certainty). Freshwater ecosystems tend to have the highest proportion of species threatened with extinction.
Most changes to ecosystems have been made to meet a dramatic growth in the demand for
food, water, timber, fiber, and fuel. Some ecosystem changes have been the inadvertent result of activities unrelated to the use of ecosystem services, such as the construction of roads, ports, and cities and the discharge of pollutants. But most ecosystem changes were the direct or indirect result of changes made to meet growing demands for ecosystem services, and in particular growing demands for food, water, timber, fiber, and fuel (fuelwood and hydropower). Between 1960 and 2000, the demand for ecosystem services grew significantly as world population doubled to 6 billion people and the global economy increased more than sixfold. To meet this demand, food production increased by roughly two-and-a-half times, water use doubled, wood harvests for pulp and paper production tripled, installed hydropower capacity doubled, and timber production increased by more than half.
1. The changes that have been made to ecosystems have contributed to substantial net
gains in human well-being and economic development, but these gains have been achieved at growing costs in the form of the degradation of many ecosystem services, increased risks of nonlinear changes, and the exacerbation of poverty for some groups of people. These problems, unless addressed, will substantially diminish the benefits that future generations obtain from ecosystems. In the aggregate, and for most countries, changes made to the world’s ecosystems in
recent decades have provided substantial benefits for human well-being and national development. Many of the most significant changes to ecosystems have been essential to meet growing needs for food and water; these changes have helped reduce the proportion of malnourished people and improved human health. Agriculture, including fisheries and forestry, has been the mainstay of strategies for the development of countries for centuries, providing revenues that have enabled investments in industrialization and poverty alleviation. Although the value of food production in 2000 was only about 3 % of gross world product, the agricultural labor force accounts for approximately 22 % of the world’s population, half the world’s total labor force, and 24 % of GDP in countries with per capita incomes of less
28
than $ 765 (the low-income developing countries, as defined by the World Bank). This transformation of the planet has contributed to substantial net gains in human well-being and economic development. But not all regions and groups of people have benefited from this process—in fact, many have been harmed. Moreover, the full costs associated with these gains are only now becoming apparent.
Three major problems associated with our management of the world’s ecosystems are
already causing significant harm to some people, particularly the poor, and unless addressed will substantially diminish the long-term benefits we obtain from ecosystems:
• First, approximately 60 % (15 out of 24) of the ecosystem services examined during the Millennium Ecosystem Assessment are being degraded or used unsustainably, including fresh water, capture fisheries, air and water purification, and the regulation of regional and local climate, natural hazards, and pests. The full costs of the loss and degradation of these ecosystem services are difficult to measure, but the available evidence demonstrates that they are substantial and growing. Many ecosystem services have been degraded as a consequence of actions taken to increase the supply of other services, such as food. These trade-offs often shift the costs of degradation from one group of people to another or defer costs to future generations.
The degradation of ecosystem services often causes significant harm to human well-being:
o Most resource management decisions are most strongly influenced by ecosystem services entering markets; as a result, the nonmarketed benefits are often lost or degraded. These nonmarketed benefits are often high and sometimes more valuable than the marketed ones. For example, one of the most comprehensive studies to date, which examined the marketed and nonmarketed economic values associated with forests in eight Mediterranean countries, found that timber and fuelwood generally accounted for less than a third of total economic value of forests in each country. Values associated with non-timber forest products, recreation, hunting, watershed protection, carbon sequestration, and passive use (values independent of direct uses) accounted for between 25 % and 96 % of the total economic value of the forests.
o The total economic value associated with managing ecosystems more sustainably is often higher than the value associated with the conversion of the ecosystem through farming, clear-cut logging, or other intensive uses. Relatively few studies have compared the total economic value (including values of both marketed and nonmarketed ecosystem services) of ecosystems under alternate management regimes, but some of the studies that do exist have found that the benefit of managing the ecosystem more sustainably exceeded that of converting the ecosystem.
o The economic and public health costs associated with damage to ecosystem services can be substantial. For example, the early 1990s collapse of the Newfoundland cod fishery due to overfishing resulted in the loss of tens of thousands of jobs and cost at least $ 2 billion in income support and retraining. Similarly, in 1996, the cost of UK agriculture resulting from the damage that agricultural practices cause to water (pollution and eutrophication, a process whereby excessive plant growth depletes oxygen in the water), air (emissions of greenhouse gases), soil (off-site erosion damage, emissions of greenhouse gases)
29
and biodiversity was $ 2.6 billion, or 9 % of average yearly gross farm receipts for the 1990s.
• Second, there is established but incomplete evidence that changes being made in ecosystems are increasing the likelihood of nonlinear changes in ecosystems (including accelerating, abrupt, and potentially irreversible changes) that have important consequences for human well-being. Examples of such changes include disease emergence, abrupt alterations in water quality, the creation of “dead zones” in coastal waters, the collapse of fisheries, and shifts in regional climate.
• Third, the harmful effects of the degradation of ecosystem services (the persistent decrease in the capacity of an ecosystem to deliver services) are being borne disproportionately by the poor, are contributing to growing inequities and disparities across groups of people, and are sometimes the principal factor causing poverty and social conflict. This is not to say that ecosystem changes such as increased food production have not also helped to lift many people out of poverty or hunger, but these changes have harmed other individuals and communities, and their plight has been largely overlooked. In all regions and particularly in sub-Saharan Africa, the condition and management of ecosystem services is a dominant factor influencing prospects for reducing poverty.
2. The degradation of ecosystem services could grow significantly worse during the first
half of this century and is a barrier to achieving the Millennium Development Goals. The MA developed four scenarios to explore plausible futures for ecosystems and human
well-being. The scenarios explored two global development paths, one in which the world becomes increasingly globalized and the other in which it becomes increasingly regionalized, as well as two different approaches to ecosystem management, one in which actions are reactive and most problems are addressed only after they become obvious and the other in which ecosystem management is proactive and policies deliberately seek to maintain ecosystem services for the long term.
Most of the direct drivers of change in ecosystems currently remain constant or are
growing in intensity in most ecosystems. In all four MA scenarios, the pressures on ecosystems are projected to continue to grow during the first half of this century. The most important direct drivers of change in ecosystems are:
• Habitat transformation, particularly from conversion to agriculture: Under the MA scenarios, a further 10–20 % of grassland and forestland is projected to be converted between 2000 and 2050 (primarily to agriculture). The projected land conversion is concentrated in low-income countries and dryland regions. Forest cover is projected to continue to increase within industrial countries.
• Overexploitation, especially overfishing: In some marine systems fish biomass targeted in fisheries (including that of both the target species and those caught incidentally) has been reduced by 90–99 % from preindustrial fishing levels, and the fish being harvested are increasingly coming from the less valuable lower trophic levels as populations of higher trophic level species are depleted. These pressures continue to grow in all the MA scenarios.
• Invasive alien species: The spread of invasive alien species and disease organisms continues to increase because of both deliberate translocations and accidental
30
introductions related to growing trade and travel, with significant harmful consequences to native species and many ecosystem services.
• Pollution, particularly nutrient loading: Humans have already doubled the flow of reactive nitrogen on the continents, and some projections suggest that this may increase by roughly a further two thirds by 2050. Three out of four MA scenarios project that the global flux of nitrogen to coastal ecosystems will increase by a further 10–20 % by 2030 (medium certainty), with almost all of this increase occurring in developing countries.
• Anthropogenic Climate Change: Observed recent changes in climate, especially warmer regional temperatures, have already had significant impacts on biodiversity and ecosystems, including causing changes in species distributions, population sizes, the timing of reproduction or migration events, and an increase in the frequency of pest and disease outbreaks. Many coral reefs have undergone major, although often partially reversible, bleaching episodes when local sea surface temperatures have increased during one month by 0.5–1oCelsius above the average of the hottest months. By the end of the century, climate change and its impacts may be the dominant direct driver of biodiversity loss and changes in ecosystem services globally. The balance of scientific evidence suggests that there will be a significant net harmful impact on ecosystem services worldwide if global mean surface temperature increases more than 2oCelsius above preindustrial levels or at rates greater than 0.2oCelsius per decade (medium certainty). There is a wide band of uncertainty in the amount of warming that would result from any stabilized greenhouse gas concentration, but based on IPCC projections this would require an eventual CO2 stabilization level of less than 450 parts per million carbon dioxide (medium certainty).
Under all four MA scenarios, the projected changes in drivers result in significant growth
in consumption of ecosystem services, continued loss of biodiversity, and further degradation of some ecosystem services. During the next 50 years, demand for food crops is projected to grow by 70–85 % under the MA scenarios, and demand for water by between 30 % and 85 %. Water withdrawals in developing countries are projected to increase significantly under the scenarios, although these are projected to decline in industrial countries (medium certainty). Food security is not achieved under the MA scenarios by 2050, and child malnutrition is not eradicated (and is projected to increase in some regions in some MA scenarios) despite increasing food supply and more diversified diets (medium certainty). A deterioration of the services provided by freshwater resources (such as aquatic habitat, fish production, and water supply for households, industry, and agriculture) is found in the scenarios, particularly in those that are reactive to environmental problems (medium certainty). Habitat loss and other ecosystem changes are projected to lead to a decline in local diversity of native species in all four MA scenarios by 2050 (high certainty). Globally, the equilibrium number of plant species is projected to be reduced by roughly 10–15 % as the result of habitat loss alone over the period of 1970 to 2050 in the MA scenarios (low certainty), and other factors such as overharvesting, invasive species, pollution, and climate change will further increase the rate of extinction.
The degradation of ecosystem services is already a significant barrier to achieving the
Millennium Development Goals agreed to by the international community in September 2000 and the harmful consequences of this degradation could grow significantly worse in the next
31
50 years. The consumption of ecosystem services, which is unsustainable in many cases, will continue to grow as a consequence of a likely three- to sixfold increase in global GDP by 2050 even while global population growth is expected to slow and level off in mid-century. Most of the important direct drivers of ecosystem change are unlikely to diminish in the first half of the century and two drivers—climate change and excessive nutrient loading—will become more severe.
Already, many of the regions facing the greatest challenges in achieving the MDGs
coincide with those facing significant problems of ecosystem degradation. Rural poor people, a primary target of the MDGs, tend to be most directly reliant on ecosystem services and most vulnerable to changes in those services. More generally, any progress achieved in addressing the MDGs of poverty and hunger eradication, improved health, and environmental sustainability is unlikely to be sustained if most of the ecosystem services on which humanity relies continue to be degraded. In contrast, the sound management of ecosystem services provides cost-effective opportunities for addressing multiple development goals in a synergistic manner.
3. The challenge of reversing the degradation of ecosystems while meeting increasing
demands for their services can be partially met under some scenarios that the MA has considered but these involve significant changes in policies, institutions and practices that are not currently under way. Many options exist to conserve or enhance specific ecosystem services in ways that reduce negative trade-offs or that provide positive synergies with other ecosystem services There is no simple fix to these problems since they arise from the interaction of many
recognized challenges, including climate change, biodiversity loss, and land degradation, each of which is complex to address in its own right. Past actions to slow or reverse the degradation of ecosystems have yielded significant benefits, but these improvements have generally not kept pace with growing pressures and demands. Nevertheless, there is tremendous scope for action to reduce the severity of these problems in the coming decades. Indeed, three of four detailed scenarios examined by the MA suggest that significant changes in policies, institutions, and practices can mitigate some but not all of the negative consequences of growing pressures on ecosystems. But the changes required are substantial and are not currently under way. An effective set of responses to ensure the sustainable management of ecosystems requires substantial changes in institutions and governance, economic policies and incentives, social and behavior factors, technology, and knowledge. Actions such as the integration of ecosystem management goals in various sectors (such as agriculture, forestry, finance, trade, and health), increased transparency and accountability of government and private-sector performance in ecosystem management, elimination of perverse subsidies, greater use of economic instruments and market-based approaches, empowerment of groups dependent on ecosystem services or affected by their degradation, promotion of technologies enabling increased crop yields without harmful environmental impacts, ecosystem restoration, and the incorporation of nonmarket values of ecosystems and their services in management decisions all could substantially lessen the severity of these problems in the next several decades. The MA assessed 74 response options for ecosystem services, integrated ecosystem management, conservation and sustainable use of biodiversity, and climate change. Many of these options hold significant promise for overcoming these
32
barriers and conserving or sustainably enhancing the supply of ecosystem services. Illustrative examples of promising response options specific to particular sectors judged to be promising or effective are listed below.
Agriculture
• Removal of production subsidies that have adverse economic, social, and
environmental effects. • Investment in and diffusion of, agricultural science and technology that can sustain the
necessary increase of food supply without harmful tradeoffs involving excessive use of water, nutrients, or pesticides.
• Use of response polices that recognize the role of women in the production and use of food and that are designed to empower women and ensure access to and control of resources necessary for food security.
• Application of a mix of regulatory and incentive- and market-based mechanisms to reduce overuse of nutrients.
Fisheries and Aquaculture
• Reduction of marine fishing capacity. • Strict regulation of marine fisheries both regarding the establishment and
implementation of quotas and steps to address unreported and unregulated harvest. Individual transferable quotas may be appropriate in some cases, particularly for cold water, single species fisheries.
• Establishment of appropriate regulatory systems to reduce the detrimental environmental impacts of aquaculture.
• Establishment of marine protected areas including flexible no-take zones.
Water • Payments for ecosystem services provided by watersheds. • Improved allocation of rights to freshwater resources to align incentives with
conservation needs. • Increased transparency of information regarding water management and improved
representation of marginalized stakeholders. • Development of water markets. • Increased emphasis on the use of the natural environment and measures other than
dams and levees for flood control. • Investment in science and technology to increase the efficiency of water use in
agriculture.
33
Forestry • Integration of agreed sustainable forest management practices in financial institutions,
trade rules, global environment programs, and global security decision-making. • Empowerment of local communities in support of initiatives for sustainable use of
forest products; these initiatives are collectively more significant than efforts led by governments or international processes but require their support to spread.
• Reform of forest governance and development of country-led, strategically focused national forest programs negotiated by stakeholders.
MA Impact In February 2005, one year after the release of the core Millennium Ecosystem
Assessment (MA) findings and one month after the release of the technical assessment reports, individuals involved in the MA process (both experts and users) were surveyed to examine the initial impact of the process. That survey2 found widespread evidence that the assessment is having an impact on the intended audiences, but the extent of that impact is very mixed, with some institutions, regions, countries, and sectors significantly influenced by the MA while others have not been influenced at all.
Specifically: • Convention: The MA has had a significant impact on the Convention on Biological
Diversity and the Ramsar Convention on Wetlands. A substantial amount of MA information and material has been utilized in decisions and recommendations taken by both of these conventions. There has been less impact on the Convention to Combat Desertification.
• Regional, National, and Sub-national governments: Among governments, the impact of the MA appears to be greatest in regions and countries where MA sub-global assessments were conducted, including the Caribbean, South Africa, China, Sweden, and Norway, although significant impacts are also noted in regions and countries that did not undertake sub-global assessments such as the European Union, U.K. and France. At a national level, there is little evidence of impact among several other economically and politically influential countries, including the U.S., India, Japan, and Brazil.
• Business: The MA findings were well-received by business journalists but the impact to date in the business sector has been relatively limited. The most significant impact of the MA within business and industry is the incorporation of the concept of ecosystem services in the environmental policy issued by Goldman Sachs in November 2005. The World Business Council for Sustainable Development is also working with companies on MA follow-up activities.
• Donors: The MA has had a notable impact on multi-lateral (particularly GEF) and bilateral (particularly Scandinavian countries) donors and to a lesser extent on foundations.
2 Available at http://www.millenniumassessment.org/en/Article.aspx?id=75
34
• NGOs. The MA has had a notable impact on international conservation-oriented NGOs but much less impact on national NGOs. To date, there is no evidence of any impact on NGOs focused on development, poverty reduction, or health issues.
• International Agencies. All of the UN agencies involved in the MA process (UNEP, UNDP, FAO, WHO, and UNESCO) have incorporated the MA findings and process into their activities. There appears to have been no impact at all within the Bretton Woods Institutions.
• Capacity Building. The MA sub-global assessments and the MA fellows program were the primary mechanisms established by the MA to build assessment capacity and these were generally successful. A handful of additional training and capacity building activities have been established by partners and by experts involved in the MA.
• Education. MA materials are being used extensively in University courses and curricula. There is less evidence of use at other levels of education.
• Scientific Research. The MA is having a notable impact on research directions and priorities.
Based on perceptions of its preliminary impact, the MA is being viewed by some to have
been a success. In December 2005, for example, the MA was awarded the Zayed International Prize for the Environment. The Jury indicated that “the success of the MA set a standard for monitoring and evaluating environmental change and its impact on sustainability of life on our fragile planet.” Similarly, The World Economic Forum, in its 2006 Global Governance Initiative Annual Report, recognized the Millennium Ecosystem Assessment as one of the ‘heroes’ in 2005 in the category of the environment. On the other hand, others involved in the MA process believe that the MA has had very little impact on policy. Based on the preliminary impact revealed in the February 2005 survey, it appears that both perspectives may be correct depending on the region and sector being considered. Differences in perspectives regarding the overall impact exist in part because of striking regional and national differences in the attention that governments and the media have given to the MA and because of differences in the use of the findings among different institutions and sectors.
References
Annan, K.A. 2000. We the Peoples: The Role of the United Nations in the 21st Century.-United Nations, New York.
Ayensu, E., Claasen, D.R., Collins, M A., Dearing, L., Fresco, M., Gadgil, H., Gitay, G., Glaser, C., Juma, J., Krebs, R., Lenton, J., Lubchenco, J.A., McNeely, H.A., Mooney, P., Pinstrup-Andersen, M., Ramos, P., Raven, W. V., Reid, C., Samper, J., Sarukhán, P., Schei, J., Tundisi, G., Watson, R. T. and Zakri, A. H. 2000. International ecosystem assessment.-Science, 286: 685-686.
Millennium Ecosystem Assessment (MA). 2003. Ecosystems and Human Well-being: A Framework for Assessment.-Island Press, Washington DC.
Millennium Ecosystem Assessment (MA). 2005 a, b, c, d. Ecosystems and Human Well-being, vol. 1-4.-Island Press, Washington D.C.
Millennium Ecosystem Assessment (MA); 2005e. Millennium Ecosystem Assessment Synthesis.-Island Press, Washington D.C.
35
Reid, W.V. 2000. Ecosystem data to guide hard choices.-Issues in Science and Technology, 16(3): 37-44.
Reid, W.V., Berkes, F., Wilbanks, T. and Capistrano, D. (Eds.). 2007. Bridging Scales and Epistemologies in Scientific Assessments.-Island Press, Washington D.C.
Watson, R.T., Dixon, J.A., Hamburg, S.P., Janetos, A.C. and Moss, R.H. 1998. Protecting our Planet – Securing our Future.-United Nations Environment Programme, U.S. National Aeronautics and Space Administration, and World Bank, Washington D.C.

36
37
The Millennium Assessment – methodology and framework
Jean-Paul Malingreau
European Commission, Joint Research Centre [email protected]
The setting The unsustainable use of the earth's natural resources and the strong pressure exerted by
man on key ecosystems of the world have been cause for concern since the early eighties. At that time, international scientific programmes such as the IGBP (International Geosphere-Biosphere Programme) and others made strong and systematic attempts to unravel the various mechanisms at play in the earth ecosystems. A systemic approach to the study of interrelations between the multiple components of what was then christened the Earth system was widely adopted. Such efforts were carried out through a broad range of international programmes related to topics such as vegetation dynamics, climatic cycles, water transport, atmospheric chemistry, ocean dynamics and others. They led, for the first time in the history of contemporary science, to the development of long-term activities addressing global questions. The scientific field of "global change" studies was born. Rapidly, those international research programmes drove scientists to document emerging changes (see for example the work of the Intergovernmental Panel on Climate Change) and at times irremediable transformations in some of the components of the earth system (e.g. in tropical deforestation). The possible impacts of those trends on life on earth were, at the beginning, relatively little investigated.
Initiated in the early part of the new millennium (2001-2005) the Millennium Ecosystem
Assessment (MA) must be seen as a significant step in addressing those questions. It did so through the application of established scientific methods of investigations and, in that sense, the MA owes much to the international activities of the previous twenty years such as those briefly described above. At the outset, indeed, it closely coordinated with many of those programmes. In common with an activity such as the Intergovernmental Panel on Climate Change convened by the UN, the MA also strived to clarify where there is a broad consensus with the scientific community and where more information is needed. This was done through the now well- proven expert writing, forum discussion and review process. MA was not intended to produce new science but to fully exploit the current state of knowledge (close to two thousands experts in 95 countries!). In pursuing a consensus approach the MA aimed at providing what its Board refers to as "authoritative information". Its main findings are summarised in Reid, 2006 in this volume.
Yet, the MA significantly departed from pure scientific approaches by setting - at the
outset- a clear utilitarian perspective to the effort. The MA exercise was deliberately set to examine whether trends in the state of the world ecosystems were significantly affecting the capacity of those ecosystems to sustainably support "human well-being". The MA framework
38
firmly placed this concept of human well-being (or "satisfaction of human needs", as it was sometimes expressed) as the central focus of the undertaking.
As a logical consequence, the multi-year MA exercise was not designed as a formal
scientific investigation; it was not based on a predetermined methodology. It was driven instead by a reference "conceptual framework" defined during the design phase. The four components of this framework are well known (MA, 2003); the first one identifies the nature of "human well-being", the second defines the type of ecosystem services of relevance to such well-being and the last two conveniently identify a series of indirect and direct drivers of change. The framework calls for an evaluation of the intensity of linkages between those four compartments in specific situations.
The MA was also designed to "meet the needs of decision-makers for scientific
information on the links between ecosystem change and human well-being" (MA, op. cit.). A demand-driven agenda of such kind has important implications. Among others, the provision of relevant and useful information necessitates a complex process of requirement analysis. The preferred channel for gathering such information was through a close connection with four international conventions1 and constant contact with relevant UN agencies. The endorsement by the Secretary General of the UN in 2001 provided the ultimate so-called "soft-authorization"2 from the highest possible global level.
Finally, the MA also seeks to help build individual and institutional capacity to undertake
integrated ecosystem assessments and to act on their findings. For those reasons the MA framework also calls for an identification of those linkages which present potential for mediation by socio-economic factors. The proposal has proven to be attractive to many scientists concerned about bridging science and societal issues. The present colloquium on "The Millennium Ecosystem Assessment: Implications for Belgium" testifies to this interest; one must also note here the growing number of ecosystem related doctoral dissertations which place their work firmly in the MA context (see illustration in Bosire, 2006).
Key features: multiscale analyses and integration of knowledge Two key features of the MA are worth further analysis as they bear upon the quality,
relevance of results and to some extent upon the broader applicability of the approach. They relate to the multiscale nature of the analyses and to the necessity to integrate information and knowledge across disciplines and reference systems.
In the MA, scale matters and MA has been conceived as a multiscale assessment. This
basic tenet is derived from the known fact that processes in ecosystems are taking place at different spatial and hierarchical levels. The corollary being that there is no single scale of investigation which can fully account for all the interactions at play. Yet, investigations and 1 Convention on Biological Diversity, Convention to Combat Desertification, Convention on Migratory Species, and Ramsar Convention on Wetlands. 2 In their constant drive to justify stakeholder support, scientific investigations can proceed in direct response to hard demand by customers ; they can also proceed on the base of a softer consensus from political authorities regarding the relevance of a proposal with respect to political and societal agendas.
39
analyses cannot possibly take place at all relevant levels. The MA concept posits that while assessments have to be conducted within a scale domain appropriate to processes being examined, there are many advantages associated with the multiscale approach.
First, the approach favours economies of scale during the investigations themselves since
one can expect that findings at a given scale will be improved by information and perspectives derived at other scales. A set of relationships can, for example, be tested and confirmed at a higher level of the hierarchy of systems thus reducing the need for further testing. Inversely, principles defined at a higher level can guide investigations at lower scales. The second advantage of a multiscale approach is more directly linked to the ultimate objective of the exercise which is to provide advice for ecosystem management. The well noted mismatch between scales at which ecosystem processes, response options and decision making take place calls for an opening of scales of analyses. Interactions between far and proximate causes of change, or between local ecological and national socio-economic factors, or between a global situation and local options call for a constant attention to a range of explanatory scales. Decision making is itself conveyed through institutional structures which follow the boundaries of political jurisdictions; possibilities of mismatch between diagnostic and actions are numerous in such context.
Finally, the choice of scale is not politically neutral as many politicians in federated or
regionalised countries will readily attest. The selection of scale can intentionally favour certain groups; it can hide or reveal critical and possibly embarrassing facts3; it can determine the choice of actors in decision making. Individual studies which are undertaken in the confine of their pre-set domain do usually not take into account pressures coming from "outside". Lack of vision, concentration on complex local processes, regulatory restrictions (e.g. geographical areas of competence!), a natural tendency to fragment the issues to a tractable level, shortage of funding etc. can drive investigators to ignore external determinants. Without taking anything away from the quality of the research such shortcoming may significantly reduce the applicability of the results in the MA context. Presentations made during the present symposium have sometimes demonstrated this point.
It is therefore for fundamental reasons that the MA methodology calls for explicitness
with respect to geographical extent and periods of time for which the study is valid. It is to be noted here that such requirement is not always easy to abide to. For example, the time reference periods of the MA is placed at 50 years before and after the 2000 reference year for, respectively, the assessment proper and the scenarios. Such nominal reference period cannot be served equally by all supporting studies which do not necessarily use the same period; it can also miss key processes or overcome significant and rapid acceleration of a situation in a given critical period. A multiscale approach may, therefore, be needed in time as much as in space. It is interesting to note that the MA attention to scale brings the whole exercise at the centre of one of the grand queries of science, namely the understanding of the relationships between the macro- and micro scale phenomena and processes and between short- and long term effects (Kates et al., 2003). 3 Scale can matter at even more elementary levels of analyses as shown by recurring discussions around a "politically acceptable" rate of deforestation ; this rate being a ratio, controversy can first arise about the amplitude of the deforestation process itself (km².yr-1) but more often about the area over which it should be measured (km²). The larger the reference area, the lower the rate.
40
The second feature unique to the MA is the impetus it has given to participants to shift from a disciplinary to an interdisciplinary perspective. The question of integrating various fields of research in the study of natural processes had already been raised during early attempts to produce a global science addressing processes at play in the earth system. The objective has met with a good degree of success in previous international programmes; in the MA context the adoption of system analysis has provided a convenient approach for assessing current conditions and trends. The distinction between various ecosystem functions in terms of provision of goods and services has significantly helped in keeping the supporting studies into focus. The required assessment of provisioning, regulating, cultural and supporting ecosystem functions has forced the integration of knowledge on ecosystem processes and structure. Linking biotic and abiotic components remains central in this context. The widespread use of geographical information systems has resulted in rendering geographically explicit many of the findings, notably at the sub-regional scale. The presentation of the MA findings includes several outstanding examples of the usefulness of such digital technique for displaying, analysing and sharing results. Saliency and clarity were significantly served by the capacity of geographical information management systems to integrate multiple layers of data, analyse spatial relationships between them, test scenarios, link scales of analysis and scales of interest and, finally, display the results in the most efficient manner. This comprehensive MA knowledge system could represent a solid base for a possible updating of the assessment in the years to come.
The MA exercise is also widely recognised as having brought a new dimension to
integration by driving towards the generation of collective understanding of issues across ecosystems and geographical scales and by further bridging the gap between knowledge and governance. Understanding complex systems and providing recommendations for management responses has, as in the case of ecosystem functions, forced the construction of new knowledge across science and other stakeholders. Existing knowledge does not, in the best of cases, favour such convergence as it is based on fragmented intellectual environments. Yet, the MA exercise managed to connect multidisciplinary perspectives and understandings through an intense process of encounters and interactions between participants. In such a way, those addressing say, institutional policy responses, were led to fit their analysis in the hierarchical understanding of those addressing the ecosystem services and drivers of changes. The difficulties of the exercise are not to be underestimated but the MA experience can be considered as a new approach to support good governance at various levels of decision making, the implication being that no local, regional and to some extent, global assessment is complete until it has proceeded with making its results tested and incorporated in the decision making process. While some papers in the present colloquium explicitly address the question, it is not normal practice in ecological research.
The notion of human well-being has been debated at length during the preparation phase
of the initiative as it is central to the concept. Determinants and constituents of well-being are identified in the MA Framework; they relate to security, basic material for a "good life", health and "good" social relations. As one can see, these will apply differently to regions, groups, time in development history, etc, and while it may be easy to establish the minimum requirements for well-being in a subsistence economy, it is harder to identify them in a society where basic needs have been amply met. Furthermore, the substitution of ecosystem "natural" services by technological advances needs to be factored in the demand towards
41
ecosystem services. The notion of well-being is clearly value laden and very much depends upon the context, the social group, the local physical situation (re-urban/rural), social factors and culture. Trade-offs between services are constantly adopted, often by default, as seen today in the conversion from forested land (regulating services) to agriculture (provisioning services), or between agricultural land and urban development. Furthermore, new constituents of well-being appear along the development path as shown, among others, in the relentless desire of modern societies to secure mobility as an essential factor in the quality of life. Answering such legitimate demands associated with well-being will be made at the expenses of trade-offs with other use of the land, air and sea space. The MA assessment has shown that changes in the capability of systems to provide services affect everybody on earth. Yet, it has not given a tool to gauge the unevenness of the impacts of those changes and therefore their relative relevance for different groups in society.
A key conclusion of the findings of the MA is that the degradation of ecosystem services
could grow significantly worse during the first half of this century; this will be mainly due to constant pressure from several "direct drivers" of changes such as habitat transformation (e.g. conversion of agriculture into urban land use), overexploitation (e.g. over-fishing), spread of invasive alien species, pollution and anthropogenic climate change. This evolution will take place in a context where the demand for food will be rising by more than 75 % and demand for water by between 30-85 % in the next 50 years! MA scenarios have been presented as capable to partly meet the challenge of reversing such ecosystem degradation; they drew attention and sometimes consensus at many levels of decision making around the world. The question to day is to secure that those results will continue to guide future sustainable practices; more important, perhaps, is to continue exploiting the path-breaking framework proposed by this extraordinary global exercise. Hopefully, the Millennium Assessment of the early part of this century will not remain a one-off event.
References Bosire, J. 2006. Ecological Recovery of Reforested Mangroves in Kenya.-Lab. of Plant Sc.
and Nature Management, VUB, Brussels. Ph. D Thesis, 132 p. Kates, R.W., Wildbanks, T.J. and Abler, R. 2003. Global Change in Local Places: Estimating,
Understanding and Reducing Greenhouse Gases.-Cambridge University Press, Cambridge.
Millennium Ecosystem Assessment. 2003. Ecosystems and Human Well-being. A framework for Assessment.-Island Press, Washington D.C., 245 p.

42
43
Ecosystem services: a key element in protecting biodiversity of wetlands, rivers and estuaries.
Patrick Meire, Stefan Van Damme, Eric Struyf, Tom Maris, Hans Backx
University of Antwerp Department of Biology, Ecosystem management research group
Abstract Wetlands are characterised by a very high biodiversity but this is under pressure by many
different anthropogenic impacts. In this paper we describe some major changes in the Scheldt estuary and the Nete river. Especially the interaction between hydrodynamics, geomorphology and the ecosystems is emphasised and how this has impacted the ecosystem services of the system. Following, it is shown how these services can be quantified and how a restoration strategy is successfully developed and approved by the Flemish government based on the concept of ecosystem services.
Introduction The deterioration of wetlands and their associated biodiversity is a well known worldwide
phenomenon described in many reports and clearly summarised in the Millennium Ecosystem Assessment: the condition of inland water habitats is worse than that of forests, grasslands or coastal systems due to human pressures of which agriculture is a principal cause (MA, 2005).
Since long, many actions have been undertaken in order to stop the further losses of
biodiversity in wetlands and freshwater systems. The first landmark was the International Convention on the protection of wetlands and waterfowl signed in Ramsar, Iran, in 1971. It is an intergovernmental treaty which provides the framework for national action and international cooperation for the conservation and wise use of wetlands and their resources. There are presently 154 Contracting Parties to the Convention, with 1636 wetland sites, totaling 145.7 million hectares, designated for inclusion in the Ramsar List of Wetlands of International Importance. The next major step was the adoption at the Rio conference in 1992 of the Convention on Biological Diversity. The Convention establishes three main goals: the conservation of biological diversity, the sustainable use of its components, and the fair and equitable sharing of the benefits from the use of genetic resources. At the European level, the Bird (79/409/EEC) and Habitat Directives (92/43/EEC) form the core of the European nature conservation policy. The realisation of the Natura 2000 network, including many wetlands, aims at the conservation of all relevant species and habitats at the community level (EC, 1998; 2006). Recently, more focus was given to wetland restoration, on top of conservation of
44
existing natural environments. Still, losses are higher than gains, and human society has not managed to prevent a further degradation of the biodiversity of freshwater systems yet.
This paper is a summary of some of the research carried out in the Scheldt estuary and the
Nete catchment and the concepts developed to protect the remaining habitats and restore the estuarine and riverine system. The aim of this paper is to emphasise the ideas which we developed in the past years concerning restoration of wetlands, rivers and river basins, which are to a large extent based on the concept of ecosystem goods and services.
We will try to provide an overview of the scientific approach we followed and still follow,
in which we try to quantify ecosystem goods and services, see how they were (or still are) affected by human activities and then try to incorporate the ideas of restoring services within restoration plans.
Study area The river Scheldt has a length of 355 km from source to mouth. The source is situated in
the north of France (St. Quentin) about 110 m above sea level and the river flows into the North Sea near Vlissingen (The Netherlands) (figure. 1). The total catchment area is approximately 21 863 km2. About ten million people (477 inhabitants km-2) live in the river basin. The Scheldt is a typical rain fed lowland-river. The estuary of the river Scheldt extends from the mouth at Vlissingen (km 0) till Gent (km 160), where sluices stop the tidal wave. The tributaries Durme and Rupel, with its tributaries Nete, Dijle and Zenne, are also under tidal influence and are considered as part of the estuary (total length of 77 km). The Zeeschelde (105 km), the Belgian part of the estuary, is characterised by a single ebb/flood channel, bordered by relatively small mudflats and marshes (28 % of total surface). The surface of the Zeeschelde amounts to 44 km². Human activities are mainly concentrated in the Zeeschelde, where agglomerations and industries historically developed close to the riverbanks. The intertidal zone is often absent (e.g. quays, wharfs) or very narrow. Upstream of Dendermonde, the estuary is almost completely canalised. The middle and lower estuary, called the Westerschelde (58 km), is a well mixed region characterised by a complex morphology with flood and ebb channels surrounding several large intertidal flats and salt marshes. The surface of the Westerschelde amounts to 310 km², with the intertidal area covering 35 %. The average channel depth is approximately 15-20 m. The mean tidal amplitude varies from 3.8 m near the mouth to a maximum of 5.33 m near Sint Amands and back to 2 m near Gent. The estuary is well mixed with a smooth transition between salt and fresh. The polyhaline zone is 40 km long, the mesohaline and oligohaline parts are 40 and 10 km respectively. The freshwater part, including the tributaries has a total length of 135 km (see Baeyens et al., 1998 and Meire et al., 2005 for more information).
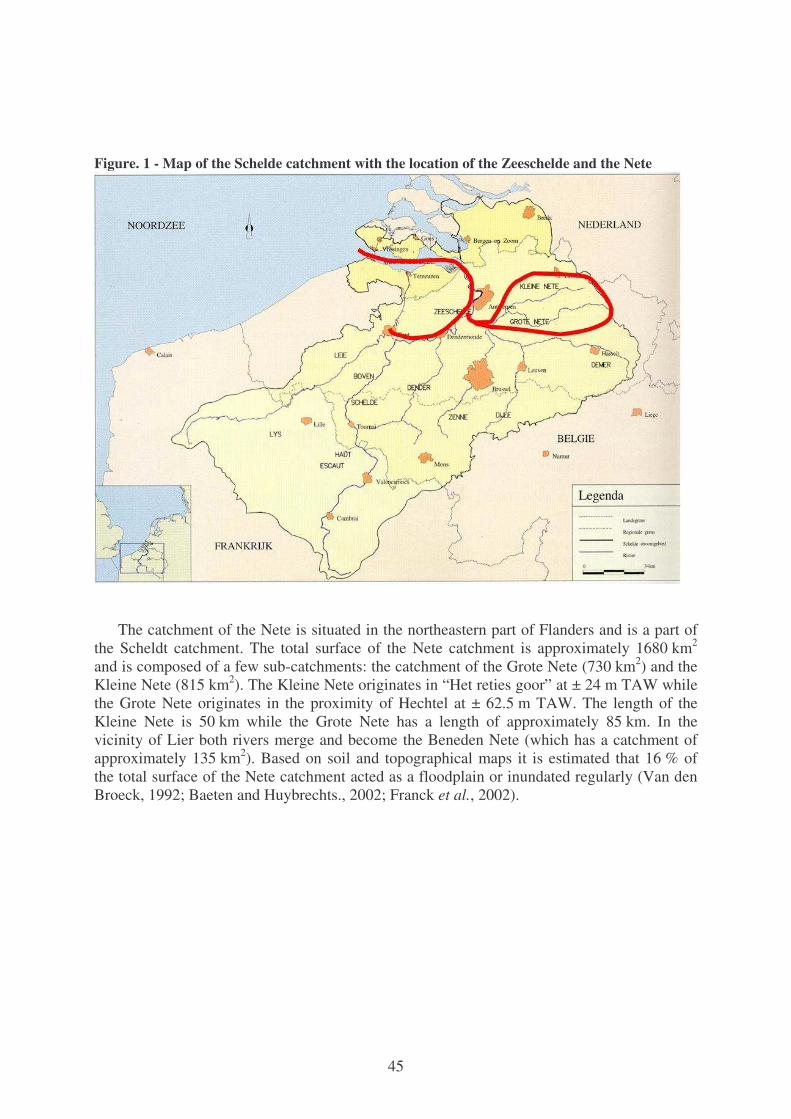
45
Figure. 1 - Map of the Schelde catchment with the location of the Zeeschelde and the Nete
The catchment of the Nete is situated in the northeastern part of Flanders and is a part of
the Scheldt catchment. The total surface of the Nete catchment is approximately 1680 km2 and is composed of a few sub-catchments: the catchment of the Grote Nete (730 km2) and the Kleine Nete (815 km2). The Kleine Nete originates in “Het reties goor” at ± 24 m TAW while the Grote Nete originates in the proximity of Hechtel at ± 62.5 m TAW. The length of the Kleine Nete is 50 km while the Grote Nete has a length of approximately 85 km. In the vicinity of Lier both rivers merge and become the Beneden Nete (which has a catchment of approximately 135 km2). Based on soil and topographical maps it is estimated that 16 % of the total surface of the Nete catchment acted as a floodplain or inundated regularly (Van den Broeck, 1992; Baeten and Huybrechts., 2002; Franck et al., 2002).
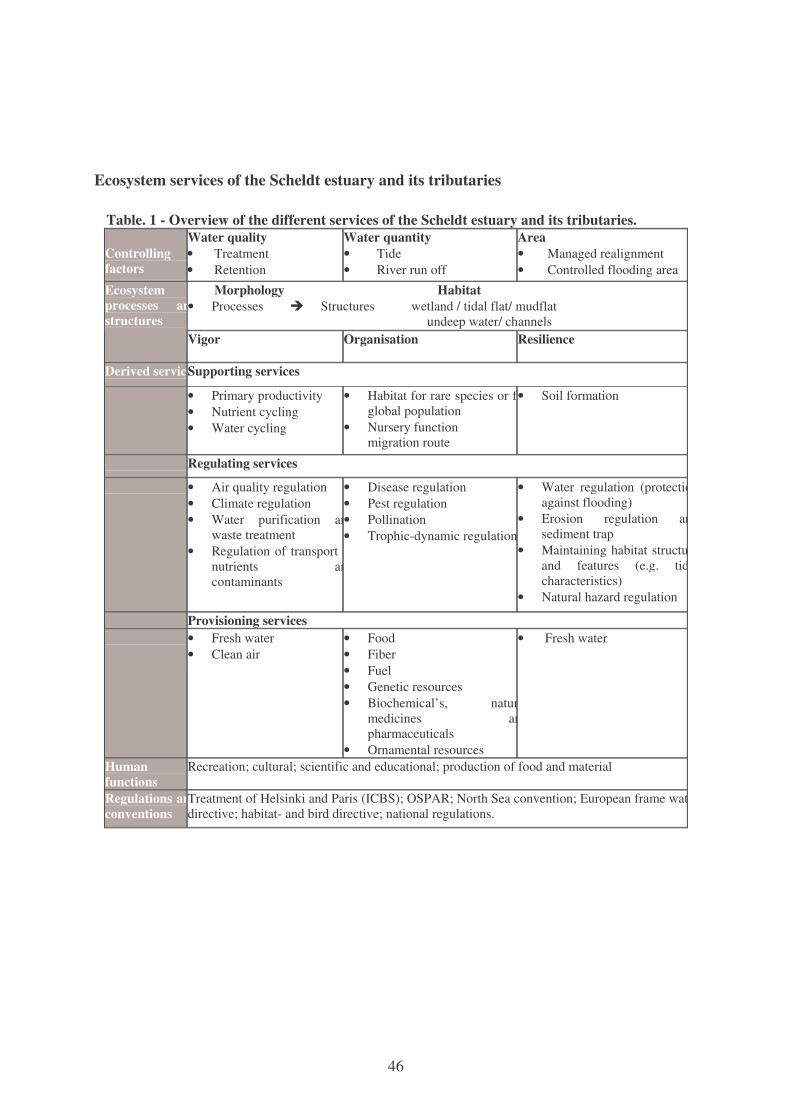
46
Ecosystem services of the Scheldt estuary and its tributaries
Table. 1 - Overview of the different services of the Scheldt estuary and its tributaries.
Controlling factors
Water quality • Treatment • Retention
Water quantity • Tide • River run off
Area • Managed realignment • Controlled flooding area
Morphology Habitat • Processes � Structures wetland / tidal flat/ mudflat undeep water/ channels
Ecosystem processes and structures
Vigor
Organisation
Resilience
Derived servicesSupporting services
• Primary productivity • Nutrient cycling • Water cycling
• Habitat for rare species or for global population
• Nursery function migration route
• Soil formation
Regulating services
• Air quality regulation • Climate regulation • Water purification and
waste treatment • Regulation of transport of
nutrients and contaminants
• Disease regulation • Pest regulation • Pollination • Trophic-dynamic regulation
• Water regulation (protection against flooding)
• Erosion regulation and sediment trap
• Maintaining habitat structure and features (e.g. tidal characteristics)
• Natural hazard regulation
Provisioning services • Fresh water
• Clean air • Food • Fiber • Fuel • Genetic resources • Biochemical’s, natural
medicines and pharmaceuticals
• Ornamental resources
• Fresh water
Human functions
Recreation; cultural; scientific and educational; production of food and material
Regulations and conventions
Treatment of Helsinki and Paris (ICBS); OSPAR; North Sea convention; European frame water directive; habitat- and bird directive; national regulations.
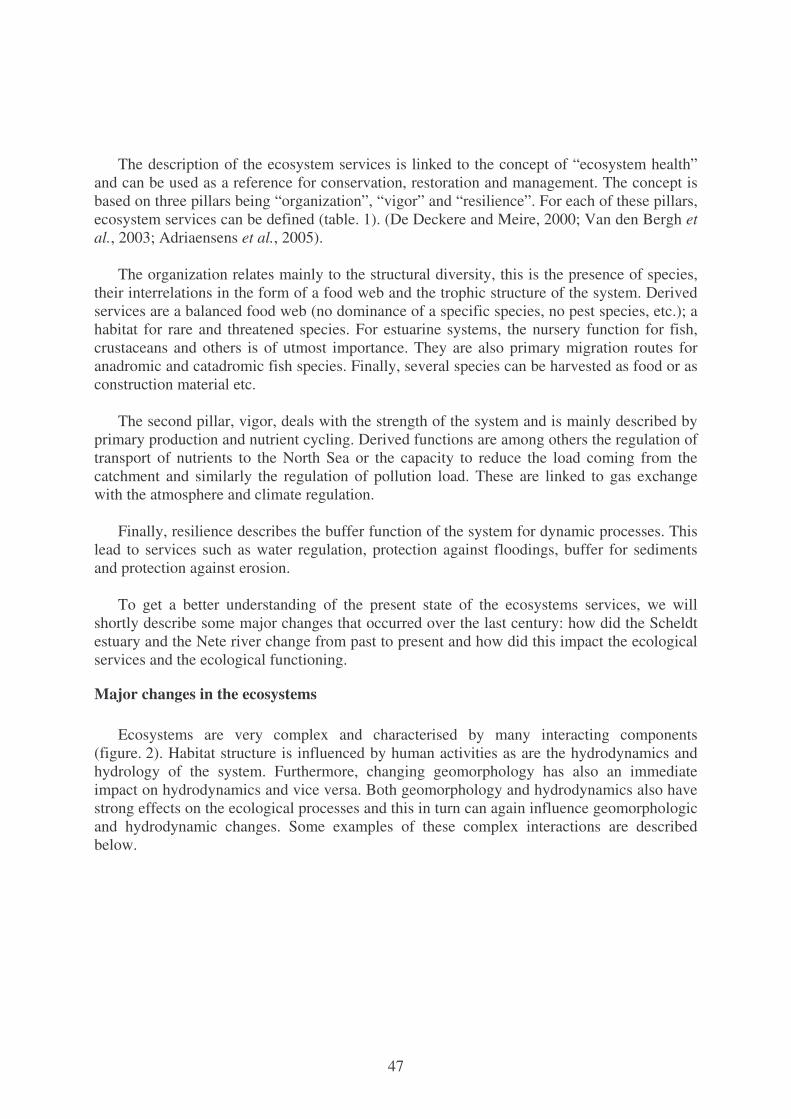
47
The description of the ecosystem services is linked to the concept of “ecosystem health” and can be used as a reference for conservation, restoration and management. The concept is based on three pillars being “organization”, “vigor” and “resilience”. For each of these pillars, ecosystem services can be defined (table. 1). (De Deckere and Meire, 2000; Van den Bergh et al., 2003; Adriaensens et al., 2005).
The organization relates mainly to the structural diversity, this is the presence of species,
their interrelations in the form of a food web and the trophic structure of the system. Derived services are a balanced food web (no dominance of a specific species, no pest species, etc.); a habitat for rare and threatened species. For estuarine systems, the nursery function for fish, crustaceans and others is of utmost importance. They are also primary migration routes for anadromic and catadromic fish species. Finally, several species can be harvested as food or as construction material etc.
The second pillar, vigor, deals with the strength of the system and is mainly described by
primary production and nutrient cycling. Derived functions are among others the regulation of transport of nutrients to the North Sea or the capacity to reduce the load coming from the catchment and similarly the regulation of pollution load. These are linked to gas exchange with the atmosphere and climate regulation.
Finally, resilience describes the buffer function of the system for dynamic processes. This
lead to services such as water regulation, protection against floodings, buffer for sediments and protection against erosion.
To get a better understanding of the present state of the ecosystems services, we will
shortly describe some major changes that occurred over the last century: how did the Scheldt estuary and the Nete river change from past to present and how did this impact the ecological services and the ecological functioning.
Major changes in the ecosystems Ecosystems are very complex and characterised by many interacting components
(figure. 2). Habitat structure is influenced by human activities as are the hydrodynamics and hydrology of the system. Furthermore, changing geomorphology has also an immediate impact on hydrodynamics and vice versa. Both geomorphology and hydrodynamics also have strong effects on the ecological processes and this in turn can again influence geomorphologic and hydrodynamic changes. Some examples of these complex interactions are described below.
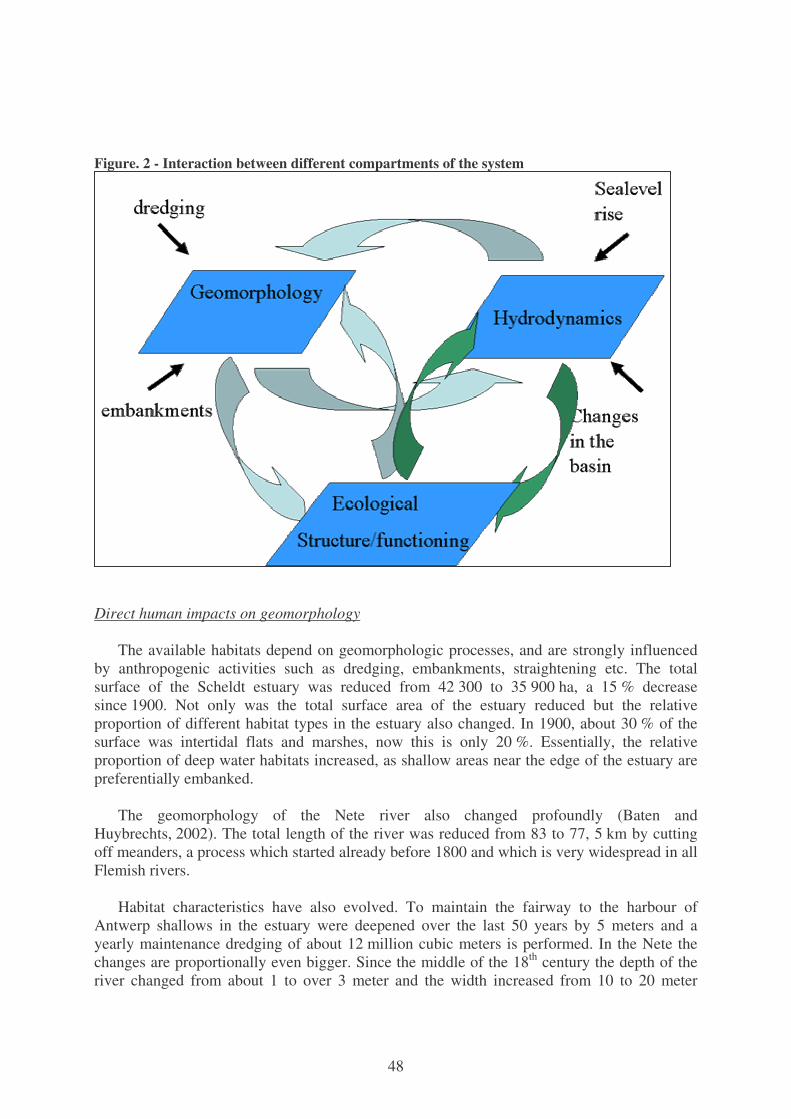
48
Figure. 2 - Interaction between different compartments of the system
Direct human impacts on geomorphology The available habitats depend on geomorphologic processes, and are strongly influenced
by anthropogenic activities such as dredging, embankments, straightening etc. The total surface of the Scheldt estuary was reduced from 42 300 to 35 900 ha, a 15 % decrease since 1900. Not only was the total surface area of the estuary reduced but the relative proportion of different habitat types in the estuary also changed. In 1900, about 30 % of the surface was intertidal flats and marshes, now this is only 20 %. Essentially, the relative proportion of deep water habitats increased, as shallow areas near the edge of the estuary are preferentially embanked.
The geomorphology of the Nete river also changed profoundly (Baten and
Huybrechts, 2002). The total length of the river was reduced from 83 to 77, 5 km by cutting off meanders, a process which started already before 1800 and which is very widespread in all Flemish rivers.
Habitat characteristics have also evolved. To maintain the fairway to the harbour of
Antwerp shallows in the estuary were deepened over the last 50 years by 5 meters and a yearly maintenance dredging of about 12 million cubic meters is performed. In the Nete the changes are proportionally even bigger. Since the middle of the 18th century the depth of the river changed from about 1 to over 3 meter and the width increased from 10 to 20 meter
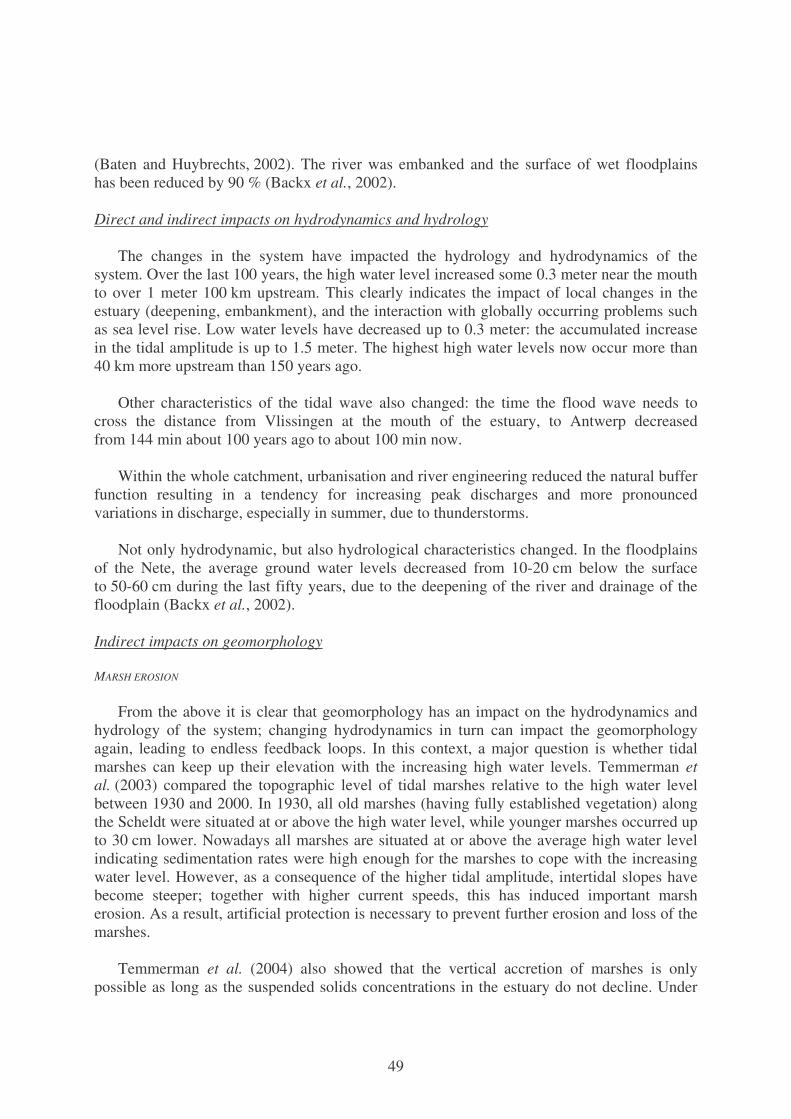
49
(Baten and Huybrechts, 2002). The river was embanked and the surface of wet floodplains has been reduced by 90 % (Backx et al., 2002).
Direct and indirect impacts on hydrodynamics and hydrology
The changes in the system have impacted the hydrology and hydrodynamics of the
system. Over the last 100 years, the high water level increased some 0.3 meter near the mouth to over 1 meter 100 km upstream. This clearly indicates the impact of local changes in the estuary (deepening, embankment), and the interaction with globally occurring problems such as sea level rise. Low water levels have decreased up to 0.3 meter: the accumulated increase in the tidal amplitude is up to 1.5 meter. The highest high water levels now occur more than 40 km more upstream than 150 years ago.
Other characteristics of the tidal wave also changed: the time the flood wave needs to
cross the distance from Vlissingen at the mouth of the estuary, to Antwerp decreased from 144 min about 100 years ago to about 100 min now.
Within the whole catchment, urbanisation and river engineering reduced the natural buffer
function resulting in a tendency for increasing peak discharges and more pronounced variations in discharge, especially in summer, due to thunderstorms.
Not only hydrodynamic, but also hydrological characteristics changed. In the floodplains
of the Nete, the average ground water levels decreased from 10-20 cm below the surface to 50-60 cm during the last fifty years, due to the deepening of the river and drainage of the floodplain (Backx et al., 2002).
Indirect impacts on geomorphology
MARSH EROSION
From the above it is clear that geomorphology has an impact on the hydrodynamics and
hydrology of the system; changing hydrodynamics in turn can impact the geomorphology again, leading to endless feedback loops. In this context, a major question is whether tidal marshes can keep up their elevation with the increasing high water levels. Temmerman et al. (2003) compared the topographic level of tidal marshes relative to the high water level between 1930 and 2000. In 1930, all old marshes (having fully established vegetation) along the Scheldt were situated at or above the high water level, while younger marshes occurred up to 30 cm lower. Nowadays all marshes are situated at or above the average high water level indicating sedimentation rates were high enough for the marshes to cope with the increasing water level. However, as a consequence of the higher tidal amplitude, intertidal slopes have become steeper; together with higher current speeds, this has induced important marsh erosion. As a result, artificial protection is necessary to prevent further erosion and loss of the marshes.
Temmerman et al. (2004) also showed that the vertical accretion of marshes is only
possible as long as the suspended solids concentrations in the estuary do not decline. Under
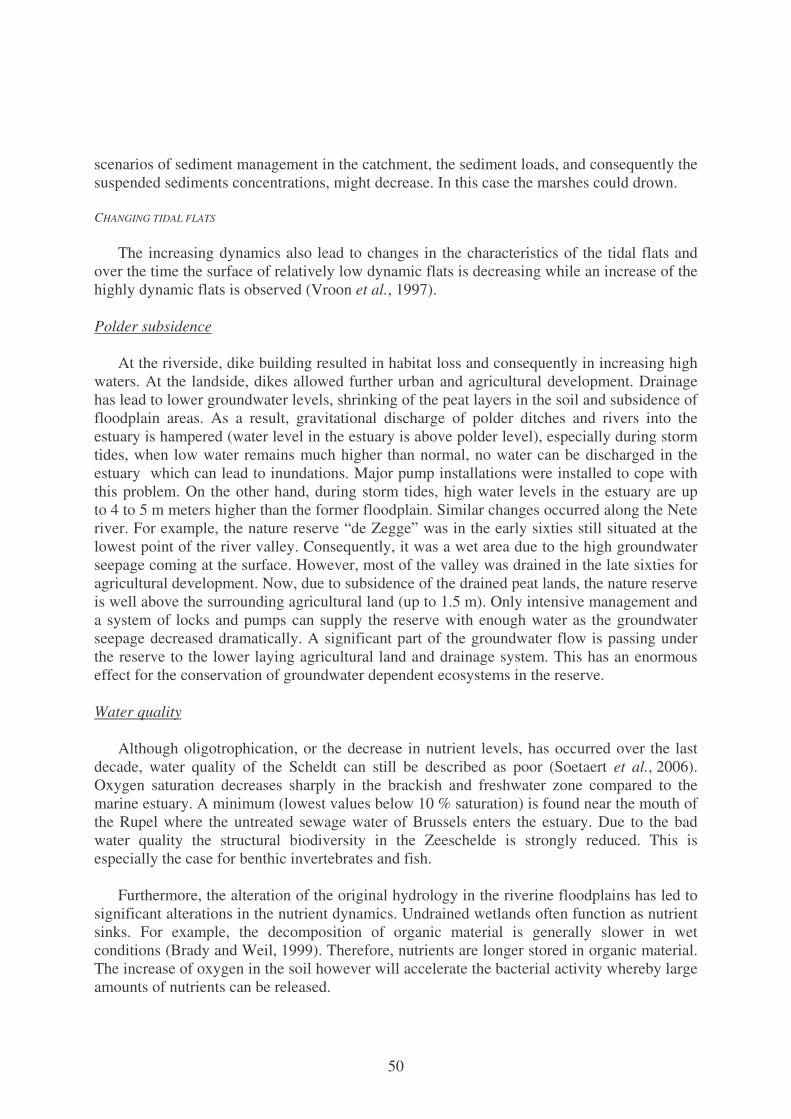
50
scenarios of sediment management in the catchment, the sediment loads, and consequently the suspended sediments concentrations, might decrease. In this case the marshes could drown.
CHANGING TIDAL FLATS
The increasing dynamics also lead to changes in the characteristics of the tidal flats and
over the time the surface of relatively low dynamic flats is decreasing while an increase of the highly dynamic flats is observed (Vroon et al., 1997).
Polder subsidence
At the riverside, dike building resulted in habitat loss and consequently in increasing high
waters. At the landside, dikes allowed further urban and agricultural development. Drainage has lead to lower groundwater levels, shrinking of the peat layers in the soil and subsidence of floodplain areas. As a result, gravitational discharge of polder ditches and rivers into the estuary is hampered (water level in the estuary is above polder level), especially during storm tides, when low water remains much higher than normal, no water can be discharged in the estuary which can lead to inundations. Major pump installations were installed to cope with this problem. On the other hand, during storm tides, high water levels in the estuary are up to 4 to 5 m meters higher than the former floodplain. Similar changes occurred along the Nete river. For example, the nature reserve “de Zegge” was in the early sixties still situated at the lowest point of the river valley. Consequently, it was a wet area due to the high groundwater seepage coming at the surface. However, most of the valley was drained in the late sixties for agricultural development. Now, due to subsidence of the drained peat lands, the nature reserve is well above the surrounding agricultural land (up to 1.5 m). Only intensive management and a system of locks and pumps can supply the reserve with enough water as the groundwater seepage decreased dramatically. A significant part of the groundwater flow is passing under the reserve to the lower laying agricultural land and drainage system. This has an enormous effect for the conservation of groundwater dependent ecosystems in the reserve.
Water quality
Although oligotrophication, or the decrease in nutrient levels, has occurred over the last
decade, water quality of the Scheldt can still be described as poor (Soetaert et al., 2006). Oxygen saturation decreases sharply in the brackish and freshwater zone compared to the marine estuary. A minimum (lowest values below 10 % saturation) is found near the mouth of the Rupel where the untreated sewage water of Brussels enters the estuary. Due to the bad water quality the structural biodiversity in the Zeeschelde is strongly reduced. This is especially the case for benthic invertebrates and fish.
Furthermore, the alteration of the original hydrology in the riverine floodplains has led to
significant alterations in the nutrient dynamics. Undrained wetlands often function as nutrient sinks. For example, the decomposition of organic material is generally slower in wet conditions (Brady and Weil, 1999). Therefore, nutrients are longer stored in organic material. The increase of oxygen in the soil however will accelerate the bacterial activity whereby large amounts of nutrients can be released.
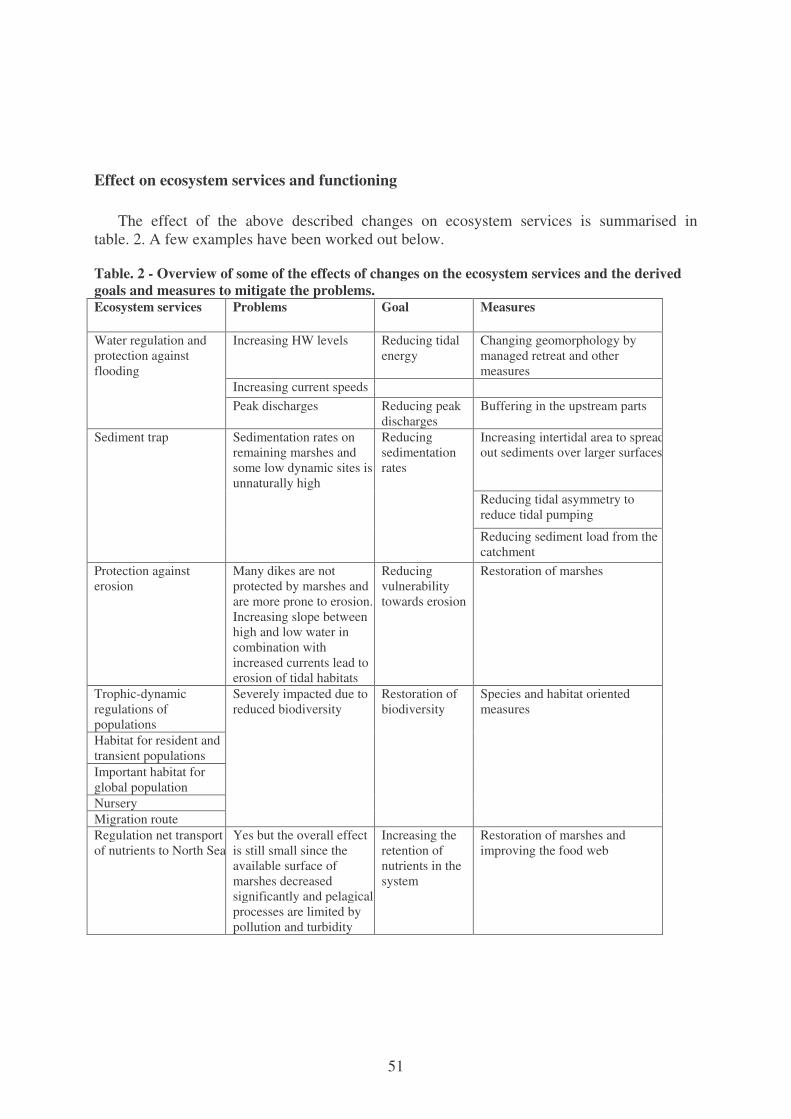
51
Effect on ecosystem services and functioning The effect of the above described changes on ecosystem services is summarised in
table. 2. A few examples have been worked out below. Table. 2 - Overview of some of the effects of changes on the ecosystem services and the derived goals and measures to mitigate the problems. Ecosystem services Problems Goal Measures
Increasing HW levels Reducing tidal energy
Changing geomorphology by managed retreat and other measures
Increasing current speeds
Water regulation and protection against flooding
Peak discharges Reducing peak discharges
Buffering in the upstream parts
Increasing intertidal area to spread out sediments over larger surfaces
Reducing tidal asymmetry to reduce tidal pumping
Sediment trap Sedimentation rates on remaining marshes and some low dynamic sites is unnaturally high
Reducing sedimentation rates
Reducing sediment load from the catchment
Protection against erosion
Many dikes are not protected by marshes and are more prone to erosion. Increasing slope between high and low water in combination with increased currents lead to erosion of tidal habitats
Reducing vulnerability towards erosion
Restoration of marshes
Trophic-dynamic regulations of populations Habitat for resident and transient populations Important habitat for global population Nursery Migration route
Severely impacted due to reduced biodiversity
Restoration of biodiversity
Species and habitat oriented measures
Regulation net transport of nutrients to North Sea
Yes but the overall effect is still small since the available surface of marshes decreased significantly and pelagical processes are limited by pollution and turbidity
Increasing the retention of nutrients in the system
Restoration of marshes and improving the food web
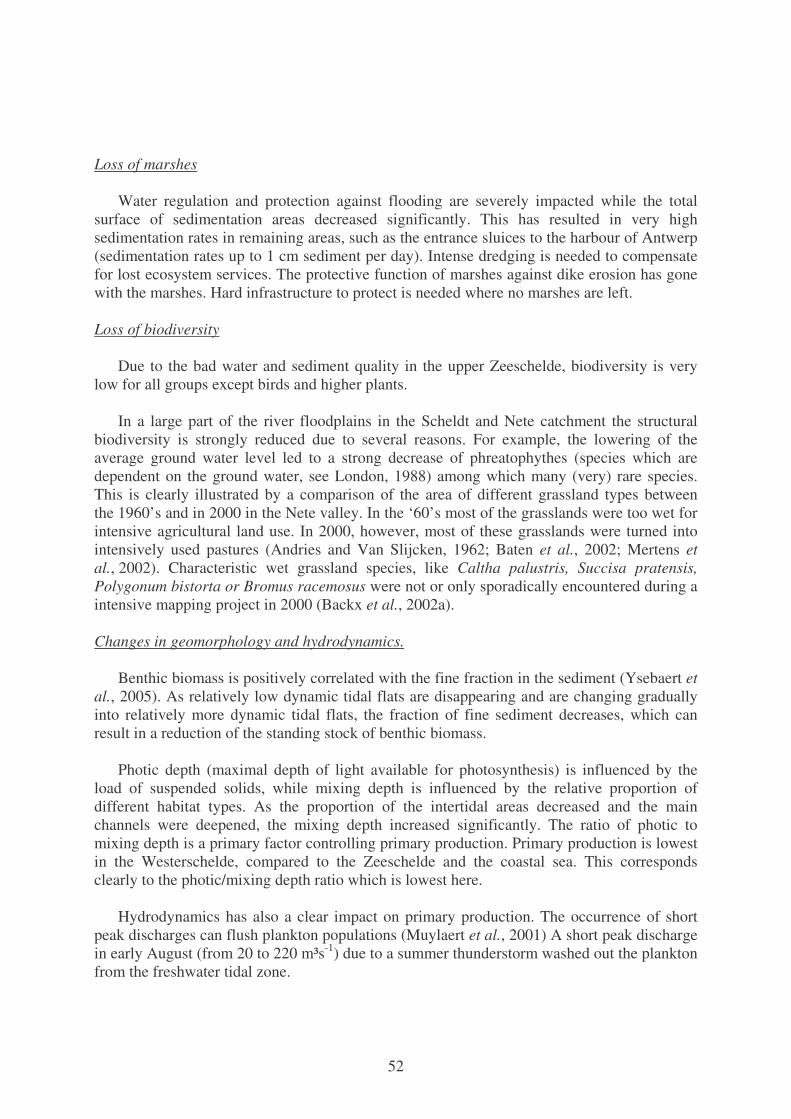
52
Loss of marshes Water regulation and protection against flooding are severely impacted while the total
surface of sedimentation areas decreased significantly. This has resulted in very high sedimentation rates in remaining areas, such as the entrance sluices to the harbour of Antwerp (sedimentation rates up to 1 cm sediment per day). Intense dredging is needed to compensate for lost ecosystem services. The protective function of marshes against dike erosion has gone with the marshes. Hard infrastructure to protect is needed where no marshes are left.
Loss of biodiversity
Due to the bad water and sediment quality in the upper Zeeschelde, biodiversity is very
low for all groups except birds and higher plants. In a large part of the river floodplains in the Scheldt and Nete catchment the structural
biodiversity is strongly reduced due to several reasons. For example, the lowering of the average ground water level led to a strong decrease of phreatophythes (species which are dependent on the ground water, see London, 1988) among which many (very) rare species. This is clearly illustrated by a comparison of the area of different grassland types between the 1960’s and in 2000 in the Nete valley. In the ‘60’s most of the grasslands were too wet for intensive agricultural land use. In 2000, however, most of these grasslands were turned into intensively used pastures (Andries and Van Slijcken, 1962; Baten et al., 2002; Mertens et al., 2002). Characteristic wet grassland species, like Caltha palustris, Succisa pratensis, Polygonum bistorta or Bromus racemosus were not or only sporadically encountered during a intensive mapping project in 2000 (Backx et al., 2002a).
Changes in geomorphology and hydrodynamics.
Benthic biomass is positively correlated with the fine fraction in the sediment (Ysebaert et
al., 2005). As relatively low dynamic tidal flats are disappearing and are changing gradually into relatively more dynamic tidal flats, the fraction of fine sediment decreases, which can result in a reduction of the standing stock of benthic biomass.
Photic depth (maximal depth of light available for photosynthesis) is influenced by the
load of suspended solids, while mixing depth is influenced by the relative proportion of different habitat types. As the proportion of the intertidal areas decreased and the main channels were deepened, the mixing depth increased significantly. The ratio of photic to mixing depth is a primary factor controlling primary production. Primary production is lowest in the Westerschelde, compared to the Zeeschelde and the coastal sea. This corresponds clearly to the photic/mixing depth ratio which is lowest here.
Hydrodynamics has also a clear impact on primary production. The occurrence of short
peak discharges can flush plankton populations (Muylaert et al., 2001) A short peak discharge in early August (from 20 to 220 m³s-1) due to a summer thunderstorm washed out the plankton from the freshwater tidal zone.
53
Filter function Biodiversity contributes significantly to the self-purifying capacity of estuaries, which are
known to reduce nutrient and pollutant loads to the coastal zone. The N load is strongly impacted by pelagic and intertidal denitrification. The N load from the catchment to the estuary changed from 55 000 tons in 1974 (Billen et al., 1985) to 66 000 in 1985 (Soetaert and Herman, 1995) and 70 000 tons in 2002 (Cox et al., in prep.). The export to the North Sea increased however from 27 500 over 49 500 to 51 800 tons; the retention in the estuary was reduced from 45 % to 34 and 30 % respectively. This is partly due to the improved water quality and the linked reduction of pelagic denitrification, but is partly also dependent on poor ecological functioning and marsh habitat reduction. Marshes can for example strongly impact nutrient ratios increasing dissolved Si-concentrations, while reducing N loads (Gribsholt et al., 2005; Struyf et al., 2006).
From this selected review of some historical changes and the impact on services we can
conclude that major changes occurred in the river, floodplain and estuarine ecosystems over the last decades, some even over centuries, and that these all affected to a very large extent the ecosystem services that the habitats can deliver.
Quantification of services The quantification of ecosystem services is crucial to evaluate human impact on them.
Here, some recent work is summarised where we estimated the role of fresh water tidal marshes in the biogeochemistry of the estuary.
A whole ecosystem 15 N labelling experiment in a small freshwater tidal marsh along the
Scheldt, provided experimental evidence for the large potential of the freshwater marshes to enhance nitrogen retention and processing (Gribsholt et al., 2005, 2006). The marshes strongly stimulate the nitrification of ammonia to nitrate, and transformation of nitrogen speciation (through both denitrification and nitrification) was equally important as the (partly temporal) retention of N. Roots, aboveground vegetation, sediment and plant litter retained about 4 % of the added ammonia, while 9 % of the added ammonia was nitrified. Although denitrification was not directly measured during the experiment, up to 14 % of the added ammonia was estimated to be ultimately removed from the estuarine ecosystem through denitrification in the freshwater marsh.
Tidal freshwater marshes contain huge stocks of biogenic Si (BSi), both in sediment and
vegetation (Struyf et al., 2005). BSi is easily soluble if compared to mineral Si, which is considered nearly inert at biological timescales (Van Cappellen, 2003). The high loading of tidal freshwater marshes, dominated by Phragmites australis, with such a reactive silica stock, effectively makes them dissolved silica buffers in the estuarine environment. Dissolution of BSi enriches the pore water with dissolved silica compared to the estuarine pelagic water. Pore water DSi concentrations in the tidal freshwater marshes along the Scheldt can be one order of magnitude higher than the concentration of DSi in tidal inundation water in summer. Yearly averaged, the pore water DSi concentrations are about 500 µM (or 14 mg L-1), while DSi concentrations are maximally around 300 µM in the pelagic, and can drop as low
54
as 10 µM in summer there (Struyf et al., 2005). As a result of this BSi-recycling mechanism, tidal freshwater marshes act as buffers within the estuarine Si-cycling: they will export most DSi, when the DSi-content in the inundation water and the pelagic is depleted mostly (Struyf et al., 2006). DSi ratios to N and P, are very important in the occurrence of harmful phytoplankton blooms in the coastal region. As DSi-buffers, tidal marshes partly buffer human over-input of N and P into estuaries. Both sediment and vegetation play a similar role in this mechanism, that of a recyclable stock of Si.
Can we use the approach of ecosystem services as the basis for an ecological restoration or for ecosystem management? From service to surface
The complexity of the system as described above is high and it is clear that the classical
approach of nature conservation alone will probably not succeed in protecting biodiversity. It is also clear that the many ecosystem services delivered by the estuary are of utmost importance to human society: the loss of these services, as described, can only be compensated for by expensive management measures (Costanza et al., 1997; MA, 2005). A restoration plan for the estuary was constructed based on the ecosystem services. A comprehensive review of all the types of services was made and this for different parts of the system, as the importance of different services might differ strongly in space. Based on research as described above, the present state of each service was estimated and measures to improve it were enumerated. A restoration plan should consist of all these measures (table. 2).
However to work out such a restoration plan, we need to quantify the measures we need,
e.g. what surface of which habitat is needed where? Contrary to most restoration plans, no historical or geographical references were used but we tried to quantify the ecosystem services we want the system to deliver: e.g. maximum load of nutrients allowed towards the North Sea, the flood volume to be stored in the estuary, the amount of Si regeneration though marshes to prevent Si limitation for diatoms, the population size of some selected species etc. Based on both modelling and basic ecological knowledge and theory, these different goals were translated into the surface areas of the different habitats needed (Adriaenssens et al., 2005).
To reach the required safety level for protection against flooding, it was calculated, using
an advanced hydrodynamic model, that 1800 ha of flood control areas are needed along the Scheldt estuary to reach the required safety against flooding (IMDC, 2003). Flood control areas are low laying polders near the river, surrounded by dikes. The dike near the estuary is lower than the ring dike to allow overtopping of the dike at high water during storm tides. At low tide, the water is flowing back to the estuary through big sluices in the dike.
Similarly, it was calculated that about 1300 ha of marshes and 500 ha of tidal flats extra
are needed to take away Si limitation, reduce N loads, provide enough benthic biomass for migrating and wintering waterbirds etc. On top of that about 4000 ha of non tidal wetlands are required as habitat for rare species, to buffer peak discharges, etc.
55
This approach of defining and quantifying ecosystems services and consequently translating these in surface areas of different habitats needed was approved by the Flemish government in 2005 and now the necessary steps are taken to establish about 4000 ha of new wetlands along the estuary in the next 15 years.
Integrating services: Pilot project Lippenbroek
To derive the surface areas mentioned it is important to combine several services in one
habitat. Indeed biodiversity development as well as flood storage and biogeochemical processes, should be combined in the same habitat. This requires new concepts, an example of which is a flood control area (FCA) with a controlled reduced tide (CRT). For safety reasons, FCAs are necessary, however they are flooded only occasionally during storm surges. It is however, perfectly possible to introduce a tidal regime in a FCA by using culverts in the dike. This is done in such a way that the tidal system allows the development of a marsh system but at the same time the storage capacity of the area for floodwater is retained. This innovative concept of introducing a CRT into a FCA has been implemented in the pilot project “Lippenbroek”, the world’s first FCA-CRT (Cox et al., 2006; Maris et al., in press). The use of high positioned culverts that function as inlet, combined with very lowly situated outlet sluices, distinguishes the FCA-CRT Lippenbroek from other restoration projects with tidal control (e.g. Breebaert polder, see Pelletier et al., 2004). Unlike these systems with a simple culvert or sluice, the combination of high inlet and low outlet allows the introduction of a big spring neap tidal variation. The polder thus faces a huge range of inundation frequencies, essential for the development of a diverse tidal marsh ecosystem.
Operational for only half a year, the Lippenbroek clearly delivers some important
ecosystem functions. Oxygen-poor estuarine water that enters the CRT is enriched up to 80 % saturation or more at the outflow. Nutrients are removed, e.g. the total dissolved nitrogen concentration was reduced by 25 to 50 % during one tidal cycle in the Lippenbroek. The CRT also plays an important role in the dissolved silica recycling.
As the Lippenbroek project is a small scale pilot study (8 ha of marsh) this has a fully
negligible impact on the total biogeochemical functioning of the estuary. Based on an ecosystem model (Cox et al., 2006) however, it was shown that the realisation of all FCA-CRT’s will have a significant effect on the oxygen concentration in the Scheldt.
Conclusion Optimization of ecosystem services proved to be a promising approach to work out
ecological restoration. In the case of the Scheldt and the Nete, it was the key factor to convince politicians and decision makers to take ecological restoration seriously. However, much more work is needed to identify and quantify ecosystem services and relate these to human well-being and economic parameters. Furthermore, if we want to use the ecosystems services approach as a strategy to also protect biodiversity, a better understanding of the relation between functional and structural biodiversity is crucial.
56
A successful restoration plan should be based on a comparison between the quantified losses and the desired levels of services. This in turn must be translated into the surface and quality of each habitat needed to deliver the required amount of service. Modelling is an indispensable tool and field experiments are crucial to increase our understanding of the system.
The Millennium Ecosystem Assessment can be seen as a milestone and applying the
approach to a more regional level, as described in this paper, would be very important. In the water framework directive the basin approach is the basis. As water is the crucial link between all ecosystems from source to the coastal sea, applying the approach at the catchment and subcatchment level might be the most appropriate to do; with the water framework directive we have the possibility to do it.
Acknowledgments This research would not have been possible without the long standing financial support by
the division Zeeschelde from the Flemish Administration for Waterways and Maritime Affairs, now Waterwegen en Zeekanaal NV. The help and support of Jan Strubbe, Leo Meyvis, Wim Dauwe and Stefaan Nollet are especially acknowledged. Further financial support came from the Flemish Fund for Scientific Research trough the Scientific Community ‘Ecological characterization of European estuaries, with emphasis on the Schelde estuary’ (project nr. W 10/5 - CVW.D 13.816). and the Dutch-Flemish (project nr. G.0439.02) “The role of fresh water tidal marshes in transformation and retention of nitrogen in estuaries: an ecosystem 15N labeling study”.
References
Adriaensen, F., Van Damme, S., Van den Bergh, E., Brys, R., Cox, T., Jacobs, S., Konings, P., Maes, J., Maris, T., Mertens, W., Nachtergale, L., Struyf, E., Van Braeckel, A., Van Hove, D. and Meire, P. 2005. Instandhoudingsdoelstellingen Schelde-estuarium. Rapport Ecobe 05R.82.-Universiteit Antwerpen.
Andries, A. and Van Slijcken, A. 1962. Riviergrasland (vegetatiekartering van riviergrasland).-Landbouwtijdschrift, 15: 1-77.
Baeyens, W., Van Eck, G., Lambert, C., Wollast, R. and Goeyens, L. 1998. General description of the Scheldt estuary.-Hydrobiologia, 366: 1-14.
Backx, H., Mertens, W. and Meire, P. 2002. Ontwerp van een ecosysteemvisie voor de vallei van de Grote Nete. Deel 1. Systeembeschrijving. Onderzoeksopdracht MINA/105/99/01.-Universiteit Antwerpen.
Backx, H., Mertens, W. and Meire, P. 2002a. Ontwerp van een ecosysteemvisie voor de vallei van de Grote Nete. Deel 2. Vegetatiekartering. Onderzoeksopdracht MINA/105/99/01.-Universiteit Antwerpen.
Baeten, I. and Huybrechts, W. 2002. De historische bedding van de bevaarbare Nete. Verslag van het Instituut voor Natuurbehoud, 2002.2.-INBO, Brussels.
57
Baeten, I., Huybrechts, W. and De Becker. 2002. Graslanden in de vallei van de bevaarbare Nete. Grasland kartering 1957-1960. Verslag van het Instituut voor Natuurbehoud 2002.35. -INBO, Brussels.
Brady, N.C. and Weil, R.R. 1999. The nature and properties of soils. 12th edition.-Prentice-Hall, New Jersey.
Billen, G., Somville, M., De Becker, E. and Servais, P. 1985. A nitrogen budget of the Scheldt hydrographical basin.-Netherlands Journal of Sea Research, 19: 223-230.
Costanza, R, d’Arge, R., de Groot, R., Farber, S., Gasso, M., Hannon, B., Limburg, K., Naeem, S., O’Neill, R.V., Paruelo, J., Raskin, R.G., Sutton, P. and Van den Belt, M. 1997. The value of the world’s ecosystem services and natural capital.-Nature, 387: 253-260.
Cox, T., Maris, T., De Vleeschauwer, P., De Mulder, T., Soetaert, K. and Meire, P. 2006. Flood control areas as an opportunity to restore estuarine habitat.-Ecological Engineering, 28: 55-63.
De Deckere, E. and Meire, P. 2000. De ontwikkeling van een streefbeeld voor het Schelde estuarium op basis van de ecosysteemfuncties, benaderd vanuit de functie natuurlijkheid.-Universiteit van Antwerpen.
European Commission. 1998. Communication of the Commission and to the Parliament on a European community biodiversity strategy. Brussels, 4.02.98 COM (98) 42.
European Commission. 2006. Communication from the Commission halting the loss of biodiversity by 2010 and beyond. Sustaining ecosystem services for human well–being, Brussels, 22.5.2006 COM (2006) 216.
Franck, S., Dierckx, J., Menschaert, J., Van de Moortel, R., Pluymers, L. and Vansina, F. 2002. Ecologische inventarisatie en visievorming in het kader van integraal waterbeheer: Stroomgebied van de Kleine Nete – Aa.-Ministerie van de Vlaamse Gemeenschap, Brussels.
Gribsholt, B., Boschker, H.T.S., Struyf, E., Andersson, M., Tramper, A., De Brabandere, L., Van Damme, S., Brion, N., Meire, P., Dehairs, F., Middelburg, J.J. and Heip, C. 2005. Nitrogen processing in a tidal freshwater marsh : a whole ecosystem 15N labelling study.-Limnology and Oceanography, 50: 1945-1959.
Gribsholt, B., Struyf, E., Tramper, A., Andersson, M.G.I., Brion, N., De Brabandere, L., Van Damme, S., Meire, P., Middelburg, J.J., Dehairs, F. and Boschker, H.T.S. 2006. Ammonium transformation in a nitrogen-rich tidal freshwater marsh.-Biogeochemistry, 80: 289-298.
IMDC. 2003. Actualisatie van het Sigmaplan, Deelopdracht 3: Hydrologische en Hydraulische modellen, AWZ report I/R/A/11199/03038/SME.-AWZ, Brussels.
Londo, G. 1988. Nederlandse freatofyten.-Pudoc, Wageningen. Maris, T., Cox, T., Temmerman, S., De Vleeschauwer, P., Van Damme, S., De Mulder, T.,
Van den Bergh, E. and Meire, P. in press. Tuning the tide: creating ecological conditions for tidal marsh development in a controlled inundation area.-Hydrobiologia.
Meire, P., Ysebaert, T., Van Damme, S., Van den Bergh, E., Maris, T. and Struyf, E. 2005. The Scheldt estuary: a description of a changing ecosystem.-Hydrobiologia, 540: 1-11.
Mertens,W., Backx, H. and Meire, P. 2002. Ontwerp van een ecosysteemvisie van de vallei van de Grote nete. Deel 3: Natuurtypen en Potentiekaarten. Onderzoeksopdracht MINA/105/99/01. -Universiteit Antwerpen.
Millennium Ecosystem Assessment (MA). Ecosystems and human well-being: current state and trends.-Island Press, Washington D.C.
58
Muylaert, K., Van Wichelen, J., Sabbe, K. and Vyverman, W. 2001. Short-term phytoplankton dynamics in a freshwater tidal estuary.-Archiv für Hydrobiologie, 150: 269-288.
Pelletier, H., Wanningen, H., Speelman, B. and Esselink, P. 2004. Resultaten van een gedempt getijdenregime in polder Breebaart. De Levende Natuur, 105: 191-194.
Soetaert, K. and Herman, P. 1995. Nitrogen dynamics in the Westerschelde estuary (SW-Netherlands) estimated by means of an ecosystem model (MOSES).-Hydrobiologia, 311: 225-246.
Soetaert, K., Middelburg, J.J., Heip, C., Meire, P., Van Damme, S. and Maris, T. 2006. Long-term change in dissolved inorganic nutrients in the heterotrophic Scheldt estuary (Belgium, the Netherlands).-Limnology and Oceanography, 51: 409-423.
Struyf, E., Dausse, A., Van Damme, S., Bal, K., Gribsholt, B., Boschker, H.T.S., Middelburg, J.J. and Meire, P. 2006. Tidal marshes and biogenic silica recycling at the land-sea interface.-Limnology and Oceanography, 51: 838-846.
Struyf, E., Van Damme, S., Gribsholt, B., Middelburg, J.J. and Meire, P. 2005. Biogenic silica in freshwater marsh sediments and vegetation.-Marine Ecology Progress Series, 303: 51-60.
Temmerman, S., Govers, G., Meire, P. and Wartel, S. 2003. Modeling long-term tidal marsh growth under changing tidal conditions and suspended sediment concentrations, Scheldt estuary, Belgium.-Marine Geology, 193: 151-169.
Temmerman, S., Govers, G., Wartel, S. and Meire, P. 2004. Modelling estuarine variations in tidal marsh sedimentation: response to changing sea level and suspended sediment concentrations.-Marine Geology, 212: 1–19.
Van Cappellen, P. 2003. Biomineralisation and global biogeochemical cycles.-Reviews in Mineralogy and Geochemistry, 54: 357-381.
Van den Bergh, E., Van Damme, S., Graveland, J., de Jong, D.J., Baten, I. and Meire, P. 2003. Studierapport ontwikkelingsmaatregelen te behoeve van de ontwikkelingsschets voor 2010 voor het Schelde estuarium. (NOPSE) Werkdocument/RIKZ/OS/2003.825x.-INBO, Brussels.
Van den Broeck, A. 1992. Het hoofd boven water houden, Waterbeheersing in het Netebekken tijdens de 18e eeuw. In: Liers genootschap voor geschiedenis (Eds.).-Lyra Elegans, Jaarboek 2, Lier.
Vroon, J., Storm, C. and Coosen J. 1997. Westerschelde, stram of struis? Eindrapport van het project Oostwest, een studie naar de beïnvloeding van fysische en verwante biologische patronen in een estuarium. Rapport RIKZ-97.023. –RIKZ, Middelburg. ISBN 90-369-3441-9.
Ysebaert, T., Fettweis, M., Meire, P. and Sas, M. 2005. Benthic variability in intertidal soft-sediments in the mesohaline part of the Schelde estuary.-Hydrobiologia, 540: 197-216.
59
Forest Ecosystem Assessment in Flanders – a selective review
Martin Hermy 1, Kris Verheyen 2, Bart Muys 1, Jos Van Orshoven 1
1 K.U.Leuven, dept Land Management & Economics, Division Forest, Nature and Landscape; 2 University of Ghent, Laboratory of Forestry
Introduction Under both the current and the future predicted climate, forests form the dynamic end
stage of succession for more than 90 % of the area of Flanders. Abandonment of other land use forms (e.g. farmland) will naturally initiate a development towards forest. This also means that deforestation is, in principle, reversible. Yet succession towards a mature forest ecosystem is slow. For instance, it may take decades or even centuries before typical forest plant species colonise young forest, even when the climax trees in these forests have been planted to speed up the development of a closed canopy (e.g. Verheyen et al., 2003, Graae et al., 2004, Flinn and Vellend, 2005, Hermy and Verheyen, 2007). In an evolutionary context most forest species are adapted to the predictable and stable environment forests in a temperate climate offer. Natural selection under these conditions favors those species leaving few, but well prepared descendants (cf. Whigham, 2004). Hence, under normal conditions, forests are slowly changing systems.
This strongly contrasts with the rapidly changing economic and social environment as a
consequence of an increasing globalization. In contemporary society drivers of change are omnipresent. They threaten the intrinsically low-dynamic nature of forests and the ecosystem functions they offer. One of direct drivers of change is population density and its consequences. At present population density in Flanders is over 430 people per km², ranging from 325 in the province of Limburg to 572 in the province of Antwerp1. Also the population is living at high densities over the complete area of Flanders giving it an impression of one big cloud city. Urbanization (incl. industrialization) increases quickly and threatens the few remaining open spaces. Over a period of 23 years the built- up area increased from 1237.2 km² in 1980 to 2016.3 km², i.e. at an average rate of 33.9 km² per year2. This puts a serious threat to natural and semi-natural land cover types such as forests.
In this paper we present elements of a forest ecosystem assessment for Flanders taking
into account the scheme put forward by the MA (WRI, 2003). At present a full ecosystem assessment is not possible, hence a rather selective review is presented.
1 http://statbel.fgov.be/figures/dsp_nl.asp 2 based on : http://statbel.fgov.be/figures/d130_nl.asp
60
Forest ecosystem services (FES) The benefits people may obtain from forests are highly diverse and, particularly in densely
populated regions, this urges for a multifunctional forest management, as has been implemented by the Flemish forest law (Bosdecreet) of 1990. Ecosystem services range from primary supporting services to provisioning, regulating and cultural services (WRI, 2003). Supporting services are essential for the other services and include soil formation, nutrient cycling and primary production. The latter clearly strongly depend on the forest area and forest biodiversity, as indicated by its composition and structure. So both forest area and biodiversity may be considered essential indicators for these services. Provisioning services provide people with products such as wood, water, food and genetic resources. Regulating services relate to the buffering of climate, water purification and control of air quality flood and drought. Provisioning and regulating services both have been indicated as use values or as values linked to a potential use in future (option values) (cf. Pearce and Moran, 1994). Cultural services include recreation, educational, aesthetic, cultural heritage and other non-material benefits (MA, 2003) Apart from recreation, cultural services relate to non-use values and option values. An exhaustive evaluation of all these services in Flemish forests is beyond the scope of this paper. In what follows, we selectively highlight some major services or parts of these. As the supporting services determine to a large extent the other services a forest ecosystem can provide, they will be dealt with in more detail.
Supporting services
Forest area: an essential prerequisite and ecosystem indicator An important prerequisite for FES is area; it also has a strong effect on forest biodiversity.
Forest area therefore is the most important indicator for a forest ecosystem service assessment. Without a sufficient area not a single forest ecological service can be rendered. Therefore monitoring forest area is crucial. The present area is about 146 000 ha (i.e. 11 % of the total area) and is very unevenly distributed over Flanders (figure. 1). Together with Ireland (10 %), the Netherlands (11 %), the UK (12 %) Flanders belongs to the least forested regions of Europe (MCPFE, 2003) (table. 1). The amount of forest area per capita is, just like in the Netherlands, extremely low (about 0.02 ha per person). Compared to the European average of 1.42 ha forest per capita, this is extremely low (MCPFE, 2003).
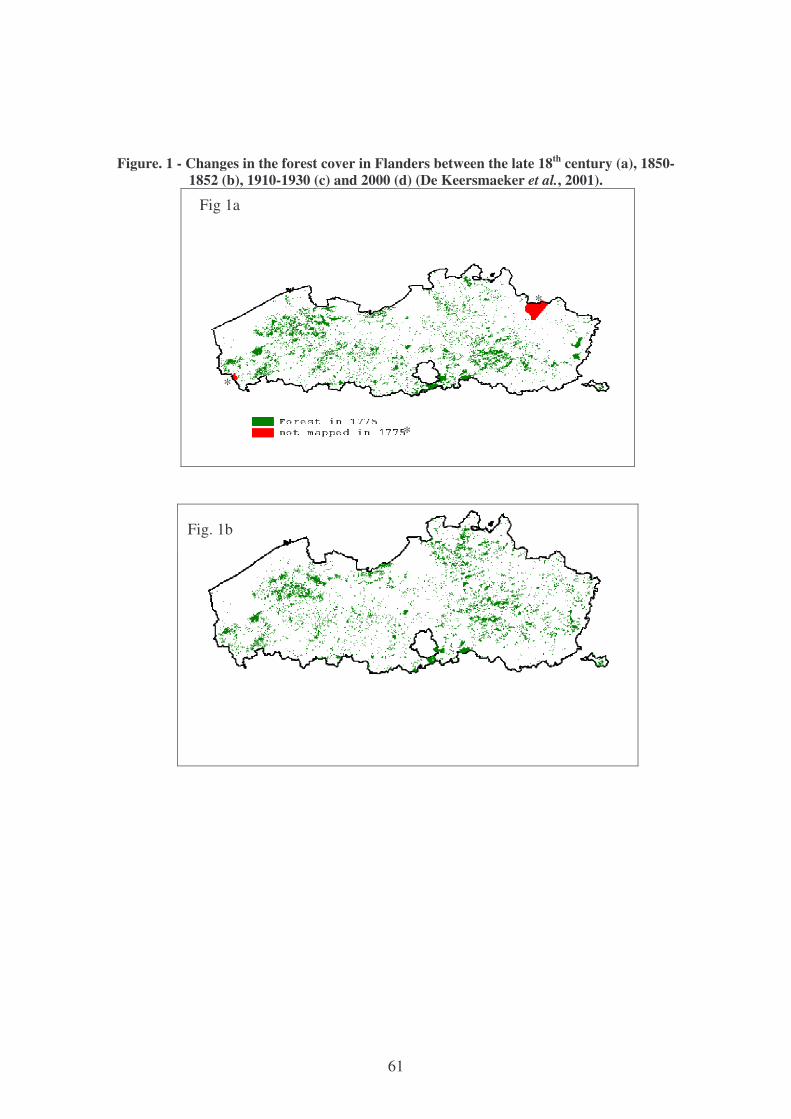
61
Figure. 1 - Changes in the forest cover in Flanders between the late 18th century (a), 1850-1852 (b), 1910-1930 (c) and 2000 (d) (De Keersmaeker et al., 2001).
Fig 1a
Fig. 1b
*
*
*
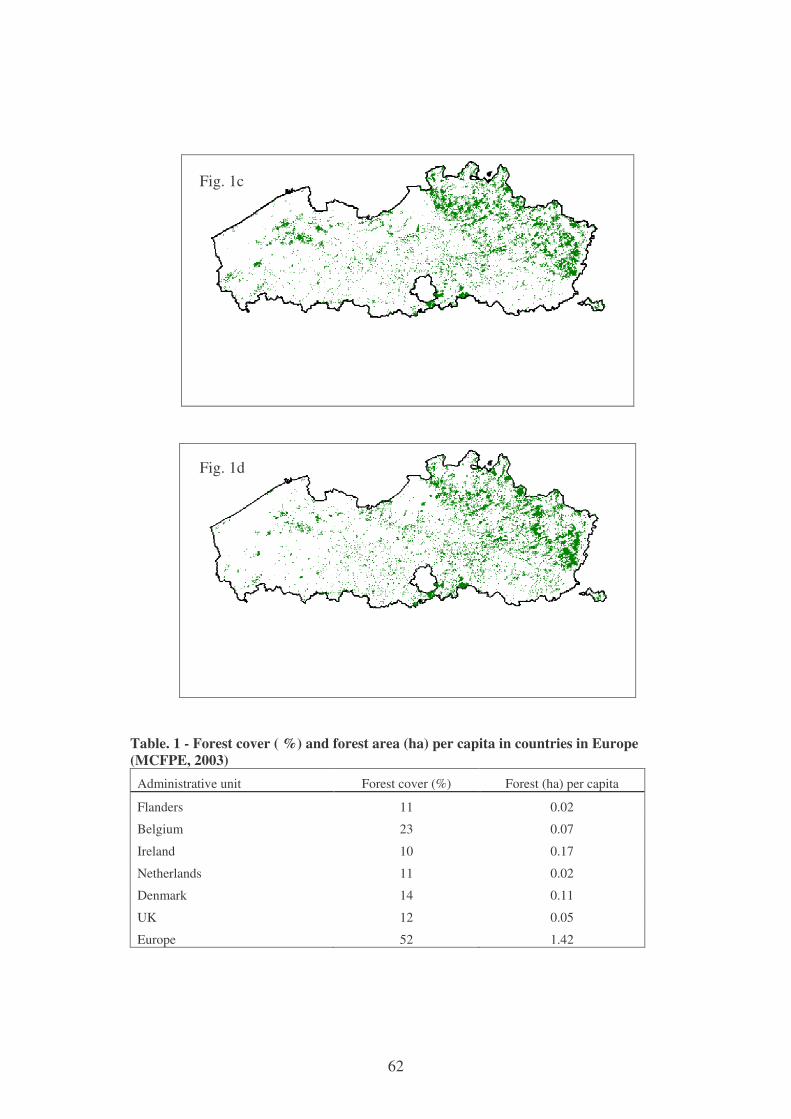
62
Table. 1 - Forest cover ( %) and forest area (ha) per capita in countries in Europe (MCFPE, 2003)
Administrative unit Forest cover (%) Forest (ha) per capita
Flanders 11 0.02
Belgium 23 0.07
Ireland 10 0.17
Netherlands 11 0.02
Denmark 14 0.11
UK 12 0.05
Europe 52 1.42
Fig. 1c
Fig. 1d
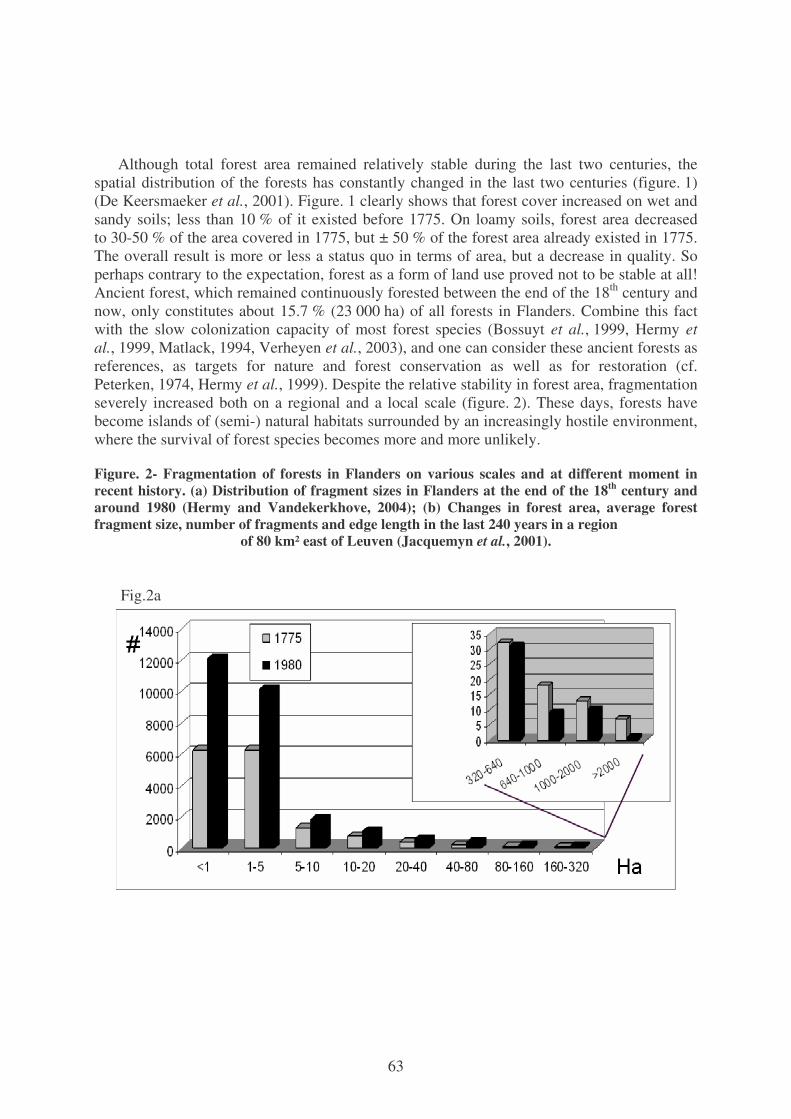
63
Although total forest area remained relatively stable during the last two centuries, the spatial distribution of the forests has constantly changed in the last two centuries (figure. 1) (De Keersmaeker et al., 2001). Figure. 1 clearly shows that forest cover increased on wet and sandy soils; less than 10 % of it existed before 1775. On loamy soils, forest area decreased to 30-50 % of the area covered in 1775, but ± 50 % of the forest area already existed in 1775. The overall result is more or less a status quo in terms of area, but a decrease in quality. So perhaps contrary to the expectation, forest as a form of land use proved not to be stable at all! Ancient forest, which remained continuously forested between the end of the 18th century and now, only constitutes about 15.7 % (23 000 ha) of all forests in Flanders. Combine this fact with the slow colonization capacity of most forest species (Bossuyt et al., 1999, Hermy et al., 1999, Matlack, 1994, Verheyen et al., 2003), and one can consider these ancient forests as references, as targets for nature and forest conservation as well as for restoration (cf. Peterken, 1974, Hermy et al., 1999). Despite the relative stability in forest area, fragmentation severely increased both on a regional and a local scale (figure. 2). These days, forests have become islands of (semi-) natural habitats surrounded by an increasingly hostile environment, where the survival of forest species becomes more and more unlikely. Figure. 2- Fragmentation of forests in Flanders on various scales and at different moment in recent history. (a) Distribution of fragment sizes in Flanders at the end of the 18th century and around 1980 (Hermy and Vandekerkhove, 2004); (b) Changes in forest area, average forest fragment size, number of fragments and edge length in the last 240 years in a region
of 80 km² east of Leuven (Jacquemyn et al., 2001). Fig.2a
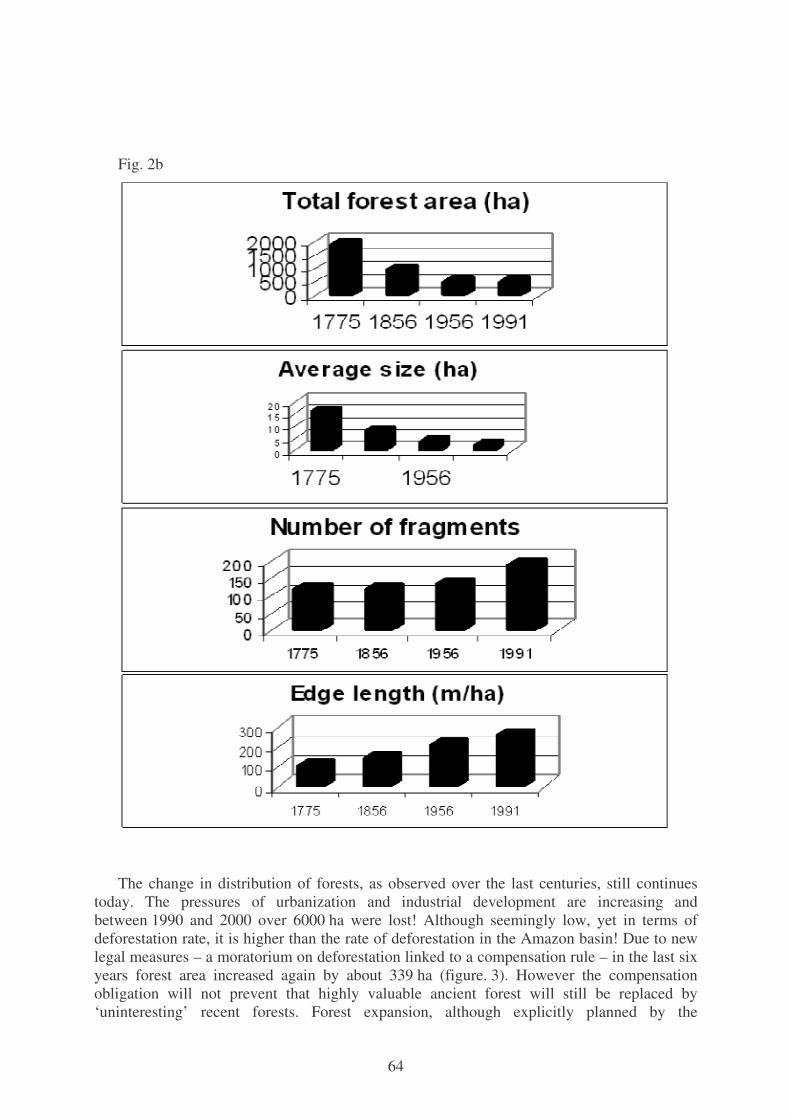
64
Fig. 2b
The change in distribution of forests, as observed over the last centuries, still continues
today. The pressures of urbanization and industrial development are increasing and between 1990 and 2000 over 6000 ha were lost! Although seemingly low, yet in terms of deforestation rate, it is higher than the rate of deforestation in the Amazon basin! Due to new legal measures – a moratorium on deforestation linked to a compensation rule – in the last six years forest area increased again by about 339 ha (figure. 3). However the compensation obligation will not prevent that highly valuable ancient forest will still be replaced by ‘uninteresting’ recent forests. Forest expansion, although explicitly planned by the
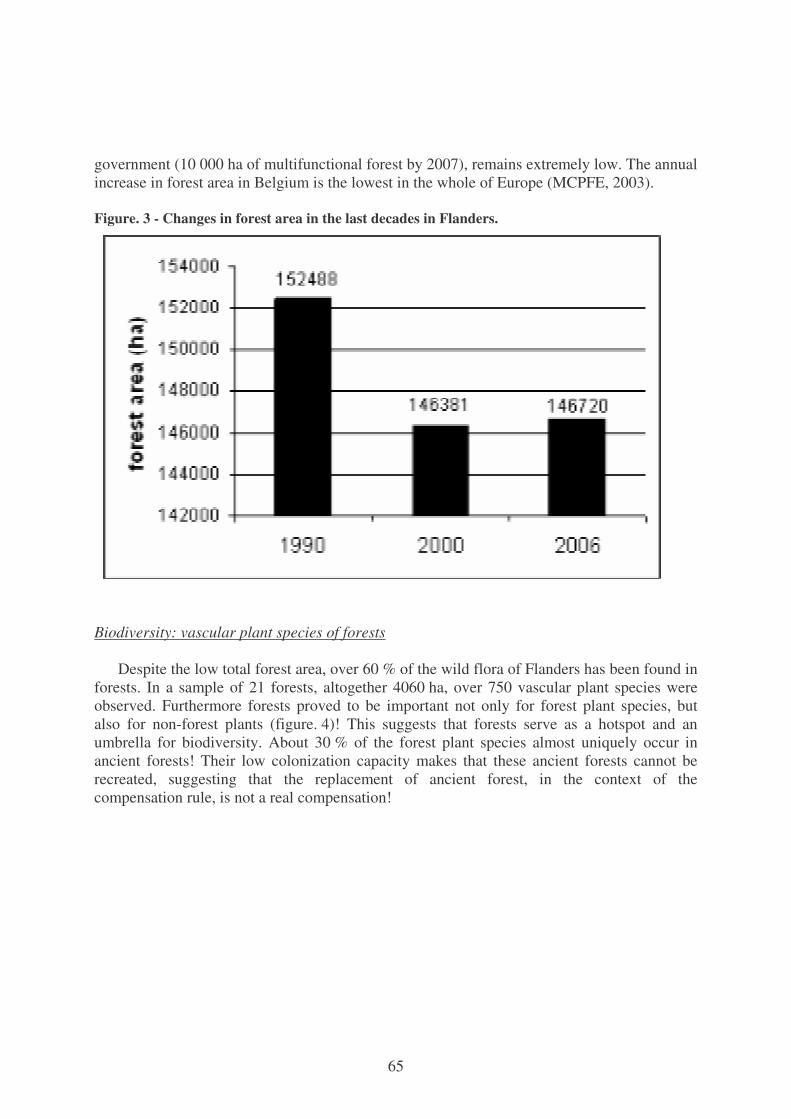
65
government (10 000 ha of multifunctional forest by 2007), remains extremely low. The annual increase in forest area in Belgium is the lowest in the whole of Europe (MCPFE, 2003).
Figure. 3 - Changes in forest area in the last decades in Flanders.
Biodiversity: vascular plant species of forests Despite the low total forest area, over 60 % of the wild flora of Flanders has been found in
forests. In a sample of 21 forests, altogether 4060 ha, over 750 vascular plant species were observed. Furthermore forests proved to be important not only for forest plant species, but also for non-forest plants (figure. 4)! This suggests that forests serve as a hotspot and an umbrella for biodiversity. About 30 % of the forest plant species almost uniquely occur in ancient forests! Their low colonization capacity makes that these ancient forests cannot be recreated, suggesting that the replacement of ancient forest, in the context of the compensation rule, is not a real compensation!
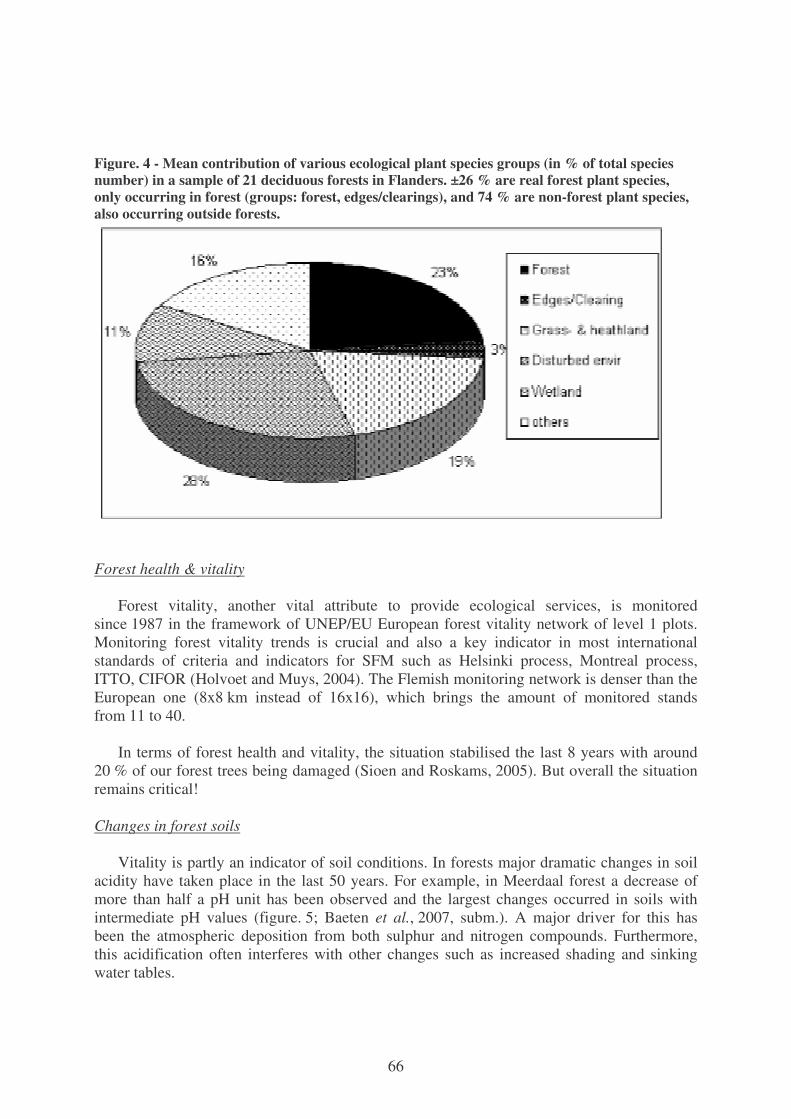
66
Figure. 4 - Mean contribution of various ecological plant species groups (in % of total species number) in a sample of 21 deciduous forests in Flanders. ±26 % are real forest plant species, only occurring in forest (groups: forest, edges/clearings), and 74 % are non-forest plant species, also occurring outside forests.
Forest health & vitality Forest vitality, another vital attribute to provide ecological services, is monitored
since 1987 in the framework of UNEP/EU European forest vitality network of level 1 plots. Monitoring forest vitality trends is crucial and also a key indicator in most international standards of criteria and indicators for SFM such as Helsinki process, Montreal process, ITTO, CIFOR (Holvoet and Muys, 2004). The Flemish monitoring network is denser than the European one (8x8 km instead of 16x16), which brings the amount of monitored stands from 11 to 40.
In terms of forest health and vitality, the situation stabilised the last 8 years with around
20 % of our forest trees being damaged (Sioen and Roskams, 2005). But overall the situation remains critical!
Changes in forest soils
Vitality is partly an indicator of soil conditions. In forests major dramatic changes in soil
acidity have taken place in the last 50 years. For example, in Meerdaal forest a decrease of more than half a pH unit has been observed and the largest changes occurred in soils with intermediate pH values (figure. 5; Baeten et al., 2007, subm.). A major driver for this has been the atmospheric deposition from both sulphur and nitrogen compounds. Furthermore, this acidification often interferes with other changes such as increased shading and sinking water tables.

67
Figure. 5 - Changes of soil pH in Meerdaalwoud between 1954 and 2000 (a); changes are largest at intermediate pH levels (b) (Baeten et al., 2007, subm.).
Partly as a consequence of acidification and of an extensification of forest management
(with longer rotation cycles and even an abandonment of management) but mainly by the continued aggradation of the many recent forests, stocks of soil organic matter content have increased considerably (figure. 6) (Lettens et al., 2005).
Fig. 5a
Fig. 5b
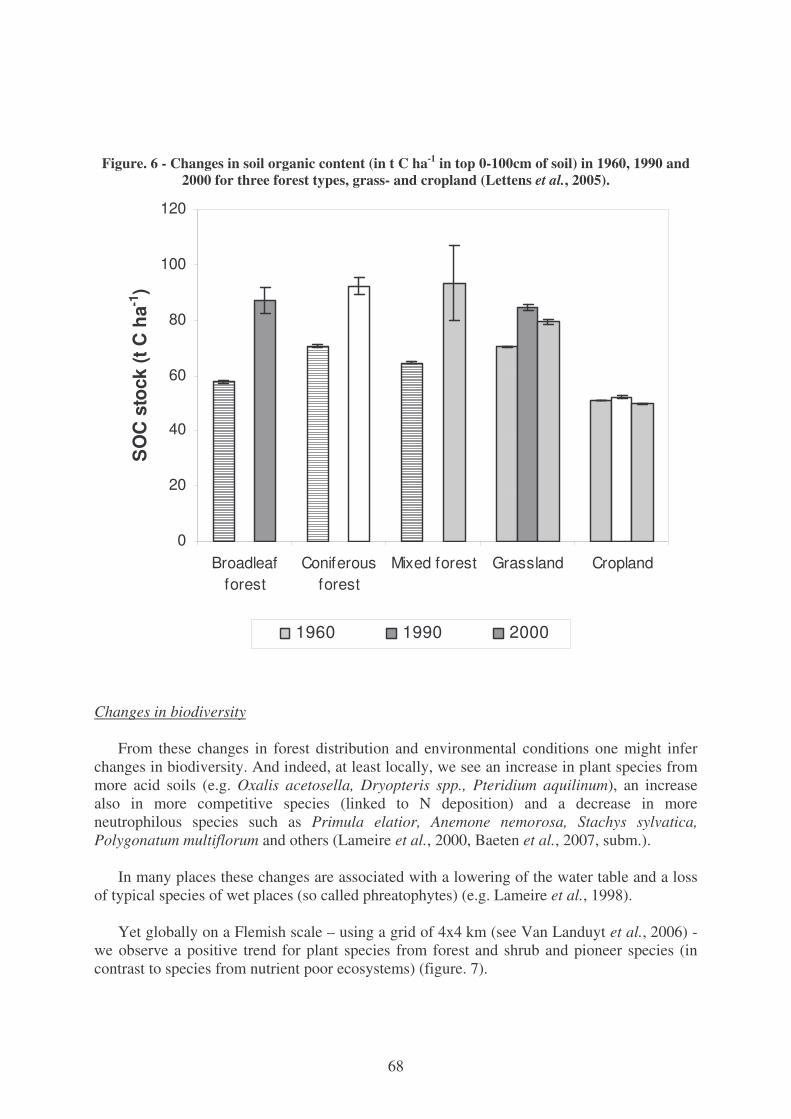
68
Figure. 6 - Changes in soil organic content (in t C ha-1 in top 0-100cm of soil) in 1960, 1990 and 2000 for three forest types, grass- and cropland (Lettens et al., 2005).
Changes in biodiversity
From these changes in forest distribution and environmental conditions one might infer
changes in biodiversity. And indeed, at least locally, we see an increase in plant species from more acid soils (e.g. Oxalis acetosella, Dryopteris spp., Pteridium aquilinum), an increase also in more competitive species (linked to N deposition) and a decrease in more neutrophilous species such as Primula elatior, Anemone nemorosa, Stachys sylvatica, Polygonatum multiflorum and others (Lameire et al., 2000, Baeten et al., 2007, subm.).
In many places these changes are associated with a lowering of the water table and a loss
of typical species of wet places (so called phreatophytes) (e.g. Lameire et al., 1998). Yet globally on a Flemish scale – using a grid of 4x4 km (see Van Landuyt et al., 2006) -
we observe a positive trend for plant species from forest and shrub and pioneer species (in contrast to species from nutrient poor ecosystems) (figure. 7).
0
20
40
60
80
100
120
Broadleafforest
Coniferousforest
Mixed forest Grassland Cropland
SO
C s
tock
(t C
ha-1
)
1960 1990 2000
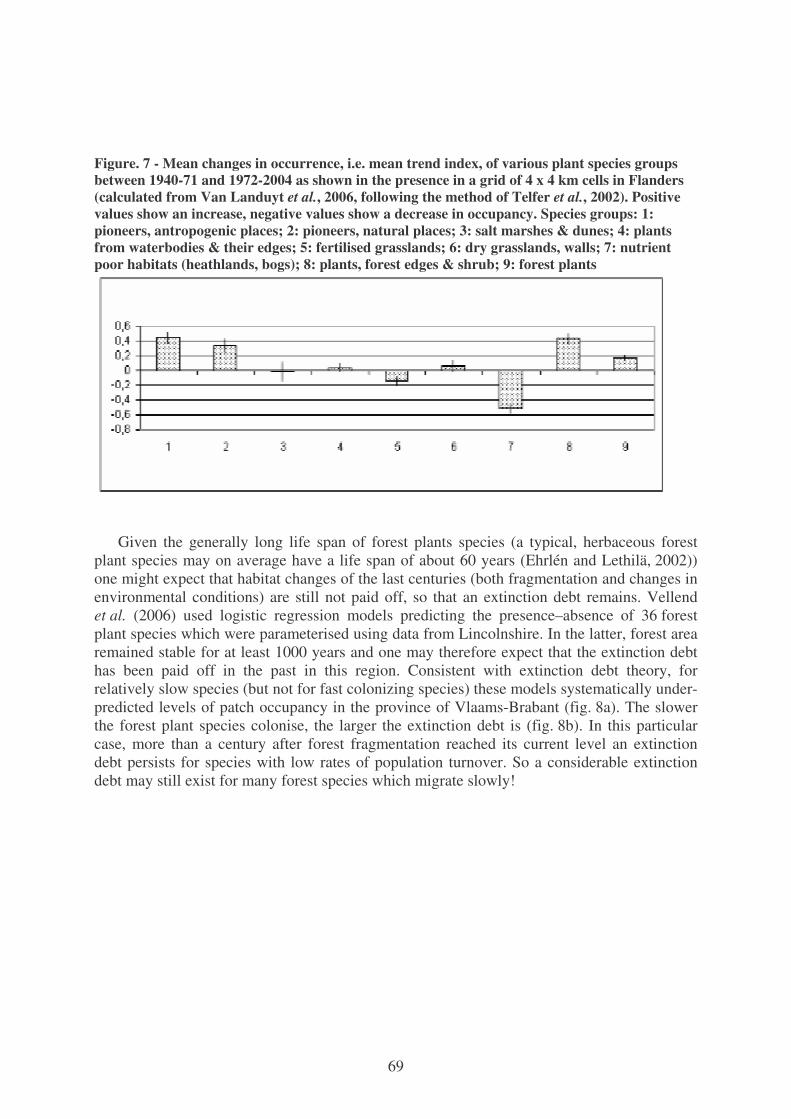
69
Figure. 7 - Mean changes in occurrence, i.e. mean trend index, of various plant species groups between 1940-71 and 1972-2004 as shown in the presence in a grid of 4 x 4 km cells in Flanders (calculated from Van Landuyt et al., 2006, following the method of Telfer et al., 2002). Positive values show an increase, negative values show a decrease in occupancy. Species groups: 1: pioneers, antropogenic places; 2: pioneers, natural places; 3: salt marshes & dunes; 4: plants from waterbodies & their edges; 5: fertilised grasslands; 6: dry grasslands, walls; 7: nutrient poor habitats (heathlands, bogs); 8: plants, forest edges & shrub; 9: forest plants
Given the generally long life span of forest plants species (a typical, herbaceous forest
plant species may on average have a life span of about 60 years (Ehrlén and Lethilä, 2002)) one might expect that habitat changes of the last centuries (both fragmentation and changes in environmental conditions) are still not paid off, so that an extinction debt remains. Vellend et al. (2006) used logistic regression models predicting the presence–absence of 36 forest plant species which were parameterised using data from Lincolnshire. In the latter, forest area remained stable for at least 1000 years and one may therefore expect that the extinction debt has been paid off in the past in this region. Consistent with extinction debt theory, for relatively slow species (but not for fast colonizing species) these models systematically under-predicted levels of patch occupancy in the province of Vlaams-Brabant (fig. 8a). The slower the forest plant species colonise, the larger the extinction debt is (fig. 8b). In this particular case, more than a century after forest fragmentation reached its current level an extinction debt persists for species with low rates of population turnover. So a considerable extinction debt may still exist for many forest species which migrate slowly!
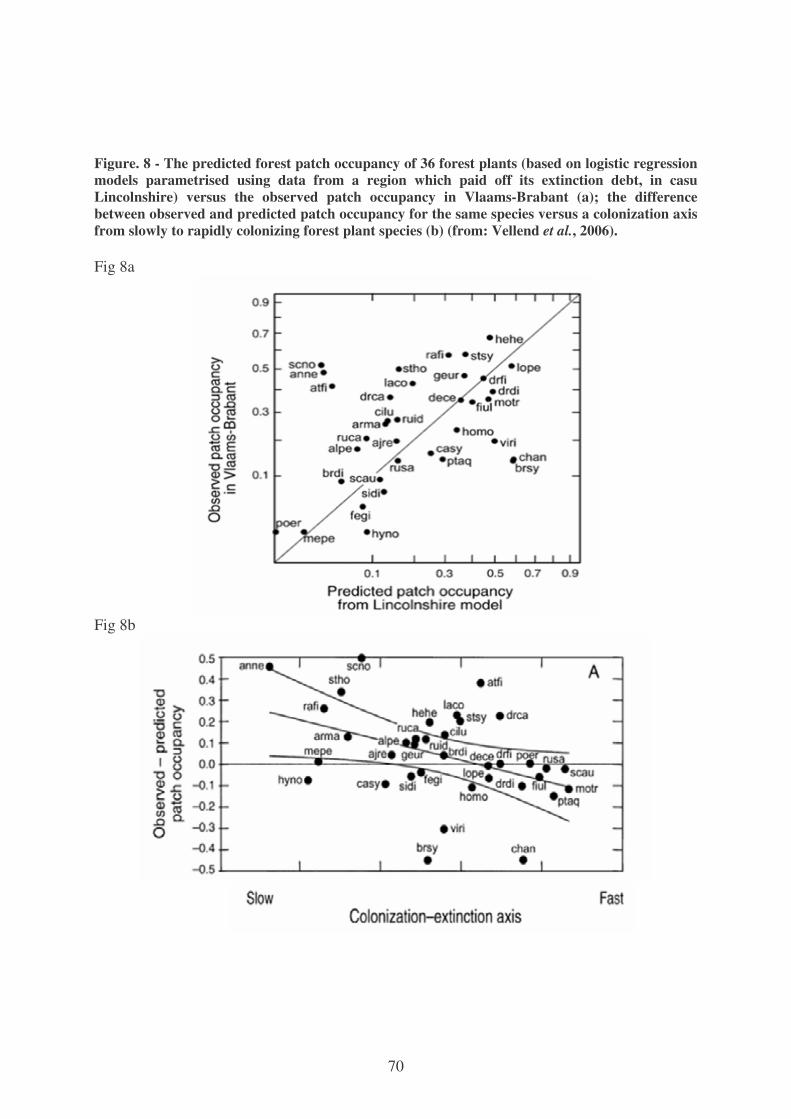
70
Figure. 8 - The predicted forest patch occupancy of 36 forest plants (based on logistic regression models parametrised using data from a region which paid off its extinction debt, in casu Lincolnshire) versus the observed patch occupancy in Vlaams-Brabant (a); the difference between observed and predicted patch occupancy for the same species versus a colonization axis from slowly to rapidly colonizing forest plant species (b) (from: Vellend et al., 2006).
Fig 8a
Fig 8b
71
For other species, such as breeding bird species, there is generally better news. A considerable number of species indeed increased significantly – most of them related to older forest, with larger sizes of trees and also more dead wood. Strix aluco, Parus palustris, Regulus regulus, P. cristatus and P. ater all showed an increase between 20 and 50 %. Seven species even increased by more than 50 %: Sitta europaea, Buteo buteo, Dryocopus minor, D. medius, Accipiter nisus, Pernis apivorus, D. martius (INBO, 2005). These bird species clearly benefited from the extensification of forest management yielding an older forest, with larger tree diameters, more dead wood and longer rotation cycles.
This all seems to suggest that the active forest policy particularly since the Flemish forest
law of 1989 at least partly prevented a steep decrease in biodiversity.
Regulating services: Sink for greenhouse gases Belgian forests have acted throughout the period 1990-2000 as a carbon sink, amounting
to 3.08 Mt CO2 eq. yr-1. They will remain acting as a carbon sink (BAU scenario) in the first commitment period (2008-2012) at a predicted rate of 2.71 Mt CO2 eq. yr-1. Deforestation in Flanders during the period 1990-2000 generated a carbon loss to the atmosphere of 0.16 Mt CO2 eq. yr-1 (see MCPFE, 2003).
Provisioning services: Biomass & primary productivity The average woody stand biomass in Flanders is about 216 m³ per ha and for the total
forest area stand biomass is estimated at 31 584 000 m³ (Waterinckx and Roelandt, 2001). This is considerably higher than the average volume in Europe, which is 110 m³/ha (MCPFE, 2003). The increase in biomass is also higher than on average in Europe. This tendency probably is due to nitrogen and CO2 fertilization.
Cultural services
Forest recreation The social and recreational function has gained considerable interest over the past
decades, partly as a consequence of the explicit recognition of these functions in the Flemish forest law. Between 1996 and 2000, people clearly made more visits to forests and other nature areas (Van Kerckhove, 2004). Accessibility to private forests (still about 70 % of the total forest area) has been stimulated through subsidies (since 1991) and a considerable number of play zones (about 1486 ha in 269 sites (VHBR, 2003) have been installed. A few examples give an impression of the popularity of forest areas in Flanders as recreation areas (table. 2).
72
Table. 2 - Yearly visitor estimates for a number of forest areas in Flanders (VHRB, 2003; Moons et al., 2000).
Forest complex Area (ha) Place Yearly visitor number (estimate)
Palingbeek 231 Ieper-Zillebeek 15,000-200,000Tillegem bos 117 Brugge 510,000-680,000Lippensgoed-Bulskampveld 220 Beernem 357,000-535,000Leen 225 Eeklo 125,000-135,000Meerdaalwoud-Heverleebos 1890 5 km S of Leuven 629,000-822,000
Between 1996 and 1999 an economic valuation of the recreational function was
performed in the Meerdaal-Heverlee forest complex (Moons et al., 2000) and by using the travel cost method these authors estimated the total recreational benefit to be between 13 794 495 € (lowest estimate) and 18 041 482 € (highest estimate). The value of wood production was at that time only about 322 260 €. Although this is only a local study, it clearly indicates the huge recreational value of forests in a densely populated region compared to their wood production service.
Why are forests important?
Flemish forests are important to the public for a great number of things. As part of the
valuation project of the Meerdaal-Heverlee forest complex a large scale questionnaire enquiry was carried out in Flanders, using a random walk sampling design (n=783; table. 3). For the general public forests are primarily seen as places for recreation and relaxation and traditional functions, such as wood production and hunting, are evaluated as less important. New is that the optional value – like the fact that the forest will be there for the use of the future generations – is considered important as well. This all seems to suggest the overwhelming and increasing importance of the cultural services of forests in a densely populated region. Apart from hotspots for biodiversity they surely also function as hotspots for society!
73
Table. 3 - Why are forests important for you? Results from a large scale questionnaire in Flanders between December 1998 and February 1999, n=783; Moons et al., 2000). Topics
ordered from most to least important. Function In order of importance % Use Forests as sites for relaxation & fresh air 79.3 Forests as sites for recreation 60.4 Non-use or option The idea that forests will be available for our “children” 55.2
The idea that one will be able to visit it in the future 37.5 The idea that the forest is there 28.6 Forests as sites for conservation of traditions and culture 13.3 Forests as spiritual sites 7.3 Use Forests as sites for production of wood 6.6 Forests as sites for hunting 2.7
Conclusion Forest is the potential natural vegetation cover for most of Flanders and this will remain so
under the predicted future climate. In this respect, forests may be considered a “natural credit”. Forests are also clearly an umbrella for biodiversity, but it is possible that our actually highly valuable ancient forests may still have to pay off a considerable extinction debt. Forests do have a long tradition of use by humans and this particularly holds for European forests. Compared to other terrestrial ecosystems, forests offer the best control against external forces from the sun, wind, precipitation, erosion, leaching of nutrients; their regulating functions have become increasingly important in a highly urbanised region. This is mainly a consequence of their complex structure. Yet the demands for regulating services are growing and the limits may have been reached. Provisioning services are still important and may increase again in future when demands for e.g. bio-energy increase. Stocks of wood and carbon in general have been growing and specific groups of biodiversity associated with wood have also increased considerably. Cultural services, particularly those associated with the recreational function, have increased greatly. Yet the forested area remains extremely low compared to many other regions of Europe and forest expansion has hardly occurred until now.
To conclude, it can be stated that – also in Flanders – human welfare and well- being
partly depend on the services provided by forest ecosystems. However, demands on forests are huge and a shift to a truly sustainable use of forest resources will be essential to assure its beneficial role for both the present and future generations.
74
References
Bossuyt, B., Hermy, M. and Deckers, J. 1999. Migration of herbaceous plant species across ancient-recent forest ecotones in central Belgium.-J. Ecol. 87: 628-638.
De Keersmaeker, L., Rogiers, N., Lauriks, R. and De Vos, B. 2001. Ecosysteemvisie bos Vlaanderen, ruimtelijke uitwerking van de natuurlijke bostypes op basis van bodemgroeperingseenheden en historische boskaarten. Report VLINA C97/06, AMINAL, afd. Natuur, Brussels, 109p.
Ehrlén, J. and Lethilä, K. 2002. How perennial are perennial plants?-Oikos 98: 308-322. Flinn, K.M. and Vellend, M. 2005. Recovery of forest plant communities in post-agricultural
landscapes.-Front. Ecol. Environ. 3: 243-250. Graae, B.J., Hansen, T. and Sunde, P.B. 2004. The importance of recruitment limitation in
forest plant species colonization: a seed sowing experiment.-Flora 199: 263-270. Hermy, M. and Vandekerkhove, K. 2004. Bosgebieden. In: Hermy M., De Blust G. and
Slootmaekers M. (Eds.), Natuurbeheer, p.307-359.-Uitg. Davidsfonds i.s.m. Argus vzw, Natuurpunt vzw en het IN, Leuven.
Hermy, M., Honnay, O., Firbank, L., Grashof-Bokdam, C. and Lawesson, J.E. 1999. An ecological comparison between ancient and other forest plant species of Europe, and the implications for conservation.-Biol. Conserv. 91: 9-22.
Holvoet, B. and Muys, B. 2004. Sustainable forest management worldwide: a comparative assessment of standards.-Intern. Forestry Review 6: 99-122.
Jacquemyn, H., Butaye, J. and Hermy, M. 2001. Forest plant species richness in small, fragmented mixed deciduous forest patches: the role of area, time and dispersal limitation.-J Biogeogr 28:801-812.
Lameire, S., Hermy, M. and Honnay, O. 2000. Two decades of change in the ground vegetation of a mixed deciduous forest in an agricultural landscape.-J. Veg. Sci. 11: 695-704.
Lettens, S., J., van Orshoven, J., Van Wesemael, B., Muys, B. and Perrin, D. et al. 2005. Soil organic carbon changes in landscape units of Belgium between 1960 and 2000 with reference to 1990.-Global Change Biology 11: 2128-2140.
Matlack, R.G. 1994.Plant species migration in a mixed-history forest landscape in eastern North America.-Ecology 75: 1491-1502.
MCPFE. 2003. State of Europe’s Forests 2003. The MCPFE report on sustainable forest management in Europe. MCPFE Liaison unit Vienna. http://www.mcpfe.org/
Millennium Ecosystem Assessment. 2003. Ecosystems and human well- being. A framework for assessment.-Island Press, Washington D.C.
Moons, E., Eggermont, K., Hermy, M. and Proost, S. 2000. Economische waardering van bossen. Een case-study van Heverleebos – Meerdaalwoud.-Garant, Leuven. 356p.
INBO. 2005. Natuurindicatoren. Boskwaliteit: Trends broedvogels van bossen (1990-2002). INBO, Brussels. www.natuurindicatoren.be.
Pearce, D.W. and Moran, W. 1994. The economic value of biodiversity.-Earthscan, London. Peterken, G.F. 1974. A method for assessing woodland flora for conservation using indicator
species.-Biol. Conserv. 6: 39-45. Sioen and Roskams, P. 2005. Natuurindicatoren, 2006, INBO, Brussels,
www.natuurindicatoren.be.
75
Telfer, M.G., Preston, C.D and Rothery, P. 2002. A general method for measuring relative change in range size from biological atlas data.-Biol.Conserv. 107: 99-109.
Van Kerckhove, G. 2004. Recreatie in bossen: wat mag wel en niet in het bos?-Bosrevue 9: 6-9.
Van Landuyt, W., Hoste, I., Vanhecke, L., Van den Bremt, P., Vercruysse, W. and De Beer, D. 2006. Atlas van de flora van Vlaanderen en het Brussels Gewest.-Instituut voor Natuur- en Bosonderzoek, Nationale Plantentuin van België and Flo.Wer, Brussels.
Vellend, M., Verheyen, K., Jacquemyn, H., Kolb, A., van Calster, H., Peterken, G.F. and Hermy, M. 2006. Extinction debt of forest plants persists for more than a century following habitat fragmentation.-Ecology 87: 542-548.
Verheyen, K., Guntenspergen, G., Biesbrouck, B. and Hermy, M. 2003. An integrated analysis of the effects of past land-use on forest plant species colonization at the landscape scale.-J. Ecol. 91: 731-742.
Verheyen, K., Honnay, O., Motzkin, G., Hermy, M. and Foster, D. 2003. Response of forest plant species to land-use change: a life-history based approach.-J. Ecol. 91: 563-577.
VHBR - Vlaamse Hoge Bosraad. 2003. Bossenverklaring. Uitg. Vlaamse Hoge Bosraad and afd. Bos en Groen, Brussels.
Waterinckx, M. and Roelandt, B. 2001. Bosinventaris van het Vlaamse Gewest. Rapport.-AMINAL, afd. Bos en Groen, Brussels.
Whigham, D. 2004. Ecology of woodland herbs in temperate deciduous forests.-Ann. Rev. Ecol. Syst. 35: 583-621.

76
77
La forêt wallonne, réalités, enjeux et prospective
Jacques Rondeux
Faculté universitaire des Sciences agronomiques, Gembloux Unité de Gestion des Ressources forestières et des Milieux naturels
Introduction La forêt wallonne, au début des années 2000, occupe 544 000 hectares (zones forestières),
ce qui correspond à un taux de boisement de 32 % (22 % pour la Belgique). Sa surface productive est estimée à 477 500 hectares quasiment également distribués entre peuplements feuillus et résineux (Lecomte et al., 2002 ; Lecomte et al., 2005). Elle se répartit à raison de 47 % de forêts publiques (soumises au régime forestier) et 53 % de forêts privées caractérisées par un très grand morcellement (Colson et al., 2002 ; Rondeux, 1991). Les quelques 100 000 propriétaires forestiers privés possèderaient en moyenne 2 à 3 hectares. La Wallonie présente un taux de boisement qui la situe au même rang que la France et l’Allemagne et sous la moyenne de l’Europe qui affiche un taux supérieur à 40 %. La surface boisée par habitant est de 0, 16 ha, chiffre constant depuis 50 ans, l’augmentation de la surface boisée étant grosso- modo un peu plus rapide que celle de la population.
Traditionnellement mise en avant par sa vocation ligneuse, cette forêt a surtout joué un
rôle économique. Devant les attentes nouvelles de la société et une prise de conscience croissante de la multitude de services, autres que sa seule production ligneuse (Rondeux, 1993), la forêt wallonne change progressivement de visage. Tout en gardant une vocation socio-économique largement dépendante des contingences culturelles et historiques, elle a évolué depuis les 50 dernières années. En passant le cap des années 2000, elle entre manifestement dans une ère où les poids respectifs des biens et services attendus vont vraisemblablement évoluer compte tenu de l’orientation multifonctionnelle largement prônée aujourd’hui. La manière avec laquelle cette multifonctionnalité est appliquée ou évoluera nécessite une particulière attention, d’autant que l’écosystème forestier est largement conditionné par le sol et le climat dont il s’avère de plus en plus qu’un changement significatif est inéluctable dans les prochaines dizaines d’années.
Des « fonctions » de la forêt aux « services » Dans les années 80, le rôle multifonctionnel de la forêt wallonne devient une
préoccupation grandissante, même si elle a toujours été présente. Dans les faits la production du bois était à ce point importante qu’elle laissait peu de place à d’autres utilisations des espaces boisés. Le besoin de transposer le concept de « multi-usages » dans l’organisation de la gestion de la forêt, en particulier publique, s’est traduit par la mise en œuvre
78
d’aménagements tenant compte de trois grands rôles dévolus aux massifs forestiers : production ligneuse, protection (sol, eau) et conservation (aspects biologiques et écologiques). D’où l’émergence dans les années 80 d’une « sectorisation » basée sur une hiérarchisation des fonctions au travers de zones où telle ou telle fonction était privilégiée sans pour autant exclure totalement les autres. Cette typologie a ensuite fait place fin des années 90, et dans la foulée des grandes conférences ministérielles internationales sur la protection des forêts, à un vocable imprégné des fondements mêmes du développement durable. L’approche multifonctionnelle prend en compte les fonctions économiques, écologiques et sociales.
La fonction économique concerne clairement la production de bois et la fonction sociale
de plus en plus celle relative à la récréation. La fonction écologique participe avant tout de la protection des sols et de l’eau ainsi que de la conservation d’habitats remarquables de par leur richesse biologique. La mise en place du réseau Natura 2000 a incontestablement été le levier d’actions restées relativement timides jusque là. Ces services non-marchands devraient sans doute aller en s’amplifiant si leur valeur « économique » était davantage reconnue et établie. Il convient évidemment de relativiser les poids respectifs des usages selon que l’on raisonne à l’échelle locale de la Région wallonne et de l’attente de ses habitants ou à l’échelle globale et internationale où la forêt est appelée à rencontrer des enjeux aussi fondamentaux que le réchauffement climatique ou la sauvegarde de la biodiversité. En Région wallonne, dont 75 % du territoire sont situés en zones rurales, la production ligneuse, surtout vue sous l’angle bois-matériau et bois-énergie, reste le service le plus important. Il doit de plus en plus composer avec le rôle social au sens récréatif, paysager, voire pédagogique, du terme.
La relation traditionnelle entre la forêt et la grande faune sauvage révèle aussi différentes
dimensions que l’on peut retrouver dans les services de production, écologiques et sociaux. La chasse, qui relève depuis toujours des « services » rendus par la forêt, est une activité à part entière et d’ailleurs importante sur le plan économique.
Au début des années 2000, il est, en définitive, davantage question de biens et de services,
voire d’usages. Bien plus que de la pure sémantique approcher la forêt sous l’angle multi-usages et la gérer en conséquence cadre d’ailleurs mieux avec sa dynamique historique, c’est-à-dire éminemment sociale (Rondeux, 2004).
Quels changements durant les 50 dernières années ?
Les outils d’évaluation Identifier les changements ayant affecté l’écosystème forestier sur les quelques dizaines
dernières années suppose le recours à des indicateurs ou à un véritable monitoring conçu à l’échelle de tout le territoire forestier régional tant privé que public. Les seuls outils mobilisables en vue d’observer et de traduire l’évolution de l’écosystème forestier sont les recensements décennaux portant sur l’agriculture et la forêt (INS, 1950, 1970) et depuis 1984 l’Inventaire des Ressources forestières wallonnes mis au point et réalisé par la FUSAGx de 1984 à 1994 avant d’être transféré en 1996 à la DGRNE - DNF où il y acquiert un statut permanent (Rondeux et al., 1996). Ces deux sources de données ne sont pas strictement comparables. La première est basée sur la compilation de matrices cadastrales et sur des
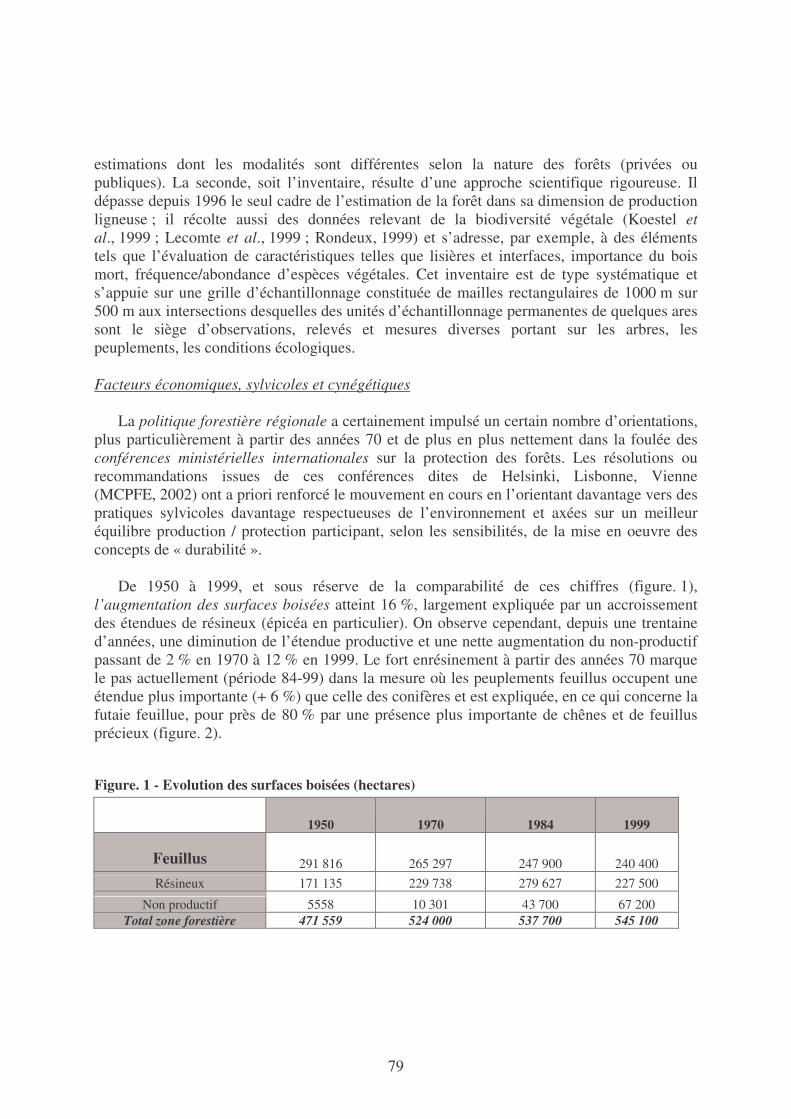
79
estimations dont les modalités sont différentes selon la nature des forêts (privées ou publiques). La seconde, soit l’inventaire, résulte d’une approche scientifique rigoureuse. Il dépasse depuis 1996 le seul cadre de l’estimation de la forêt dans sa dimension de production ligneuse ; il récolte aussi des données relevant de la biodiversité végétale (Koestel et al., 1999 ; Lecomte et al., 1999 ; Rondeux, 1999) et s’adresse, par exemple, à des éléments tels que l’évaluation de caractéristiques telles que lisières et interfaces, importance du bois mort, fréquence/abondance d’espèces végétales. Cet inventaire est de type systématique et s’appuie sur une grille d’échantillonnage constituée de mailles rectangulaires de 1000 m sur 500 m aux intersections desquelles des unités d’échantillonnage permanentes de quelques ares sont le siège d’observations, relevés et mesures diverses portant sur les arbres, les peuplements, les conditions écologiques.
Facteurs économiques, sylvicoles et cynégétiques
La politique forestière régionale a certainement impulsé un certain nombre d’orientations,
plus particulièrement à partir des années 70 et de plus en plus nettement dans la foulée des conférences ministérielles internationales sur la protection des forêts. Les résolutions ou recommandations issues de ces conférences dites de Helsinki, Lisbonne, Vienne (MCPFE, 2002) ont a priori renforcé le mouvement en cours en l’orientant davantage vers des pratiques sylvicoles davantage respectueuses de l’environnement et axées sur un meilleur équilibre production / protection participant, selon les sensibilités, de la mise en oeuvre des concepts de « durabilité ».
De 1950 à 1999, et sous réserve de la comparabilité de ces chiffres (figure. 1),
l’augmentation des surfaces boisées atteint 16 %, largement expliquée par un accroissement des étendues de résineux (épicéa en particulier). On observe cependant, depuis une trentaine d’années, une diminution de l’étendue productive et une nette augmentation du non-productif passant de 2 % en 1970 à 12 % en 1999. Le fort enrésinement à partir des années 70 marque le pas actuellement (période 84-99) dans la mesure où les peuplements feuillus occupent une étendue plus importante (+ 6 %) que celle des conifères et est expliquée, en ce qui concerne la futaie feuillue, pour près de 80 % par une présence plus importante de chênes et de feuillus précieux (figure. 2).
Figure. 1 - Evolution des surfaces boisées (hectares)
1950 1970 1984 1999
Feuillus 291 816 265 297 247 900 240 400 Résineux 171 135 229 738 279 627 227 500
Non productif 5558 10 301 43 700 67 200 Total zone forestière 471 559 524 000 537 700 545 100
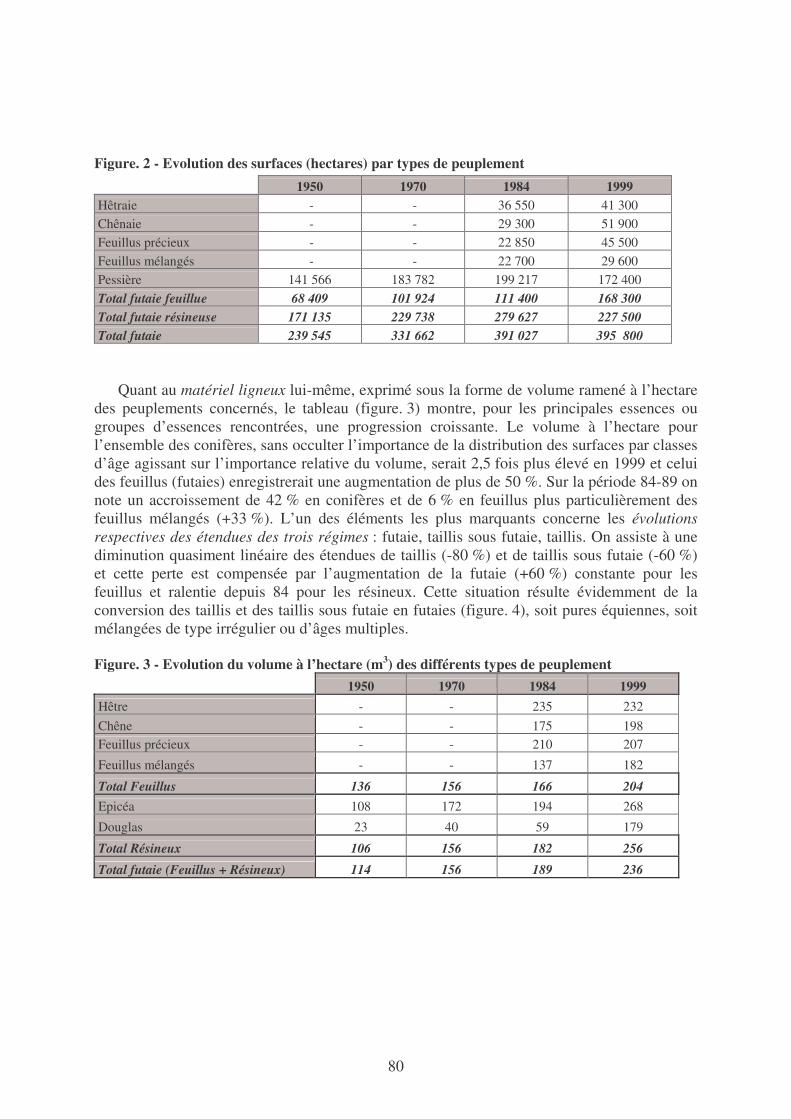
80
Figure. 2 - Evolution des surfaces (hectares) par types de peuplement 1950 1970 1984 1999 Hêtraie - - 36 550 41 300 Chênaie - - 29 300 51 900 Feuillus précieux - - 22 850 45 500 Feuillus mélangés - - 22 700 29 600 Pessière 141 566 183 782 199 217 172 400 Total futaie feuillue 68 409 101 924 111 400 168 300 Total futaie résineuse 171 135 229 738 279 627 227 500 Total futaie 239 545 331 662 391 027 395 800
Quant au matériel ligneux lui-même, exprimé sous la forme de volume ramené à l’hectare
des peuplements concernés, le tableau (figure. 3) montre, pour les principales essences ou groupes d’essences rencontrées, une progression croissante. Le volume à l’hectare pour l’ensemble des conifères, sans occulter l’importance de la distribution des surfaces par classes d’âge agissant sur l’importance relative du volume, serait 2,5 fois plus élevé en 1999 et celui des feuillus (futaies) enregistrerait une augmentation de plus de 50 %. Sur la période 84-89 on note un accroissement de 42 % en conifères et de 6 % en feuillus plus particulièrement des feuillus mélangés (+33 %). L’un des éléments les plus marquants concerne les évolutions respectives des étendues des trois régimes : futaie, taillis sous futaie, taillis. On assiste à une diminution quasiment linéaire des étendues de taillis (-80 %) et de taillis sous futaie (-60 %) et cette perte est compensée par l’augmentation de la futaie (+60 %) constante pour les feuillus et ralentie depuis 84 pour les résineux. Cette situation résulte évidemment de la conversion des taillis et des taillis sous futaie en futaies (figure. 4), soit pures équiennes, soit mélangées de type irrégulier ou d’âges multiples.
Figure. 3 - Evolution du volume à l’hectare (m3) des différents types de peuplement 1950 1970 1984 1999 Hêtre - - 235 232 Chêne - - 175 198 Feuillus précieux - - 210 207
Feuillus mélangés - - 137 182
Total Feuillus 136 156 166 204 Epicéa 108 172 194 268
Douglas 23 40 59 179
Total Résineux 106 156 182 256 Total futaie (Feuillus + Résineux) 114 156 189 236
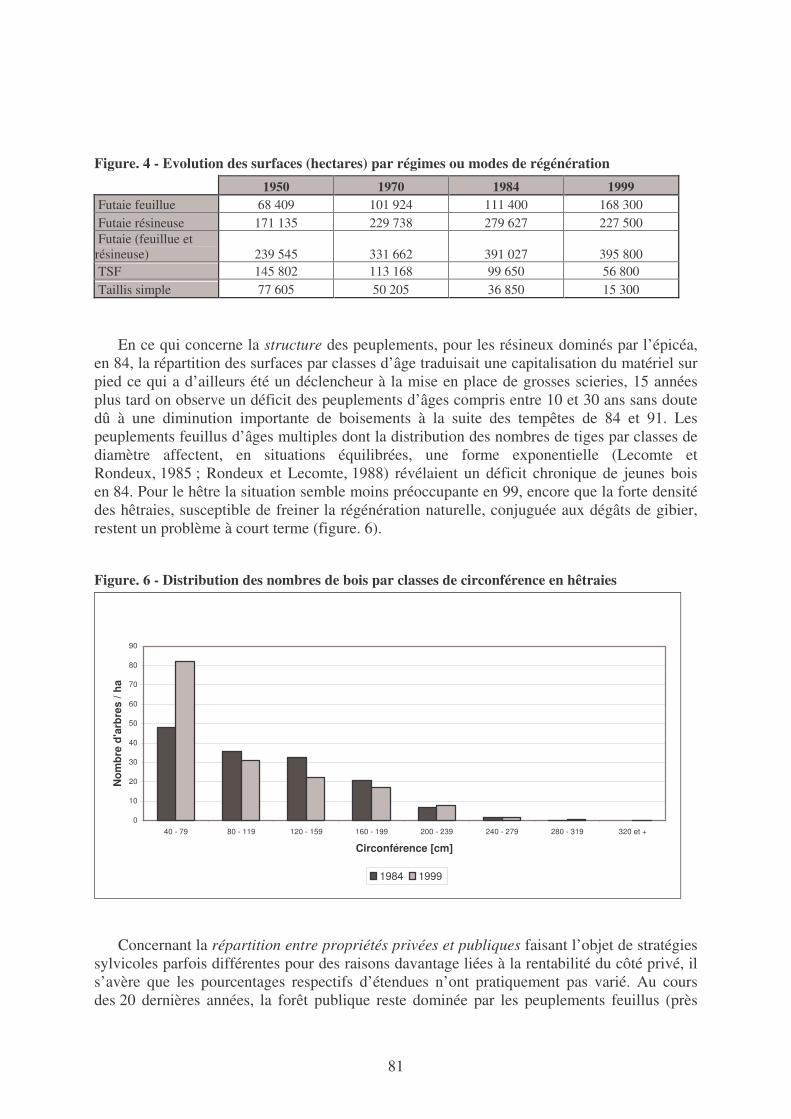
81
Figure. 4 - Evolution des surfaces (hectares) par régimes ou modes de régénération 1950 1970 1984 1999 Futaie feuillue 68 409 101 924 111 400 168 300 Futaie résineuse 171 135 229 738 279 627 227 500 Futaie (feuillue et résineuse) 239 545 331 662 391 027 395 800 TSF 145 802 113 168 99 650 56 800 Taillis simple 77 605 50 205 36 850 15 300
En ce qui concerne la structure des peuplements, pour les résineux dominés par l’épicéa,
en 84, la répartition des surfaces par classes d’âge traduisait une capitalisation du matériel sur pied ce qui a d’ailleurs été un déclencheur à la mise en place de grosses scieries, 15 années plus tard on observe un déficit des peuplements d’âges compris entre 10 et 30 ans sans doute dû à une diminution importante de boisements à la suite des tempêtes de 84 et 91. Les peuplements feuillus d’âges multiples dont la distribution des nombres de tiges par classes de diamètre affectent, en situations équilibrées, une forme exponentielle (Lecomte et Rondeux, 1985 ; Rondeux et Lecomte, 1988) révélaient un déficit chronique de jeunes bois en 84. Pour le hêtre la situation semble moins préoccupante en 99, encore que la forte densité des hêtraies, susceptible de freiner la régénération naturelle, conjuguée aux dégâts de gibier, restent un problème à court terme (figure. 6).
Figure. 6 - Distribution des nombres de bois par classes de circonférence en hêtraies
0
10
20
30
40
50
60
70
80
90
40 - 79 80 - 119 120 - 159 160 - 199 200 - 239 240 - 279 280 - 319 320 et +
Circonférence [cm]
Nom
bre
d'ar
bres
/ ha
1984 1999
Concernant la répartition entre propriétés privées et publiques faisant l’objet de stratégies
sylvicoles parfois différentes pour des raisons davantage liées à la rentabilité du côté privé, il s’avère que les pourcentages respectifs d’étendues n’ont pratiquement pas varié. Au cours des 20 dernières années, la forêt publique reste dominée par les peuplements feuillus (près
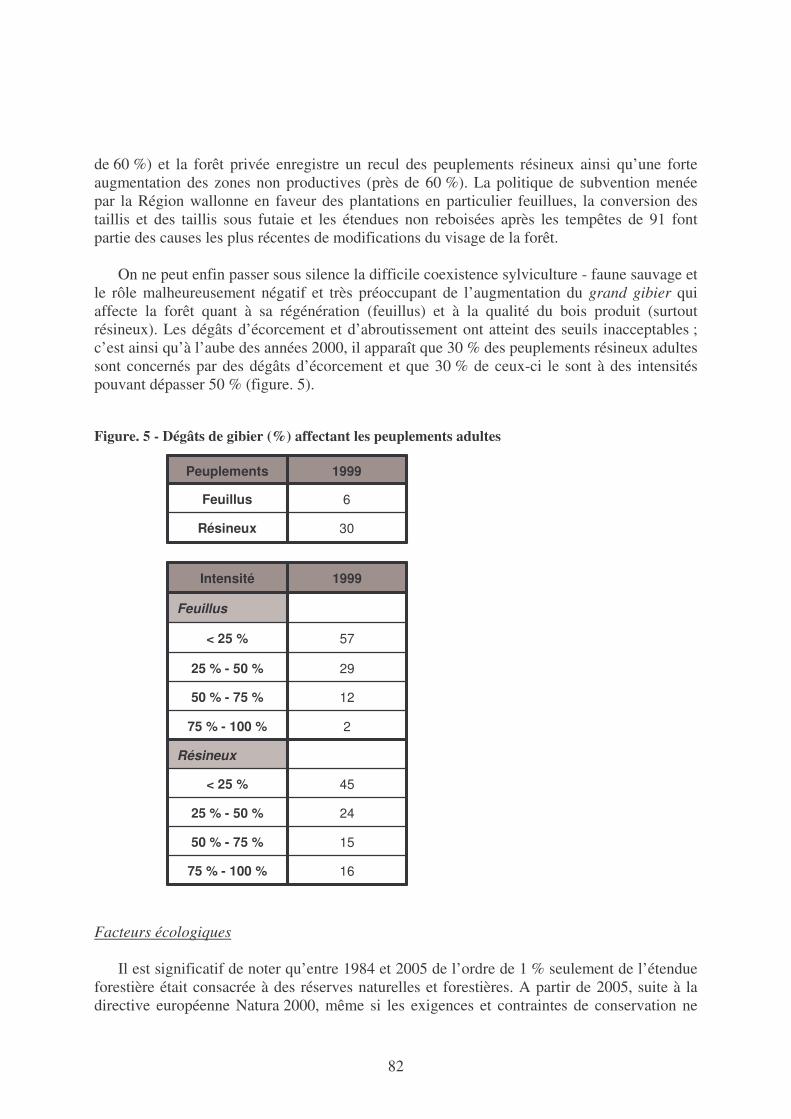
82
de 60 %) et la forêt privée enregistre un recul des peuplements résineux ainsi qu’une forte augmentation des zones non productives (près de 60 %). La politique de subvention menée par la Région wallonne en faveur des plantations en particulier feuillues, la conversion des taillis et des taillis sous futaie et les étendues non reboisées après les tempêtes de 91 font partie des causes les plus récentes de modifications du visage de la forêt.
On ne peut enfin passer sous silence la difficile coexistence sylviculture - faune sauvage et
le rôle malheureusement négatif et très préoccupant de l’augmentation du grand gibier qui affecte la forêt quant à sa régénération (feuillus) et à la qualité du bois produit (surtout résineux). Les dégâts d’écorcement et d’abroutissement ont atteint des seuils inacceptables ; c’est ainsi qu’à l’aube des années 2000, il apparaît que 30 % des peuplements résineux adultes sont concernés par des dégâts d’écorcement et que 30 % de ceux-ci le sont à des intensités pouvant dépasser 50 % (figure. 5).
Figure. 5 - Dégâts de gibier (%) affectant les peuplements adultes Facteurs écologiques
Il est significatif de noter qu’entre 1984 et 2005 de l’ordre de 1 % seulement de l’étendue
forestière était consacrée à des réserves naturelles et forestières. A partir de 2005, suite à la directive européenne Natura 2000, même si les exigences et contraintes de conservation ne
30 Résineux
6 Feuillus
1999 Peuplements
Résineux
Feuillus
16 75 % - 100 %
15 50 % - 75 %
24 25 % - 50 %
45 < 25 %
2 75 % - 100 %
12 50 % - 75 %
29 25 % - 50 %
57 < 25 %
1999 Intensité
83
sont pas du même ordre, près de 30 % de la forêt, soit aussi près de 75 % de tous les sites Natura concernés, est appelée à faire l’objet d’un considérable effort en matière de gestion davantage écologique en faveur de la conservation des habitats, de la faune et de la flore.
Facteurs sociaux
La forte demande en matière de récréation et d’ouverture de la forêt pour des activités
récréatives très diversifiées est un élément important à prendre en compte, il nécessite des réglementations régulièrement remises sur le métier. A cet égard, la forêt wallonne est devenue une véritable niche d’un marché en pleine extension. De nombreuses enquêtes (Colson, 2006) montrent aussi que la pression est variable d’endroits à endroits et est amplifiée par l’existence d’autres « produits » attractifs pour le tourisme.
Facteurs climatiques
Restent enfin les perturbations très importantes liées à deux événements climatiques
exceptionnels : les tempêtes de 84 et 91, la seconde ayant détruit près de trois fois la récolte moyenne annuelle en résineux. Les ouvertures qui en ont résulté n’ont pas toutes été replantées ou l’ont été partiellement en feuillus, la plupart d’entre elles ont parfois aussi donné lieu à des milieux ouverts (« non productifs ») conférant une plus grande diversité biologique à certains terrains jusque là colonisés par l’épicéa. Plus récemment, en 2000, environ 30 000 hectares de hêtraies ardennaises ont été ravagées par une explosion d’insectes xylophages, à la suite d’un accident climatique très ponctuel (Rondeux et al., 2003), ce qui a entraîné une réflexion approfondie sur la manière de restaurer ces hêtraies mais aussi sur la sylviculture à leur appliquer et sur leur composition avérée trop différente de celle des hêtraies naturelles.
Quelles conséquences en termes de services ? De manière générale, les conséquences de la hiérarchisation des services et de leur
évolution au cours du temps sont d’ordre économique et écologique au sens large du terme. Du point de vue économique et sylvicole, on observe la volonté de veiller à une adéquation plus stricte entre le type et la qualité de production ligneuse et les besoins du marché du bois. Suite aux dégâts inacceptables occasionnés par le gibier, à certains endroits, on constate une perte de qualité du bois et des difficultés de régénération naturelle garante d’une continuité du couvert forestier. Pareil « fléau » reste cependant difficile à endiguer faute de respecter les plans de tir ou d’appliquer des mesures coercitives fortes aux contrevenants. Le coût des locations de la chasse peut parfois produire des revenus plus élevés que ceux résultant de la production ligneuse, ce qui n’arrange évidemment rien.
Du point de vue écologique, l’évolution des pratiques sylvicoles et leurs conséquences sur
la diversité des structures de peuplements, a engendré une diminution des espèces inféodées aux forêts claires et aux milieux ouverts et l’augmentation ou le maintien de densités relativement élevées de matériel ligneux (« growing stock ») induisent des modifications sur le plan de la diversité biologique spécifique. La destruction du sol par des engins forestiers et l’apparition d’une mécanisation de plus en plus sophistiquée nécessitent la mise en œuvre et
84
le respect de cahiers de charges stricts. La pression croissante du public sur la forêt en matière d’activités récréatives, à défaut d’être davantage canalisée, pourrait devenir une source non négligeable de perturbations vis-à-vis des sols et de la quiétude de la vie animale.
Quels changements pour la forêt dans la pratique courante ? Du point de vue des pratiques courantes et de celles à envisager dans le futur, nous en
retiendrons plusieurs qui concernent la conversion ou la transformation de certains régimes en place, l’impact de la directive Natura 2000, l’éco certification, l’évolution du marché du bois, la demande en bois énergie et enfin les conséquences sylvicoles des changements climatiques annoncés.
• Le régime de la futaie a largement supplanté (figure. 4) ceux du taillis et du taillis sous
futaie pour des questions de plus haute qualité du bois fourni, et nombre de peuplements équiennes ont été transformés en futaies irrégulières ou d’âges multiples davantage favorables à la stabilité et à la richesse biologique. Les régimes de taillis ayant joué un rôle important en matière de bois de chauffage sont aujourd’hui en forte régression alors que la valorisation du bois à des fins énergétiques est à l’ordre du jour, compte tenu de la raréfaction des énergies fossiles. Natura 2000 qui concerne 30 % de la forêt wallonne est de nature à modifier l’importance relative des services attendus. Même s’il n’est pas évident de mesurer l’incidence des contraintes induites par l’application de la directive et variables d’un endroit à l’autre en fonction de la distance qui sépare l’état actuel d’un milieu de son état naturel optimal, il est probable qu’une sylviculture plus proche de la nature affecte les modalités de l’exploitation forestière et le maintien de certaines pratiques sylvicoles dictées par un souci de rentabilité. La forêt de production ne peut toutefois être mise en péril sous peine de déclencher un processus qui impliquerait que le financement des services ne pourrait être supporté par les revenus de l’exploitation. Cela conduirait à trouver une alternative capable de financer en totalité l’application de mesures de protection et de conservation via, par exemple, des subsides ou taxations à supporter par le citoyen. Quant à l’éco certification, processus appelé à vérifier que le bois produit vient réellement d’une forêt gérée durablement, en regard de facteurs écologiques et sociaux et non exclusivement économiques, la Région wallonne s’est engagée dans le système PEFC.
• Il convient aussi de relever l’évolution du marché du bois et sa sensibilité à l’arrivée
de produits d’autres pays à des prix déstabilisés ainsi qu’aux fortes demandes de pays émergents, facteurs ayant un impact considérable sur la viabilité de la filière bois. Raison de plus pour faire évoluer notre production ligneuse vers une plus grande qualité d’autant que nous ne pouvons satisfaire les exigences de quantité liées, par exemple, au gabarit des scieries construites voici une vingtaine d’années.
Reste enfin un problème de taille, celui des répercussions des changements climatiques.
Dans l’hypothèse d’une augmentation de la température moyenne annuelle en Europe occidentale, par le fait d’une augmentation de xéricité, les régions limoneuse et sablo-limoneuse présentes en Région wallonne, seraient les premières concernées par des problèmes
85
de maintien du hêtre. A titre purement indicatif, l’analyse conjointe des types de sol et de leur profondeur liée aux expositions ensoleillées et aux versants sud présentant des pentes supérieures à 12 ° permet, par exemple, de montrer que sur une aire de quelques 1000 hectares située sur le plateau de St-Hubert, une « translation » hêtre-chêne s’opérerait sur une dizaine d’hectares.
Quelles mesures prioritaires pour compenser les éventuelles pertes de services ?
L’application du concept de forêt multi-usages ou multi-services
En réalité, parler de « pertes » de services serait abusif. Au cours du temps on a plutôt
assisté à une augmentation de la diversité des services au départ des fonctions classiques telles que déjà identifiés. Par contre, il ne fait aucun doute que la hiérarchie et les poids respectifs des services ont évolué.
Aussi, en premier lieu, une clarification du concept même de forêt multi-usages
OECD, 2001) est-elle indispensable, en particulier dès lors qu’il est transposé sur le terrain. Ce concept revêt deux grandes formes que l’on peut synthétiser comme suit (Rondeux, 2004) :
• soit consister en une juxtaposition de zones spécialisées, chacune ayant un objectif déterminé (production de bois, cynégétique, loisirs, etc.), ce que l’on peut concevoir dans le cas de réserves intégrales ou forestières, ces dernières étant soustraites, à des degrés divers, aux activités forestières ou sylvicoles habituelles ;
• soit se traduire par la cohabitation de toutes les fonctions aux mêmes endroits, ce qui suppose néanmoins une hiérarchisation entre elles, sous peine d’engendrer d’importants conflits d’intérêt.
La première approche n’est guère de mise en régions densément peuplées car elle
demande beaucoup d’espace et va à l’encontre des aspirations de la société ; cette segmentation de l’espace conduisant aussi à limiter drastiquement l’ensemble des bénéfices attendus et la manière de les rendre disponibles
Considérant que la seconde approche est mieux adaptée aux circonstances de la forêt
wallonne et à son cadre socioculturel, il convient toutefois de garder à l’esprit les contraintes liées à la production ligneuse sous peine de conditionner celle-ci à des règles difficilement acceptables au plan de la rentabilité. La cohabitation des différentes fonctions n'en reste pas moins un énorme défi pour la Région wallonne dont la majorité du territoire situé en zones rurales, est source de nombreux emplois directement liés aux productions qu’elles génèrent.
Eu égard au nombre de plus en plus élevé d’acteurs gravitant autour de la forêt, il est
essentiel de favoriser la concertation afin de définir autant que possible un classement des attentes respectives par grandes entités ou massifs. Faute de développer la communication et de créer les bases d’une participation aux grandes décisions engageant le devenir de ces massifs, le gestionnaire forestier qui doit cependant rester le responsable territorial éprouvera les plus grandes difficultés à régler les inévitables conflits d’intérêt.
86
Toutes les actions forestières et mesures sylvicoles sont logiquement basées sur des hypothèses de travail qui conduisent à des résultats ne pouvant être appréciés qu’après de nombreuses années. Il est important de gérer ces résultats de manière la plus objective possible et d’évaluer dans quelle mesure les hypothèses émises restent ou non d’application. C’est le principe même de la gestion adaptative. Ce processus de type « itératif » a de plus en plus de raisons d’être pris en compte car l’évolution du contexte forestier impose une planification flexible de la gestion qui améliore la résistance de la forêt par rapport aux aléas pouvant l’affecter et qui organise une adaptabilité de la gestion capable de répondre ultérieurement à des besoins aujourd’hui mal connus. L’ampleur des évolutions attendues ou en cours suggèrent une refonte des méthodes d’aménagement et de leur contenu pour discuter des évolutions sylvicoles permettant de préparer un avenir difficile à cerner.
Monitoring et assistance
Utilisation optimale de l’inventaire forestier régional L’inventaire forestier régional, du fait de sa permanence et du nombre très diversifié de
données qu’il récolte, est devenu à la fois un véritable « observatoire » de la forêt wallonne et de son évolution et un « tableau de bord » permettant de vérifier dans quelle mesure des orientations relevant de la politique forestière et des options sylvicoles sont suivies des effets escomptés (Rondeux et Lecomte, 2005). Le plus bel exemple est sans doute celui du suivi de la gestion durable et que l’on peut évidemment décliner en de multiples formes. Nous en retiendrons deux. La première concerne le rapport qui existe entre la récolte annuelle de bois et la production annuelle (volumes). Si ce rapport est systématiquement supérieur à l’unité, il convient évidemment de s’interroger sur la capacité future de la forêt à soutenir pareils prélèvements supérieure à la production et analyser structures des peuplements, répartition entre classes d’âge et stades de développement. A l’heure actuelle le rapport prélèvements annuels / production annuelle est de 65 % pour les feuillus et de 109 % pour l’ensemble des résineux, soit aussi de 95 % pour toutes les essences confondues (Rondeux et al., 2005). La seconde est relative à la mesure du degré de satisfaction du critère 4 de la Conférence d’Helsinki « Maintenance, conservation and appropriate enhancement of biological diversity in forest ecosystems ». L’inventaire, outre la composition spécifique des peuplements (nombre d’espèces à l’hectare) traduite par un coefficient d’abondance-dominance, permet aussi de calculer un indice de qualité biologique des lisières et des interfaces, la quantité de bois mort sur pied ou à terre et par degré de décomposition. Il est aussi appelé à jouer un rôle déterminant dans les opérations de suivi de la certification (Rondeux, 2006 ; Colson et al., 2004c).
Création d’un Centre régional de la propriété forestière privée
Pour développer une politique forestière régionale en adéquation avec la mouvance
internationale en faveur du développement durable et en relation avec les attentes sociétales il convient que tous les acteurs propriétaires de la forêt soient en phase. S’agissant de la propriété privée où une grande liberté est laissée à chacun, force est de constater que le très grand nombre de petits propriétaires et donc que l’éclatement de cette propriété, pour être davantage en prise avec une politique régionale touchant par définition toutes les propriétés,
87
nécessiterait un appui ciblé, à l'instar de ce qui prévaut en France par exemple, pour davantage s’impliquer dans les changements à venir (Colson et al., 2004 a, 2004 b). La mise en place d’un document simple de gestion tel que proposé par Rondeux (2006) ainsi que la constitution d’un « guichet » unique focalisé sur l’appui à la gestion iraient dans le sens d’une plus grande efficacité.
Communication et concertation
Une gestion multi-fonctionnelle doit prendre en compte l’ensemble des objectifs
susceptibles d’être poursuivis ainsi que l’ensemble des avis des acteurs concernés par le milieu forestier (Rondeux, 2005). L’analyse multicritère est à cet égard un moyen pertinent facilitant le déroulement d’un processus de décision raisonné et documenté (Bousson, 2003). Elle consiste en une évaluation et une comparaison d’alternatives de gestion potentielles dont l’application peut être simulée de manière à en appréhender les conséquences sur les caractéristiques mêmes des massifs forestiers. Un jeu approprié de critères et indicateurs est ensuite utilisé pour évaluer dans quelle mesure chaque alternative permet de rencontrer chacun des objectifs préalablement définis (forêt à fonction dominante de production, forêt plus « écologique », etc.). Cette approche a été restée avec succès sur un massif ardennais de près de 20 000 hectares (Rondeux, 2005).
Mesures en matière de sylviculture et d’aménagement
Des mesures générales en réponse aux problèmes évoqués précédemment devront être
prises dans les directions non exhaustives suivantes : • veiller à une utilisation optimale des espaces de croissance et des conditions
stationnelles (enrichir le fichier écologique des essences (MRW, 1991) et le guide du boisement (MRW, 1995) conçus sur base d’expertises diverses, au moyen de mesures et d’observations objectives et revoir ces outils en dehors des fondements de leur construction largement conditionnés par l’objectif de production ligneuse) ;
• opérer une réduction drastique de la population de grand gibier aux endroits ou cela s’impose et appréhender les conséquences de certaines sylvicultures sur la capacité alimentaire des milieux forestiers ;
• analyser la place à attribuer à la fonction récréative et la situer dans une politique globale dépassant le seul cadre de la forêt.
Quel regard sur la méthodologie MA ? La démarche MA est très ambitieuse et doit être comprise à l’échelle internationale avec
toutes les contraintes et cas particuliers que cela peut impliquer. La méthodologie proposée repose sur la conception de modèles globaux et sur l’élaboration de scénarios. L’idée est séduisante et convient par exemple bien à l’évaluation des changements potentiels affectant la forêt dans l’hypothèse de perturbations climatiques. Il ne faut cependant pas se leurrer. Pour réussir pareil exercice il est impératif de disposer de nombreuses données de qualité dans un nombre très varié de domaines, en témoigne la diversité des services attendus de la forêt. Or, sur ce plan, la Région wallonne a encore beaucoup d’efforts à consentir quant à la mise en
88
place de systèmes d’information alimentés par des données pertinentes et comparables récoltées à partir de protocoles rigoureux et permanents (Rondeux, 2001).
Un certain nombre de « contraintes » et de « pièges » doivent être évités. Parmi ceux-ci
nous voyons, entre autres : • l’utilisation de modèles globaux tels que préconisés et basée sur une approche
exploratoire (MA, 2005) dont le risque est de conduire à une complexité d’interprétation des résultats fournis ;
• l’existence et la disponibilité des données. Il est, par exemple, très symptomatique de voir le rôle prépondérant joué aujourd’hui par l’inventaire permanent des ressources forestières, seul outil capable de répondre aux grandes questions relatives à l’évolution de la forêt wallonne ; le risque existe de le surexploiter à des fins qui ne cadreraient plus avec ce pourquoi il a été conçu (Rondeux, 1997, 1998) ;
• le danger ou la tentation d’utiliser des données récoltées pour des objectifs très ou trop spécifiques et de surcroît issues de sources non compatibles en termes de comparaisons et de suivis au cours du temps ;
Il est essentiel de mettre en place un ensemble de critères et d’indicateurs
(Rondeux, 2001) capables de couvrir la gamme de services et de biens relatifs à la forêt. Ils doivent absolument être adaptés à la « mesure » des changements affectant la gestion des espaces et ce de manière causale appropriée à l’échelle de l’évaluation.
Références
Bousson, E., 2003. Gestion forestière intégrée. Approche basée sur l’analyse multicritère.-Les Presses agronomiques de Gembloux, Gembloux, 303p.
Colson, V., Hebert J., Rondeux J. 2002. Forêt privée et politique forestière en Région wallonne.-Cah. For. Gembloux, 29, 15p.
Colson, V., Puissant, T., Hébert, J., Rondeux, J. 2004a. La forêt privée wallonne, sa gestion et ses propriétaires (1ère partie).-Silva Belgica, 111 : 20-25.
Colson, V., Puissant, T., Hébert, J., Rondeux, J. 2004b. La forêt privée wallonne, sa gestion et ses propriétaires (2ème partie).-Silva Belgica, 111 : 32-38.
Colson, V. ; Puissant, T., Hébert, J., Rondeux, J. 2004c. La forêt privée wallonne et sa gestion : des chiffres qui parlent.-Cah. For. Gembloux, 30 : 42p
Colson, V. 2006. La fréquentation des massifs forestiers à des fins récréatives et de détente par la population wallonne et bruxelloise.-Forêt wallonne, 81 : 26-38.
Institut National de statistique (INS). 1954. Recensement général de l’agriculture de 1950. Recensement forestier 15 mai 1950. 3è partie.-Ministère des Affaires économiques et des Classes moyennes. Royaume de Belgique, 90p.
Institut National de statistique (INS). 1976. Recensement général de l’agriculture et des forêts de 1970. Tome V.- Ministère des Affaires économiques. Royaume de Belgique, 261p.
Koestel, G., Lecomte, H., Rondeux, J. 1999. La gestion forestière durable en Région wallonne partie : Apports de l’inventaire permanent. 1- Concepts généraux et étude de faisabilité.-Silva Belgica, 106 : 9-15.
Lecomte, H., Rondeux, J. 1985. Quelques considérations chiffrées sur la forêt feuillue wallonne.-Ann. Gembloux, 92 : 111-125.
89
Lecomte, H., Koestel, G., Rondeux, J. 1999. La gestion forestière durable en Région wallonne : L’apport de l’inventaire permanent. 2- Intégration des indicateurs à l’inventaire.-Silva Belgica, 106 : 7-14.
Lecomte, H., Bourland, N., Burnay, F., Rondeux, J. 2005. La forêt wallonne au début du 21è siècle : bref état des lieux.-Silva Belgica, 112 : 20-26.
Lecomte, H., Florkin P., Morimont J-P., Thirion M. 2002. La forêt wallonne, état de la ressource à la fin du 20è siècle.-Direction Générale des Ressources Naturelles et de l’Environnement, Jambes, 69p.
(MA) Millennium Ecosystem Assessment. 2005. Synthesis Report. Washington, D.C. : Island Press.
MCPFE. 2002. Improved pan-European indicators for sustainable forest management.- In : MCPFE Expert Level meeting 7-8 October 2002, 5p. Vienna : Ministerial Conference on the Protection of Forests in Europe.
Ministère de la Région wallonne (MRW). 1991. Le fichier écologique des essences.- DGRNE-DNF. 45p + 190p.
Ministère de la Région wallonne (MRW). 1995. Le guide du boisement des stations forestières de Wallonie.-DGRNE-DNF, Jambes, 175p.
OECD. 2001. Multifunctionality : Towards an analytical framework.-Paris : OECD. Rondeux, J., Hébert, J., Bourland, N., Puissant, T., Burnay, F., Lecomte, H. 2005. Production
ligneuse de la forêt wallonne, l’apport de l’inventaire permanent régional.-Forêt wallonne, 79 : 3-18.
Rondeux, J., Lecomte, H. 1988. Considérations sur la structure actuelle des hêtraies en Ardenne et en Région Jurassique. Implications en matière de traitement sylvicole.-Bull. Soc. R. For. Belg., 95 : 279-292.
Rondeux, J. 1991. Management of small woods in Belgium.-Quarterly Journal of Forestry, vol LXXXV : 37-42.
Rondeux, J. 1992. Management information systems : emerging tools for integrated forest management. In : Symposium on integrated forest management information systems. Proceedings, Tsukuba, October 13-18, 1991. Tokyo, Jap. Soc. Forest Planning Press, pp.134-141.
Rondeux, J. 1993. La forêt, patrimoine de l'avenir. Gembloux.-Presses agronomiques de Gembloux, Gembloux, 16 p.
Rondeux, J., Lecomte, H., Florkin, P., Thirion, M. 1996. L'inventaire permanent des ressources ligneuses de la Région Wallonne : principaux aspects méthodologiques.-Cah. For. Gembloux, 21, 25 p.
Rondeux, J. 1997. Überblick über nationale Waldinventuren in Europa. Versuch einer vergleichenden Gegenüberstellung in : Testlauf zur Landeswaldinventur - Konzeption, Verfahrenstest, Ergebnisse - Heft 5 der Schriftenreihe der Landesforstverwaltung Nordrhein-Westfalen, 134 p.
Rondeux, J. (contributing author) in LUND H.G (ed.). 1998. IUFRO Guidelines for Designing multipurpose resource inventories :a project of IUFRO Research group 4.02.02 Vienna : IUFRO World Series Vol 8, 216p.
Rondeux, J. 1999. Forest inventories and biodiversity.-Unasylva, 196 : 35-41. Rondeux, J. 2001. Vers un système d’information régional à caractère territorial.-Les Cahiers
de l’Urbanisme, 34 : 73-78. Rondeux, J., Huart, O., Lecomte, H., Bourland, N. 2003. La maladie du hêtre en Région
wallonne : état des lieux chiffré de 2001 à 2003.-Silva Belgica, 110 :18-28.
90
Rondeux, J. 2004. Entre mythes et réalités, la forêt en devenir. In : Séance d’ouverture de l’année académique 2004-2005, Faculté universitaire des Sciences agronomiques de Gembloux, 29p. (Probio-Revue, 2005, 1-2 : 7-20).
Rondeux, J., Lecomte, H. 2005. L’inventaire permanent des ressources forestières : observatoire et base d’un tableau de bord de la forêt wallonne.-Wallonie 83 : 61-67.
Rondeux, J. 2005. Vers une démarche structurée de gestion forestière intégrée et participative. Note de recherche de l’Académie d’Agriculture de France (Publication sur internet à l’adresse : http//www.academie-agriculture.fr), 1-10.
Rondeux, J., Hébert, J., Bourland, N., Puissant, T., Burnay, F., Lecomte, H. 2005. Production ligneuse de la forêt wallonne, l’apport de l’inventaire permanent régional.- Forêt wallonne, 79 : 3-18.
Rondeux, J. 2006. Le document simple de gestion, un outil multi-facettes au service des propriétaires forestiers privés.-Silva Belgica, 113 : 10-15.
Smith, D.M., Larcon, B.C., Kelty, M.J., Ashton, P.M.S. 1996. The practice of silviculture : applied forest ecology.-John Wiley and Sons, New-York, 537p.
91
Les espaces ruraux et agricoles belges : opportunités d’une approche d’évaluation écosystémique
Marc Mormont
Université de Liège (campus d’Arlon) Département Sciences et Gestion de l’Environnement
Issue des sciences humaines, cette contribution est sans doute légèrement différente de celles qui composent ce volume. En effet avant de s’interroger sur un type d’écosystèmes évidemment important en Belgique (les espaces ruraux et agricoles), elle introduit quelques commentaires généraux sur le MA, sa démarche, sa portée.
Appréciation générale du MA Le Millennium Ecosystem Assessment (MA) représente à mon sens une vaste entreprise
dont on ne sait pas encore si elle va faire événement. Cela va dépendre de qu’on en fera. C’est une entreprise considérable par trois aspects sur lesquels je voudrais insister et qui seront développés dans les parties suivantes, mais qui méritent un commentaire général.
Tout d’abord il s’agit d’un déplacement de la question des écosystèmes à une échelle
planétaire, mais avec un effort particulier de penser la question des échelles. Ensuite et cela peut faire débat il y a un fait majeur qui est cette notion de « services
écologiques » ou « services écosystémiques » mais qui pose la question de l’évaluation. Enfin, il y a une démarche qui consiste à tenter de faire produire des évaluations à d’autres
échelles et à travers des processus spécifiques qui sont en fait des processus d’apprentissage. Au niveau du message, le MA porte l’ambition de saisie globale de la question de la
biodiversité. Sans poser qu’il est radicalement nouveau d’essayer de faire un bilan à l’échelle du globe (c’est le sens donné ici à global), cette ambition a un sens tout particulier car l’équivalent et le modèle de référence c’est évidemment le GIEC sur la question du climat. Mais à la différence de la question climatique, où l’on aperçoit bien l’interdépendance qu’elle révèle à l’échelle planétaire, il n’est pas aussi évident que la question de la biodiversité soit une question globale. Elle a plus souvent été traitée à l’échelle locale, parfois à l’échelle nationale, mais pour les grands pays tout au moins, cela existe relativement peu. Il y a là une difficulté méthodologique (quelles relations entre les usages des forêts andines et des modes de culture du café et nos écosystèmes européens ?) et une difficulté politique qui en découle (quel droit avons-nous à nous prononcer sur les ressources de telle ou telle région du monde ?). Sur ce point, le raisonnement qui sous tend le MA n’est pas directement clair : il pose l’existence de capitaux naturels, mais il ne désigne pas directement les titulaires ; il analyse les facteurs et les processus de la dégradation (qui sont eux largement distribués
92
puisque ce sont des processus socio-économiques largement mondialisés ou en voie de l’être). Il y a donc une espèce de fiction sous-jacente – qu’il me semble préférable de reconnaître comme telle – qui est celle d’une biodiversité « commune », qui serait comme un bien public, certes distribué dans l’espace, mais bien commun dont une certaine humanité serait titulaire. Cette fiction, on le verra, est très productive mais elle mérite attention car elle est aussi un point faible de la démarche du MA qui postule une sorte d’acteur collectif, et une série d’intérêts communs à tous dans la protection des écosystèmes. Je pense que cela peut être un point faible si on ne reconnaît pas que c’est une fiction, une « utopie rationnelle » mais que la réalité correspondante, une humanité gérant ses ressources biologiques et physiques est à construire aussi bien dans sa dimension de connaissance que dans sa dimension politique. Or, cette construction que le MA peut contribuer à créer va nécessairement se heurter à des divergences d’intérêts qui ne sont, à mon sens, pas moins considérables que dans le cas du changement climatique.
Au niveau de la méthode (cadre conceptuel) une certaine solution est proposée qui donne
un sens à cette fiction : c’est celle des services écologiques ou services des écosystèmes. Il ne s’agit peut-être pas d’une innovation en soi, mais d’un réel déplacement de toute une série de questions (conservation, gestion des ressources naturelles) dans un nouveau cadre de pensée. La notion de services écologiques est intéressante parce qu’elle crée un sorte de langage commun pour penser tous les écosystèmes et tous les usages. Certains peuvent reprocher à cette notion de rabattre la question des écosystèmes, de manière anthropocentrique, sur un langage économique. Mon avis est ici assez ambivalent. Les différentes dimensions et valeurs que représente la nature ont une double caractéristique. Tout d’abord elles sont incommensurables : il n’y a pas d’instrument de mesure qui puisse établir un rapport stable entre la valeur culturelle d’un paysage, la valeur génétique potentielle d’une espèce et la valeur économique d’une production végétale. Donc il y a impossibilité de trouver un langage commun. La difficulté est accrue par une asymétrie forte entre ces différentes dimensions du fait qu’elles sont très inégalement équipées en instruments de qualification et de valorisation (deux termes français pour le terme anglais ambigu de valuation). Or, c’est cette différence, cette asymétrie qui fait problème et face à laquelle les auteurs ont choisi une voie de compromis en reprenant ce terme de services écologiques qui permet de les englober dans un terme un peu ambigu lui aussi mais qui a le mérite d’être compris par tous. J’ajouterai que la lecture un peu détaillée du rapport ne donne pas l’impression d’une réduction de ces services à des services réduits à leur valeur monétaire ou économique. Néanmoins les rapports de synthèse (par exemple, celui intitulé « Ecosystems and Human Well-Being : Wetlands and Water ») privilégient les instruments de marché de manière trop importante. Il me semble qu’il existe ici une confusion entre l’évaluation et la gestion : autant il me paraît légitime d’utiliser les instruments économiques pour la gestion chaque fois qu’un marché peut être créé pour les biens correspondants, autant il me paraît dangereux d’utiliser exclusivement les outils de la science économique pour évaluer la valeur des écosystèmes et des services rendus.
Toutefois, en définissant ces services non seulement comme des fournitures de biens mais
aussi comme des services de régulation, des services culturels et des services de support (infrastructure du sol, etc.), le MA introduit implicitement une vision de la biodiversité comme un système dont une partie est l’homme (comme bénéficiaire et comme acteur participant à certaines régulations). Bref, cette démarche, avec sa part de réductionnisme, positionne ainsi l’écologie, me semble-t-il, comme une science des régulations du vivant
93
(incluant l’homme). Cela n’est pas sans importance. Une autre manière de dire cela est que cela donne une plus grande lisibilité et légitimité aux travaux des écologues, ce qui n’est pas rien. Mais cette science multidisciplinaire du vivant doit prendre en compte non des écosystèmes en tant que tels mais des systèmes « homme-nature » ou des éco-socio-systèmes.
Au niveau de l’impact de la recherche, la troisième caractéristique marquante du MA,
c’est qu’il ne met pas en avant la notion de règles, de législation ou de réglementation. L’accent est mis au contraire sur la notion de trade-offs donc d’arbitrage entre avantages et des inconvénients, donc sur des choix possibles. Dans un sens, c’est conforme à une vision un peu libérale et marchande, mais dans un autre sens, cela me semble habile pour deux raisons.
L’arbitrage est premier par rapport aux formes que doit prendre la mise en œuvre d’un
choix ou d’une décision car on porte l’attention sur le contenu de la décision et non sur la manière dont on la traduit, or elle peut se traduire dans d’autres formes que la règle, et ces formes (gestion en commun par exemple ou privatisation) dépendent en partie du contexte sociopolitique ; et la réglementation étatique n’a pas toujours fait preuve d’une totale efficacité.
La notion d’arbitrage met aussi l’accent sur le processus de prise de décision plus que sur
la décision elle-même ; or dans les questions qui nous occupent il est plus important de mettre en route des processus de décision que de réclamer des décisions ; très souvent le problème n’est pas de décider mais de produire les conditions de la décision car celle-ci vient en fait sanctionner un processus d’interaction entre des acteurs multiples. Souvent, plus en amont encore, il faut construire le problème (le faire reconnaître) de manière telle qu’un processus de décision soit pensable et acceptable.
Compte tenu de ces trois arguments, la démarche du MA me paraît innovatrice et
intéressante dans ce sens qu’elle devrait permettre d’initier une nouvelle approche spécialement des formes de dialogue qui devraient conduire à des décisions.
Les systèmes agricoles et ruraux en Belgique vs le MA Si on s’interroge maintenant sur la pertinence de l’approche du MA pour les espaces
ruraux et agricoles de notre pays, il faut d’abord partir de l’approche du MA. Se situant à une échelle globale, le MA identifie bien les défis à l’échelle globale. La demande toujours croissante de produits agricoles – alimentaires et non alimentaires – est évidemment le facteur dominant de l’évolution des dernières décennies. Cette demande a été assez bien rencontrée par une augmentation de la production qui résulte à la fois d’une extension des surfaces cultivées (au détriment des espaces naturels) et par une intensification de la production, laquelle se traduit par une augmentation forte des flux de nutrients, dont une bonne partie est rejetée au dehors des écosystèmes agricoles, ce qui a des effets évidents sur les écosystèmes voisins. Cette analyse vaut de manière « globale », c’est une tendance générale et les auteurs ne croient pas que ce mode de croissance puisse continuer longtemps du fait des limites physiques à l’extension des surfaces cultivées.
94
Les analyses du MA L’intérêt de l’analyse du MA est avant tout de fournir un cadre conceptuel pour penser les
relations entre les écosystèmes agricoles et les autres écosystèmes et la biodiversité. L’agriculture dépend en fait – pour son efficacité même – des services ou des fonctions remplies par d’autres écosystèmes, elle fournit des services (alimentation et autres produits) et enfin elle a des impacts sur d’autres écosystèmes.
En termes de biodiversité on peut spécifier cette analyse en distinguant : (a) la biodiversité interne des écosystèmes agricoles (espèces animales et végétales) avec
une tendance à la réduction de cette diversité ; (b) la biodiversité qui fournit des services à l’agriculture (sols, protection des cultures, pollinisation,…) ; (c) l’impact des systèmes agricoles sur la vie sauvage (généralement négative) ; (d) les impacts de l’agriculture sur la biodiversité à l’échelle surtout régionale (paysage, pollutions de l’eau, érosion, salinisation).
L’analyse distingue bien entendu divers types d’écosystèmes agricoles et caractérise leurs
tendances d’évolution et leurs impacts. Elle insiste sur le fait que les modes de gestion ont en eux-mêmes un impact, à savoir que l’organisation spatiale et les choix de production comme la monoculture intensive ne sont pas neutres du point de vue des impacts et des services rendus. La tendance à maximiser la production de biens conduit à des systèmes homogènes et simplifiés qui aggravent les situations.
Cinq compartiments sont principalement étudiés à savoir la biodiversité, les eaux,
l’alimentation, les produits non alimentaires (principalement fibre et énergie), les cycles des nutrients (essentiellement azote et phosphore) et enfin la relation au changement climatique.
Toutes ces analyses reposent sur des diagnostics solides quant aux tendances d’évolution
socio-économique, quant aux pratiques agricoles et quant aux impacts sociaux qui ne sont pas sans importance : le rapport insiste ainsi sur le rôle clé joué par les situations de pauvreté dans la dégradation des écosystèmes.
En se situant sur un plan global, le MA apporte me semble-t-il relativement peu quant aux
écosystèmes agricoles européens. L’Europe se particularise par un pourcentage très élevé de terres agricoles en comparaison avec les autres régions du monde. Ses écosystèmes ruraux sont plus complexes que les types d’écosystèmes mentionnées et ils connaissent des évolutions moins rapides dans les dernières années, et enfin ils font l’objet d’une certaine régulation essentiellement via des mesures incitatives (la politique européenne des mesures agro-environnementales) ou réglementaires pour protéger les écosystèmes voisins. Par exemple la nécessité d’étendre les surfaces ne s’y fait pas sentir et la nécessité d’intensifier est plus nette dans les pays en voie de développement.
Un aspect apparaît peu dans les chapitres consacrés à « alimentation », « alimentation et
écosystèmes » ou « écosystèmes cultivés », ce sont les contributions parfois positives de l’agriculture à certains services environnementaux : cela est mentionné ici ou là, parfois dans d’autres chapitres et on ignore généralement l’apport de l’agriculture au paysage, voire à la diversité des habitats. C’est par exemple, dans le chapitre 12 (« Interactions between Ecosystems Services ») qu’il est souligné que des sols amazoniens cultivés se révèlent plus
95
résilients aux changements que des sols « non anthropogéniques ».Ceci est important à mon sens, car nous vivons en Europe dans des écosystèmes largement anthropisés où les écosystèmes agricoles jouent, avec la forêt, un rôle majeur. L’état de référence, par exemple en matière de biodiversité, n’est pas un état de référence d’écosystème excluant l’homme ou bien où l’homme aurait une part mineure. Il y a donc place pour une analyse spécifique des écosystèmes agricoles européens.
Une des conclusions importantes des rapports est que l’analyse doit se développer à des
niveaux plus localisés pour que soient envisageables des actions et des formes de gestion. Se pose dès lors la question de savoir si des analyses à des échelles locales ou régionales seraient pertinentes en Europe ou en Belgique, analyses qui mobiliseraient le modèle conceptuel du MA. Il faut insister avec force sur ce point.
Quant le rapport du MA se poursuit en tentant d’identifier les trade-offs et les stratégies
possibles, il identifie en fait les marges de manœuvre qui se présentent dans le cadre des évolutions tendancielles qu’il a signalées. Ces marges de manœuvre il les voit notamment dans le développement de modes de gestion renouvelés tels que l’Integrated Pest Management, l’agriculture biologique (surtout au Nord, compte tenu de la contrainte supposée de prix), les formes d’agriculture intégrant par exemple aquaculture et agriculture, l’agroforesterie, les techniques de séquestration du carbone ou celle de mitigation des émissions de carbone). Tout ceci se joue au niveau de la ferme. Mais il existe aussi des marges dans la gestion des rapports entre agro-écosystèmes et espace régional. De même, il envisage aussi les services culturels des écosystèmes agraires, ou leur impact sur la santé comme des pistes stratégiques d’action. Ces pistes soulèvent bien des questions notamment quand le rapport avance concurremment les possibilités envisagées à partir des innovations biotechnologiques. Le rapport insiste bien sur l’idée que les impacts doivent être étudiés à un niveau plus local car ils sont très sensibles au lieu et au système considéré. Se pose bien alors la question de passer à une échelle nationale, régionale ou locale là où les combinaisons d’activités, de types de production, peuvent s’examiner plus concrètement en termes de choix ambigu de la production d’énergie. Néanmoins toutes ces éventualités constituent des champs de recherche et d’innovations possibles.
L’intérêt du cadre conceptuel du MA Il a déjà été dit qu’en général (à l’échelle globale) le cadre conceptuel du MA me paraît
sinon parfait du moins très intéressant. Quant à l’analyse de nos espaces ruraux et agricoles européens, la réponse est moins claire.
Nous ne sommes pas, dans l’immédiat, confrontés à des changements brutaux ou des
évolutions rapides. Sans doute la perspective du changement climatique devrait-elle nous alerter plus et nous faire anticiper des changements dans nos écosystèmes agricoles. Sans doute, à plus court terme, devrions-nous nous interroger de manière plus prospective sur les changements de nos politiques agricoles et leurs impacts sur nos écosystèmes.
L’intérêt de la démarche du MA est ici d’être dynamique, de se poser la question de deux
manières complémentaires. Dune part, nous n’avons pas affaire à une situation qu’il serait suffisant de considérer de manière statique, nous avons affaire à des évolutions et qui de plus
96
caractérisent non pas des écosystèmes naturels, mais des socio-écosystèmes : c’est particulièrement le cas des agro-écosystèmes qui, dans leur état comme dans leur évolution, sont des produits d’interactions entre des activités humaines et des processus naturels (biophysiques). En l’occurrence, en Belgique, nous avons souvent affaire à des espaces semi-naturels où les pratiques agricoles jouent un rôle. C’est ici qu’il serait sans doute bon de se placer dans une perspective plus affirmée de développement durable, ce qui n’est généralement fait que dans certains chapitres qui concernent les choses les plus compliquées et sans doute ceux qui seront les moins lus (par exemple, sur les interactions entre services écosystémiques, déjà cités, ou dans celui qui concerne les « Multiscale Assessments : Integrated Assessments at Multiple Scales ».
D’autre part, en fournissant un cadre conceptuel qui identifie les relations fonctionnelles
entre les écosystèmes (relations via des services marchands ou autres relations fonctionnelles), le cadre conceptuel est global au sens holistique, en ce sens qu’il nous donne un instrument pour penser ce qu’on gagne et ce qu’on perd dans telle ou telle évolution en se situant à une échelle donnée mais en étant aussi capable de penser les relations à une autre échelle. Il nous donne ainsi un instrument, non pas pour ramener toutes les fonctions des écosystèmes à une seule mesure (monétaire, mais il y aura toujours un risque !) mais de mettre en relation des fonctions et des services dont les mesures sont hétérogènes. La manière de le faire reste à déterminer, j’y reviendrai dans ma troisième partie.
Il resterait sans doute à compléter cette approche par une insistance plus grande sur la
dimension du développement durable : il s’agirait par exemple de donner une importance plus grande à des appréciations du long terme, à des notions d’équité internationale de même qu’à une approche de précaution.
Par conséquent, je pense que l’usage le plus intéressant qu’on pourrait faire de la
démarche du MA en Belgique consisterait à réexaminer les états de référence qui nous servent dans nos différentes politiques (celles de l’eau, celles de la conservation, celle de régulation environnementale de l’agriculture) pour nous demander si nous pouvons, à terme :
• réévaluer la valeur des écosystèmes et déterminer d’autres « états » possibles • examiner les relations de synergie entre des politiques. Je pense par exemple qu’un terrain intéressant consisterait à réexaminer la place des zones
humides et des vallées. Pourrait-on par exemple imaginer un retour de certains espaces vers des états moins anthropisés, avec quels avantages et quels coûts. Quelles en seraient les implications en termes de politiques publiques et de gestion ?
Où cette démarche pourrait-elle alors trouver un intérêt dans nos espaces ruraux européens, et belges en particulier ?
La cible principale devrait à mon sens se trouver dans une réévaluation de la biodiversité
dans nos espaces ruraux et agricoles ; il me semble que la gestion de l’eau,dans la mise en œuvre de la Directive Cadre européenne, a déclenché un processus qui commence seulement mais qui devrait améliorer significativement l’état de nos eaux de surface ; par contre la dimension de biodiversité ne me semble pas faire l’objet d’une telle attention ; elle est bien
97
sûr prise en compte dans cette politique de l’eau comme dans un programme tel que Natura 2000. Mais dans ces cas là la biodiversité est largement définie à partir d’un état de référence actuel, en termes de préservation. Or, la biodiversité de nos régions a largement été réduite par deux siècles d’industrialisation, d’urbanisation et de modernisation agricole. La question qui serait, je crois, pertinente serait de réévaluer cet état de référence en se demandant dans quelle mesure il n’est pas intéressant, à partir des différentes fonctions que remplit la biodiversité, de se donner un état de référence plus ambitieux de notre biodiversité.
Un aspect important à souligner est que, vu la complexité et le caractère dynamique des
écosystèmes, la bonne démarche doit consister à se donner des objectifs avant de procéder à une évaluation.
Cela est peu souligné dans le rapport, mais l’agriculture européenne connaît une certaine
stabilité à la fois parce qu’elle est techniquement avancée, spatialement diversifiée, mais aussi parce qu’elle prélève des ressources (essentiellement des matières) sur d’autres régions du monde, non seulement par des flux de produits alimentaires mais aussi par des flux de matières énergétiques et des flux d’aliments pour le bétail, ainsi que des produits agricoles à usage industriel comme les fibres. Je pense qu’il serait pertinent de réaliser une étude sérieuse des impacts de ces consommations sur les pays en voie de développement à partir du cadre conceptuel développé par le MA.
Nous disposons certes en Europe d’une série de réglementations, de dispositifs de gestion
qui prennent en compte principalement les impacts de l’agriculture sur les écosystèmes voisins, en particulier l’eau et la vie sauvage ; mais les approches qui sont utilisées sont souvent sectorielles avec par exemple Natura 2000 d’un côté et la Directive Cadre de l’Eau d’autre part, plus les zones de protection des captages etc. S’y ajoutent les mesures agro-environnementales qui sortent difficilement d’une approche par parcelle et qui sont, de ce fait ; peu articulées sur des enjeux environnementaux dans le choix des mesures. Cette situation résulte d’un développement largement sectoriel de ces formes de régulation de l’agriculture. Et cela comporte deux difficultés : d’une part les évaluations restent partielles et séparées et d’autre part ces politiques sont peu lisibles en particulier du point de vue des agriculteurs qui se sentent cernés par des politiques diverses et peu coordonnées. Le modèle du MA permettrait de donner une image globale des rapports entre les écosystèmes agricoles tels qu’ils sont aujourd’hui et les autres compartiments de l’environnement pour parler un langage qui est plus familier à certains. L’intérêt me paraît être qu’au contraire des approches habituelles on pourrait alors faire deux choses essentielles à mes yeux.
D’une part, il ne s’agit plus de penser agriculture contre ou pour l’environnement, mais de
penser des relations entre des écosystèmes qui ont chacun des gestionnaires d’un côté, des usagers ou bénéficiaires de l’autre ; en particulier cela permettrait de penser aussi les champs des agriculteurs comme des écosystèmes qui ont des fonctions.
D’autre part, l’approche dynamique du MA (des écosystèmes emboités et reliés qui
évoluent) permet beaucoup plus facilement de penser en termes prospectifs, de se projeter dans l’avenir et donc d’envisager des trajectoires de changement. A cet égard des expériences récentes (à une échelle micro) me laissent croire que de telles démarches sont extrêmement séduisantes pour les acteurs de terrain.
98
Il est évidemment exclu de considérer ces relations sans prendre en compte les contraintes économiques et donc sans élaborer en même temps des scénarios agricoles.
Un troisième enjeu se situe dans le prolongement du précédent. Nous ne pouvons en effet
pas oublier que la politique agricole européenne est en changement, pour des raisons qu’on ne discutera pas ici. Un aspect important de ce changement est constitué par le développement d’une politique rurale européenne. Bien sûr on peut en discuter, en termes de moyens, en termes de méthode aussi. Mais j’insisterais sur les faits suivants.
Cette politique rurale cherche à développer une gestion plus territoriale dans laquelle
s’intégreraient des formes renouvelées d’agriculture ou d’activités économiques rurales dont une bonne part ont aussi une base de ressources dans ce qu’on appelle l’environnement, dans ce que le MA appelle les écosystèmes. Qu’il s’agisse de tourisme, de forêt, de conservation, de productions artisanales, d’énergie à partir de la biomasse, il y a bien la volonté de développer une nouvelle économie rurale, mais qui sera aussi intimement liée que la précédente à ces services écosystémiques. L’observation de projets et de programmes qui s’inscrivent dans cette politique rurale me convainc que cette politique manque cruellement d’outils pour penser les relations entre activités agricoles et autres activités ou usages autrement qu’en opposition. Je suis persuadé que le cadre conceptuel du MA offre une opportunité forte pour le faire.
C’est d’autant plus important que, nouveau constat tiré du terrain, il y a très peu de projets
qui associent agriculture et projets de développement rural. Par rapport à cette piste, il est évident que ce n’est pas un assessment national qui serait
intéressant mais sans doute des expériences d’assessment au niveau sous-régional (définie de manière biogéographique et culturelle). Je pense qu’une réflexion sur la dimension à donner à ces expériences régionales doit combiner toutes sortes de facteurs, mais accorder la priorité à des critères sociaux (acteurs, enjeux, volonté exprimée) dans le choix et la délimitation des zones. Il y aurait là pour la Belgique un savoir-faire à construire qui serait non seulement utile localement, mais transposable et transférable. La comparaison inter-région serait un prolongement européen logique à une telle démarche.
Un quatrième enjeu me paraît important à souligner ; le MA, si on le lit un peu dans le
détail, insiste beaucoup – ce qui prouve le non dogmatisme qui résulte de la très large mobilisation scientifique interdisciplinaire qui l’a produit – sur l’importance qu’il y a à innover tant sur le plan technique que sur le plan organisationnel. Peut-être les enjeux européens ne sont ils pas tellement du côté de l’extension des surfaces cultivées ou des flux de nutrients, mais par contre, compte tenu du caractère mixte de nos espaces et de bon nombre de systèmes de production, compte tenu aussi de la diversité des espaces ruraux européens (plaines, montagnes, marais…) les enjeux se situent plutôt dans la construction de compétences. Dans quels domaines pourrions-nous essayer de développer des compétences qui s’inscriraient dans la dynamique du MA ? Il s’agit à mon sens d’expérimenter à différentes échelles des modes de gestion à la fois techniques et sociales par exemple en matière de restauration de zones écologiques et en particulier de zones humides. Quand je dis techniques et sociales, je pense par exemple à l’expérience voisine (hollandaise) de la Meuse mitoyenne qui tente de combiner gestion du cours d’eau, conservation et usages para-
99
agricoles. Je pense aussi au développement de filières agro-alimentaires locales articulées sur des projets de conservation. Ici le cadre du MA offre un cadre conceptuel à la fois pour concevoir et pour évaluer des combinaisons de technologies, d’économie et de modes de gestion (par mode de gestion j’entends les droits de propriété, d’usage, de répartition et de distribution). Il y a, à mon sens, une nouvelle ingénierie qui ne sera ni agronomique, ni biologique, mais bien éco-agronomique ou agro-écologique, qui sera de plus en plus nécessaire pour gérer finement les rapports fonctionnels entre les écosystèmes. Il faudra pour cela que l’agronomie revienne à des approches plus systémiques et que l’écologie (le génie biologique) se fasse un peu plus expérimentateur de terrain.
Sur les processus de décision et de gestion Un des apports importants du MA se situe pour moi moins dans la dimension prospective
que dans l’insistance qu’il met dans la forme à donner aux processus qu’on peut généralement appeler de « gestion ». Il y a à cela plusieurs raisons et il en découle plusieurs recommandations.
Les valeurs en jeu sont incommensurables à une même échelle et entre les échelles : il n’y
a donc pas de mesure commune et universelle des services écologiques. Ceux-ci appellent un autre mode de conception, plus dialogique où les acteurs doivent être associés à la définition des problèmes, des priorités mais aussi à l’exploration des solutions. En ce sens il n’y a pas ici, pas plus que dans l’entreprise, une « one best way ». Il est possible que dans telle région, le développement d’un élevage « confiné » (c’est ainsi que le MA dénomme l’élevage hors sol) soit une solution qui permette de préserver des écosystèmes d’une intensification dangereuse. Il est possible qu’ailleurs ce soit au contraire des systèmes associant de manière plus classique agriculture et élevage qui soit une solution satisfaisante. Dans le choix il y a des variables écologiques, mais aussi des choix culturels et d’aménagement du territoire qui interviennent. Le MA regorge d’exemples convaincants de cela.
Une maîtrise la moins mauvaise possible des interactions entre écosystèmes suppose que
participent à l’évaluation des partenaires représentant une diversité d’intérêts, des scientifiques et des technologues, mais aussi des professionnels et des citoyens. Il est exclu, si on veut gérer, de séparer arbitrairement la connaissance scientifique, la recherche technique et les acteurs porteurs d’intérêts divers. Ce qui importe c’est d’abord d’identifier les problèmes, de définir les objectifs puis ensuite de faire une évaluation des écosystèmes et de leurs relations.
La dimension culturelle de la valeur des écosystèmes ne doit pas être sous-estimée. Cette
valeur culturelle n’est pas seulement celle des paysages ou des formes d’intérêt qu’on peut avoir pour la vie sauvage ou la nature. Elle est aussi attachement à des sites, des modes d’alimentation, des coexistences sociales, voire des modes de vie qui sont souvent liés à des espaces et des écosystèmes agraires ou forestiers. Il ne s’agit pas ici de célébrer les traditions ou le retour nostalgique au passé, mais de valoriser toutes les formes d’attention au monde biophysique qui nous entoure. C’est là qu’on trouvera aussi un certain nombre de ressorts d’une action nécessairement collective de protection, de vigilance et de précaution. Or, cette dimension culturelle comporte aussi un danger de repli égocentrique sur son jardin, son
100
village, sa petite région ; il faut donc la développer et l’enrichir de concepts, de perspectives qui relient le citoyen à la complexité du monde. Et cette dimension culturelle, n’existera que si on lui donne le moyen de s’exprimer et de se confronter au monde réel.
C’est peut-être sur ces points qu’en Belgique et en tout cas en Région Wallonne nous
avons un effort à faire. Dans les défis de gestion des écosystèmes, il faut peut-être sortir de la vision d’un scientifique qui délivre ses connaissances à un décideur pour qu’il prenne les mesures nécessaires, qui seront ensuite mises en œuvre par une administration étroitement spécialisée.
Réaliser un MA en Belgique ? Opportunités et risques Pour conclure et répondre à la question qui était posée par cette journée : - faut il faire un
Millennium Ecosystem Assessment en Belgique ? - je répondrai de manière nuancée, car je n’ai pas tous les éléments permettant de porter un jugement qui de toute façon doit être collectif si on voulait constituer une force capable de le mener.
D’une part, je me demande si les enjeux d’évolution de nos milieux ruraux et agricoles
sont réellement de même nature (sans jeu de mots) que les principaux enjeux du MA à l’échelle globale. Je pense que nos enjeux sont plutôt des enjeux d’adaptation à des évolutions voire des enjeux qui tiennent à la reconstruction d’écosystèmes plus résilients et plus riches.
D’autre part, je me demande si nous manquons, comme beaucoup de pays en
développement, réellement des données ainsi que des institutions nécessaires à la gestion. Sur le plan des données ; je ne sais pas, mais sur le plan des institutions, c’est plutôt la pléthore des agences, des réglementations, des normes et le vrai problème c’est celui de leur coordination à des échelles d’action sui soient pertinentes et efficaces. Ici il est vrai que le MA, avec son cadre conceptuel, permettrait de faire un saut qualitatif dans l’appréhension des problèmes, dans l’identification des arbitrages, dans la construction plus prospective, mais cela n’a guère de sens de la faire au niveau national ni même sans doute régional. Des expériences plus localisées pourraient sans doute permettre une meilleure adaptation à la diversité de nos paysages, de nos systèmes de production. Ces expériences plus locales pourraient alors constituer un terrain d’apprentissage pour remonter à une échelle des règles régionales.
Enfin, comme j’y ai insisté dans la troisième partie de mon exposé, je pense que le MA,
ainsi utilisé, devrait en ce qui nous concerne mettre l’accent sur les questions de gouvernance. Il s’agirait d’en faire une expérience non seulement scientifique, mais aussi de gestion c’est-à-dire d’identification des problèmes qui font sens dans des contextes, de définition d’objectifs partagés, d’exploration des circuits institutionnels et décisionnels qui permettent de construire des propositions de décision.
Pour tout ceci qui me paraît urgent, le schéma du MA constitue un guide précieux.
101
Ecosystem services and the MA methodology applied to the Belgian Part of the North Sea
Magda. Vincx, Sofie. Derous, Steven Degraer
Ghent University, Biology Department, Marine Biology, [email protected]
Introduction The Belgian Part of the North Sea (BPNS) is one of the most exploited areas of the North
Sea and is approximately 1/9 of the surface of Belgium itself (figure. 1). In general, oceans and coastal seas give the impression of being immense with an enormous potential for new uses. The Southern Bight of the North Sea and in particular the part along the Belgian and Dutch coasts is the centre of intense commercial activity aimed at the exploitation of mineral (oil, gas, gravel) and living resources (fish, shrimps), transportation (pipelines, commercial fishing), infrastructure works (drilling rigs, buoys) and recreation (pleasure cruising, coastal tourism). Maes et al. (2005) showed that the sum of all potential demand for space at sea in Belgium is around 2.6 times larger than the available space (if space allocations are based on current legislation and if this space would actually be completely used). Apparently, some activities do not occupy all their legally allocated space (both in time and space) and some activities or infrastructures can be perfectly combined without spatial or temporal conflicts (e.g. cables and pipelines versus shipping). Nevertheless, future requirements for space will continue to increase. Several future plans (e.g. for offshore wind parks) illustrate the increasing demand for space within the BPNS.
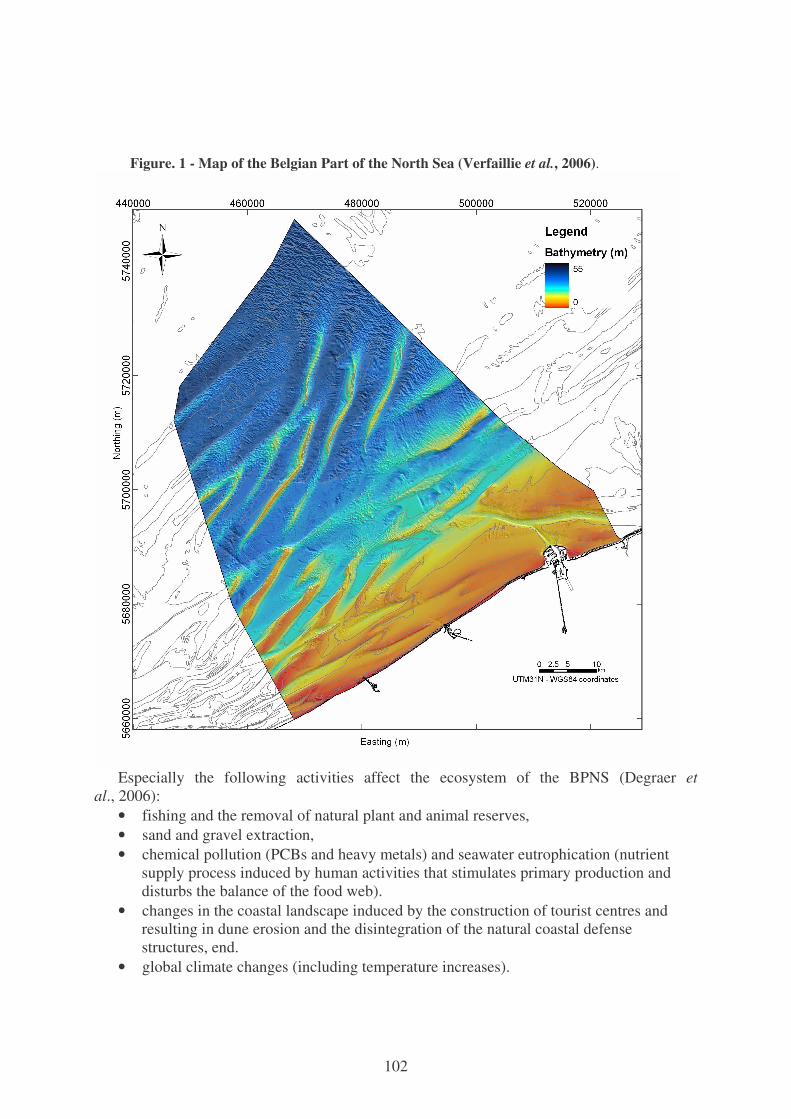
102
Figure. 1 - Map of the Belgian Part of the North Sea (Verfaillie et al., 2006).
Especially the following activities affect the ecosystem of the BPNS (Degraer et
al., 2006): • fishing and the removal of natural plant and animal reserves, • sand and gravel extraction, • chemical pollution (PCBs and heavy metals) and seawater eutrophication (nutrient
supply process induced by human activities that stimulates primary production and disturbs the balance of the food web).
• changes in the coastal landscape induced by the construction of tourist centres and resulting in dune erosion and the disintegration of the natural coastal defense structures, end.
• global climate changes (including temperature increases).
103
The effects of comparable disturbances are much more negative on land than in the sea. The sea actually works as a very large dynamically balanced buffer. Recovery thus remains possible to a certain extent at this time. However, it is currently not possible to assess the buffer capacity of the North Sea. It is therefore recommended to manage this environment carefully.
Policy makers are becoming more and more aware of the fact that sustainable use of the
resources and the space of the sea is an important item for reaching the objectives of MA. The BPNS is a heavily exploited area of the North Sea and there is an ever increasing awareness that we should use its resources and space in a sustainable matter. Policy makers who want to implement sustainable policy actions need good decision support systems (DSS). Such DSS should not only provide information on the socio-economic value of the BPNS but should also integrate biological and ecological information.
To objectively allocate the different user functions of the BPNS, a spatial structure plan,
which is based on the concept of integrated marine management, is needed. One of the baseline maps needed for such spatial structure plan is a biological valuation map, which indicates the biological value of the BPNS on a relative basis. The development and use of these maps will prevent the inclusion of subjective, non transparent expert judgement in the preparation of management decisions, a protocol that was followed frequently in the past.
Goods and Services provided by the Belgian Part of the North Sea: some examples Within the EU Network of excellence MarBEF (Marine Biodiversity and Ecosystem
Functioning), refined previously defined approaches for goods and services of the ecosystem with special reference to marine biodiversity (Beaumont et al., 2007) were discussed.
Many different methods of categorisation of goods and services have been defined
(Costanza et al., 1997, Pimentel et al., 1997, Millennium Ecosystem Assessment, 2003, Hein et al., 2006). The MA divides goods and services into four categories:
• Production services (products obtained from the ecosystem: e.g. fisheries, raw materials)
• Regulating services (benefits obtained from the regulation of ecosystem processes: exchange and regulation of carbon, bioremediation of waste, coastal defence (mangrove forests, salt marshes).
• Cultural services (nonmaterial benefits obtained from ecosystems) • Supporting services (without direct benefits to humans, but necessary for the other
services) Beaumont et al., 2007 defined seven case studies along the European coasts among which
the Belgian Part of the North Sea. The data obtained illustrate the importance of the BPNS in terms of goods and services and are presented in the following references: Cattrijsse and Vincx, 2001, Hydes et al., 1999, Maes et al., 2005, www.vliz.be/projects/; www.ices.dk/indexfla.asp, MIRA-T, 2005.
104
Typical aspects related to goods and services for the BPNS are the following:
Food provision The Belgian sea fishing industry (both catches inside and outside the BPNS) in 2002 had
landings for 25 810 tonnes (from which 23 445 demersal fish, 106 tons pelagic fish and 2259 tonnes shellfish), for a value of 91 911 000 euros.
In MIRA-T (2005), recent information is available regarding the state of the environment
of the fish stock in the North Sea with calculations for the BPNS as well. Only a few results are summarised in this overview. For instance for the North Sea cod
(Gadus morhua) we know that the Belgian part in international catch is 4.2 % of the total stock and for North Sea herring (Clupea harengus) less than 0.01 %. For demersal fish like plaice (Pleuronectes platessa) and Dover sole (Solea solea) the contribution of the Belgian catch is respectively 5.7 % and 6.7 % (values from ICES and ILVO for 2003 found in MIRA-T, 2005).
The evolution of the fish stocks from 1980 to 2005 indicates that different fish species
show clearly different evolutions, which is partly due to the fishing pressure (and some international regulations) and the impact of that pressure on the food web.
Since 1999, ICES (International Council for the Exploration of the Sea) follows the
precautionary approach in fisheries management. Fisheries can collapse due to overfishing, therefore fishing needs to be kept at levels which ensure the sustainability and productivity of stocks. This constraint is very familiar in fisheries management. The precautionary approach, however, goes further. It recognises what fishermen have always known: that advising on maximum levels of fishing and the minimum safe size of stocks required to ensure sustainability, is difficult to do with absolute accuracy. The precautionary approach requires fisheries managers to take account of the uncertainty in managing stocks. This is done by setting reference points – in effect trigger levels at which action is to be taken. In giving advice, ICES identified two key types of reference points: ‘limit’ and ‘precautionary’ reference points. The basic idea is that we should be managing fisheries to avoid breaching the precautionary reference points. We can then be reasonably confident that limit reference points – at which there is a serious risk of stock collapse – are never in practice reached. The reference points act as an amber warning light (the precautionary point) and as a red danger light (the limit point Flim). If we take a stock – say North Sea cod – there are two important questions for fisheries management: what is the level of the spawning stock and what is the level of fishing mortality taking place?
The ICES-report indicates in 2006 a clear decrease of cod spawning stock in the North
Sea going from about 180 000 tonnes in 1980 to less than 40 000 tonnes in 2005; since 1983, the stocks of cod reached the precautionary level of 150 000 tonnes and since 1990, the Flim (expressed as Blim in the figures) of 70 000 tonnes was obtained, Flim being the level of fishing mortality at which there is an unacceptably high risk that stocks will collapse). Therefore, ICES classifies the stock of cod as being harvested unsustainably and suffering reduced reproductive capacity. Fishing mortality has shown a decline since 2000 and is currently
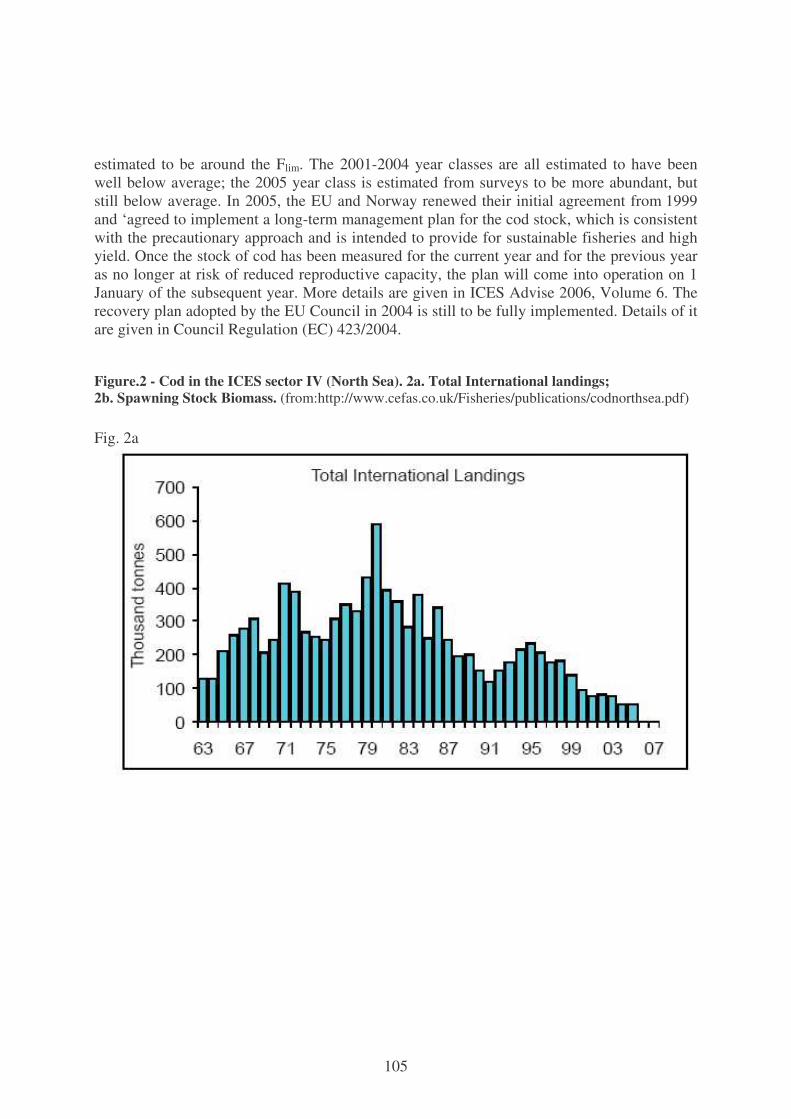
105
estimated to be around the Flim. The 2001-2004 year classes are all estimated to have been well below average; the 2005 year class is estimated from surveys to be more abundant, but still below average. In 2005, the EU and Norway renewed their initial agreement from 1999 and ‘agreed to implement a long-term management plan for the cod stock, which is consistent with the precautionary approach and is intended to provide for sustainable fisheries and high yield. Once the stock of cod has been measured for the current year and for the previous year as no longer at risk of reduced reproductive capacity, the plan will come into operation on 1 January of the subsequent year. More details are given in ICES Advise 2006, Volume 6. The recovery plan adopted by the EU Council in 2004 is still to be fully implemented. Details of it are given in Council Regulation (EC) 423/2004.
Figure.2 - Cod in the ICES sector IV (North Sea). 2a. Total International landings; 2b. Spawning Stock Biomass. (from:http://www.cefas.co.uk/Fisheries/publications/codnorthsea.pdf)
Fig. 2a
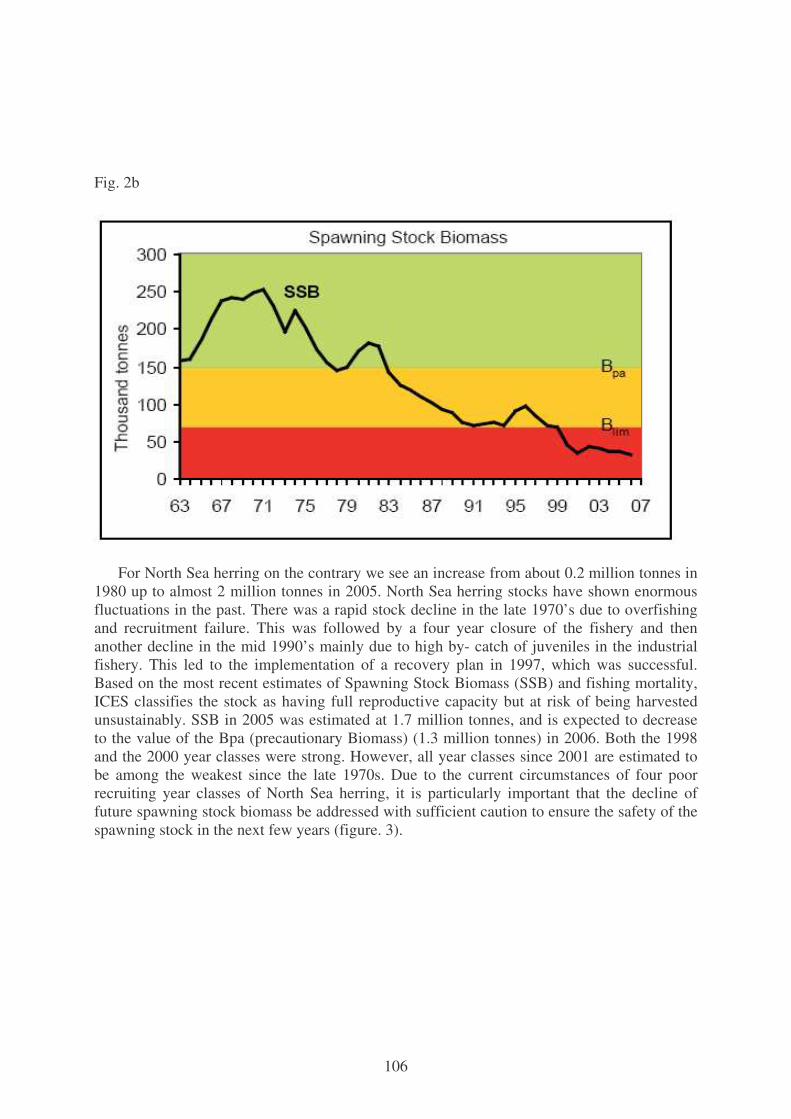
106
Fig. 2b
For North Sea herring on the contrary we see an increase from about 0.2 million tonnes in
1980 up to almost 2 million tonnes in 2005. North Sea herring stocks have shown enormous fluctuations in the past. There was a rapid stock decline in the late 1970’s due to overfishing and recruitment failure. This was followed by a four year closure of the fishery and then another decline in the mid 1990’s mainly due to high by- catch of juveniles in the industrial fishery. This led to the implementation of a recovery plan in 1997, which was successful. Based on the most recent estimates of Spawning Stock Biomass (SSB) and fishing mortality, ICES classifies the stock as having full reproductive capacity but at risk of being harvested unsustainably. SSB in 2005 was estimated at 1.7 million tonnes, and is expected to decrease to the value of the Bpa (precautionary Biomass) (1.3 million tonnes) in 2006. Both the 1998 and the 2000 year classes were strong. However, all year classes since 2001 are estimated to be among the weakest since the late 1970s. Due to the current circumstances of four poor recruiting year classes of North Sea herring, it is particularly important that the decline of future spawning stock biomass be addressed with sufficient caution to ensure the safety of the spawning stock in the next few years (figure. 3).
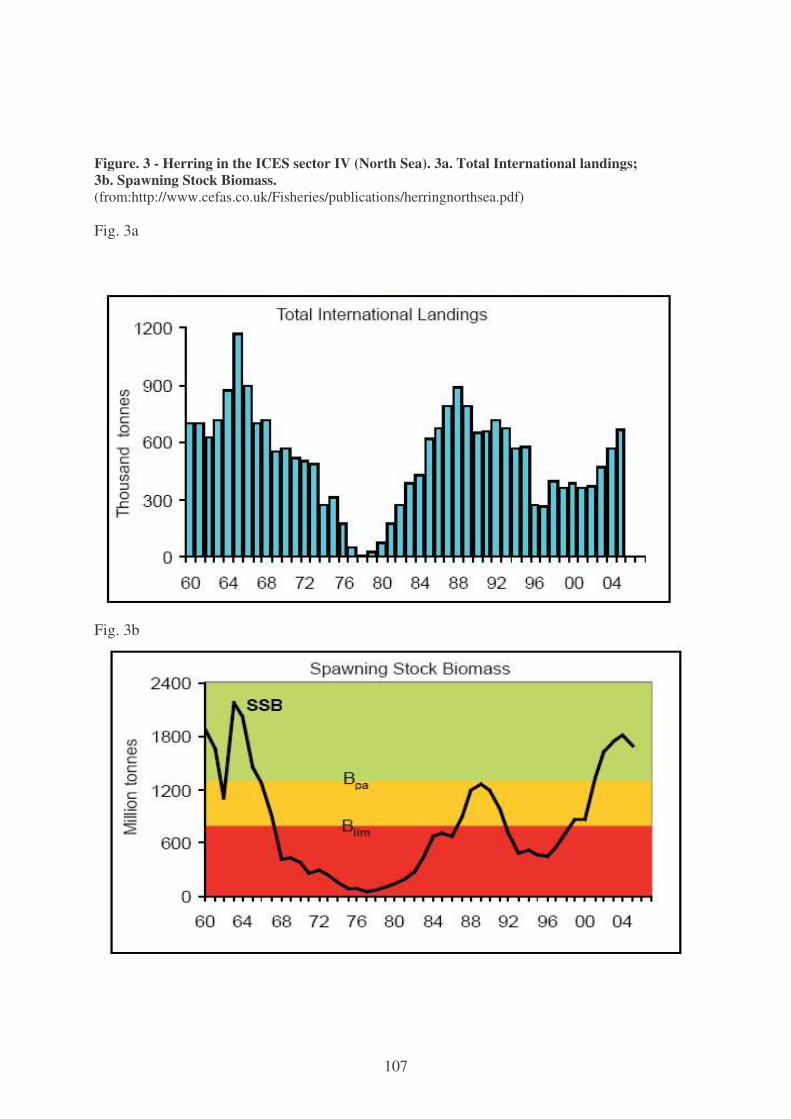
107
Figure. 3 - Herring in the ICES sector IV (North Sea). 3a. Total International landings; 3b. Spawning Stock Biomass. (from:http://www.cefas.co.uk/Fisheries/publications/herringnorthsea.pdf)
Fig. 3a
Fig. 3b
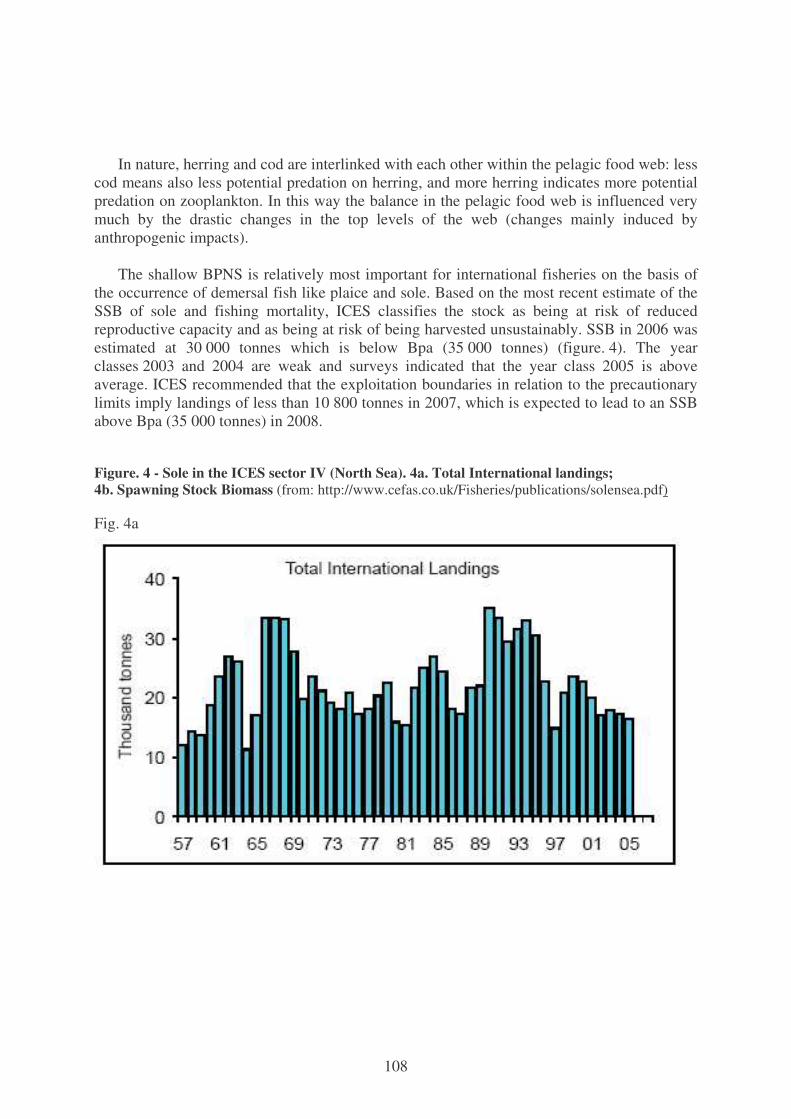
108
In nature, herring and cod are interlinked with each other within the pelagic food web: less cod means also less potential predation on herring, and more herring indicates more potential predation on zooplankton. In this way the balance in the pelagic food web is influenced very much by the drastic changes in the top levels of the web (changes mainly induced by anthropogenic impacts).
The shallow BPNS is relatively most important for international fisheries on the basis of
the occurrence of demersal fish like plaice and sole. Based on the most recent estimate of the SSB of sole and fishing mortality, ICES classifies the stock as being at risk of reduced reproductive capacity and as being at risk of being harvested unsustainably. SSB in 2006 was estimated at 30 000 tonnes which is below Bpa (35 000 tonnes) (figure. 4). The year classes 2003 and 2004 are weak and surveys indicated that the year class 2005 is above average. ICES recommended that the exploitation boundaries in relation to the precautionary limits imply landings of less than 10 800 tonnes in 2007, which is expected to lead to an SSB above Bpa (35 000 tonnes) in 2008.
Figure. 4 - Sole in the ICES sector IV (North Sea). 4a. Total International landings; 4b. Spawning Stock Biomass (from: http://www.cefas.co.uk/Fisheries/publications/solensea.pdf)
Fig. 4a
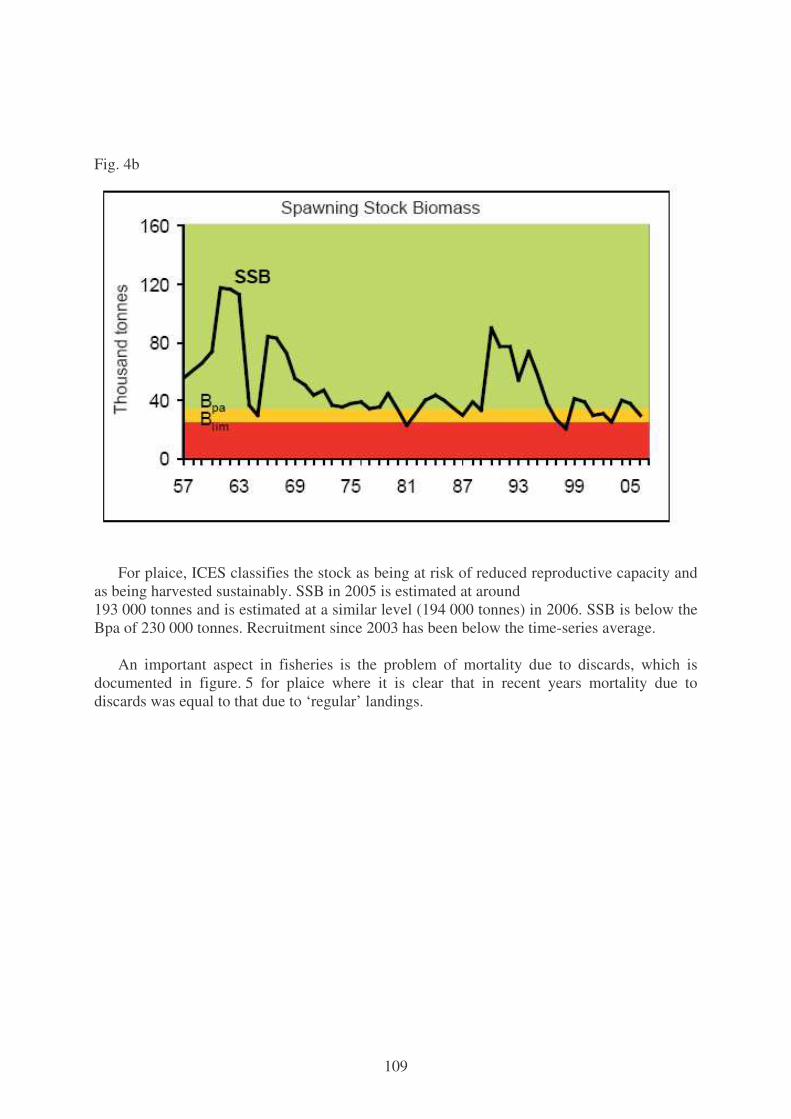
109
Fig. 4b
For plaice, ICES classifies the stock as being at risk of reduced reproductive capacity and
as being harvested sustainably. SSB in 2005 is estimated at around 193 000 tonnes and is estimated at a similar level (194 000 tonnes) in 2006. SSB is below the Bpa of 230 000 tonnes. Recruitment since 2003 has been below the time-series average.
An important aspect in fisheries is the problem of mortality due to discards, which is
documented in figure. 5 for plaice where it is clear that in recent years mortality due to discards was equal to that due to ‘regular’ landings.
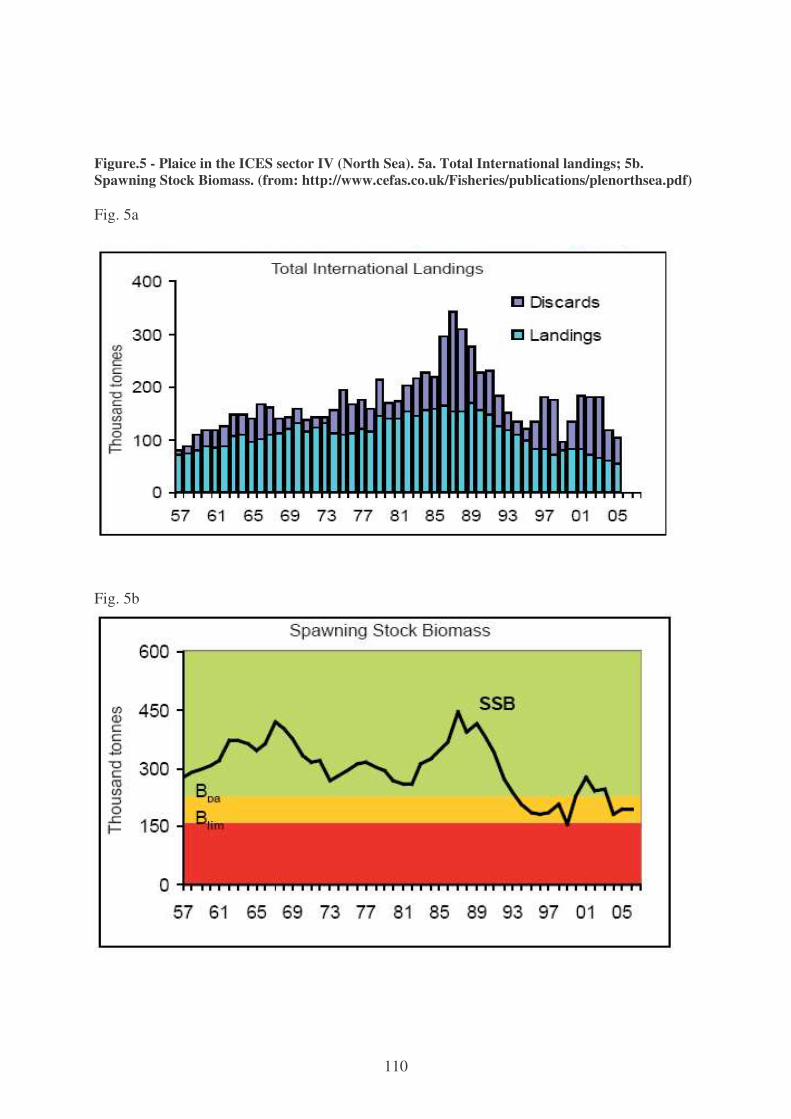
110
Figure.5 - Plaice in the ICES sector IV (North Sea). 5a. Total International landings; 5b. Spawning Stock Biomass. (from: http://www.cefas.co.uk/Fisheries/publications/plenorthsea.pdf) Fig. 5a
Fig. 5b
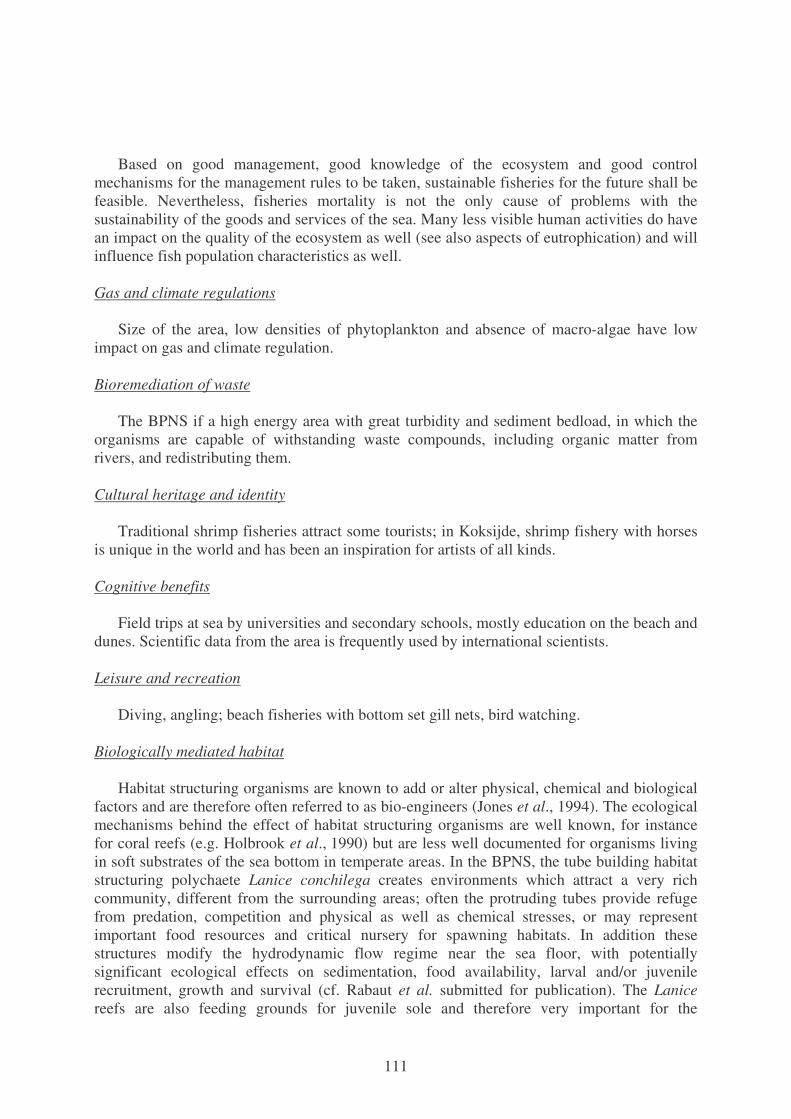
111
Based on good management, good knowledge of the ecosystem and good control mechanisms for the management rules to be taken, sustainable fisheries for the future shall be feasible. Nevertheless, fisheries mortality is not the only cause of problems with the sustainability of the goods and services of the sea. Many less visible human activities do have an impact on the quality of the ecosystem as well (see also aspects of eutrophication) and will influence fish population characteristics as well. Gas and climate regulations
Size of the area, low densities of phytoplankton and absence of macro-algae have low
impact on gas and climate regulation.
Bioremediation of waste The BPNS if a high energy area with great turbidity and sediment bedload, in which the
organisms are capable of withstanding waste compounds, including organic matter from rivers, and redistributing them.
Cultural heritage and identity
Traditional shrimp fisheries attract some tourists; in Koksijde, shrimp fishery with horses
is unique in the world and has been an inspiration for artists of all kinds.
Cognitive benefits Field trips at sea by universities and secondary schools, mostly education on the beach and
dunes. Scientific data from the area is frequently used by international scientists.
Leisure and recreation Diving, angling; beach fisheries with bottom set gill nets, bird watching.
Biologically mediated habitat Habitat structuring organisms are known to add or alter physical, chemical and biological
factors and are therefore often referred to as bio-engineers (Jones et al., 1994). The ecological mechanisms behind the effect of habitat structuring organisms are well known, for instance for coral reefs (e.g. Holbrook et al., 1990) but are less well documented for organisms living in soft substrates of the sea bottom in temperate areas. In the BPNS, the tube building habitat structuring polychaete Lanice conchilega creates environments which attract a very rich community, different from the surrounding areas; often the protruding tubes provide refuge from predation, competition and physical as well as chemical stresses, or may represent important food resources and critical nursery for spawning habitats. In addition these structures modify the hydrodynamic flow regime near the sea floor, with potentially significant ecological effects on sedimentation, food availability, larval and/or juvenile recruitment, growth and survival (cf. Rabaut et al. submitted for publication). The Lanice reefs are also feeding grounds for juvenile sole and therefore very important for the
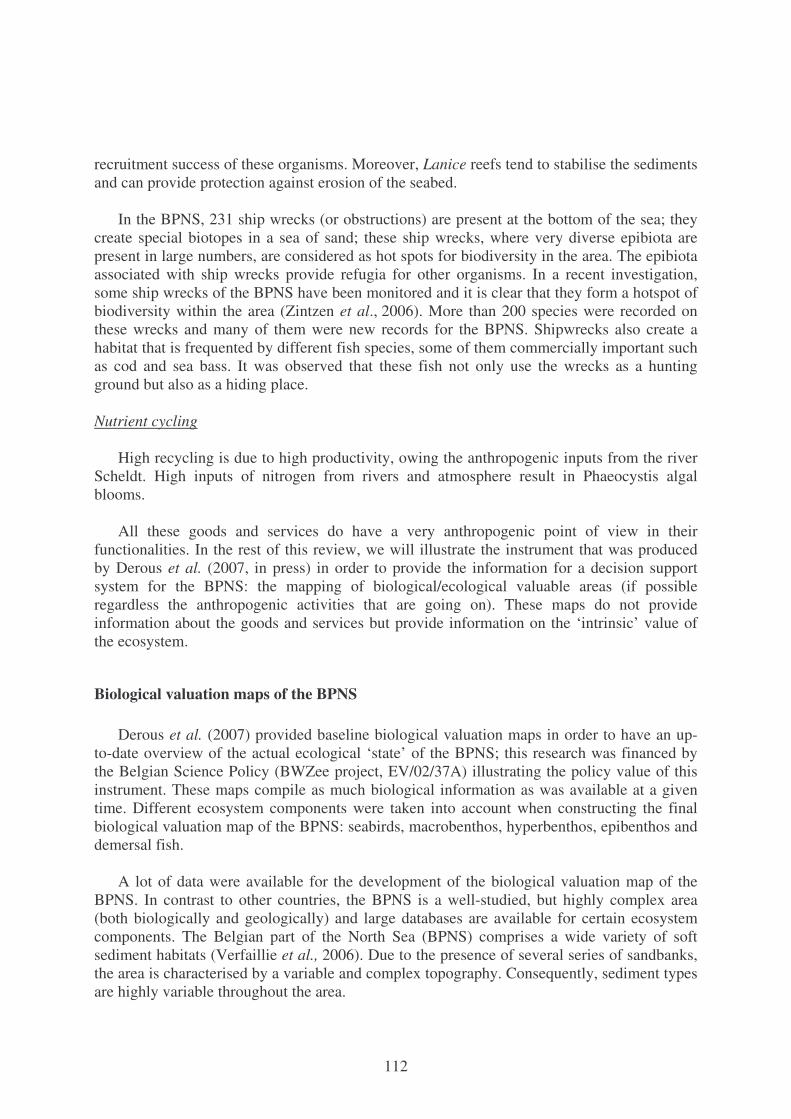
112
recruitment success of these organisms. Moreover, Lanice reefs tend to stabilise the sediments and can provide protection against erosion of the seabed.
In the BPNS, 231 ship wrecks (or obstructions) are present at the bottom of the sea; they
create special biotopes in a sea of sand; these ship wrecks, where very diverse epibiota are present in large numbers, are considered as hot spots for biodiversity in the area. The epibiota associated with ship wrecks provide refugia for other organisms. In a recent investigation, some ship wrecks of the BPNS have been monitored and it is clear that they form a hotspot of biodiversity within the area (Zintzen et al., 2006). More than 200 species were recorded on these wrecks and many of them were new records for the BPNS. Shipwrecks also create a habitat that is frequented by different fish species, some of them commercially important such as cod and sea bass. It was observed that these fish not only use the wrecks as a hunting ground but also as a hiding place.
Nutrient cycling
High recycling is due to high productivity, owing the anthropogenic inputs from the river Scheldt. High inputs of nitrogen from rivers and atmosphere result in Phaeocystis algal blooms.
All these goods and services do have a very anthropogenic point of view in their
functionalities. In the rest of this review, we will illustrate the instrument that was produced by Derous et al. (2007, in press) in order to provide the information for a decision support system for the BPNS: the mapping of biological/ecological valuable areas (if possible regardless the anthropogenic activities that are going on). These maps do not provide information about the goods and services but provide information on the ‘intrinsic’ value of the ecosystem.
Biological valuation maps of the BPNS Derous et al. (2007) provided baseline biological valuation maps in order to have an up-
to-date overview of the actual ecological ‘state’ of the BPNS; this research was financed by the Belgian Science Policy (BWZee project, EV/02/37A) illustrating the policy value of this instrument. These maps compile as much biological information as was available at a given time. Different ecosystem components were taken into account when constructing the final biological valuation map of the BPNS: seabirds, macrobenthos, hyperbenthos, epibenthos and demersal fish.
A lot of data were available for the development of the biological valuation map of the
BPNS. In contrast to other countries, the BPNS is a well-studied, but highly complex area (both biologically and geologically) and large databases are available for certain ecosystem components. The Belgian part of the North Sea (BPNS) comprises a wide variety of soft sediment habitats (Verfaillie et al., 2006). Due to the presence of several series of sandbanks, the area is characterised by a variable and complex topography. Consequently, sediment types are highly variable throughout the area.
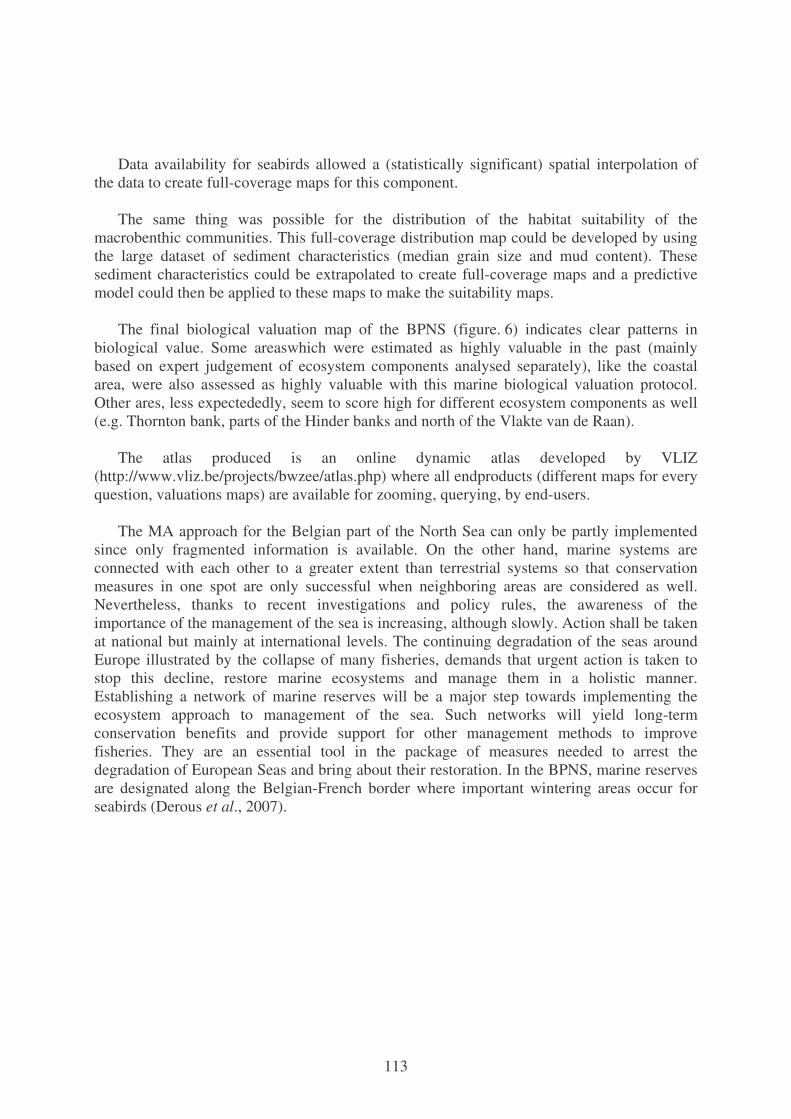
113
Data availability for seabirds allowed a (statistically significant) spatial interpolation of the data to create full-coverage maps for this component.
The same thing was possible for the distribution of the habitat suitability of the
macrobenthic communities. This full-coverage distribution map could be developed by using the large dataset of sediment characteristics (median grain size and mud content). These sediment characteristics could be extrapolated to create full-coverage maps and a predictive model could then be applied to these maps to make the suitability maps.
The final biological valuation map of the BPNS (figure. 6) indicates clear patterns in
biological value. Some areaswhich were estimated as highly valuable in the past (mainly based on expert judgement of ecosystem components analysed separately), like the coastal area, were also assessed as highly valuable with this marine biological valuation protocol. Other ares, less expectededly, seem to score high for different ecosystem components as well (e.g. Thornton bank, parts of the Hinder banks and north of the Vlakte van de Raan).
The atlas produced is an online dynamic atlas developed by VLIZ
(http://www.vliz.be/projects/bwzee/atlas.php) where all endproducts (different maps for every question, valuations maps) are available for zooming, querying, by end-users.
The MA approach for the Belgian part of the North Sea can only be partly implemented
since only fragmented information is available. On the other hand, marine systems are connected with each other to a greater extent than terrestrial systems so that conservation measures in one spot are only successful when neighboring areas are considered as well. Nevertheless, thanks to recent investigations and policy rules, the awareness of the importance of the management of the sea is increasing, although slowly. Action shall be taken at national but mainly at international levels. The continuing degradation of the seas around Europe illustrated by the collapse of many fisheries, demands that urgent action is taken to stop this decline, restore marine ecosystems and manage them in a holistic manner. Establishing a network of marine reserves will be a major step towards implementing the ecosystem approach to management of the sea. Such networks will yield long-term conservation benefits and provide support for other management methods to improve fisheries. They are an essential tool in the package of measures needed to arrest the degradation of European Seas and bring about their restoration. In the BPNS, marine reserves are designated along the Belgian-French border where important wintering areas occur for seabirds (Derous et al., 2007).
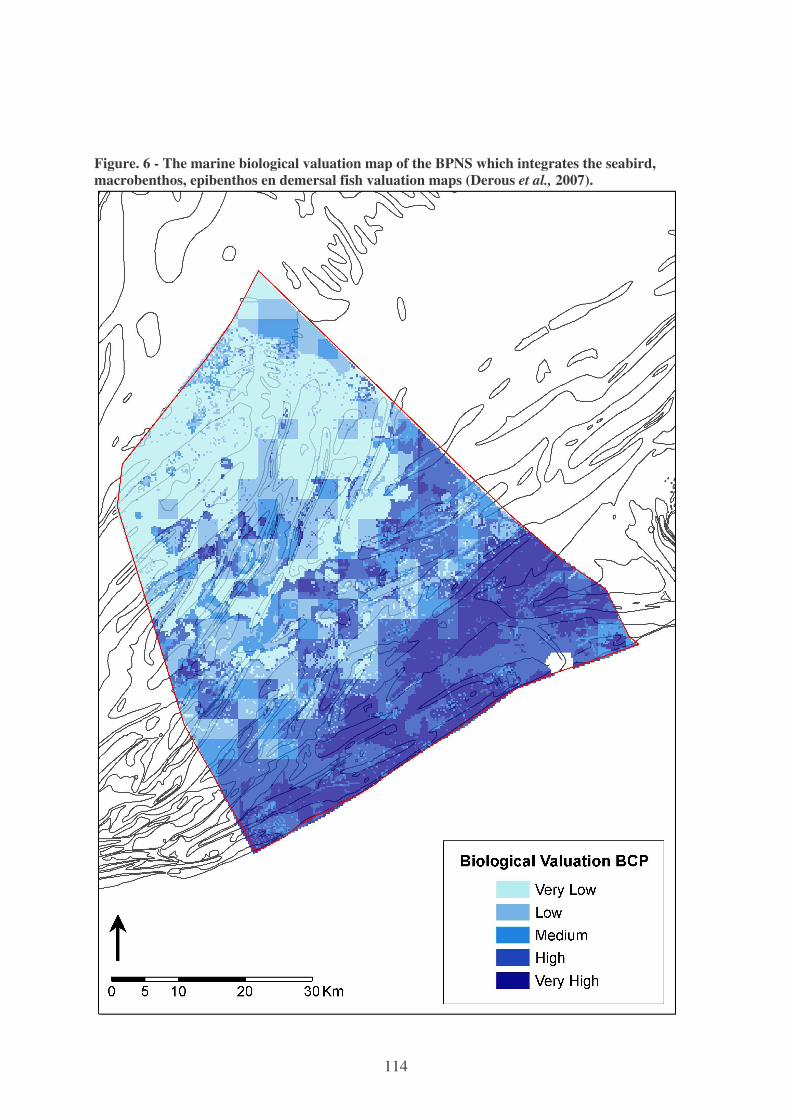
114
Figure. 6 - The marine biological valuation map of the BPNS which integrates the seabird, macrobenthos, epibenthos en demersal fish valuation maps (Derous et al., 2007).
115
References
Beaumont, N.J., Austen, M.C., Atkins, J., Burdon, D., Degraer, S., Dentinho, T.P., Derous, S., Holm, P., Horton, T., van Ierland, E., Marboe, A.H., Starkey, D.J., Townsend, M. and Zarzycki, T. 2007. Identification, definition and quantification of goods and services provided by marine biodiversity: Implications for the ecosystem approach.-Marine Pollution Bulletin, 54:253-265.
Cattrijsse, A. and Vincx, M. 2001. Biodiversity of the benthos and the avifauna of the Belgian coastal waters – summary of data collected between 1970 and 1998.-Federal Office for Scientific, Technical and Cultural affairs, Brussels. Pp. 1-48.
Costanza, R., d’Arge, R., de Groot, R.S., Farber, S., Grasso, M., Hannon, B., Limburg, K., Naeem, S., O’Neill, R., Paruelo, J., Raskin, R., Sutton, P., van den Belt, 1997. The value of the world’s ecosystem services and natural capital.-Nature, 387: 253-260.
Degraer, S., Wittoeck, J., Appeltans, W., Cooreman, K., Deprez, T., Hillewaert, H., Hostens, K., Mees, J., Vanden Berghe J. and M. Vincx. 2006. The macrobenthos atlas of the Belgian Part of the North Sea. -Report /2005/1191/3.-Belgian Science Policy, Brussels. 164 p. ISBN 90-810081-6-1.
Derous, S., Verfaillie E., Van Lancker V., Courtens W., Stienen E.W.M., Hostens K., Moulaert I., Hillewaert H., Mees J., Deneudt K., Deckers P., Cuvelier D., Vincx M., Degraer, S. 2007. A biological valuation map for the Belgian part of the North Sea: BWZee. Final report, BELSPO programme “Global change, ecosystems and biodiversity” – SPSD II.-Belgian Science Policy, Brussels. 99 p.
Derous, S., T. Agardy, H. Hillewaert, K. Hostens, G. Jamieson, L. Lieberknecht, J. Mees, I. Moulaert, S. Olenin, D. Paelinckx, M. Rabaut, E. Rachor, J. Roff, E.W.M. Stienen, J. Tjalling van der Wal, V. Van Lancker, E. Verfaillie, M. Vincx, J. M. Weslawski, S. Degraer (in press). A concept for biological valuation in the marine environment.-Oceanologia.
Hein, L., Koppen, K., de Groot, R., Ierland, E. 2006. Spatial scales, stakeholders and the valuation of ecosystem services.-Ecological Economics, 57, 209-228.
Holbrook, S.J., Schmitt, R.J., R.F. Ambrose. 1990. Biogenic habitat structure and characteristics of temperate reef fish assemblages.-Australian Journal of Ecology, 15 (4): 489-503.
Hydes, D.J., Kelly-Gerreyn, B.A., Le Gall, A.C., Prector, R. 1999. The balance of supply of nutrients and demands of biological production and denitrification in a temperate latitude shelf sea – a treatment of the North Sea as an extended estuary.-Marine Chemistry, 68: 117-131.
ICES ADVISE. 2006. Report of the ICES Advisory Committee on Fisheries Management, Advisory Committee on the Marine Environment and Advisory Committee on Ecosystems. Book 6, North Sea.-International Council for the Exploration of the Sea, Copenhaguen. 314 p.
Jones, C.G., Lawton, J.H., M. Shachak. 1994. Organisms as ecosystem engineers.-Oikos, 69: 373-386.
Maes, F., Schrijvers, J., A. Vanhulle (Eds.) 2005. A Flood of Space. Towards a Spatial structure Plan for the Sustainable Management of the North Sea.-Belgian Science Policy, Brussels. 204 p.
Millennium Ecosystem Assessment. 2003. Ecosystems and Human Well-being: A framework for Assessment.-Island Press, Washington D.C. http://www.millenniumassessment.org/
116
MIRA. 2005. Milieurapport Vlaanderen. Calewaert J.-B., Lescrauwaet A.-K., Mees J., Seys J., Hostens K., Redant F., Moulaert I., Raemaekers M., Demare W., Vanhooreweder B., Mergaert K., Maes F., Douvere F., Belpaeme, K., Maelfait H., Kyramarios M., Tak P., Overloop S., Peeters B. Achtergronddocument, Kust en zee.-Vlaamse Milieumaatschappij, Brussels. www.milieurapport.be.
Pimentel, D., Wilson, C., McCullum, C., Huang, R., Dwen, P., Flack, J., Tran, Q., saltman, T., Cliff, B. 1997. Economic and environmental benefits of biodiversity.-Bioscience, 47 (11): 747-757.
Rabaut, M., K. Guilini, G. Van Hoey, M. Vincx and S. Degraer. Submitted. A Bio-engineered soft-bottom environment: the impact of Lanice conchilega on the benthic species-specific densities and community structure.-Estuarine Coastal Shelf Science.
Verfaillie, E., Van Lancker V., Van Meirvenne M. 2006. Multivariate geostatistics for the predictive modelling of the surficial sand distribution in shelf seas.-Continental Shelf Research, 26: 2454-2468.
Zintzen, V., Vanden Berghe, E., S. Degraer, A. Norro, J. Mallefet. 2006. North Sea wrecks: hotspots for biodiversity. In: Pieters, M. et al. (Eds.). 2006. Colloquium: To Sea or not to sea – 2nd international colloquium on maritime and fluvial archaeology in the southern North Sea area, Brugge (Belgium). 21-23 September 2006. -VLIZ (Oostende, Belgium) special Publication, 32: 39-40.
117
Les animaux dénaturés : la bonne question ?
Prof. Emmanuël Sérusiaux
Université de Liège, Taxonomie végétale et Biologie de la conservation, [email protected]
Le temps qui passe m’autorise progressivement à revendiquer le bénéfice de l’expérience et donc la possibilité de commenter l’évolution des politiques environnementales. C’est en 1967 que je prenais mes premières affiliations à deux associations de conservation de la nature (elles sont depuis lors devenues Natagora) et, au cours des vingt dernières années, mes états de service indiquent que j’ai participé à la direction du cabinet du Ministre wallon de l’environnement pendant près de huit ans.
Mais je ne me lasse pas d’être étonné : ce 12 octobre 2006, se terminait en Méditerranée et
en Mer Noire une croisière culturelle de luxe (11 jours), sur un yacht magnifique (Le Funchal; voir www.terreentiere.com et La Recherche 399: 63, 2006) dont le thème était « Evolution de l’homme et changements climatiques ». Je ne donnerai pas le nom des illustres conférenciers des soirées en mer, les textes de leurs conférences étant disponibles sur le site de l’armateur1. Mais pas possible de trouver en quoi cette croisière participait au développement durable (piscine chauffée, climatisation, etc.). Chacun tirera assurément des leçons impertinentes du statut qu’ont désormais acquis les changements climatiques dans le corps social.
Le Millenium Ecosystem Assessment est une énorme base documentaire et un travail
intégré extraordinaire. Il servira certainement de sources de données et de références. Au travers de cette intégration à l’échelle mondiale des données, et du calcul d’indices
globalisés, et de l’évaluation en termes de capitaux et de services souvent monétarisés, certains croient avoir établi la stratégie opérationnelle de l’avenir et du développement durable. Grand bien leur fasse !
Pour ma part, je voudrais souligner quatre grands thèmes de réflexion.
Il est nécessaire de retourner aux fondements de l’humanisme pour assurer le développement durable
C’est bien une question philosophique au sens où l’entend Luc Ferry, c’est-à-dire la
recherche du salut sans dieu. Tout en consolidant les acquis extraordinaires de l’humanisme (démocratie, équité,
justice), il nous faut bien constater que celui-ci est consubstantiel avec le concept de l’homme
1 www.terreentiere.com/pages/commun/frameset.asp?PAGE=albums_photos
118
dénaturé. L’histoire du chaînon manquant dans Les Animaux dénaturés d’André Vercors l’illustre bien : « Pour s’interroger, il faut être deux, celui qui interroge et ce qu’on interroge. Confondu avec la nature, l’animal ne peut s’interroger. L’animal fait donc un avec la nature. L’homme fait deux » Tant que perdurera la conviction que nous faisons deux avec notre environnement, bien résumée par la déclaration d’Edouard Balladur, alors Premier Ministre de France, au Financial Times en 1993 : « Qu’est-ce que la civilisation ? C’est la lutte contre la nature ! », tant que perdurera cette confrontation, les bases philosophiques du développement durable ne seront pas jetées.
Le développement durable est d’abord la question de l’émancipation de la femme C’est la question de la surpopulation. Le développement durable dans ses dimensions de
procurer la nourriture, le bien-être, la santé, la culture et l’éducation est-il possible avec une croissance annuelle nette de 76 millions d’habitants 2 ? C’est-à-dire dans un monde où le machisme domine et où l’émancipation des femmes n’est encore qu’un objectif lointain.
La conservation de la biodiversité est d’abord une question de proximité et elle représente un coût d’opportunité qui doit être pris en charge.
La protection de la nature ne peut se résoudre à la préservation des ressources et à
constituer un support de l’économie, quelle qu’en soit la forme ; il est parfaitement possible d’exploiter des ressources sans les compromettre mais sans pour autant protéger la biodiversité de la planète ou simplement des écorégions, ni les mécanismes qui la sous-tendent. Dans une certaine mais très significative mesure, il est facile de démontrer que la conservation de la biodiversité est un coût d’opportunité à supporter, et non une méthode raisonnée de développement économique 3.
A une époque où la plupart des théoriciens et praticiens de la politique environnementale
n’abordent les questions que globalement et ne les déclinent qu’à l’aune de la mondialisation, il serait heureux de retrouver l’échelle où se gèrent beaucoup (pas tous bien sûr !) de problèmes d’environnement, l’échelle locale. Il est donc bien question de « rivalités d’usage ». On se rappellera ici les deux premières phrases de l’ouvrage de Dominique Bourg « La dimension planétaire des problèmes écologiques, désormais évidente, ne saurait occulter la diversité des relations que nous entretenons avec la nature. S’il n’est qu’une seule planète Terre, il est en revanche de multiples façons de l’habiter » (Bourg, 1993 :7).
2 Voir www.populationaction.org/resources/factsheets/FS7_7Billion_final.pdf 3 Voir à titre de base de discussion (du Toit J. T. et al., 2004).
119
Les concepts et les outils de l’intégration du développement durable dans les termes de référence de l’économie et de la croissance sont imparfaits et doivent encore être mis au point
Personne ne peut démontrer que la croissance des richesses (« la croissance
économique ») peut être écartée, sans en perdre la valeur ajoutée, c’est-à-dire l’emploi et les ressources pour le bien-être d’une population croissante ou vieillissante. Si on ne peut montrer le contraire, il faut donc mettre en place des mécanismes de découplage, c’est-à-dire faire en sorte que la croissance de l’économie ne soit pas synonyme d’épuisement des ressources naturelles et de croissance de la pression sur l’environnement. Ces outils intégrés ne semblent pas exister, ou en tout cas ne pas être d’application4.
Il est grand temps que les pages environnementales et économiques de nos quotidiens se
rejoignent ! Je terminerai en rappelant les conclusions de nos excellents Collègues du Muséum
d’histoire naturelle de Paris, Patrick Blandin et Donato Bergandi, dans leur excellent article « A l’aube d’une nouvelle écologie ? » « Aujourd’hui, il faut enfin admettre qu’il n’y a plus la nature d’un côté, l’homme de l’autre. (…) Le concept clé est moins le système que le réseau temporel et spatial de transactions impliquant des entités cochangeantes : les hommes et les autres composantes de la biosphère, vivantes et non vivantes. S’il faut écrire aujourd’hui ladite déclaration, ce sera celle de l’interdépendance générale. Le rôle des valeurs éthiques apparaît alors aussi essentiel que celui des connaissances disponibles. La science offre des interprétations provisoires, propose des méthodes pour faire évoluer les interprétations, pour déplacer, sans la réduire, la frange de l’incertitude. Ce faisant, elle peut, elle doit contribuer aux choix de la société qui la convoque, mais elle n’a aucune légitimité particulière pour favoriser un choix plutôt qu’un autre. A chaque instant, dans l’incertitude, les hommes doivent construire leur projet, c’est-à-dire un programme de transactions aux effets espérés à l’échelle locale et à l’échelle globale. Ils contribuent ainsi à tracer au quotidien l’irréversible trajectoire de la planète, en tenant de faire en sorte que les générations à venir ne soient pas enfermées dans un attracteur infernal ».
4 On rappellera ici l’échec, dans le modèle économique qui est le nôtre, des projets Integrated Conservation and Development Projects. Voir «Environmentalists thought they could save the rain forest and make money at the same time. They were wrong.» (Newsweek 16/2/2004 : 44-onwards), et également «Win Win Illusion». Conservation in pratice 5 : 12-onwards, 2004. En particulier la p. 17 sur les Integrated Conservation and Development Projects (ICDPs) : «What went wrong?».
120
Références Blandin, P. and Bergandi, D. 2000. A l’aube d’une nouvelle écologie ?-La Recherche 332 :
56-59. Bourg, D. (Ed.) 1993. Les sentiments de nature. La Découverte, Paris, 246 p. du Toit, J.T. et al., 2004. Conserving tropical nature : current challenges for ecologists.-
Trends in Ecology and Evolution 19 : 12-17. Ferry, L. 2006. Apprendre à vivre. Traité de philosophie à l’usage des jeunes générations.-
Plon, Paris.
121
The Millennium Ecosystem Assessment: Implications for research
Jurgen Tack
Research Institute for Nature and Forest Belgian Biodiversity Platform
From a review of the Millennium Ecosystem Assessment, it appears that the following research priorities should be addressed by the relevant funding bodies, institutions and researchers in Belgium:
1. Better understanding how biodiversity relates to ecosystem functioning, including: • research to study the effect of biodiversity changes (species loss) on ecosystem
functioning • research on resilience and stability of ecosystem functioning • field experiments
2. Better understanding how biodiversity & ecosystem functions relate to the provision of services, including:
• identification of ecosystem functions underpinning the provision of goods and services
(relationship with biodiversity) • research on environmental limits of acceptable change (how much change in
biodiversity) • development of tools allowing valuation of ecosystem goods and services reflecting as
well total economic value of ecosystems as biological value (intrinsic biological value) • valuation of the functional role of the bio-indicators
3. Impact of environmental change on ecosystem services, including:
• the identification of the different sources of disturbance and their impact on ecosystem services
• the assessment of the impact of climate change, land use change, invasive species, overexploitation and pollution on ecosystem services
• the quantification of the tolerance of major drivers/pressures on biodiversity, ecosystem goods and services
• a better quantification of losses and desired levels of ecosystem services
122
4. Impact of changing ecosystem services on human well-being, including:
• research on how we can manage environmental change in terms of ecosystem services • the development of interdisciplinary tools for assessing the value of impacts of
changes in ecosystem services on human well-being
5. Development of management related research, including:
• the development of models and/or scenarios to study the effects of environmental change and/or management changes on ecosystem services
• experimental testing of management options • research on restoration of ecosystem degradation and system management
6. Better understanding of scale issues, including:
• the use of different scales for multipurpose ecosystem assessment • research on interactions between multiple scales • research on the choice of scale which is not politically neutral
7. Better understanding of the time horizon, including:
• the collection of relevant data and the development of data archives (- 50 years) • the use of long-term data series • the development of scenarios (+ 50 years) • the development of analytical tools for past and future trends
To enable this research there is an urgent need for an overview and classification of ecosystem services in Belgium. During the meeting, the point was also made by the participants that ineffective transfer of the scientific methodology is limiting the implementation of the Millennium Ecosystem Assessment in a Belgian context, and therefore that actions should be taken to:
• communicate the Millennium Ecosystem Assessment to all stakeholders including researchers, policy makers and the public
• develop a science-policy interface to promote the Millennium Ecosystem Assessment approach
123
Belgium’s National Biodiversity Strategy: how is it linked to the Millennium Ecosystem Assessment?
Marianne Schlesser
Royal Belgian Institute of Natural Sciences [email protected]
The day before the Colloquium «Millennium Ecosystem Assessment: what implications for Belgium? », the Belgian Interministerial Conference of the Environment approved the text of Belgium’s first national strategy on biodiversity. This of course is a coincidence; hence it offers an opportunity to comment.
This paper aims to outline the links between this important step towards Belgium’s
involvement in the conservation of biodiversity at the national and international levels and the conceptual framework of the Millennium Ecosystem Assessment (MA).
The MA and the Convention on Biological Diversity Biological diversity − or biodiversity − refers to the variety of life on Earth at the gene,
species and ecosystem levels. The organisms we see today are the result of more than 3.5 billions of years of evolution, shaped by natural processes and, more recently, by the impact of man. Biodiversity contributes to human well-being as it plays a key role in the way ecosystems function and in the many services they provide to humans. Biodiversity conservation is an utmost concern for the present generation in view of the well-being of future generations.
The United Nations Convention on Biological Diversity (CBD) is one of the most broadly
subscribed environmental treaties in the world. Opened for signature at the Earth Summit in Rio de Janeiro in 1992, it currently has 190 Parties − 189 States and the European Union. They have committed themselves to the three main goals of the Convention: the conservation of biodiversity, the sustainable use of its components and the equitable sharing of the benefits arising out of the utilisation of genetic resources.
Launched by the United Nations in 2001, the Millennium Ecosystem Assessment was
designed to meet some of the scientific assessment needs of major multilateral environmental agreements (MEAs), including the Convention on Biological Diversity and three other international agreements: the United Nations Convention to Combat Desertification, the Ramsar Convention on Wetlands and the Convention on Migratory Species.
During its development, the MA was invited by the CBD to provide updates on progress
and assessment inputs to the CBD’s scientific and technical body (SBSTTA). To strengthen the linkages and to ensure that CBD needs are being met, the Executive Secretary of the CBD, along with the chair of the SBSTTA, were represented in the MA Board. During the
124
Conference of the Parties to the CBD in 2002 and 2004, the MA was called upon to provide information in no fewer than 15 decisions.
Coordinated by the Belgian CBD National Focal Point, some 17 Belgian researchers and
public servants took an active part in the complete peer-review process of the MA chapters and of the special MA synthesis report on biodiversity. After the finalisation of the MA reports, the implications of the findings of the MA were endorsed by the CBD in its decision VIII/9 during the 8th Conference of the Parties in 2006. The MA has also been formally incorporated into the CBD SBSTTA work plan.
Parties to the CBD are invited to make use of the MA’s conceptual framework and
methodologies in further developing work on environmental impact assessment and strategic environmental assessments. They are also encouraged to conduct national and regional assessments making use of the conceptual framework and methodologies of the MA.
An important fact of disappointment from the side of biodiversity conservationists is that
none of the scenarios explored by the MA will allow reaching the target of reducing significantly the rate of biodiversity loss by 2010 adopted at the World Summit on Sustainable Development in Johannesburg in 2002. Nonetheless, the MA recognises that opportunities exist to reduce the rate of loss of biodiversity and associated ecosystem services if society places an emphasis on ecosystem protection, restoration, and management (MA, 2005).
Taking into account the MA scenarios, the Secretariat of the CBD published a technical
report aiming to assist Parties in the development of appropriate regionally-based response scenarios within the framework of the Convention’s programmes of work. The report is entitled “Cross-roads of Life on Earth — Exploring means to meet the 2010 Biodiversity Target. Solution-oriented scenarios for Global Biodiversity Outlook 2” (Secretariat of the CBD and Netherlands Environmental Assessment Agency, 2007). Beyond the interesting and sometimes surprising results, the document shows the potential and limitations of biodiversity scenarios. It also encourages the development of tailor-made national, sub-regional and regional scenarios on specific issues of interest at relevant scales.
It can be acknowledged that the MA initiated new work under the CBD, including on
linkages between biodiversity and relevant socio-economic issues, on economic drivers of biodiversity change, on valuation of biodiversity and of the ecosystem services provided, as well as on biodiversity’s role in poverty alleviation and achieving the Millennium Development Goals.
In 2007, the SBSTTA will contribute to the evaluation of the MA, focusing in particular
on the impact of the MA towards the implementation of the CBD at global, regional, national and local levels. The results of this evaluation will help to decide on the need for another integrated assessment of biodiversity and ecosystems.
125
The CBD and Belgium’s National Biodiversity Strategy 2006 – 2016 Belgium’s National Biodiversity Strategy (NBS) was adopted by the Belgian government
on 26 October 2006. It is a framework document that spells out a range of 15 strategic objectives and 78 operational objectives for biodiversity assessment and CBD implementation over the next ten years. These objectives where chosen in a participatory process with a group of actors representing the major sectors of society. The overarching goal of the Strategy is to contribute nationally and internationally to reducing and preventing the causes of biodiversity loss, and in particular to achieve the target of halting biodiversity decline in the EU by 2010.
The NBS helps to implement the CBD and fulfils the obligation under CBD article 6
stressing the elaboration of a national biodiversity strategy, to be complemented with implementing action plans (NBSAPs). It provides an integrated national response to the numerous environmental treaties and agreements to which Belgium is a party. It is also a necessary tool to confirm priority and voluntary themes and goals for Belgian policy-makers as it pays special attention to the need for the integration of the conservation and sustainable use of biodiversity into the different relevant sectors of society including social and economic sectors.
It is obvious that Belgium did not await the 2006 NBS to tackle biodiversity issues in the
context of sustainable development. Hence, what is the place of the strategy in the political context of Belgium? Since the Regions and the Federal Government have already developed their own biodiversity strategies and/or plans, numerous actions for biodiversity conservation have already been or are being undertaken albeit to a different extent according to the Governments. The NBS was developed as a framework document that mainly builds on these existing plans. It gives strategic political orientation in order to improve implementation of biodiversity commitments as well to create more coherence, fill gaps where initiatives are not implemented to their full potential at national level or fail to achieve desired objectives and optimise integration of biodiversity concern at the national and international levels.
Ecosystem assessments and the National Biodiversity Strategy The approach
The major connection between the National Biodiversity Strategy and the MA approach is the so-called ecosystem approach which is used as a guiding principle to implement the NBS. This approach is one of the 10 overarching principles which should guide the implementation of the NBS.
As defined by the CBD, the ecosystem approach is a strategy for the integrated
management of land, water and living resources that promotes conservation and sustainable use in an equitable way. The ecosystem approach is based on the application of appropriate scientific methodologies focused on levels of biological organisation, which encompass the essential structure, processes, functions and interaction between organisms and their environment. The ecosystem approach requires adaptive management to deal with the complex and dynamic nature of ecosystems and the absence of complete knowledge or
126
understanding of their functioning. As acknowledged in the MA, it also recognises that humans, with their cultural diversity, are an integral component of many ecosystems (CBD Decision V/6, 2004).
The ecosystem approach is described through twelve principles considered as
complementary and interlinked (CBD Decision VII/11):
Principle 1: The objectives of management of land, water and living resources are a matter of societal choice. Principle 2: Management should be decentralised to the lowest appropriate level. Principle 3: Ecosystem managers should consider the effects (actual or potential) of their activities on adjacent
and other ecosystems. Principle 4: Recognizing potential gains from management, there is usually a need to understand and manage
the ecosystem in an economic context. Principle 5: Conservation of ecosystem structure and functioning, in order to maintain ecosystem services,
should be a priority target of the ecosystem approach. Principle 6: Ecosystems must be managed within the limits of their functioning. Principle 7: The ecosystem approach should be undertaken at the appropriate spatial and temporal scales. Principle 8: Recognizing the varying temporal scales and lag-effects that characterise ecosystem processes,
objectives for ecosystem management should be set for the long term. Principle 9: Management must recognise that change is inevitable. Principle 10: The ecosystem approach should seek the appropriate balance between, and integration of,
conservation and use of biological diversity. Principle 11: The ecosystem approach should consider all forms of relevant information, including scientific and
indigenous and local knowledge, innovations and practices. Principle 12: The ecosystem approach should involve all relevant sectors of society and scientific disciplines.
The usefulness of the ecosystem approach is strongly supported by the MA findings, since
this approach is well suited to the need to take into account the trade-offs that exist in the management of ecosystems and incorporates the need for both coordination across sectors and management across scales. The ecosystem approach also provides a framework for designing and implementing the entire range of necessary responses, ranging from this directly addressing the needs for conservation and sustainable use of biodiversity to those necessary to address indirect and direct drivers that influence ecosystems.
Ecosystem services
The classification of ecosystem services made by the Millennium Ecosystem Assessment
is used in Belgium’s NBS. The introduction of the NBS explains why biodiversity loss is a concern. In detailing the services provided by biodiversity to human well-being, the NBS sticks very much to the four categories of services described in the MA: provisioning, regulating, supporting and cultural services.
However, arguments to protect biodiversity cannot be limited to what biodiversity can do
for humans. The NBS puts in first instance the ethical responsibility to preserve biodiversity for its intrinsic values. It is acknowledged that species have a value "in and of themselves" as the result of the evolution of life on earth. Obviously, the current extinction rate of biodiversity also poses a direct threat to human well-being, since biodiversity plays a vital role as a provider of products and services that make life on Earth possible, and furthermore satisfies the needs of human society.
127
Ecosystems consideration in the objectives of the National Biodiversity Strategy
Among the 15 strategic objectives of the NSB itself, several refer to ecosystems assessment and conservation.
Objective 1 of the NBS addresses ecosystem assessments. This objective covers
identification and monitoring of priority components of biodiversity, including “ecosystems and habitats that are unique, rare, in danger of disappearance, or that play a crucial role for priority species”. These ecosystems and habitats require the most urgent protective measures and must be identified and their status monitored according to a commonly defined methodology.
Objective 2 foresees investigations and monitoring of the effects and causes of threatening
processes and activities on priority ecosystems and habitats, with a special attention devoted to the effects of climate change.
Objective 3 aims to develop an integrated, representative and coherent network of
terrestrial and marine protected areas at national and transboundary level. The integrated management of protected areas should apply the ecosystem approach. The network of protected areas should also be integrated into its socio-economic context and wider environment to enable adequate buffering of external influences on the network elements. These protected areas should be integrated into the wider land- and seascape. The rehabilitation of species and restoration of ecosystems can take place in this context. In particular, the threats posed by invasive alien species to ecosystems’ equilibrium need to be tackled.
Objective 4 calls for synergies between economic growth, social progress and ecological
balance in the long run. A well-thought equitable and fair management of our natural resources will be a key element for the sustainable use of our biodiversity. It is therefore crucial to ensure that ecosystems are capable of sustaining the ecological services on which both biodiversity and humans depend.
Objective 5 will, among other things, contribute to maintain and reinforce the social
function of biodiversity. There is insufficient recognition and understanding of the important connection between biodiversity and social well-being (health, educational attainment, procurement of goods demanded by society, job creation and preservation, relaxation, etc.). The aesthetic values of natural ecosystems and landscapes often contribute to the inspirational, emotional and spiritual well-being of a highly urbanised population.
Objective 7 is on improving and communicating scientific knowledge on biodiversity. An
effective conservation of biodiversity requires the correct identification and spatio-temporal monitoring of all its components at all its levels of organisation, i.e. from genes to ecosystems. Adequate knowledge of the status and trends of biodiversity is a prerequisite for an adaptive management of the ecosystems. It is important to improve the understanding of the role of biodiversity in ecosystem functioning and our knowledge of the socio-economic benefits of biodiversity.
128
Innovative solutions and methodologies are required to optimise the links between research and policy and promote actor’s participation in the development and implementation of new policies.
To influence policy-making and stimulate public awareness, this objective also requests
increasing knowledge of the values of biodiversity (not limited to pure economic value), for instance by improving methods for their valuation. In the valuation process, the relationships between health (physical and mental well-being) and biodiversity should be investigated.
MA contribution to biodiversity policy-making in Belgium
The MA uses scenarios to summarise and communicate the diverse trajectories that the world’s ecosystems may take in future decades. They can be used as a method for thinking creatively about complex, uncertain futures and help identifying priorities for action. Nonetheless, the MA scenarios demonstrated it is not possible to both sustain socio-economic development and halt the rate of biodiversity loss.
Influencing policy-making and stimulating public awareness will require increasing
knowledge of the values of biodiversity (not limited to pure economic value). The valuation methods put forward by the MA can be improved and used as a tool to set priorities and support decision making. Further research in this direction is supported by the NBS. These methods have the advantages to be explicit and relatively transparent in the way in which they bring values into the decision-making process. It can be argued that manipulations of both economic and deliberative and participatory valuation methods are possible. Nevertheless, valuation effort appears to be an improvement on none at all.
The success of the MA process, with the involvement of more than 1300 scientists from
the fields of environmental, economic and social sciences, gives an important international legitimacy to collective approaches to understanding complexity of ecosystems functioning. In that sense, the MA was able to give new insights into how science and governance can be reshaped. In particular, the NBS recognises that innovative solutions and methodologies are required to optimise the links between research and policy and promote actor’s participation in the development and implementation of new policies. The MA also communicated (at least partly) to decision makers how ecosystems and human well-being are dependent on each other with the aim to motivate their conservation, including for cultural and ethical reasons.
Although the National Biodiversity Strategy does not make explicit reference to integrated
ecosystem assessments, previous chapters of the present publication have demonstrated that individual and institutional capacity to undertake such assessments are present in Belgium.
As stated by Ms Wangari Maathai (Nobel Price, 2004): “We know that we do not know
everything, but we know enough to take action. …We should not destroy our life support systems”.
129
Abbreviations
CBD United Nations Convention on Biological Diversity MA Millennium Ecosystem Assessment MEAs Multilateral Environmental Agreements NBS National Biodiversity Strategy NBSAPs National Biodiversity Strategy and Action Plans SBSTTA Subsidiary Body on Scientific, Technical and Technological Advice to the
CBD
References
Federal Public Service for Health, Food Chain Safety and Environment, 2006. Belgium’s National Biodiversity Strategy 2006-2016. Brussels, 106 pp. (http://www.biodiv.be/implementation/docs/stratactplan).
Millennium Ecosystem Assessment, 2005. Ecosystems and Human Well-being: Biodiversity Synthesis. World Resources Institute, Washington, DC: 86 pp. (http://www.millenniumassessment.org/proxy/document.354.aspx).
Secretariat of the Convention on Biological Diversity (2004) The Ecosystem Approach (CBD Guidelines). Secretariat of the Convention on Biological Diversity, Montreal, 50 pp. (http://www.cbd.int/doc/publications/ea-text-en.pdf).
Secretariat of the Convention on Biological Diversity and Netherlands Environmental Assessment Agency (2007). Cross-roads of Life on Earth — Exploring means to meet the 2010 Biodiversity Target. Solution-oriented scenarios for Global Biodiversity Outlook 2.
Secretariat of the Convention on Biological Diversity, Montreal, Technical Series no. 31, 90 pp. (http://www.cbd.int/doc/publications/cbd-ts-31.pdf).

130
131
“The Millennium Ecosystem Assessment: implications for Belgium”, Brussels, Palace of the Academies, 27.10.2006
List of participants
First Name Family Name Institution E-mail
Frank ADRIAENSEN University of Antwerp [email protected]
Gregory ATAMBI VUB [email protected]
Lourdes Da Silva AUGUSTO VUB [email protected]
Isabelle AVELANGE INRA [email protected]
Estelle BALIAN Belgian Biodiversity Platform [email protected]
Tom BAULER ULB-CEDD [email protected]
Hubert BEDORET Ecolo [email protected]
André BERGER UCL [email protected]
Philippe BERGHMANS UCL [email protected]
Roseline C. BEUDELS-JAMAR Royal Belgian Institute of Natural Sciences [email protected]
J-M BOISSONNAS Retired [email protected]
Charles-Hubert BORN UCL [email protected]
Hans BOSCH INBO [email protected]
Philippe BOURDEAU ULB [email protected]
Etienne BRANQUART Belgian Biodiversity Platform [email protected]
Hans BRUYNINCKX KULeuven [email protected]
Ann CARETTE University of Antwerp [email protected]
Gauthier CHAPELLE International Polar Foundation [email protected]
Isabelle CHAPUT Fedichem [email protected]
Sophie CLAUS [email protected]
Heyte CLEMENT UCL [email protected]
An CLIQUET Universiteit Gent [email protected]
Annick COCKAERTS WWF [email protected]
Ingrid CONINX KULeuven/HIVA [email protected]
Marie-Françoise CORDEMANS [email protected]
Claude DE BROYER Institut Royal des Sciences Naturelles de Belgique [email protected]
Sitske DE GROOTE University of Ghent [email protected]
Joop DE KRAKER Open University [email protected]
Géraldine DE MONTPELLIER IPF [email protected]
Maaike DE RIDDER Royal Museum for Central Africa [email protected]
Jacques DE SELLIERS GreenFacts asbl [email protected]
Jan DE SMEDT Federal Council for Sustainable Development [email protected]
Juliette DE VILLERS IBGE [email protected]
132
Wim DE VOS Royal Belgian Institute of Natural Sciences [email protected]
Kris DECLEER Research Institute for Nature and Forest [email protected]
Jacques DEGERLACHE SOLVAY S.A. Corporate Headquarters [email protected]
Patricia DELBAERE Bureau fédéral du Plan [email protected]
François DELOBEL UCL [email protected]
Valérie DETANT UCL [email protected]
Dahal DEVENDRA VUB [email protected]
Benjamin J. DEWALS University of Liege [email protected]
Myriam DUMORTIER Instituut voor Natuur- en Bosonderzoek [email protected]
Alexis Bid EJELLE-NDILLE VUB [email protected]
Mohammad EMRAN HOSSAINE VUB [email protected]
Laurent FIVEZ UCL [email protected]
Lucette FLANDROY Federal Public Service for Health, Food Chain [email protected]
Daniel FONKWE NKANGY VUB
Anne FRANKLIN Royal Belgian Institute of Natural Sciences [email protected]
Julie FRÈRE UCL
Walter GALLE Agentschap voor Natuur en Bos [email protected]
Rocio GAMARRA VUB [email protected]
Raeymaekers GEERT IUCN ROfE [email protected]
Akinmunmi Temitayo GEORGE VUB [email protected]
Isabelle GEORGE UCL [email protected]
Marie-Céline GODIN CEEW [email protected]
Yanne GOOSSENS European Parliament [email protected]
Jean-Claude GRÉGOIRE ULB [email protected]
Machteld GRYSEELS Brussels Institute for Management of the Envi [email protected]
François HALBARDIER UCL [email protected]
Catherine HALLET DGRNE [email protected]
Azaharul HAQUE VUB [email protected]
Luc HENS VUB [email protected]
Maarten HENS Research Institute for Nature and Forest
Julien HERBUT UCL [email protected]
Rudy HERMAN Vlaams gemeenschap [email protected]
Martin HERMY KULeuven [email protected]
Andre HEUGHEBAERT ULB [email protected]
Paul HEYMAN Queen Astrid Military Hospital [email protected]
Maurice HOFFMANN Research Institute for Nature and Forest [email protected]
Jean HUGÉ VUB [email protected]
Stefanie HUGELIER Federale Raad voor Duurzame Ontwikkeling [email protected]
Henry Adekeye IJIDAKINRO VUB [email protected]
133
Cédric JACMAIN UCL [email protected]
Gerard JADOUL Inter-Environnement-Wallonie, [email protected]
Obinna Igwe JOHN VUB [email protected]
Bea KAYAERTS Minaraad [email protected]
Bruno KESTEMONT SPF Economie [email protected]
Siyabonga KOHLI VUB [email protected]
Eckhart KUIJKEN Research Institute for Nature and Forest [email protected]
Eric LAMBIN UCL [email protected]
Christiane LANCELOT ULB [email protected]
Isiaka Adesanya LASISI VUB [email protected]
Hai LE TRINH VUB
Fre MAES ABVV [email protected]
Grégory MAHY FUSAGx [email protected]
Alain MAIRESSE CWEDD [email protected]
Kitwana MAKAME VUB [email protected]/MEKO
Jean-paul MALINGREAU Commission européenne [email protected]
Philippe MARBAIX UCL [email protected]
Els MARTENS Ministry of Environment, Nature & Energy [email protected]
Charlotte MARTIN UCL [email protected]
Ivy MEERT [email protected]
Mussa Leonard MHAGAMA VUB [email protected]
Sharaf Uddin Hossaini MOHAMMED VUB [email protected]
Vera MOMBEEK IBGE [email protected]
Tine MONSERE Universiteit Gent [email protected]
Marc MORMONT ULG [email protected]
Samuel MTOKA VUB [email protected]
Bart MUYS K.U.Leuven [email protected]
Denis Etiendem NDELOH VUB [email protected]
Dang Tri NGO VUB [email protected]
Eric Ndofor NJIMUKARA VUB [email protected]
Mfune ORLEANS VUB [email protected]
Marc PEETERS RBINS [email protected]
Camille PISANI Royal Belgian Institute of Natural Sciences [email protected]
Laurence POLAIN [email protected]
Muhammad RAHMAN VUB [email protected]
Jean-Pierre RANSCHAERT HEG Ihecs [email protected]
Leida RIJNHOUT VODO [email protected]
Jan ROBBEN FOD Economie [email protected]
Jacques RONDEUX FUSAGx [email protected]
Benoît SALSAC HEPCUT [email protected]
134
Guillermo SANCHEZ RIVERA VUB [email protected]
Marianne SCHLESSER Royal Belgian Institute of Natural Sciences [email protected]
Emmanuel SERUSIAUX ULG [email protected]
Ilse SIMOENS Inbo [email protected]
Marielle SMEETS Federal Public Service Health, Food Chain Safety [email protected]
Nicolas SOUGNEZ UCL [email protected]
Jean-Jacques SYMOENS Comité National des Sciences biologiques [email protected]
Jurgen TACK Belgian Biodiversity Platform [email protected]
Yves TILMAN UCL [email protected]
Jeanne UMUNEZERO VUB [email protected]
Yadav UPRETY VUB [email protected]
Oswald VAN CLEEMPUT Ghent University [email protected]
Toon VAN DAELE Intitute for Nature and Forest Research [email protected]
Erike VAN DEN BERGH INBO [email protected]
Aline VAN DER WERF Belgian Science Policy [email protected]
Jackie VAN GOETHEM RBINS [email protected]
Wouter VAN LANDUYT Institute for Nature and Forest [email protected]
Christophe VAN ORSHOVEN Federal Public Service Health, Food Chain Safety [email protected]
Wouter VAN REETH INBO [email protected]
Marleen VAN STEERTEGEM VMM [email protected]
Jean-Pascal VAN YPERSELE UCL [email protected]
Jean-Pierre VANDEN BOSSCHE Ministère Région wallonne [email protected]
An VANDEN BROECK Instituut voor Natuur- en Bosonderzoek [email protected]
Oscar VANDERBORGHT University of Antwerp [email protected]
Martine VANDERSTRAETEN POD Wetenschapsbeleid [email protected]
Axel VERACHTERT Vlaamse overheid [email protected]
Griet VERBEKE [email protected]
Kris VERHEYEN Ghent University [email protected]
Rudolf VERHEYEN University of Antwerp [email protected]
Jo VERSTEVEN POD DO [email protected]
Magda VINCX Ghent University [email protected]
Grégoire WALLENBORN ULB -CEDD [email protected]
Karel WOUTERS KBIN [email protected]
Inge WUIJTENS TCHN [email protected]
Qiuzhen YIN UCL
Edwin ZACCAI ULB-CEDD [email protected]
Ghezae ZERESENAY VUB [email protected]


![˘ˇˆ˙˝˛˚ˇ ˜ !˛˚# $ %&˙ ’( )* +,-)’)./ 0! 1 ˙ .’ 2˙. & 0 ...collegecirculars.unipune.ac.in/sites/examdocs/AprilMay 2014/BA 2013 Pattern.pdf[4701] - 1002! 20 ˘ˇˆ](https://img.pdfslide.fr/doc/110x75/606b434361463515ee3c28d9/-oe-a-a-0-1-a-2-.jpg)
![Sommaire - LeMondePrépa.Fr · ˇˆ˙˝ Sommaire [ MP – MECANIQUE ].....1](https://img.pdfslide.fr/doc/110x75/5b9624c909d3f2ea5c8ce0e7/sommaire-lemondeprepafr-sommaire-mp-mecanique-1.jpg)