Embed Size (px)
Citation preview
Le projet CRTI: dLe projet CRTI: dééveloppement d’un veloppement d’un systsystèème de modme de modéélisation lisation àà l’ l’ééchelle urbainechelle urbaine
Jocelyn MailhotStéphane BélairMario BenjaminNajat BenboutaBernard BilodeauGilbert BrunetFrédéric ChagnonMichel DesgagnéJean-Philippe GauthierBruno HarveyRichard Hogue
Séminaire CMC / RPN – 24 février 2006
RPN / CMC / Région du Québec
Michel Jean Aude Lemonsu Alexandre Leroux Gilles MorneauRadenko PavlovicPierre PellerinClaude PelletierLubos SpacekLinying TongSerge TrudelYufei Zhu
Objectives and ContextObjectives and Context
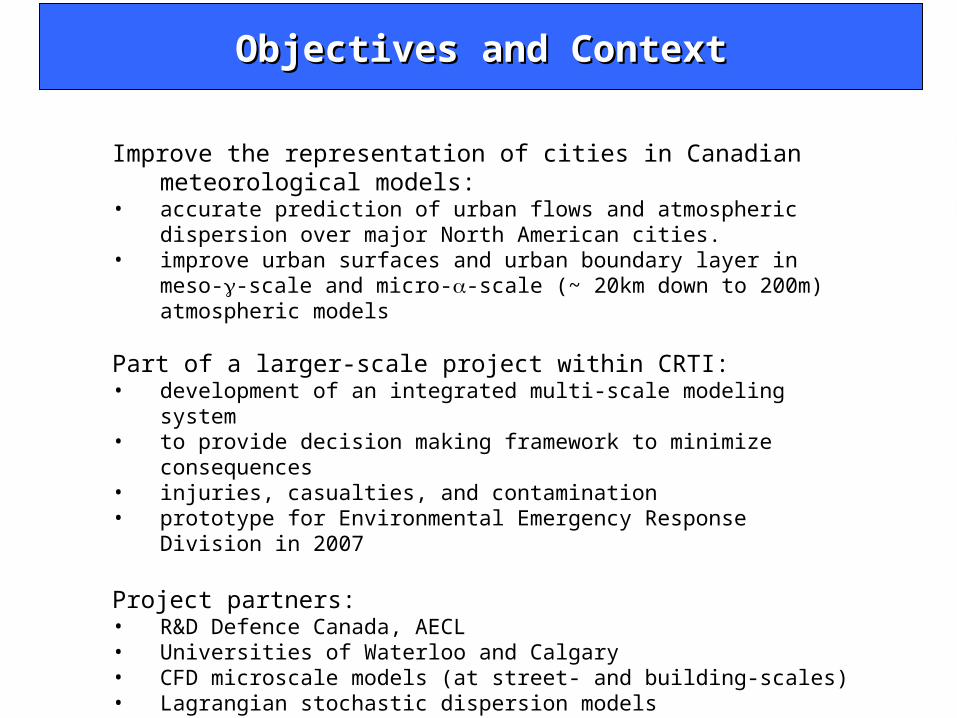
Improve the representation of cities in Canadian meteorological models:
• accurate prediction of urban flows and atmospheric dispersion over major North American cities.
• improve urban surfaces and urban boundary layer in meso--scale and micro--scale (~ 20km down to 200m) atmospheric models
Part of a larger-scale project within CRTI:• development of an integrated multi-scale modeling system• to provide decision making framework to minimize consequences• injuries, casualties, and contamination• prototype for Environmental Emergency Response Division in 2007
Project partners:• R&D Defence Canada, AECL• Universities of Waterloo and Calgary• CFD microscale models (at street- and building-scales)• Lagrangian stochastic dispersion models
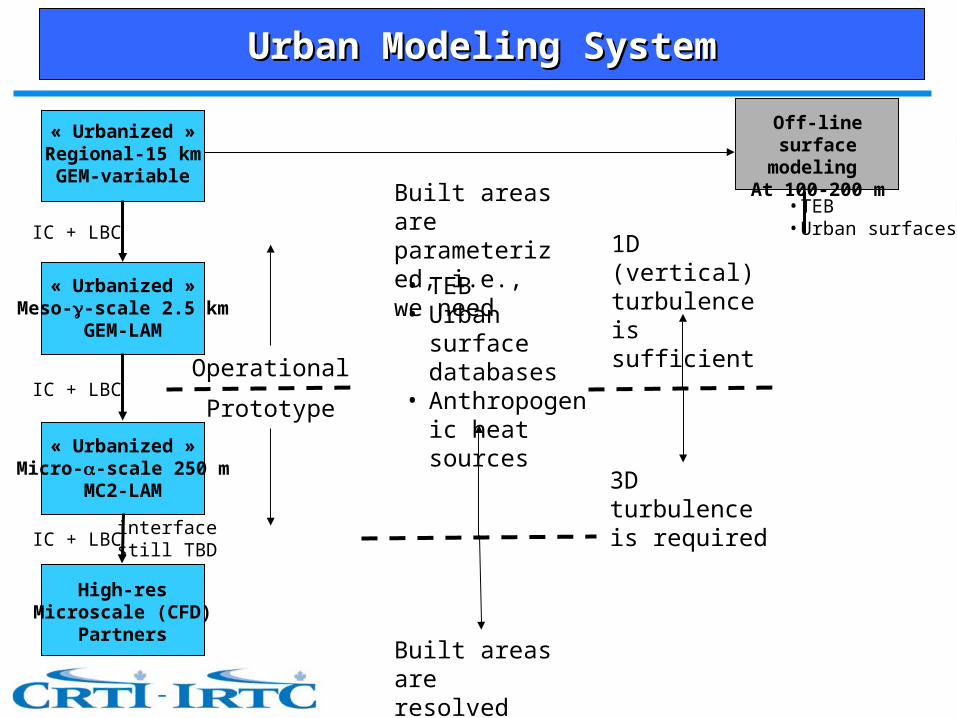
« Urbanized »Regional-15 kmGEM-variable
« Urbanized »Meso--scale 2.5 km
GEM-LAM
« Urbanized »Micro--scale 250 m
MC2-LAM
High-resMicroscale (CFD)
Partners
IC + LBC
IC + LBC
IC + LBC
Operational
Prototype
Built areas are parameterized, i.e., we need
• TEB• Urban surface
databases• Anthropogenic
heat sources
Built areas are resolved
1D (vertical) turbulence is sufficient
3D turbulence is required
Off-line surface modeling
At 100-200 m
• TEB• Urban surfaces
interfacestill TBD
Urban Modeling SystemUrban Modeling System

WORK BREAKDOWN STRUCTURE
Meso- and off-line
Regional NWP
High-level management (Jean, Hogue) Scientific
management (Mailhot, Bélair)
MODELING DATABASES TRANSFERSMEASUREMENTS and
OBSERVATIONS
TEB
3D-turbulence
CFD
Surface fields
Anthropo. heat sources
MUSE-1
MUSE-2
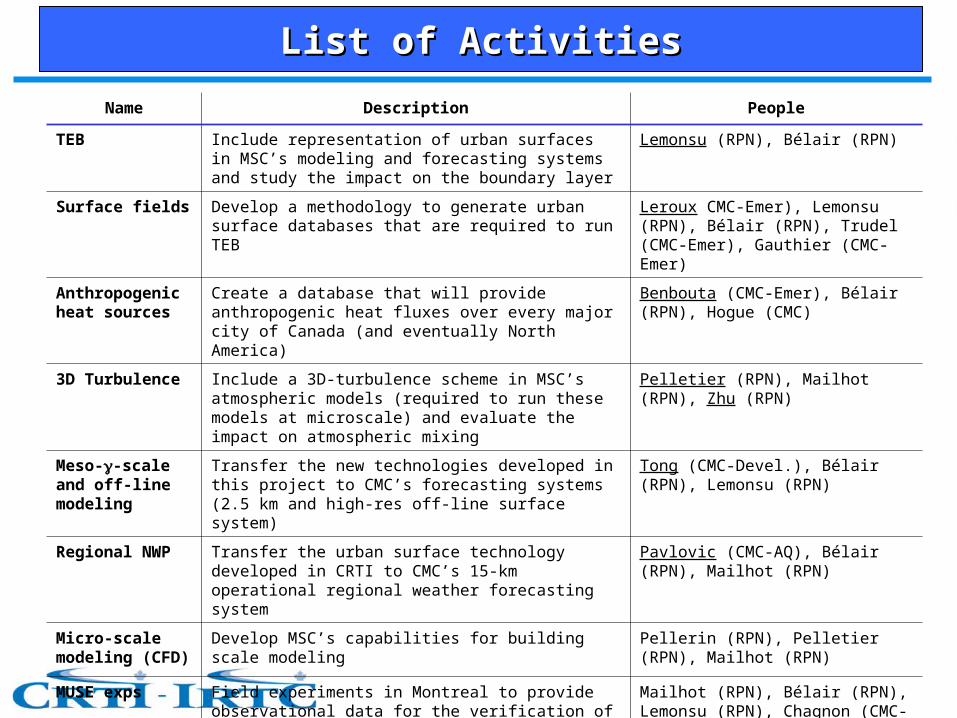
Name Description People
TEB Include representation of urban surfaces in MSC’s modeling and forecasting systems and study the impact on the boundary layer
Lemonsu (RPN), Bélair (RPN)
Surface fields Develop a methodology to generate urban surface databases that are required to run TEB
Leroux CMC-Emer), Lemonsu (RPN), Bélair (RPN), Trudel (CMC-Emer), Gauthier (CMC-Emer)
Anthropogenic heat sources
Create a database that will provide anthropogenic heat fluxes over every major city of Canada (and eventually North America)
Benbouta (CMC-Emer), Bélair (RPN), Hogue (CMC)
3D Turbulence Include a 3D-turbulence scheme in MSC’s atmospheric models (required to run these models at microscale) and evaluate the impact on atmospheric mixing
Pelletier (RPN), Mailhot (RPN), Zhu (RPN)
Meso--scale and off-line modeling
Transfer the new technologies developed in this project to CMC’s forecasting systems (2.5 km and high-res off-line surface system)
Tong (CMC-Devel.), Bélair (RPN), Lemonsu (RPN)
Regional NWP Transfer the urban surface technology developed in CRTI to CMC’s 15-km operational regional weather forecasting system
Pavlovic (CMC-AQ), Bélair (RPN), Mailhot (RPN)
Micro-scale modeling (CFD)
Develop MSC’s capabilities for building scale modeling Pellerin (RPN), Pelletier (RPN), Mailhot (RPN)
MUSE exps Field experiments in Montreal to provide observational data for the verification of TEB in North American weather conditions
Mailhot (RPN), Bélair (RPN), Lemonsu (RPN), Chagnon (CMC-E), Jean (CMC), Benjamin (Que. Region), Morneau (Que. Region) + more
List of ActivitiesList of Activities
Urban Modeling SystemUrban Modeling System
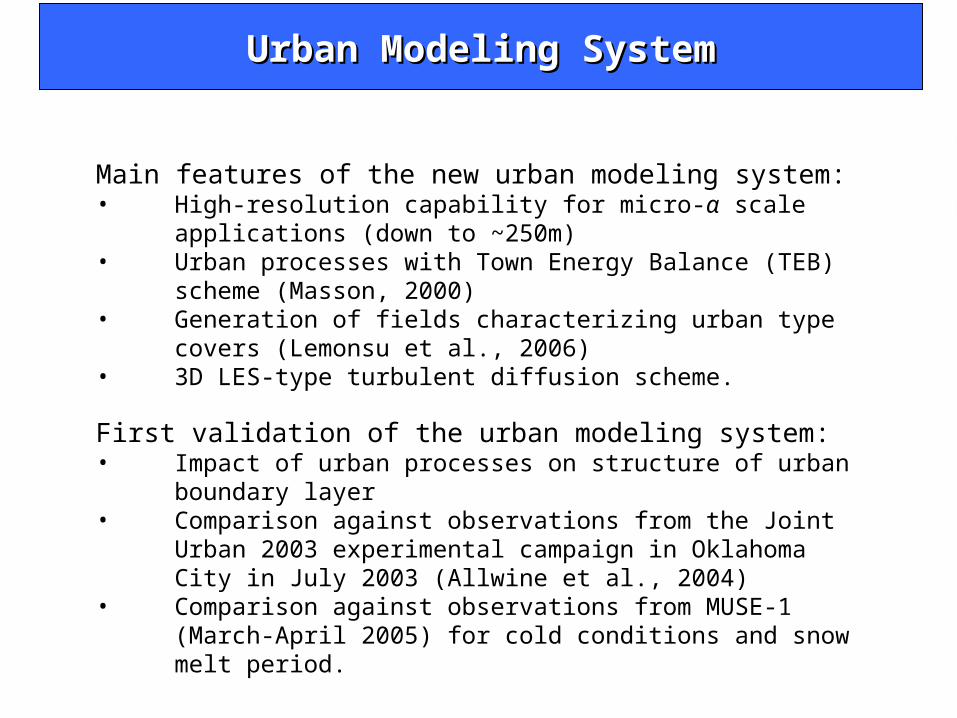
Main features of the new urban modeling system:• High-resolution capability for micro-α scale applications (down to
~250m) • Urban processes with Town Energy Balance (TEB) scheme
(Masson, 2000)• Generation of fields characterizing urban type covers (Lemonsu
et al., 2006)• 3D LES-type turbulent diffusion scheme.
First validation of the urban modeling system:• Impact of urban processes on structure of urban boundary layer• Comparison against observations from the Joint Urban 2003
experimental campaign in Oklahoma City in July 2003 (Allwine et al., 2004)
• Comparison against observations from MUSE-1 (March-April 2005) for cold conditions and snow melt period.
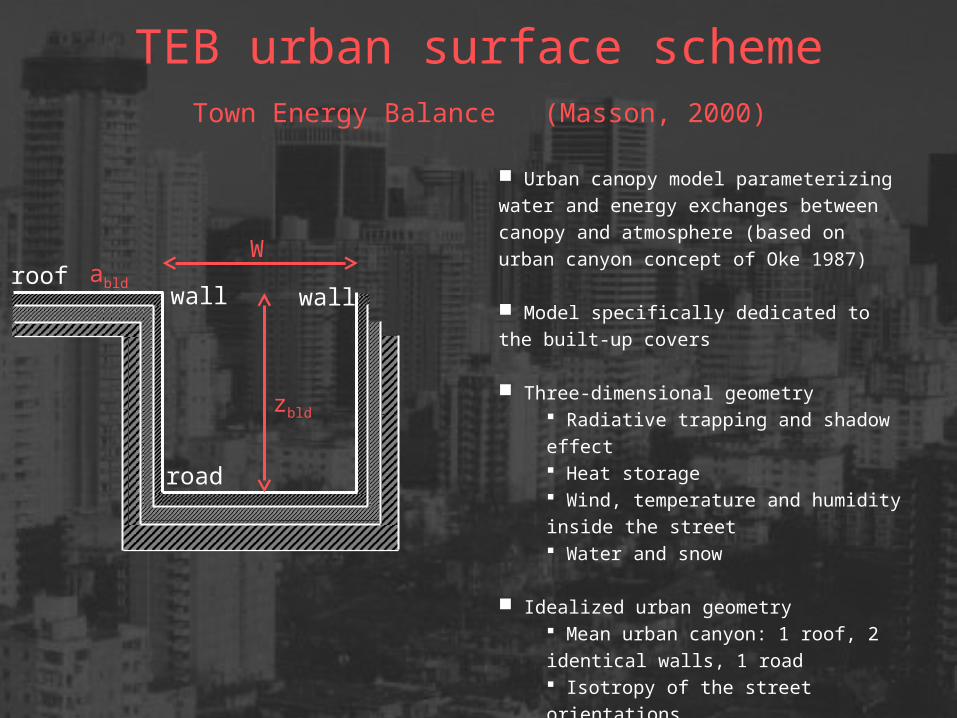
TEB urban surface scheme
roof
road
wall wall
zbld
Wabld
Town Energy Balance (Masson, 2000)
Urban canopy model parameterizing water and
energy exchanges between canopy and
atmosphere (based on urban canyon concept of
Oke 1987)
Model specifically dedicated to the built-up
covers
Three-dimensional geometry Radiative trapping and shadow effect Heat storage Wind, temperature and humidity inside
the street Water and snow
Idealized urban geometry Mean urban canyon: 1 roof, 2 identical
walls, 1 road Isotropy of the street orientations No crossing streets
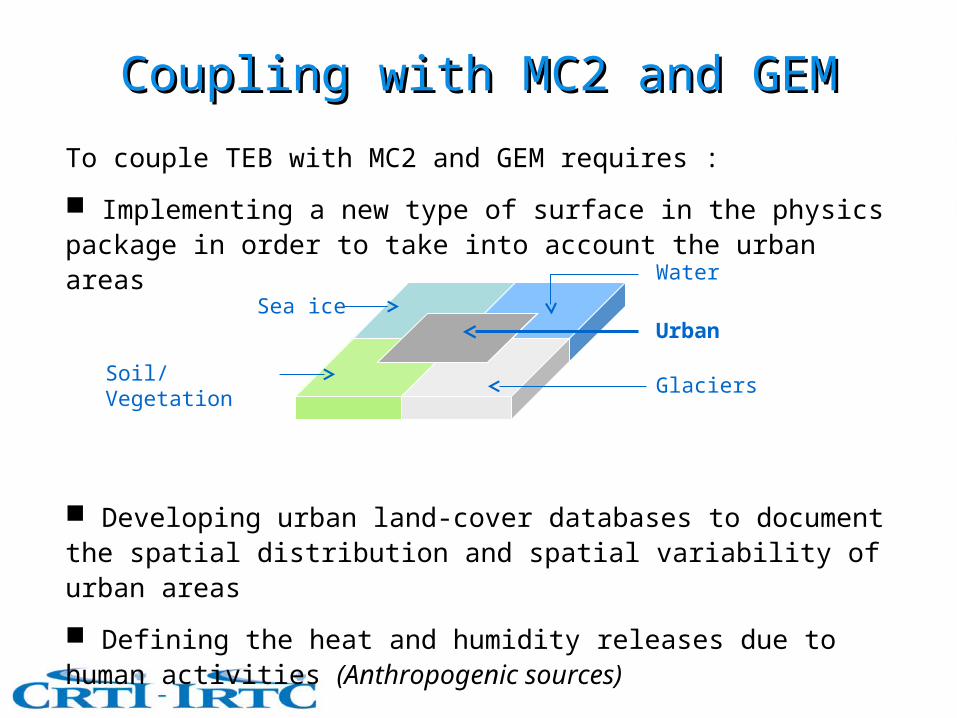
To couple TEB with MC2 and GEM requires :
Implementing a new type of surface in the physics package in order to take into account the urban areas
Developing urban land-cover databases to document the spatial distribution and spatial variability of urban areas
Defining the heat and humidity releases due to human activities (Anthropogenic sources)
Sea ice
Soil/Vegetation Glaciers
Water
Urban
Coupling with MC2 and GEMCoupling with MC2 and GEM
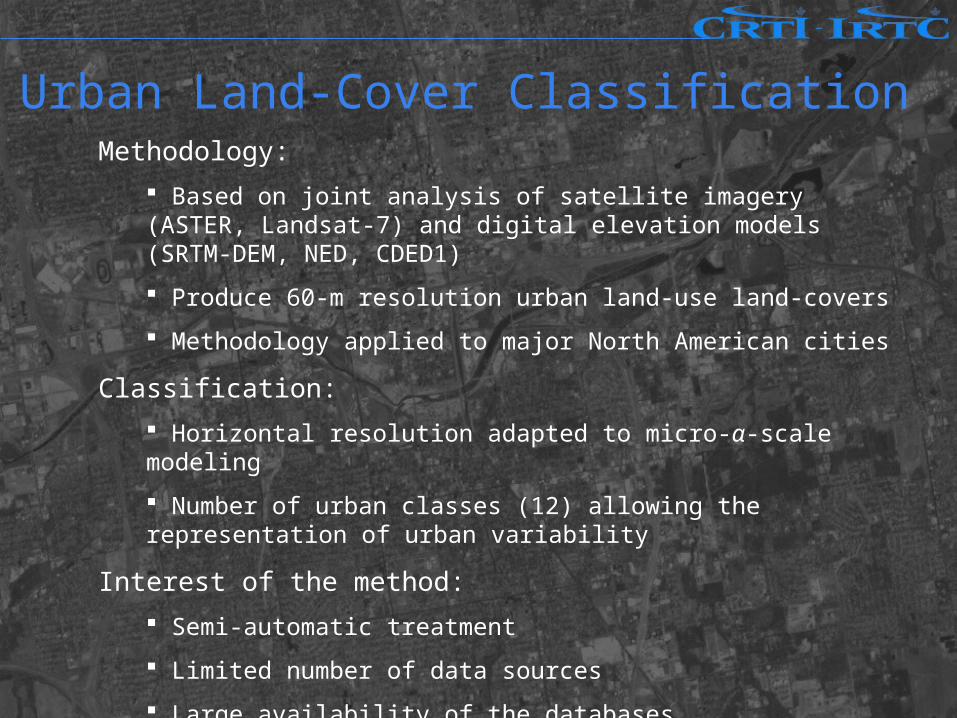
Urban Land-Cover Classification Methodology:
Based on joint analysis of satellite imagery (ASTER, Landsat-7) and digital elevation models (SRTM-DEM, NED, CDED1)
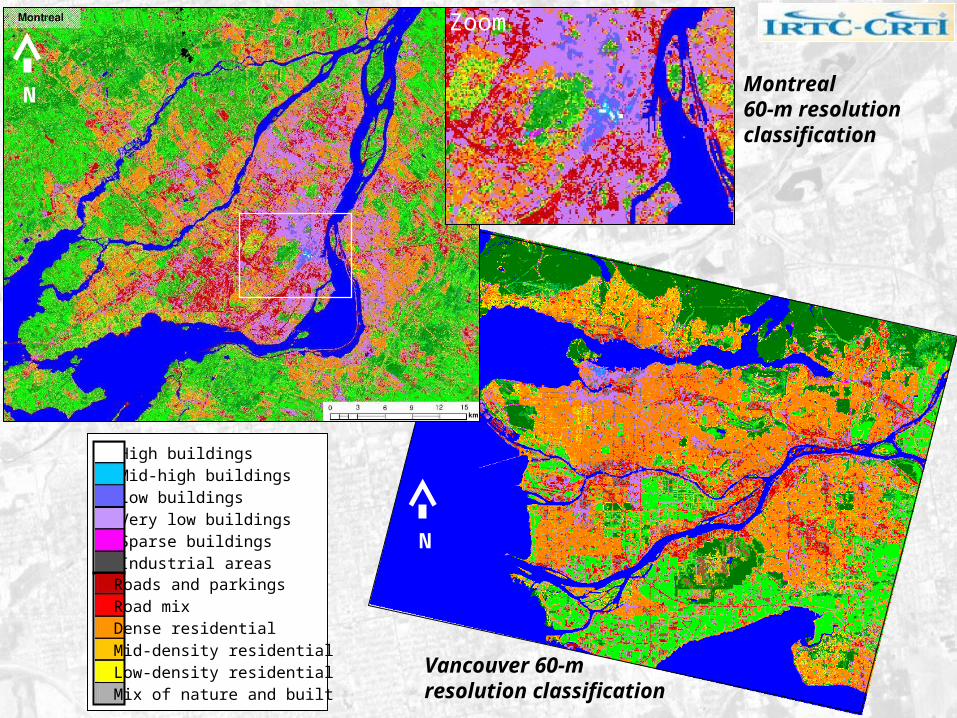
Produce 60-m resolution urban land-use land-covers
Methodology applied to major North American cities
Classification:
Horizontal resolution adapted to micro-α-scale modeling
Number of urban classes (12) allowing the representation of urban variability
Interest of the method:
Semi-automatic treatment
Limited number of data sources
Large availability of the databases
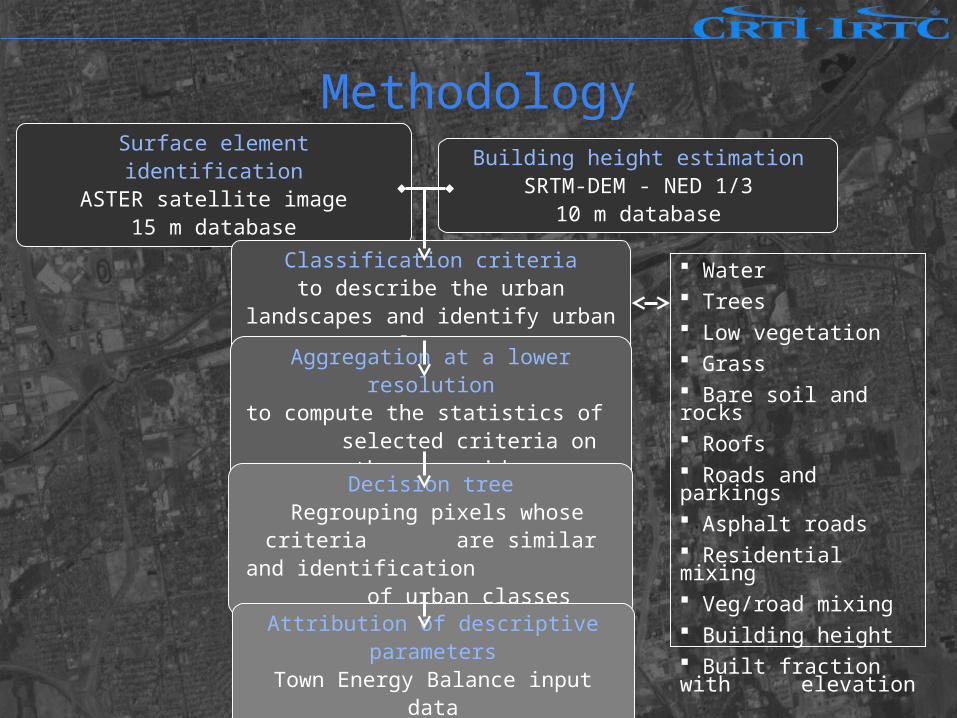
MethodologySurface element identification
ASTER satellite image15 m database
Building height estimationSRTM-DEM - NED 1/3
10 m database
Classification criteriato describe the urban landscapes
and identify urban classes
Aggregation at a lower resolutionto compute the statistics of selected criteria on the new grid
Decision tree Regrouping pixels whose criteria are similar and identification
of urban classes
Attribution of descriptive parameters
Town Energy Balance input data
Water Trees Low vegetation Grass Bare soil and rocks Roofs Roads and parkings Asphalt roads Residential mixing Veg/road mixing Building height Built fraction with
elevation
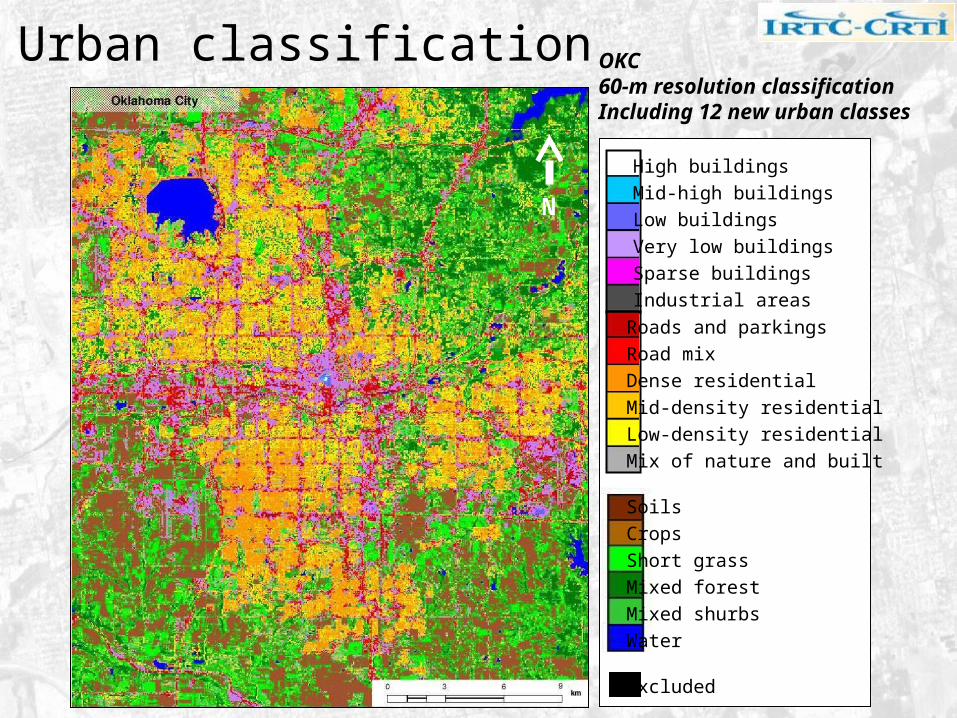
Urban classification OKC60-m resolution classificationIncluding 12 new urban classes
N
High buildingsMid-high buildingsLow buildingsVery low buildingsSparse buildingsIndustrial areasRoads and parkingsRoad mixDense residentialMid-density residentialLow-density residentialMix of nature and built
SoilsCropsShort grassMixed forestMixed shurbsWater
Excluded
N
N
Montreal60-m resolution classification
Vancouver 60-m resolution classification
High buildingsMid-high buildingsLow buildingsVery low buildingsSparse buildingsIndustrial areasRoads and parkingsRoad mixDense residentialMid-density residentialLow-density residentialMix of nature and built
Zoom
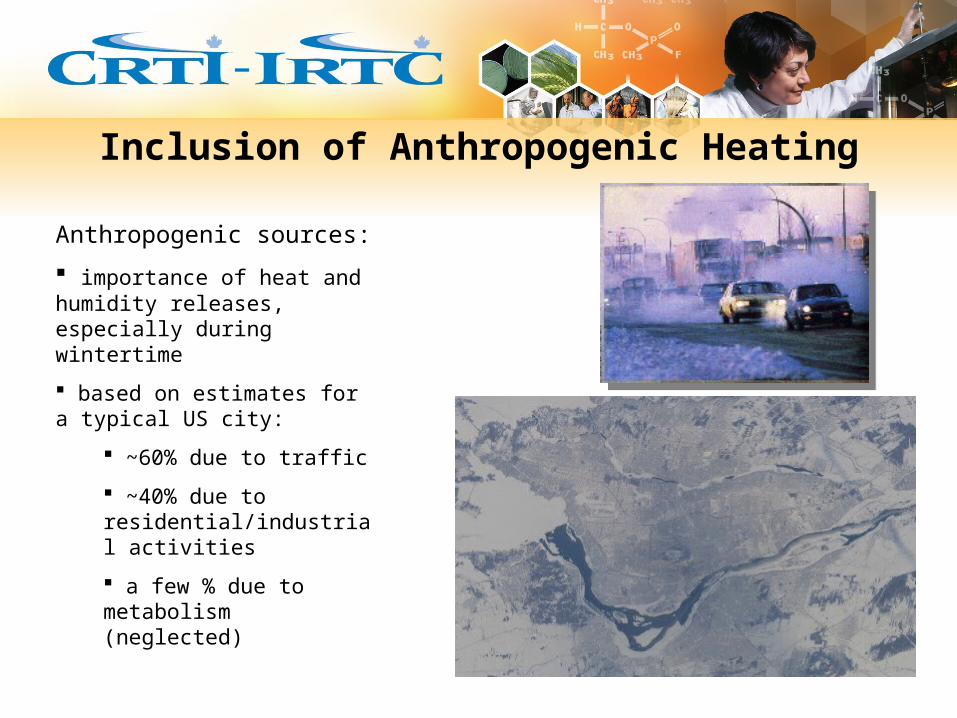
Inclusion of Anthropogenic Heating
Anthropogenic sources:
importance of heat and humidity releases, especially during wintertime
based on estimates for a typical US city:
~60% due to traffic
~40% due to residential/industrial activities
a few % due to metabolism (neglected)
Anthropogenic Heating:Production of a database for Canada & USA
Current TEB:
uses constant forcing of fluxes due to traffic and industrial activities
Methodology:
under development for more realistic representation of anthropogenic fluxes
based on “top-down” approach of Sailor and Lu (2004)
estimates of diurnal, weekly and seasonal cycles
prototype and validation for Montreal
generalize to major North American cities
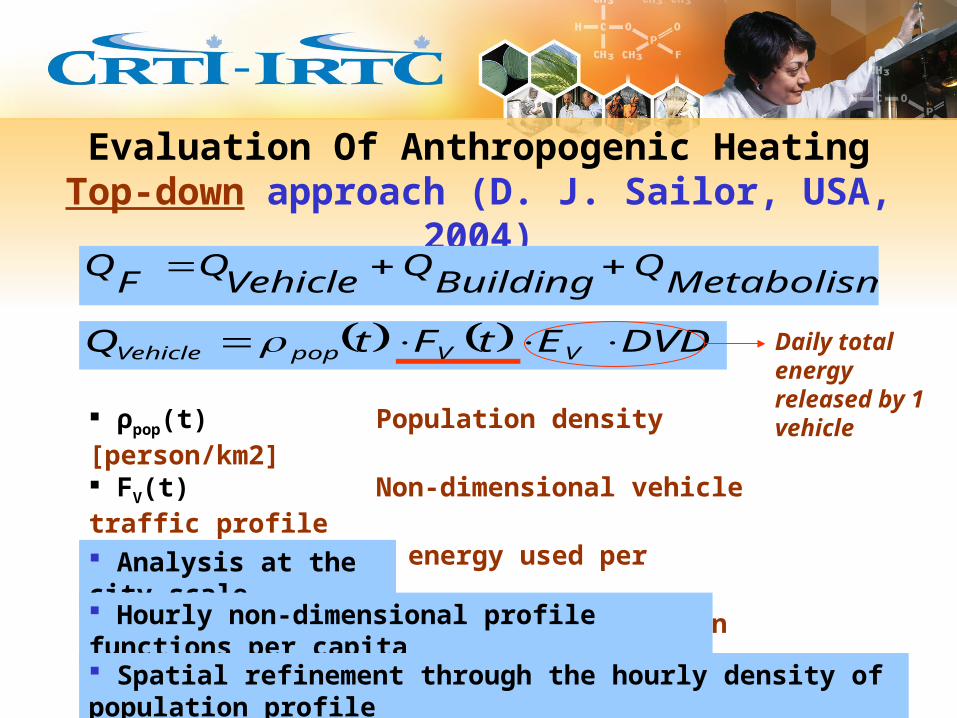
Evaluation Of Anthropogenic HeatingTop-down approach (D. J. Sailor, USA, 2004)
MetabolismQ
BuildingQ
VehicleQ
FQ
DVDEtFtQ VVpopVehicle
ρpop(t) Population density [person/km2] FV(t) Non-dimensional vehicle traffic profile EV Vehicle energy used per kilometer [Wkm-1] DVD Distance traveled per person [km] Analysis at the city scale
Hourly non-dimensional profile functions per capita
Spatial refinement through the hourly density of population profile
Daily total energy released by 1 vehicle
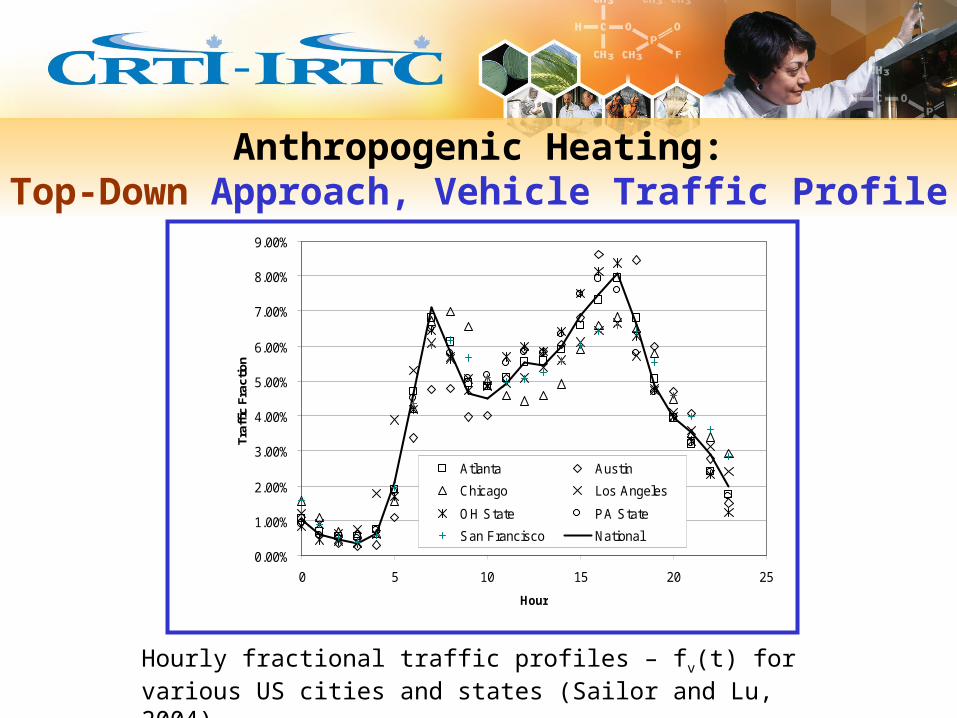
Anthropogenic Heating:Top-Down Approach, Vehicle Traffic Profile
0.00%
1.00%
2.00%
3.00%
4.00%
5.00%
6.00%
7.00%
8.00%
9.00%
0 5 10 15 20 25
Hour
Tra
ffic
Fra
ctio
n
Atlanta Austin
Chicago Los Angeles
OH State PA State
San Francisco National
Hourly fractional traffic profiles – fv(t) for various US cities and states (Sailor and Lu, 2004).

Plan:• Search for data sources• Analysis of the data• Definition of the anthropogenic profiles per sector• Building of the anthropogenic heating database
Anthropogenic Heating: Top down approachProduction of a database for Canada & USA
Validation of the approach with detailed high resolution data
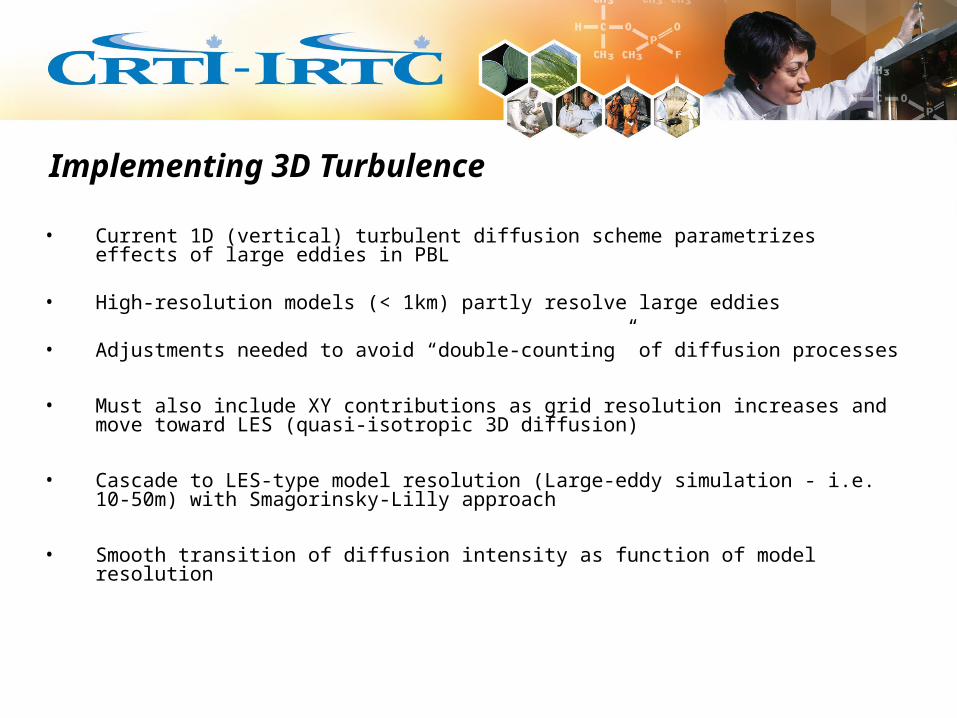
Implementing 3D Turbulence
• Current 1D (vertical) turbulent diffusion scheme parametrizes effects of large eddies in PBL
• High-resolution models (< 1km) partly resolve large eddies
• Adjustments needed to avoid “double-counting” of diffusion processes
• Must also include XY contributions as grid resolution increases and move toward LES (quasi-isotropic 3D diffusion)
• Cascade to LES-type model resolution (Large-eddy simulation - i.e. 10-50m) with Smagorinsky-Lilly approach
• Smooth transition of diffusion intensity as function of model resolution
)()()(1
wuz
vuy
uuxt
u
)()()(1
wvz
vvy
vuxt
v
)()()(1
wwz
wvy
wuxt
w
Ez
w
y
v
x
uKuu M 2
3
2
Ez
w
x
u
y
vKvv M 2
3
2
Ey
v
x
u
z
wKww M 2
3
2''
x
v
y
uKvu M
x
w
z
uKwu M
y
w
z
vKwv M
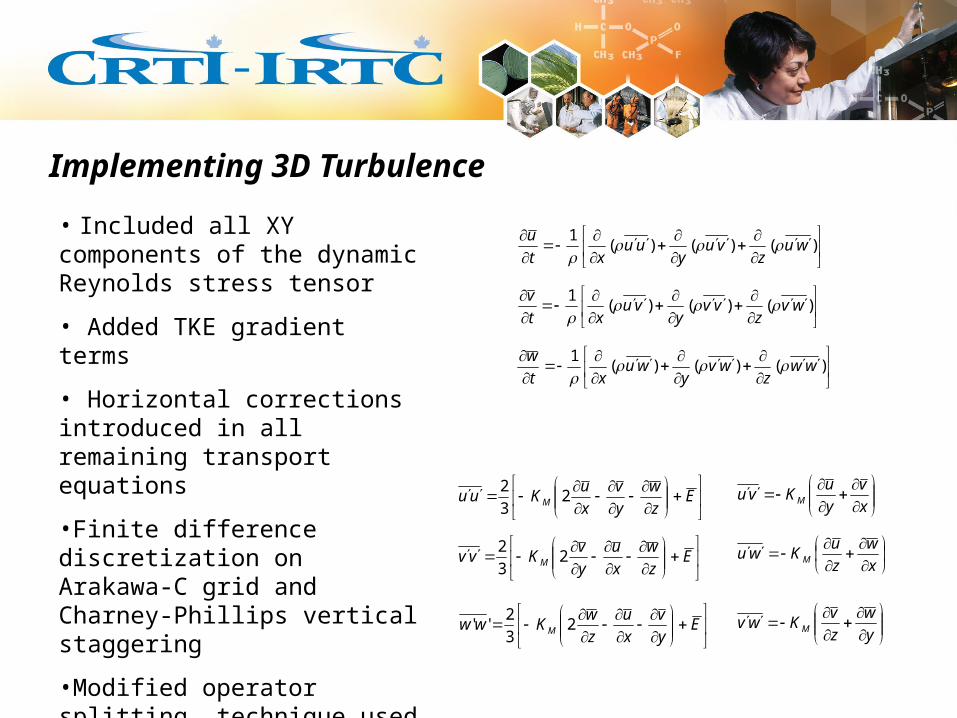
• Included all XY components of the dynamic Reynolds stress tensor
• Added TKE gradient terms
• Horizontal corrections introduced in all remaining transport equations
•Finite difference discretization on Arakawa-C grid and Charney-Phillips vertical staggering
•Modified operator splitting technique used by TKE solver
• Modified appropriate scale-dependent mixing length
Implementing 3D Turbulence
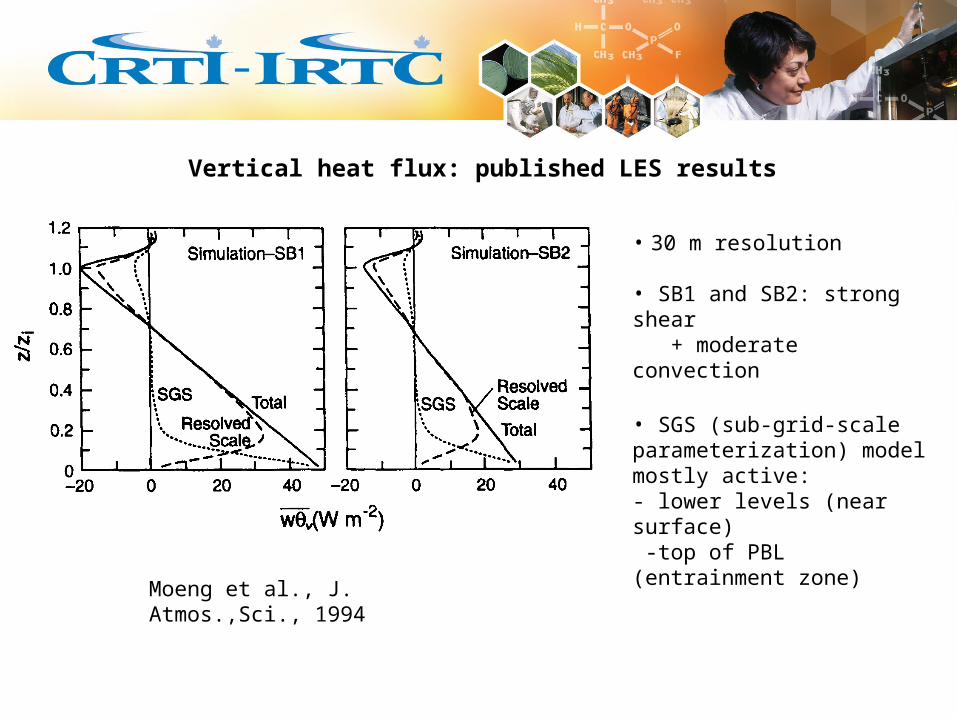
Vertical heat flux: published LES results
Moeng et al., J. Atmos.,Sci., 1994
• 30 m resolution
• SB1 and SB2: strong shear + moderate convection
• SGS (sub-grid-scale parameterization) model mostly active:- lower levels (near surface) -top of PBL (entrainment zone)
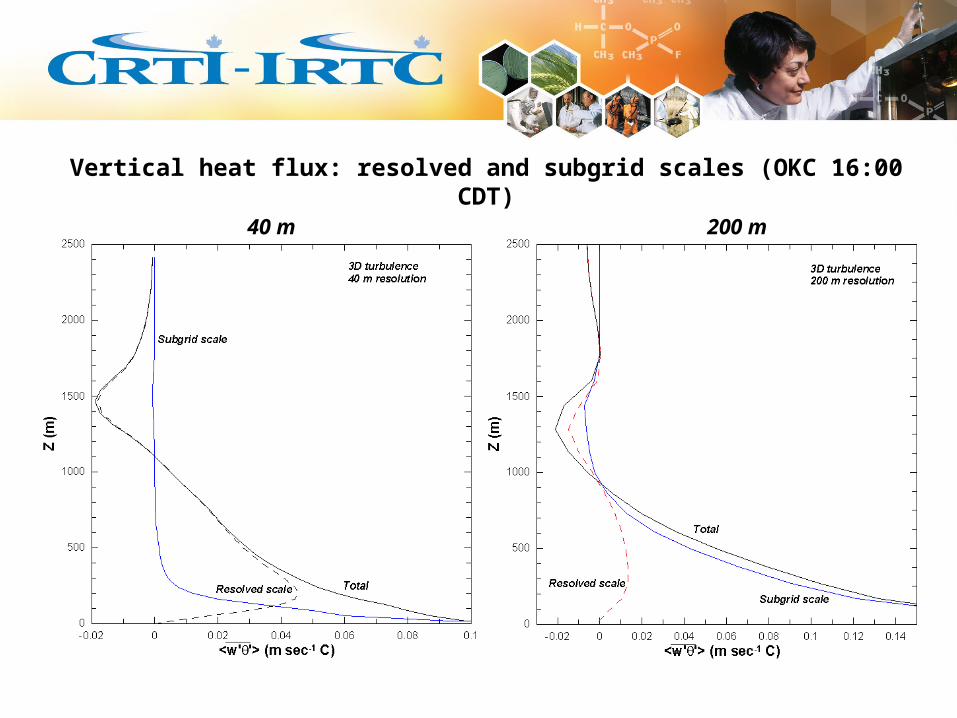
Vertical heat flux: resolved and subgrid scales (OKC 16:00 CDT)
40 m 200 m
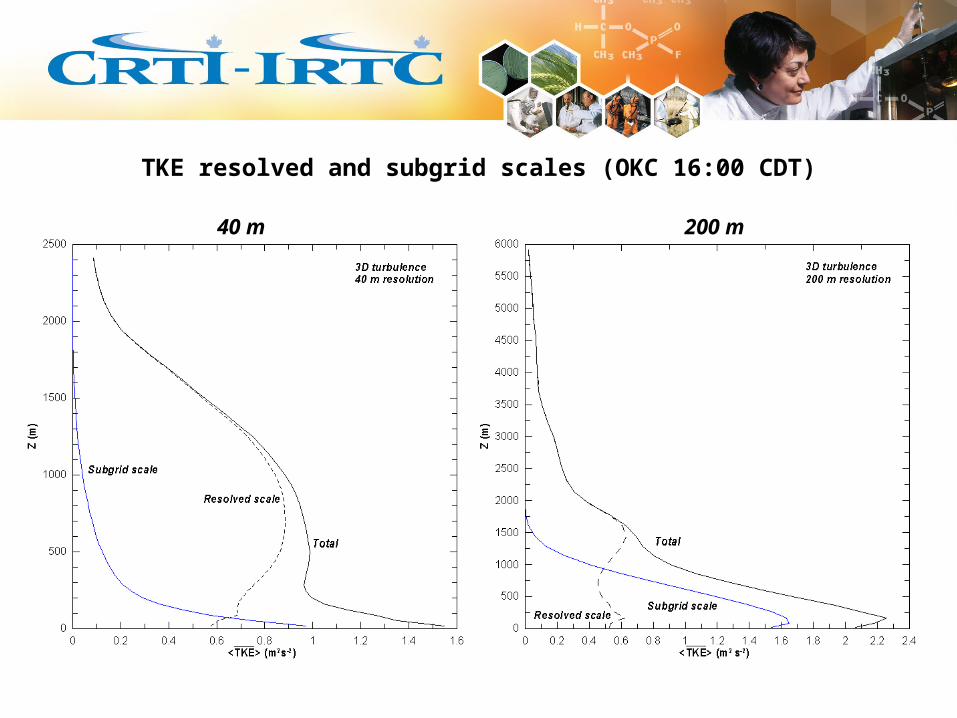
TKE resolved and subgrid scales (OKC 16:00 CDT)
40 m 200 m
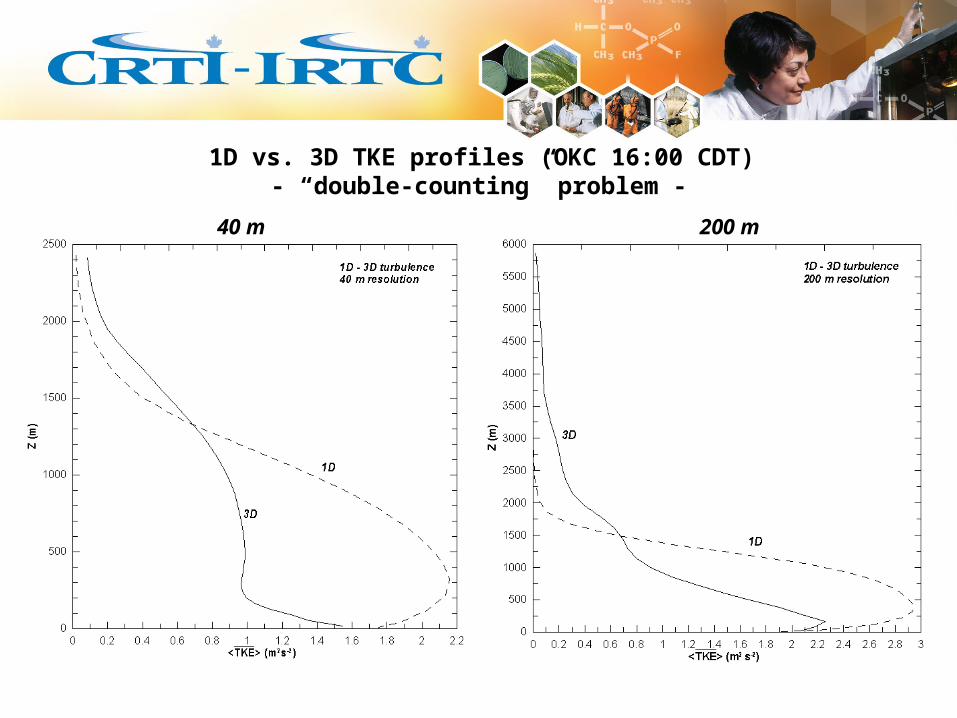
1D vs. 3D TKE profiles (OKC 16:00 CDT)- “double-counting” problem -
40 m 200 m
Current studies :
Offline modeling over OKC (Joint Urban 2003) to evaluate TEB over North American cities
3D modeling over OKC (Joint Urban 2003) to study the impact of the urban parameterization on the boundary layer
Future works :
Offline modeling over Montreal (MUSE period) to evaluate TEB under winter condition and to improve the snow parameterization
Modeling objectivesModeling objectives
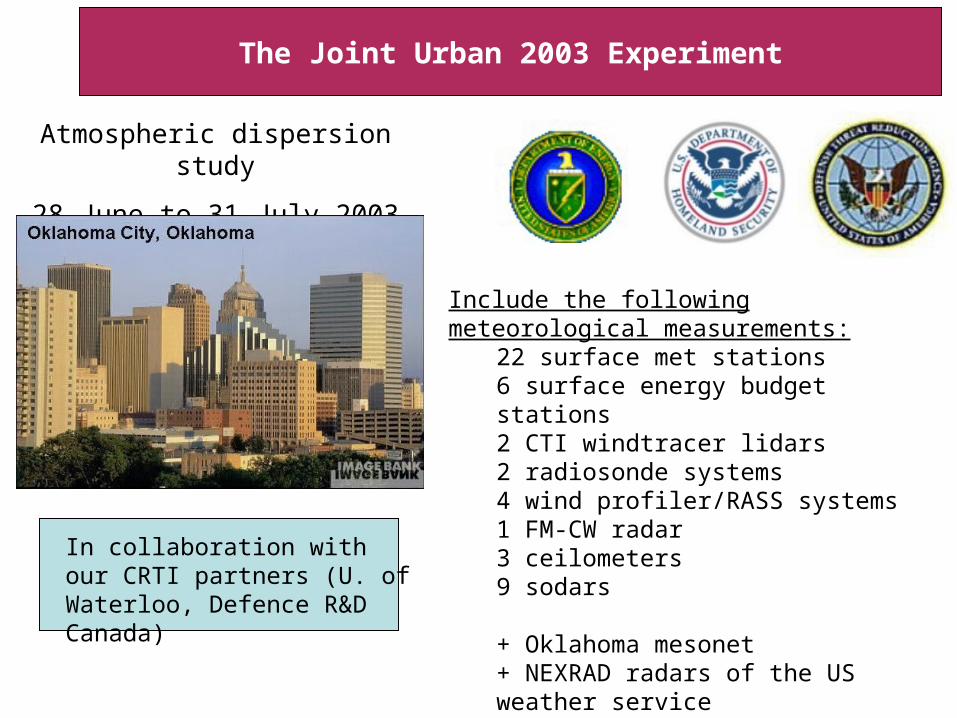
The Joint Urban 2003 Experiment
Atmospheric dispersion study
28 June to 31 July 2003
Include the following meteorological measurements:
22 surface met stations6 surface energy budget stations2 CTI windtracer lidars2 radiosonde systems4 wind profiler/RASS systems1 FM-CW radar3 ceilometers9 sodars
+ Oklahoma mesonet+ NEXRAD radars of the US weather service
In collaboration with our CRTI partners (U. of Waterloo, Defence R&D Canada)
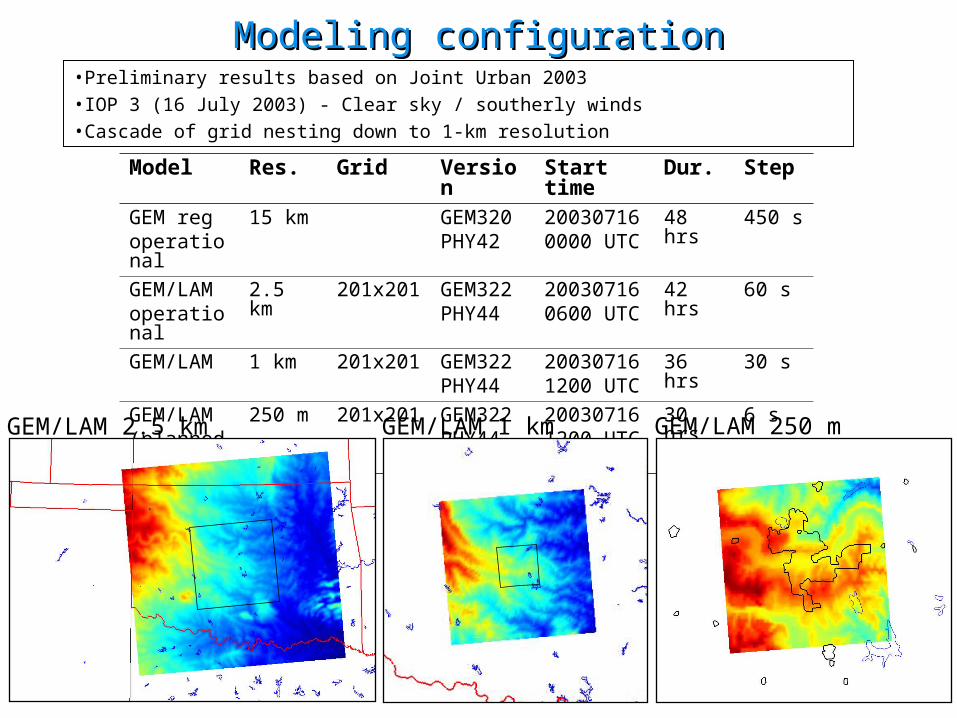
Model Res. Grid Version Start time Dur. StepGEM regoperational
15 km GEM320PHY42
200307160000 UTC
48 hrs 450 s
GEM/LAMoperational
2.5 km 201x201 GEM322PHY44
200307160600 UTC
42 hrs 60 s
GEM/LAM 1 km 201x201 GEM322PHY44
200307161200 UTC
36 hrs 30 s
GEM/LAM(planned)
250 m 201x201 GEM322PHY44
200307161200 UTC
30 hrs 6 s
GEM/LAM 2.5 km GEM/LAM 1 km GEM/LAM 250 m
•Preliminary results based on Joint Urban 2003•IOP 3 (16 July 2003) - Clear sky / southerly winds•Cascade of grid nesting down to 1-km resolution
Modeling configurationModeling configuration
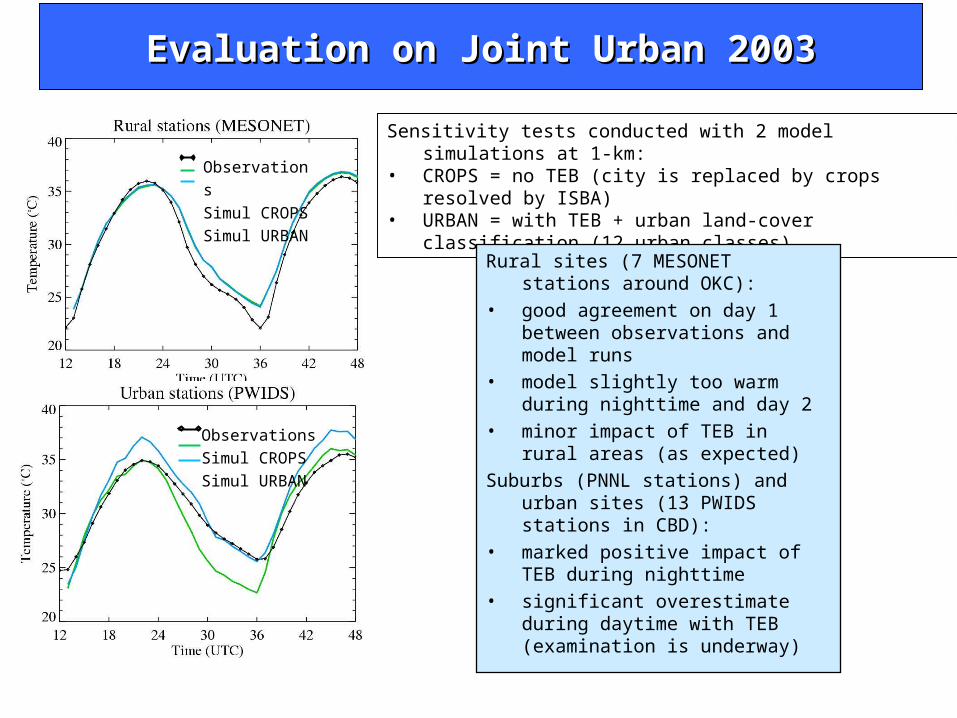
Evaluation on Joint Urban 2003Evaluation on Joint Urban 2003
Observations
Simul CROPS
Simul URBAN
Sensitivity tests conducted with 2 model simulations at 1-km:• CROPS = no TEB (city is replaced by crops resolved by ISBA)• URBAN = with TEB + urban land-cover classification (12 urban
classes)
Rural sites (7 MESONET stations around OKC):
• good agreement on day 1 between observations and model runs
• model slightly too warm during nighttime and day 2
• minor impact of TEB in rural areas (as expected)
Suburbs (PNNL stations) and urban sites (13 PWIDS stations in CBD):
• marked positive impact of TEB during nighttime
• significant overestimate during daytime with TEB (examination is underway)
Observations
Simul CROPS
Simul URBAN
Evaluation on Joint Urban 2003Evaluation on Joint Urban 2003
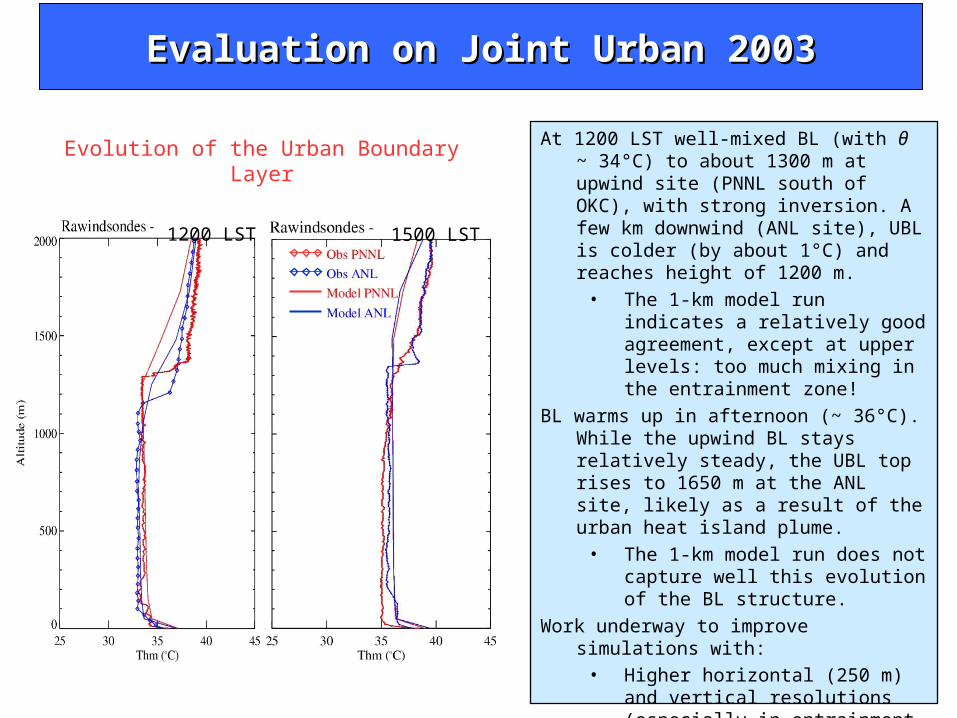
At 1200 LST well-mixed BL (with θ ~ 34°C) to about 1300 m at upwind site (PNNL south of OKC), with strong inversion. A few km downwind (ANL site), UBL is colder (by about 1°C) and reaches height of 1200 m.
• The 1-km model run indicates a relatively good agreement, except at upper levels: too much mixing in the entrainment zone!
BL warms up in afternoon (~ 36°C). While the upwind BL stays relatively steady, the UBL top rises to 1650 m at the ANL site, likely as a result of the urban heat island plume.
• The 1-km model run does not capture well this evolution of the BL structure.
Work underway to improve simulations with:• Higher horizontal (250 m) and
vertical resolutions (especially in entrainment zone);
• More appropriate vertical diffusion scheme (3D LES-type)
1500 LST1200 LST
Evolution of the Urban Boundary Layer
Objectives of MUSE-1
• Document the evolution of surface characteristics and energy budgets in a dense urban area during the winter-spring transition– Evolution of snow cover from ~100% to 0% in an urban environment
– Impact of snow on the surface energy and water budgets
– Quantify anthropogenic fluxes in late winter and spring conditions
• Evaluate TEB in reproducing the surface characteristics and budgets in these conditions (aspect not well examined so far)
• Gain expertise in urban measurements• Prepare for a wider effort to be submitted to CFCAS
Preliminary results of the 2005Preliminary results of the 2005Montreal Urban Snow Experiment (MUSE-2005)Montreal Urban Snow Experiment (MUSE-2005)
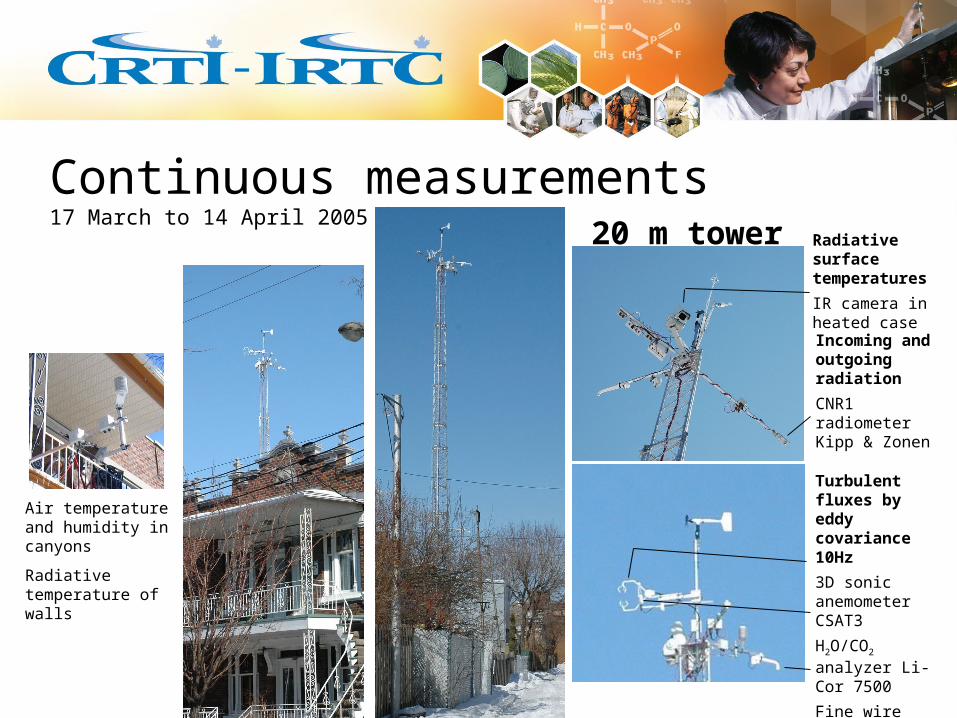
Incoming and outgoing radiation
CNR1 radiometer Kipp & Zonen
Radiative surface temperatures
IR camera in heated case
Turbulent fluxes by eddy covariance 10Hz
3D sonic anemometer CSAT3
H2O/CO2 analyzer Li-Cor 7500
Fine wire thermocouple ASPTC
Air temperature and humidity in canyons
Radiative temperature of walls
Continuous measurements17 March to 14 April 2005
20 m tower
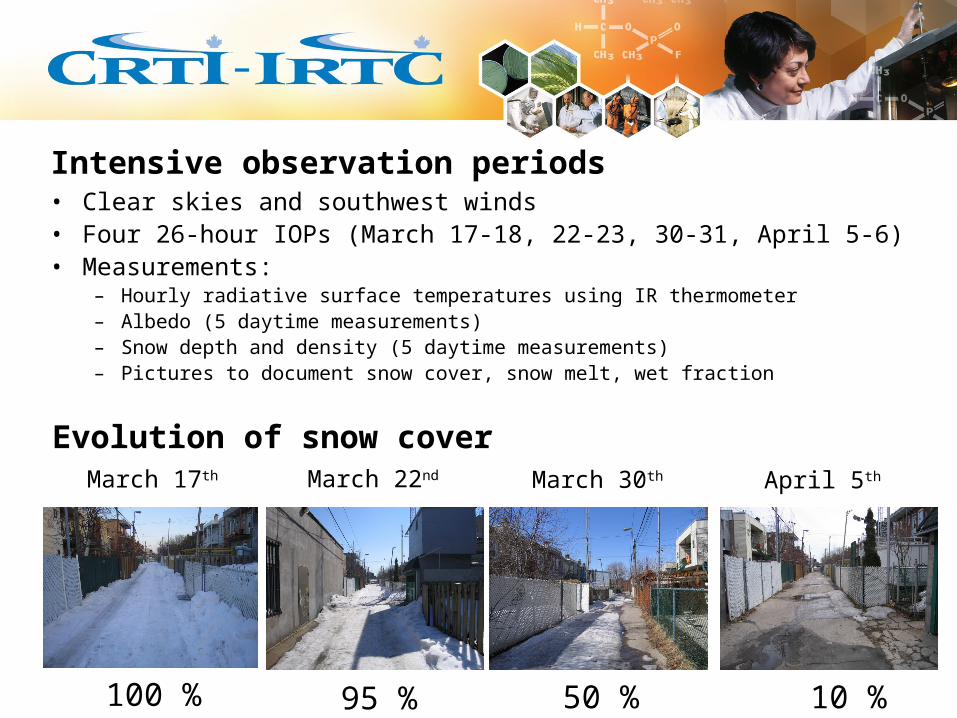
March 17th March 22nd March 30th April 5th
Evolution of snow cover
100 % 95 % 50 % 10 %
• Clear skies and southwest winds• Four 26-hour IOPs (March 17-18, 22-23, 30-31, April 5-6)• Measurements:
– Hourly radiative surface temperatures using IR thermometer– Albedo (5 daytime measurements)– Snow depth and density (5 daytime measurements)– Pictures to document snow cover, snow melt, wet fraction
Intensive observation periods
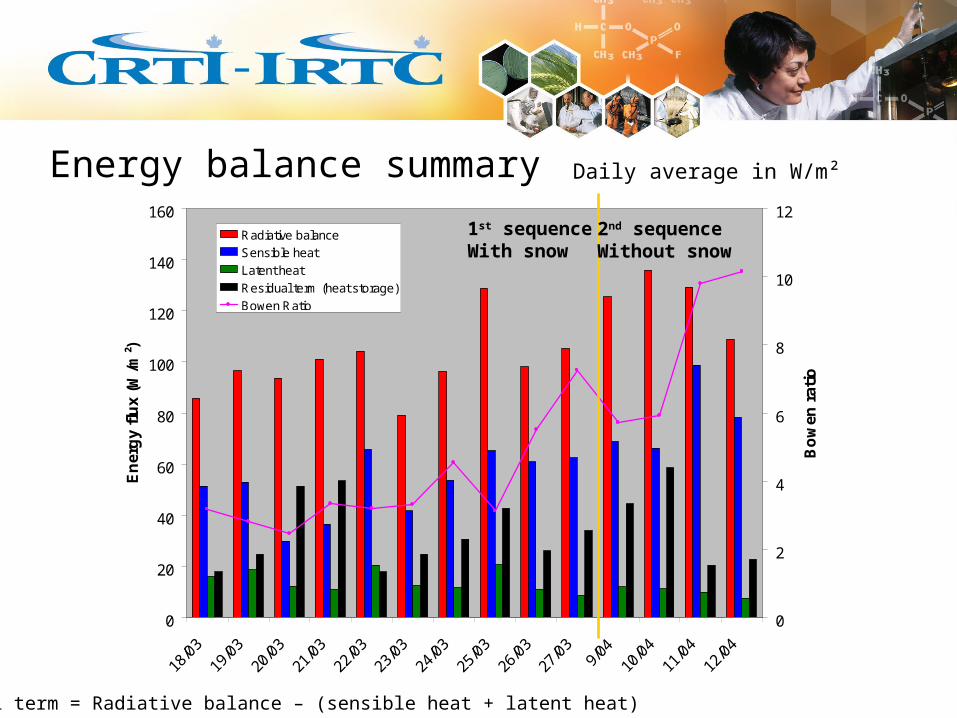
Energy balance summary Daily average in W/m²
Residual term = Radiative balance – (sensible heat + latent heat)
0
20
40
60
80
100
120
140
160
En
erg
y fl
ux
(W/m
²)
0
2
4
6
8
10
12
Bo
wen
rat
io
Radiative balance
Sensible heat
Latent heat
Residual term (heat storage)
Bowen Ratio
1st sequenceWith snow
2nd sequenceWithout snow
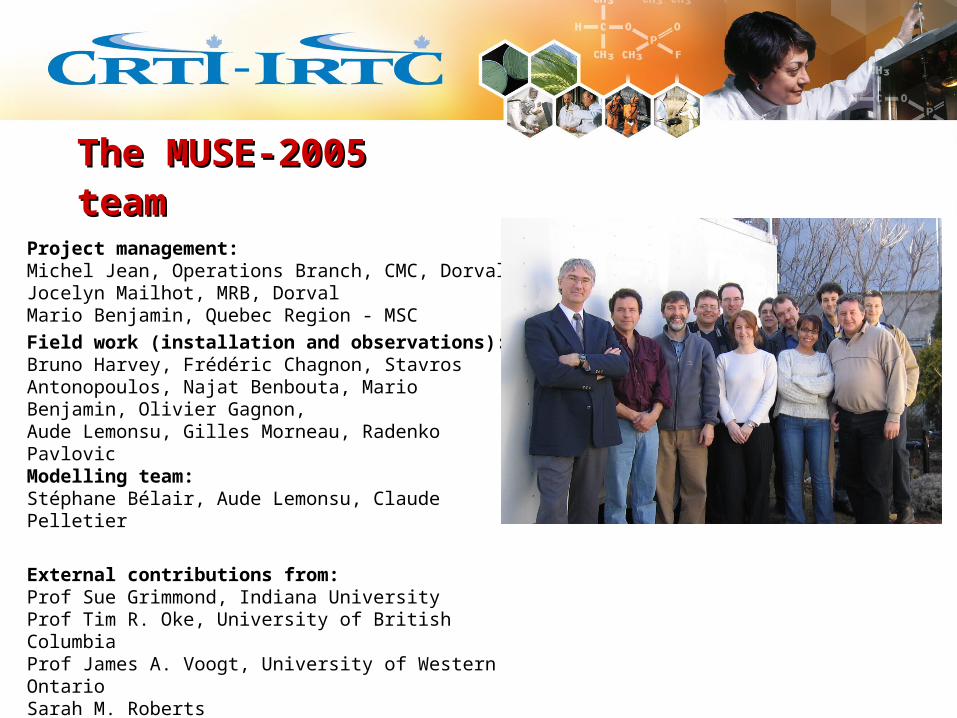
Project management:Michel Jean, Operations Branch, CMC, DorvalJocelyn Mailhot, MRB, DorvalMario Benjamin, Quebec Region - MSC
Field work (installation and observations):Bruno Harvey, Frédéric Chagnon, Stavros Antonopoulos, Najat Benbouta, Mario Benjamin, Olivier Gagnon,Aude Lemonsu, Gilles Morneau, Radenko PavlovicModelling team:Stéphane Bélair, Aude Lemonsu, Claude Pelletier
External contributions from:Prof Sue Grimmond, Indiana UniversityProf Tim R. Oke, University of British ColumbiaProf James A. Voogt, University of Western OntarioSarah M. Roberts
This project was funded by CBRN Research and Technology Initiative as project # 02-0093RD
The MUSE-2005 teamThe MUSE-2005 team
MUSE-2: follow-up• 10 February until end March 2006• Wintertime conditions• Similar location (Rosemont/Petite-Patrie) and instrumentation
Longer-term wider effort in Canada:• Development of a national observation network• Urban sites for surface and upper-air profiles• Monitoring of the urban boundary layer• Partnership with various organizations across Canada• Seek funding by CFCAS (Canadian Foundation for Climate and
Atmospheric Sciences)
OutlookOutlook
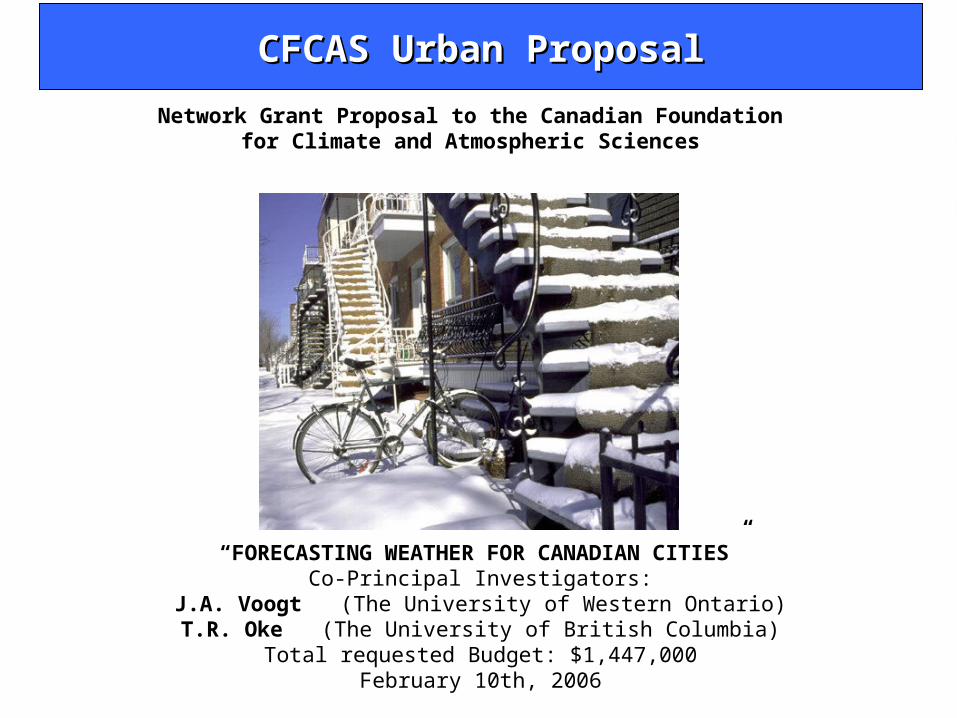
CFCAS Urban ProposalCFCAS Urban Proposal
Network Grant Proposal to the Canadian Foundationfor Climate and Atmospheric Sciences
“FORECASTING WEATHER FOR CANADIAN CITIES”Co-Principal Investigators:
J.A. Voogt (The University of Western Ontario)T.R. Oke (The University of British Columbia)
Total requested Budget: $1,447,000February 10th, 2006
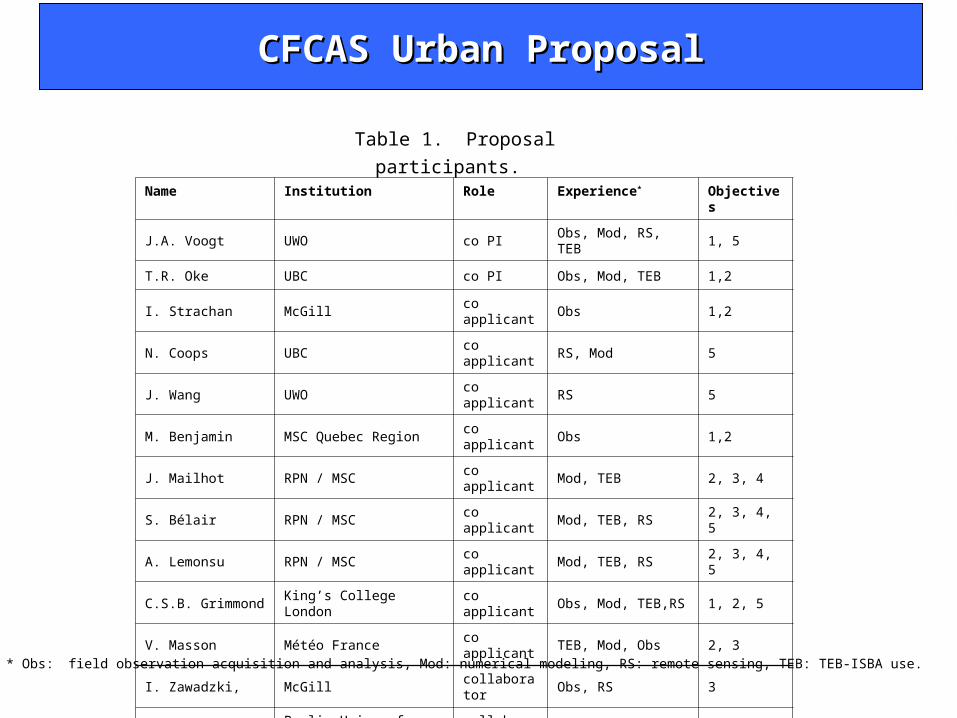
CFCAS Urban ProposalCFCAS Urban Proposal
Name Institution Role Experience* Objectives
J.A. Voogt UWO co PI Obs, Mod, RS, TEB 1, 5
T.R. Oke UBC co PI Obs, Mod, TEB 1,2
I. Strachan McGill co applicant Obs 1,2
N. Coops UBC co applicant RS, Mod 5
J. Wang UWO co applicant RS 5
M. Benjamin MSC Quebec Region co applicant Obs 1,2
J. Mailhot RPN / MSC co applicant Mod, TEB 2, 3, 4
S. Bélair RPN / MSC co applicant Mod, TEB, RS 2, 3, 4, 5
A. Lemonsu RPN / MSC co applicant Mod, TEB, RS 2, 3, 4, 5
C.S.B. Grimmond King’s College London co applicant Obs, Mod, TEB,RS 1, 2, 5
V. Masson Météo France co applicant TEB, Mod, Obs 2, 3
I. Zawadzki, McGill collaborator Obs, RS 3
A. Christen Berlin Univ. of Tech. collaborator Obs 1
G. Brunet RPN/MSC collaborator Mod 2, 3, 4
R. Hogue CMC/MSC collaborator Mod 2, 3, 4
* Obs: field observation acquisition and analysis, Mod: numerical modeling, RS: remote sensing, TEB: TEB-ISBA use.
Table 1. Proposal participants.
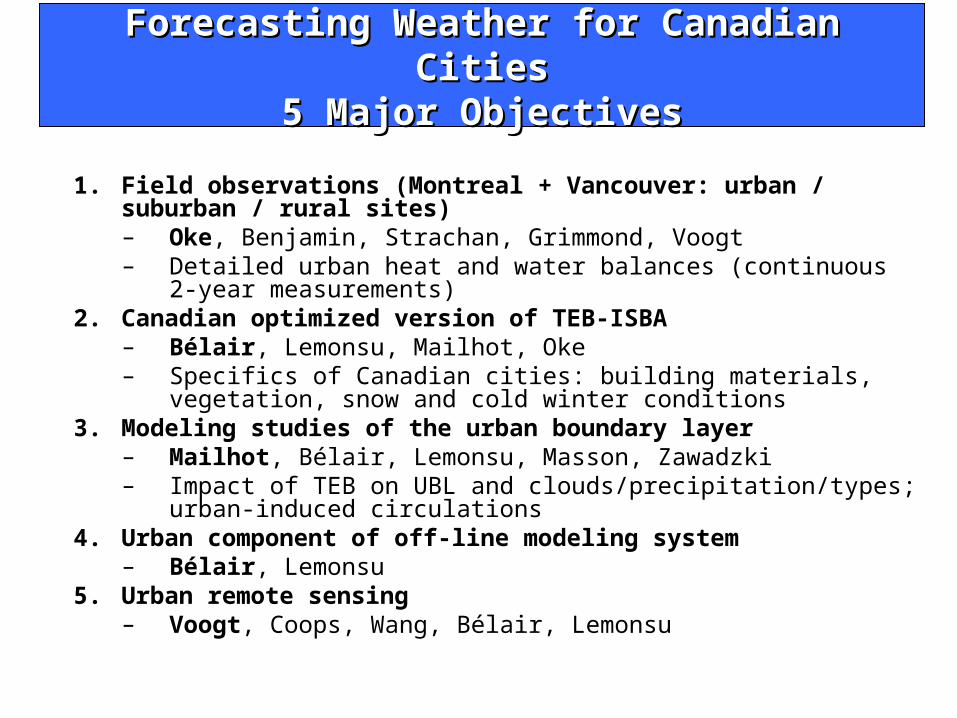
Forecasting Weather for Canadian Cities5 Major Objectives
1. Field observations (Montreal + Vancouver: urban / suburban / rural sites)– Oke, Benjamin, Strachan, Grimmond, Voogt– Detailed urban heat and water balances (continuous 2-year
measurements)2. Canadian optimized version of TEB-ISBA
– Bélair, Lemonsu, Mailhot, Oke– Specifics of Canadian cities: building materials, vegetation, snow and
cold winter conditions3. Modeling studies of the urban boundary layer
– Mailhot, Bélair, Lemonsu, Masson, Zawadzki– Impact of TEB on UBL and clouds/precipitation/types; urban-induced
circulations 4. Urban component of off-line modeling system
– Bélair, Lemonsu 5. Urban remote sensing
– Voogt, Coops, Wang, Bélair, Lemonsu
Forecasting Weather for Canadian CitiesForecasting Weather for Canadian Cities5 Major Objectives5 Major Objectives
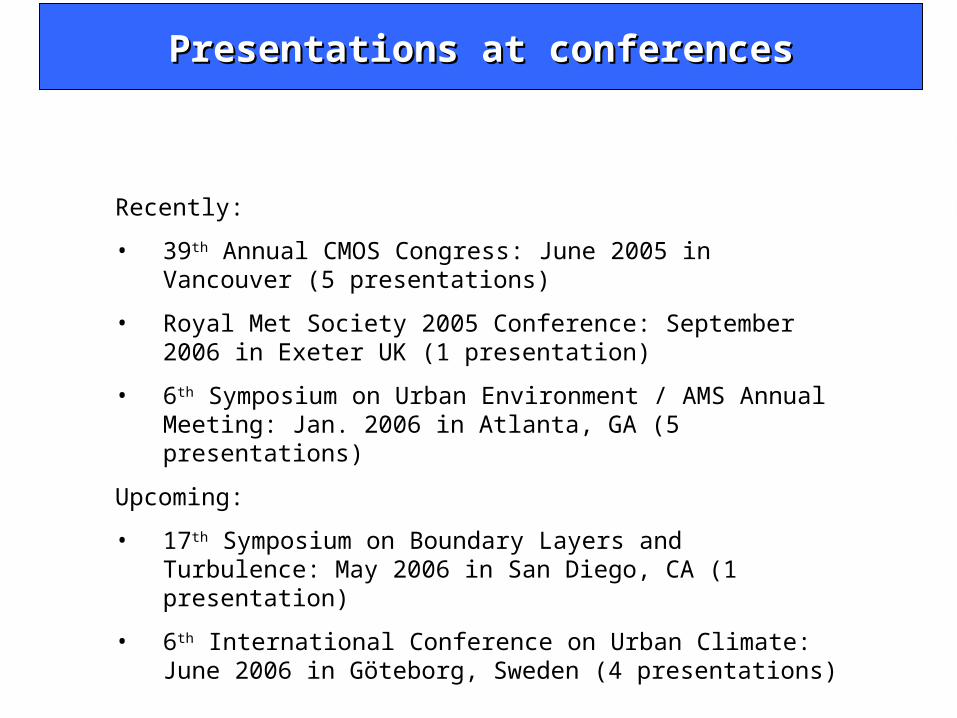
Recently:
• 39th Annual CMOS Congress: June 2005 in Vancouver (5 presentations)
• Royal Met Society 2005 Conference: September 2006 in Exeter UK (1 presentation)
• 6th Symposium on Urban Environment / AMS Annual Meeting: Jan. 2006 in Atlanta, GA (5 presentations)
Upcoming:
• 17th Symposium on Boundary Layers and Turbulence: May 2006 in San Diego, CA (1 presentation)
• 6th International Conference on Urban Climate: June 2006 in Göteborg, Sweden (4 presentations)
Presentations at conferencesPresentations at conferences
Funding through…Funding through…
CRTI Project # 02-CRTI Project # 02-0093RD0093RDAdvanced Emergency Response Systemfor CBRN Hazard Prediction and Assessment for the Urban Environment