Embed Size (px)
Citation preview
Aucune souscription ne peut être reçue sur base du présent rapport. Les souscriptions ne sont valables que si elles ont été effectuées sur base du prospectus d'émission courant, accompagné du bulletin de souscription, du dernier rapport annuel et du dernier rapport semestriel si celui-ci est plus récent que le rapport annuel. No subscription can be received on the basis of this financial report. Subscriptions are only valid if made on the basis of the current prospectus supplemented by the latest annual report and the most recent semi-annual report, if published thereafter. Seule la version française du présent rapport fait foi, la version anglaise résulte d‟une traduction de la première. En cas de divergence entre la version française et la traduction anglaise, la version française fera foi.
PLEIADE
Société d'Investissement à Capital Variable
Luxembourg
R.C.S. Luxembourg B 42619
Rapport annuel révisé au 30 septembre 2009 Audited annual report
as at 30 September 2009
PLEIADE
SOMMAIRE / CONTENTS
1
ORGANISATION / ORGANISATION ..................................................................................................... 4
INFORMATIONS GENERALES / GENERAL INFORMATION .............................................................. 7
RAPPORT DU CONSEIL D'ADMINISTRATION / REPORT OF THE BOARD OF DIRECTORS ....... 16
RAPPORT DE GESTION / MANAGER’S REPORT ............................................................................ 18
RAPPORT DU REVISEUR D'ENTREPRISES / REPORT OF THE AUDITOR ................................... 34
ETAT CONSOLIDE DU PATRIMOINE / CONSOLIDATED STATEMENT OF NET ASSETS ............ 38
ETAT CONSOLIDE DES OPERATIONS ET DES AUTRES VARIATIONS DE L'ACTIF NET / CONSOLIDATED STATEMENT OF OPERATIONS AND OTHER CHANGES IN NET ASSETS ...... 39
Pléiade Actions Amérique du Nord ................................................................................................... 41 ETAT DU PATRIMOINE / STATEMENT OF NET ASSETS .............................................................. 41 ETAT DES OPERATIONS ET DES AUTRES VARIATIONS DE L' ACTIF NET / STATEMENT OF OPERATIONS AND OTHER CHANGES IN NET ASSETS .............................................................. 42 STATISTIQUES / STATISTICAL INFORMATION ............................................................................. 44 ETAT DU PORTEFEUILLE-TITRES ET DES AUTRES ACTIFS NETS / STATEMENT OF INVESTMENTS AND OTHER NET ASSETS.................................................................................... 45 REPARTITION ECONOMIQUE DU PORTEFEUILLE-TITRES / INDUSTRIAL CLASSIFICATION OF INVESTMENTS ................................................................................................................................. 47 REPARTITION GEOGRAPHIQUE DU PORTEFEUILLE-TITRES / GEOGRAPHICAL CLASSIFICATION OF INVESTMENTS ............................................................................................. 47
Pléiade Actions Europe ...................................................................................................................... 48 ETAT DU PATRIMOINE / STATEMENT OF NET ASSETS .............................................................. 48 ETAT DES OPERATIONS ET DES AUTRES VARIATIONS DE L' ACTIF NET / STATEMENT OF OPERATIONS AND OTHER CHANGES IN NET ASSETS .............................................................. 49 STATISTIQUES / STATISTICAL INFORMATION ............................................................................. 51 ETAT DU PORTEFEUILLE-TITRES ET DES AUTRES ACTIFS NETS / STATEMENT OF INVESTMENTS AND OTHER NET ASSETS.................................................................................... 52 REPARTITION ECONOMIQUE DU PORTEFEUILLE-TITRES / INDUSTRIAL CLASSIFICATION OF INVESTMENTS ................................................................................................................................. 54 REPARTITION GEOGRAPHIQUE DU PORTEFEUILLE-TITRES / GEOGRAPHICAL CLASSIFICATION OF INVESTMENTS ............................................................................................. 55
Pléiade Actions Asie et Bassin du Pacifique.................................................................................... 56 ETAT DU PATRIMOINE / STATEMENT OF NET ASSETS .............................................................. 56 ETAT DES OPERATIONS ET DES AUTRES VARIATIONS DE L' ACTIF NET / STATEMENT OF OPERATIONS AND OTHER CHANGES IN NET ASSETS .............................................................. 57 STATISTIQUES / STATISTICAL INFORMATION ............................................................................. 59 ETAT DU PORTEFEUILLE-TITRES ET DES AUTRES ACTIFS NETS / STATEMENT OF INVESTMENTS AND OTHER NET ASSETS.................................................................................... 60 REPARTITION ECONOMIQUE DU PORTEFEUILLE-TITRES / INDUSTRIAL CLASSIFICATION OF INVESTMENTS ................................................................................................................................. 63 REPARTITION GEOGRAPHIQUE DU PORTEFEUILLE-TITRES / GEOGRAPHICAL CLASSIFICATION OF INVESTMENTS ............................................................................................. 64
PLEIADE
SOMMAIRE / CONTENTS (suite) / (continued)
2
Pléiade Actions Internationales Valeur Intrinsèque ........................................................................ 65 ETAT DU PATRIMOINE / STATEMENT OF NET ASSETS .............................................................. 65 ETAT DES OPERATIONS ET DES AUTRES VARIATIONS DE L' ACTIF NET / STATEMENT OF OPERATIONS AND OTHER CHANGES IN NET ASSETS .............................................................. 66 STATISTIQUES / STATISTICAL INFORMATION ............................................................................. 68 ETAT DU PORTEFEUILLE-TITRES ET DES AUTRES ACTIFS NETS / STATEMENT OF INVESTMENTS AND OTHER NET ASSETS.................................................................................... 69 REPARTITION ECONOMIQUE DU PORTEFEUILLE-TITRES / INDUSTRIAL CLASSIFICATION OF INVESTMENTS ................................................................................................................................. 71 REPARTITION GEOGRAPHIQUE DU PORTEFEUILLE-TITRES / GEOGRAPHICAL CLASSIFICATION OF INVESTMENTS ............................................................................................. 72
Pléiade Obligations Dollar .................................................................................................................. 73 ETAT DU PATRIMOINE / STATEMENT OF NET ASSETS .............................................................. 73 ETAT DES OPERATIONS ET DES AUTRES VARIATIONS DE L' ACTIF NET / STATEMENT OF OPERATIONS AND OTHER CHANGES IN NET ASSETS .............................................................. 74 STATISTIQUES / STATISTICAL INFORMATION ............................................................................. 76 ETAT DU PORTEFEUILLE-TITRES ET DES AUTRES ACTIFS NETS / STATEMENT OF INVESTMENTS AND OTHER NET ASSETS.................................................................................... 77 REPARTITION ECONOMIQUE DU PORTEFEUILLE-TITRES / INDUSTRIAL CLASSIFICATION OF INVESTMENTS ................................................................................................................................. 78 REPARTITION GEOGRAPHIQUE DU PORTEFEUILLE-TITRES / GEOGRAPHICAL CLASSIFICATION OF INVESTMENTS ............................................................................................. 78
Pléiade Obligations Européennes ..................................................................................................... 79 ETAT DU PATRIMOINE / STATEMENT OF NET ASSETS .............................................................. 79 ETAT DES OPERATIONS ET DES AUTRES VARIATIONS DE L' ACTIF NET / STATEMENT OF OPERATIONS AND OTHER CHANGES IN NET ASSETS .............................................................. 80 STATISTIQUES / STATISTICAL INFORMATION ............................................................................. 82 ETAT DU PORTEFEUILLE-TITRES ET DES AUTRES ACTIFS NETS / STATEMENT OF INVESTMENTS AND OTHER NET ASSETS.................................................................................... 83 REPARTITION ECONOMIQUE DU PORTEFEUILLE-TITRES / INDUSTRIAL CLASSIFICATION OF INVESTMENTS ................................................................................................................................. 84 REPARTITION GEOGRAPHIQUE DU PORTEFEUILLE-TITRES / GEOGRAPHICAL CLASSIFICATION OF INVESTMENTS ............................................................................................. 84
Pléiade Obligations Convertibles Internationales ........................................................................... 85 ETAT DU PATRIMOINE / STATEMENT OF NET ASSETS .............................................................. 85 ETAT DES OPERATIONS ET DES AUTRES VARIATIONS DE L' ACTIF NET / STATEMENT OF OPERATIONS AND OTHER CHANGES IN NET ASSETS .............................................................. 86 STATISTIQUES / STATISTICAL INFORMATION ............................................................................. 88 ETAT DU PORTEFEUILLE-TITRES ET DES AUTRES ACTIFS NETS / STATEMENT OF INVESTMENTS AND OTHER NET ASSETS.................................................................................... 89 REPARTITION ECONOMIQUE DU PORTEFEUILLE-TITRES / INDUSTRIAL CLASSIFICATION OF INVESTMENTS ................................................................................................................................. 91 REPARTITION GEOGRAPHIQUE DU PORTEFEUILLE-TITRES / GEOGRAPHICAL CLASSIFICATION OF INVESTMENTS ............................................................................................. 91
PLEIADE
SOMMAIRE / CONTENTS (suite) / (continued)
3
Pléiade Dollar Court Terme ................................................................................................................ 92 ETAT DU PATRIMOINE / STATEMENT OF NET ASSETS .............................................................. 92 ETAT DES OPERATIONS ET DES AUTRES VARIATIONS DE L' ACTIF NET / STATEMENT OF OPERATIONS AND OTHER CHANGES IN NET ASSETS .............................................................. 93 STATISTIQUES / STATISTICAL INFORMATION ............................................................................. 95 ETAT DU PORTEFEUILLE-TITRES ET DES AUTRES ACTIFS NETS / STATEMENT OF INVESTMENTS AND OTHER NET ASSETS.................................................................................... 96 REPARTITION ECONOMIQUE DU PORTEFEUILLE-TITRES / INDUSTRIAL CLASSIFICATION OF INVESTMENTS ................................................................................................................................. 97 REPARTITION GEOGRAPHIQUE DU PORTEFEUILLE-TITRES / GEOGRAPHICAL CLASSIFICATION OF INVESTMENTS ............................................................................................. 97
Pléiade Euro Court Terme .................................................................................................................. 98 ETAT DU PATRIMOINE / STATEMENT OF NET ASSETS .............................................................. 98 ETAT DES OPERATIONS ET DES AUTRES VARIATIONS DE L' ACTIF NET / STATEMENT OF OPERATIONS AND OTHER CHANGES IN NET ASSETS .............................................................. 99 STATISTIQUES / STATISTICAL INFORMATION ........................................................................... 101 ETAT DU PORTEFEUILLE-TITRES ET DES AUTRES ACTIFS NETS / STATEMENT OF INVESTMENTS AND OTHER NET ASSETS.................................................................................. 102 REPARTITION ECONOMIQUE DU PORTEFEUILLE-TITRES / INDUSTRIAL CLASSIFICATION OF INVESTMENTS ............................................................................................................................... 103 REPARTITION GEOGRAPHIQUE DU PORTEFEUILLE-TITRES / GEOGRAPHICAL CLASSIFICATION OF INVESTMENTS ........................................................................................... 103
Pléiade Euro Balanced (anciennement / formerly Pléiade Actions Privatinvestor) ................... 104 ETAT DU PATRIMOINE / STATEMENT OF NET ASSETS ............................................................ 104 ETAT DES OPERATIONS ET DES AUTRES VARIATIONS DE L' ACTIF NET / STATEMENT OF OPERATIONS AND OTHER CHANGES IN NET ASSETS ............................................................ 105 STATISTIQUES / STATISTICAL INFORMATION ........................................................................... 107 ETAT DU PORTEFEUILLE-TITRES ET DES AUTRES ACTIFS NETS / STATEMENT OF INVESTMENTS AND OTHER NET ASSETS.................................................................................. 108 REPARTITION ECONOMIQUE DU PORTEFEUILLE-TITRES / INDUSTRIAL CLASSIFICATION OF INVESTMENTS ............................................................................................................................... 110 REPARTITION GEOGRAPHIQUE DU PORTEFEUILLE-TITRES / GEOGRAPHICAL CLASSIFICATION OF INVESTMENTS ........................................................................................... 111
NOTES AUX ETATS FINANCIERS / NOTES TO THE FINANCIAL STATEMENTS ........................ 112
PLEIADE
4
ORGANISATION / ORGANISATION
SIEGE SOCIAL / PLEIADE REGISTERED OFFICE Société d'Investissement à Capital Variable
50, Avenue J.F. Kennedy L-2951 LUXEMBOURG (jusqu'au 30 juin 2009 / until 30th June 2009) 14, Boulevard Royal L-2449 LUXEMBOURG
(à partir du 1er juillet 2009 / as from 1st July 2009) CONSEIL D'ADMINISTRATION / BOARD OF DIRECTORS Président / Joseph BENHAMOU Chairman Directeur Général CBH Compagnie Bancaire Helvétique (anciennement/ formerly Banque SCS Alliance S.A.)
6B, Route de Chancy CH-1213 GENEVE
Administrateurs / Christian MARECHAL Directors Membre de la Direction Générale CBH Compagnie Bancaire Helvétique (anciennement/ formerly Banque SCS Alliance S.A.)
6B, Route de Chancy CH-1213 GENEVE
Thierry WEBER Administrateur CBH Compagnie Bancaire Helvétique (anciennement/ formerly Banque SCS Alliance S.A.)
6B, Route de Chancy CH-1213 GENEVE Direction / Conducting Persons Administrateur - Délégué / Christian MARECHAL Managing Director Dirigeant / Pierre CARRAS Manager Banque Dépositaire, BGL BNP Paribas Agent d'Administration et (anciennement / formerly BGL Société Anonyme) Agent Payeur Principal / 50, Avenue J.F. Kennedy Custodian Bank, L-2951 LUXEMBOURG Administrative Agent and (jusqu'au 30 juin 2009 / until 30th June 2009) Principal Paying Agent
PLEIADE
ORGANISATION / ORGANISATION (suite) / (continued)
5
BANQUE DE LUXEMBOURG Société Anonyme 14, Boulevard Royal L-2449 LUXEMBOURG (à partir du 1er juillet 2009 / as from 1st July 2009) Agents centralisateurs (Agents de distribution principaux) / Centralisation Agents (Principal Distribution Agents) pour la France / C.I.C. SECURITES for France 6, Avenue de Provence FR-75009 PARIS pour la Suisse / CBH Compagnie Bancaire Helvétique for Switzerland (anciennement/ formerly Banque SCS Alliance S.A.) 6B, Route de Chancy CH-1213 GENEVE Réviseur d'Entreprises / KPMG Audit S.à r.l. Independent Auditors 9, Allée Scheffer L-2520 LUXEMBOURG Gestionnaires / APS ASSET MANAGEMENT PTE LTD Managers 3 Anson Road #24-03 Springleaf Tower SINGAPOUR 079909 CBH Compagnie Bancaire Helvétique (anciennement/ formerly Banque SCS Alliance S.A.) 6B, Route de Chancy CH-1213 GENÈVE TWEEDY BROWNE COMPANY LLC 350 Park Avenue NEW YORK, NY 10022, USA GLG PARTNERS
10 Upper Bank Street GB- LONDON E14 5JJ
(jusqu‟au 28 février 2009 / until 28th February 2009) Conseiller Juridique / ELVINGER, HOSS & PRUSSEN Legal Adviser Association d'Avocats
2, Place Winston Churchill L-1340 LUXEMBOURG
PLEIADE
ORGANISATION / ORGANISATION (suite) / (continued)
6
Conseiller en Investissement / PRIVATINVESTOR VERWALTUNGS A.G. Investment Advisor Berghofstraße 19 pour le compartiment / CH-8535 HERDERN for the sub-fund (jusqu‟au 17 octobre 2008 / until 17th October 2008) Pléiade Euro Balanced (anciennement / formerly Pléiade Actions "Privatinvestor") Agent Payeur / MARCARD, STEIN & CO AG Paying Agent Ballindamm 36 pour l‟Allemagne / D-20095 HAMBOURG for Germany (jusqu‟au 1er novembre 2008 / until 1st November 2008)
PLEIADE
7
INFORMATIONS GENERALES / GENERAL INFORMATION
PLEIADE (la "SICAV") est une Société d'Investissement à Capital Variable à compartiments multiples de droit luxembourgeois, constituée à Luxembourg le 29 décembre 1992. La SICAV est soumise à la Partie I de la loi modifiée du 20 décembre 2002 concernant les Organismes de Placement Collectif, partie reprenant les dispositions de la directive européenne du 20 décembre 1985 (85/611/CEE) telle que modifiée par les directives européennes 2001/107/CE et 2001/108/CE du 21 janvier 2002. PLEIADE est une SICAV autogérée au sens des articles 27, 85 et 86 de la loi modifiée du 20 décembre 2002. Les statuts de la SICAV ont été publiés au "Mémorial, Recueil des Sociétés et Associations du Luxembourg"("Mémorial") et déposés au Registre du Commerce et des Sociétés de Luxembourg auprès duquel des copies peuvent être obtenues. Les statuts ont été modifiés en dernier lieu par les décisions de l'Assemblée Générale Extraordinaire du 11 janvier 2006 et publiés au Mémorial le 31 janvier 2006. A la date du rapport, les compartiments suivants sont offerts à la souscription : Compartiments Actions Pléiade Actions Amérique du Nord libellé en USD Pléiade Actions Europe libellé en EUR Pléiade Actions Asie et Bassin du Pacifique libellé en USD Pléiade Actions Internationales "Valeur Intrinsèque" libellé en CHF Compartiments Obligations Pléiade Obligations Dollar libellé en USD Pléiade Obligations Européennes libellé en EUR Pléiade Obligations Convertibles Internationales libellé en EUR Compartiments Court Terme Pléiade Dollar Court Terme libellé en USD Pléiade Euro Court Terme libellé en EUR Compartiments Asset Allocation Pléiade Euro Balanced (anciennement Pléiade Actions "Privatinvestor") libellé en EUR. Pour les compartiments actuellement offerts à la souscription, seules des actions de capitalisation sont émises. Le calcul de la Valeur Nette d‟Inventaire des compartiments est effectué chaque lundi ("Jour de Transaction"). Le "Jour de Transaction" doit être un jour ouvrable à Luxembourg. Toutes les souscriptions et tous les rachats enregistrés avant 12 heures chaque Jour de Transaction seront calculés sur base de la prochaine Valeur Nette d‟Inventaire. Les prix de transaction lors de chaque Jour de Transaction pourront être obtenus auprès de l'Agent d'Administration ou encore auprès de "PLEIADE SERVICES" à Genève. Les Prix de transaction sont publiés dans le journal "AGEFI", sur le système d‟information Reuters (page "PLEIADE"), le système Bloomberg (section Equity) et sur le réseau Internet (www.cbhbank.com). La SICAV publie à la fin de chaque exercice un rapport annuel vérifié par le Réviseur d'Entreprises et à la fin de chaque semestre, au 30 juin, un rapport semestriel non révisé. Ces rapports financiers contiennent entre autres des états financiers distincts établis pour chaque compartiment. La devise de consolidation est l‟USD.

PLEIADE
INFORMATIONS GENERALES / GENERAL INFORMATION (suite) / (continued)
8
Le prospectus, les rapports annuels et semestriels peuvent être obtenus sur simple demande adressée aux Agents de Distribution et au siège social de la SICAV.
PLEIADE
INFORMATIONS GENERALES / GENERAL INFORMATION (suite) / (continued)
9
PLEIADE (the "SICAV") was an Investment Company with Variable Capital with multiple Sub-Funds, governed by Luxembourg Law, incorporated in Luxembourg on 29th December 1992. The SICAV is subject to the Part I of the amended law of the 20th December 2002 related to Undertakings for Collective Investment which transposed the provisions of European Directive of 20th December 1985 (85/611/CEE) amended by the European Directives 2001/107/CE and 2001/108/CE as at 21st January 2002. PLEIADE is a self managed SICAV in the sense of articles 27, 85 and 86 of the amended law of 20th December 2002. The Articles of Incorporation of the SICAV were published in the "Mémorial, Recueil des Sociétés et Associations de Luxembourg" (“Mémorial”) and filed with the "Registre de Commerce et des Sociétés de Luxembourg" where copies may be obtained. The Articles of Incorporation were amended for the last time by decision of the extraordinary general meeting of 11th January 2006 and published in the “Mémorial” on 31st January 2006. At the date of the report, the following Sub-Funds were open for the subscriptions: Equity Sub-Funds Pléiade Actions Amérique du Nord denominated in USD Pléiade Actions Europe denominated in EUR Pléiade Actions Asie et Bassin du Pacifique denominated in USD Pléiade Actions Internationales "Valeur Intrinsèque" denominated in CHF Bonds Sub-Funds Pléiade Obligations Dollar denominated in USD Pléiade Obligations Européennes denominated in EUR Pléiade Obligations Convertibles Internationales denominated in EUR Short Term Sub-Funds Pléiade Dollar Court Terme denominated in USD Pléiade Euro Court Terme denominated in EUR Asset Allocation Sub-Funds Pléiade Euro Balanced (formerly Pléiade Actions "Privatinvestor") denominated in EUR. For the Sub-Funds currently offered to subscription, only capitalisation shares are issued. The Net Asset Value of the Sub-Funds is calculated each Monday (“trading day”). The trading day shall be a business day in Luxembourg. All subscriptions and all redemptions recorded before 12 a.m. every trading day will be calculated on the basis of the next Net Asset Value. The trading prices may be obtained on each trading day at the Administrative Agent or at the " PLEIADE SERVICES" in Geneva. The trading prices are published in the newspaper "L’AGEFi", on the Reuters Information system (page “PLEIADE”), the Bloomberg system (Equity section) and on the Internet network (http://www.cbhbank.com). The SICAV publishes an annual report audited by its Independent Auditor and an unaudited semi-annual report. The financial reports contain separate financial statements for each Sub-Fund. The consolidation currency is USD.
The Prospectus, the latest annual and semi-annual reports may be obtained on request at the Distribution Agents and at the SICAV‟s registered office.
PLEIADE
INFORMATIONS GENERALES / GENERAL INFORMATION (suite) / (continued)
10
INFORMATIONS SPECIFIQUES AUX SOUSCRIPTEURS FRANÇAIS
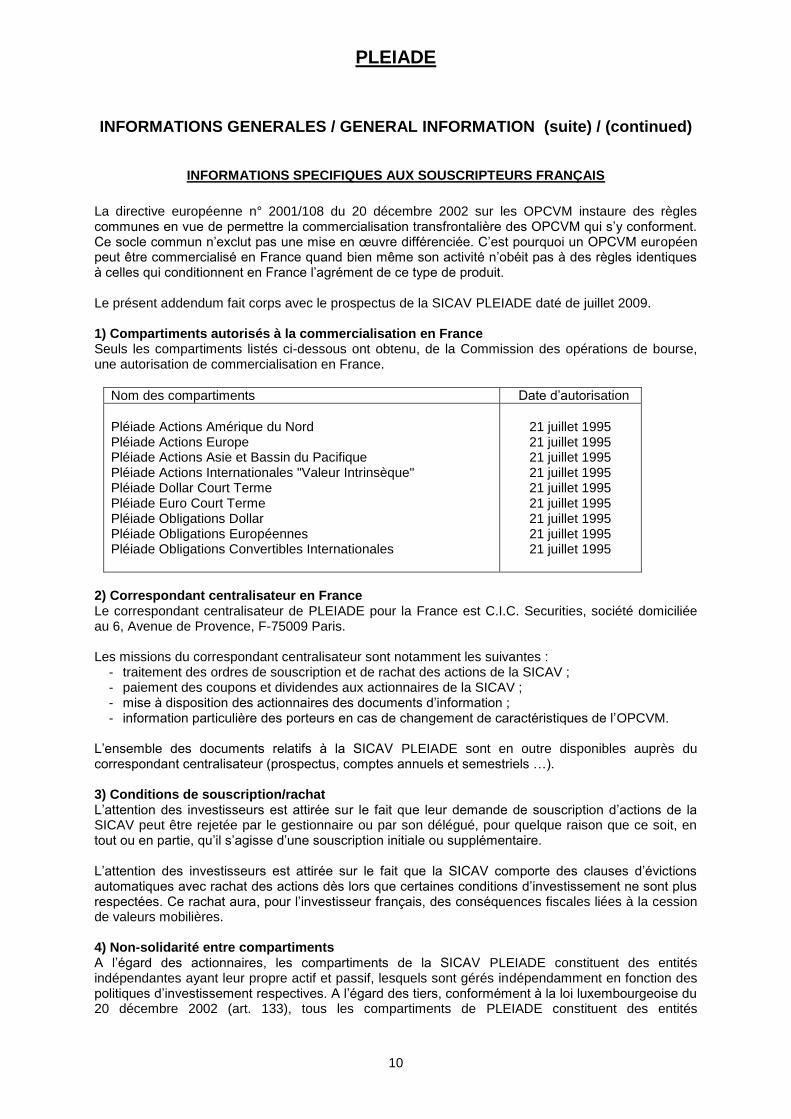
La directive européenne n° 2001/108 du 20 décembre 2002 sur les OPCVM instaure des règles communes en vue de permettre la commercialisation transfrontalière des OPCVM qui s‟y conforment. Ce socle commun n‟exclut pas une mise en œuvre différenciée. C‟est pourquoi un OPCVM européen peut être commercialisé en France quand bien même son activité n‟obéit pas à des règles identiques à celles qui conditionnent en France l‟agrément de ce type de produit. Le présent addendum fait corps avec le prospectus de la SICAV PLEIADE daté de juillet 2009. 1) Compartiments autorisés à la commercialisation en France Seuls les compartiments listés ci-dessous ont obtenu, de la Commission des opérations de bourse, une autorisation de commercialisation en France.
Nom des compartiments Date d‟autorisation
Pléiade Actions Amérique du Nord Pléiade Actions Europe Pléiade Actions Asie et Bassin du Pacifique Pléiade Actions Internationales "Valeur Intrinsèque" Pléiade Dollar Court Terme Pléiade Euro Court Terme Pléiade Obligations Dollar Pléiade Obligations Européennes Pléiade Obligations Convertibles Internationales
21 juillet 1995 21 juillet 1995 21 juillet 1995 21 juillet 1995 21 juillet 1995 21 juillet 1995 21 juillet 1995 21 juillet 1995 21 juillet 1995
2) Correspondant centralisateur en France Le correspondant centralisateur de PLEIADE pour la France est C.I.C. Securities, société domiciliée au 6, Avenue de Provence, F-75009 Paris. Les missions du correspondant centralisateur sont notamment les suivantes :
- traitement des ordres de souscription et de rachat des actions de la SICAV ; - paiement des coupons et dividendes aux actionnaires de la SICAV ; - mise à disposition des actionnaires des documents d‟information ; - information particulière des porteurs en cas de changement de caractéristiques de l‟OPCVM.
L‟ensemble des documents relatifs à la SICAV PLEIADE sont en outre disponibles auprès du correspondant centralisateur (prospectus, comptes annuels et semestriels …). 3) Conditions de souscription/rachat L‟attention des investisseurs est attirée sur le fait que leur demande de souscription d‟actions de la SICAV peut être rejetée par le gestionnaire ou par son délégué, pour quelque raison que ce soit, en tout ou en partie, qu‟il s‟agisse d‟une souscription initiale ou supplémentaire. L‟attention des investisseurs est attirée sur le fait que la SICAV comporte des clauses d‟évictions automatiques avec rachat des actions dès lors que certaines conditions d‟investissement ne sont plus respectées. Ce rachat aura, pour l‟investisseur français, des conséquences fiscales liées à la cession de valeurs mobilières. 4) Non-solidarité entre compartiments A l‟égard des actionnaires, les compartiments de la SICAV PLEIADE constituent des entités indépendantes ayant leur propre actif et passif, lesquels sont gérés indépendamment en fonction des politiques d‟investissement respectives. A l‟égard des tiers, conformément à la loi luxembourgeoise du 20 décembre 2002 (art. 133), tous les compartiments de PLEIADE constituent des entités
PLEIADE
INFORMATIONS GENERALES / GENERAL INFORMATION (suite) / (continued)
11
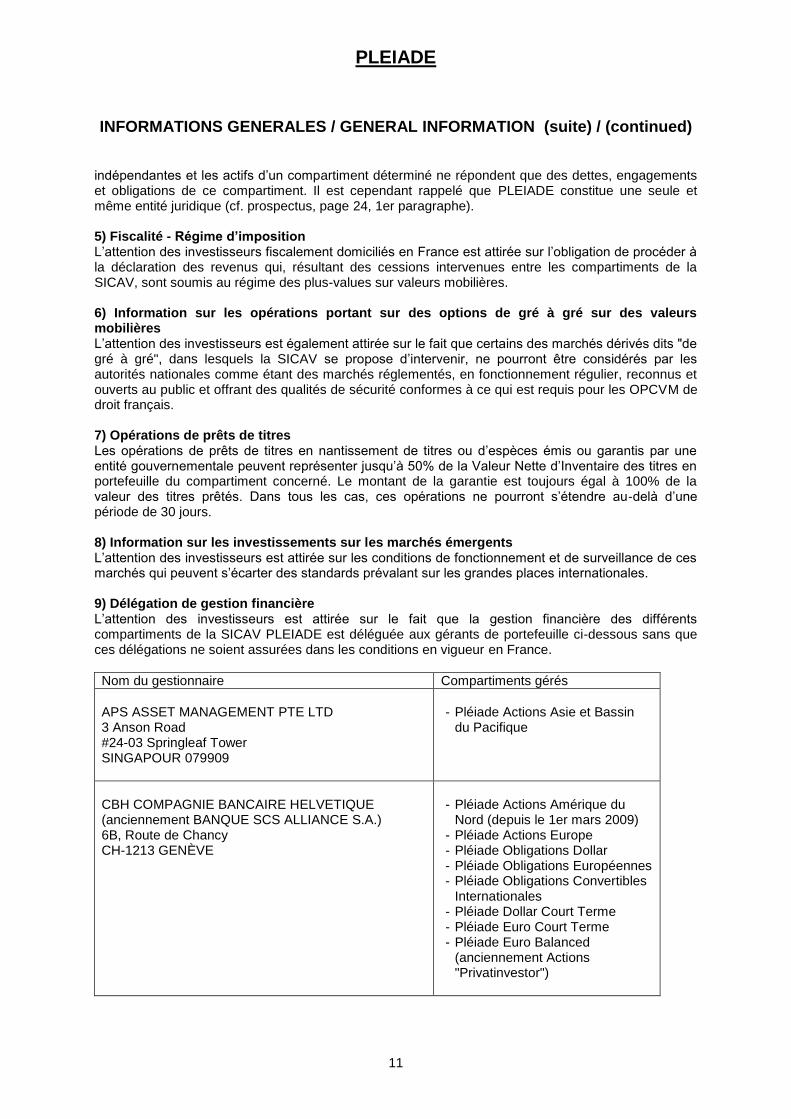
indépendantes et les actifs d‟un compartiment déterminé ne répondent que des dettes, engagements et obligations de ce compartiment. Il est cependant rappelé que PLEIADE constitue une seule et même entité juridique (cf. prospectus, page 24, 1er paragraphe). 5) Fiscalité - Régime d’imposition L‟attention des investisseurs fiscalement domiciliés en France est attirée sur l‟obligation de procéder à la déclaration des revenus qui, résultant des cessions intervenues entre les compartiments de la SICAV, sont soumis au régime des plus-values sur valeurs mobilières. 6) Information sur les opérations portant sur des options de gré à gré sur des valeurs mobilières L‟attention des investisseurs est également attirée sur le fait que certains des marchés dérivés dits "de gré à gré", dans lesquels la SICAV se propose d‟intervenir, ne pourront être considérés par les autorités nationales comme étant des marchés réglementés, en fonctionnement régulier, reconnus et ouverts au public et offrant des qualités de sécurité conformes à ce qui est requis pour les OPCVM de droit français. 7) Opérations de prêts de titres Les opérations de prêts de titres en nantissement de titres ou d‟espèces émis ou garantis par une entité gouvernementale peuvent représenter jusqu‟à 50% de la Valeur Nette d‟Inventaire des titres en portefeuille du compartiment concerné. Le montant de la garantie est toujours égal à 100% de la valeur des titres prêtés. Dans tous les cas, ces opérations ne pourront s‟étendre au-delà d‟une période de 30 jours. 8) Information sur les investissements sur les marchés émergents L‟attention des investisseurs est attirée sur les conditions de fonctionnement et de surveillance de ces marchés qui peuvent s‟écarter des standards prévalant sur les grandes places internationales. 9) Délégation de gestion financière L‟attention des investisseurs est attirée sur le fait que la gestion financière des différents compartiments de la SICAV PLEIADE est déléguée aux gérants de portefeuille ci-dessous sans que ces délégations ne soient assurées dans les conditions en vigueur en France.
Nom du gestionnaire Compartiments gérés
APS ASSET MANAGEMENT PTE LTD 3 Anson Road #24-03 Springleaf Tower SINGAPOUR 079909
- Pléiade Actions Asie et Bassin
du Pacifique
CBH COMPAGNIE BANCAIRE HELVETIQUE (anciennement BANQUE SCS ALLIANCE S.A.) 6B, Route de Chancy CH-1213 GENÈVE
- Pléiade Actions Amérique du
Nord (depuis le 1er mars 2009) - Pléiade Actions Europe - Pléiade Obligations Dollar - Pléiade Obligations Européennes - Pléiade Obligations Convertibles
Internationales - Pléiade Dollar Court Terme - Pléiade Euro Court Terme - Pléiade Euro Balanced
(anciennement Actions "Privatinvestor")
PLEIADE
INFORMATIONS GENERALES / GENERAL INFORMATION (suite) / (continued)
12
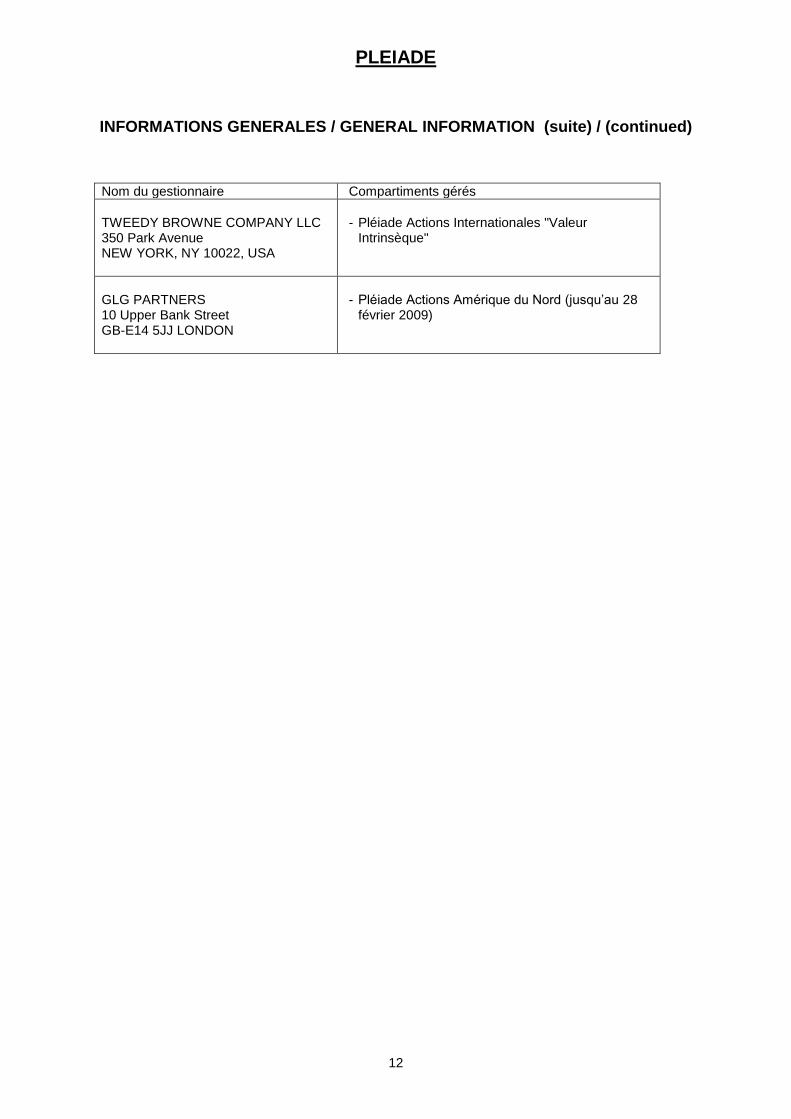
Nom du gestionnaire Compartiments gérés
TWEEDY BROWNE COMPANY LLC 350 Park Avenue NEW YORK, NY 10022, USA
- Pléiade Actions Internationales "Valeur
Intrinsèque"
GLG PARTNERS 10 Upper Bank Street GB-E14 5JJ LONDON
- Pléiade Actions Amérique du Nord (jusqu‟au 28
février 2009)
PLEIADE
INFORMATIONS GENERALES / GENERAL INFORMATION (suite) / (continued)
13
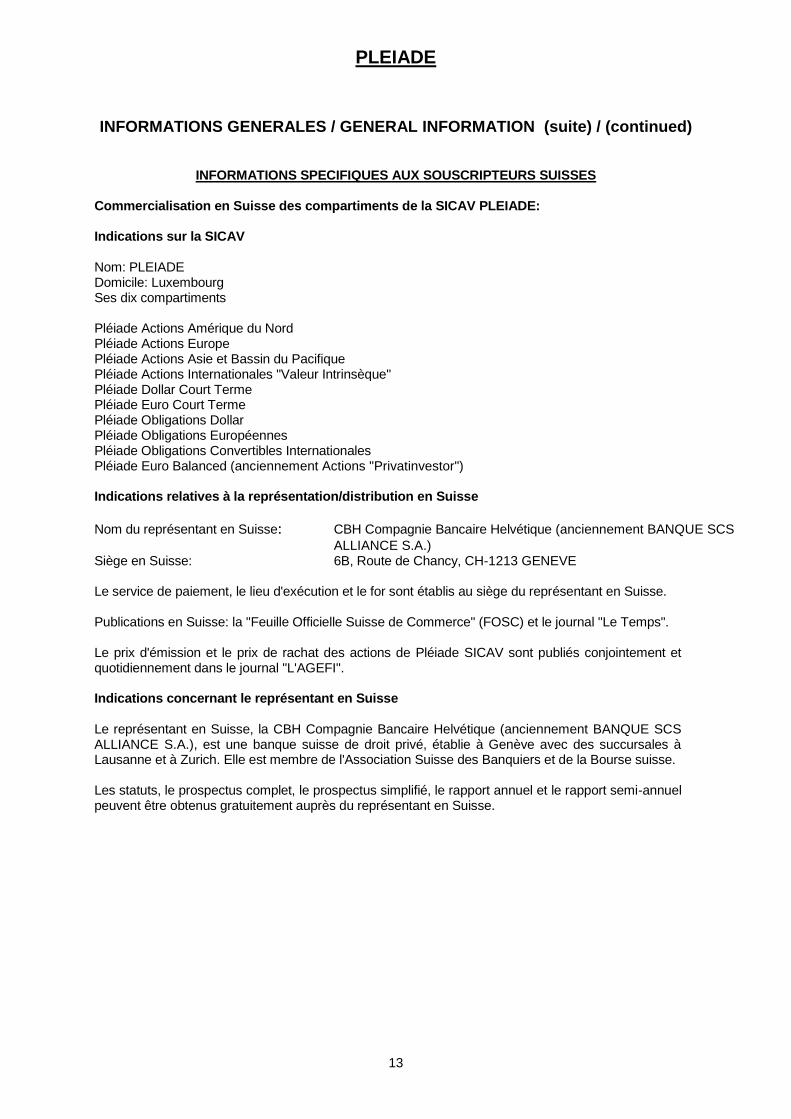
INFORMATIONS SPECIFIQUES AUX SOUSCRIPTEURS SUISSES Commercialisation en Suisse des compartiments de la SICAV PLEIADE: Indications sur la SICAV Nom: PLEIADE Domicile: Luxembourg Ses dix compartiments Pléiade Actions Amérique du Nord Pléiade Actions Europe Pléiade Actions Asie et Bassin du Pacifique Pléiade Actions Internationales "Valeur Intrinsèque" Pléiade Dollar Court Terme Pléiade Euro Court Terme Pléiade Obligations Dollar Pléiade Obligations Européennes Pléiade Obligations Convertibles Internationales Pléiade Euro Balanced (anciennement Actions "Privatinvestor") Indications relatives à la représentation/distribution en Suisse
Nom du représentant en Suisse: CBH Compagnie Bancaire Helvétique (anciennement BANQUE SCS
ALLIANCE S.A.) Siège en Suisse: 6B, Route de Chancy, CH-1213 GENEVE Le service de paiement, le lieu d'exécution et le for sont établis au siège du représentant en Suisse. Publications en Suisse: la "Feuille Officielle Suisse de Commerce" (FOSC) et le journal "Le Temps". Le prix d'émission et le prix de rachat des actions de Pléiade SICAV sont publiés conjointement et quotidiennement dans le journal "L'AGEFI". Indications concernant le représentant en Suisse Le représentant en Suisse, la CBH Compagnie Bancaire Helvétique (anciennement BANQUE SCS ALLIANCE S.A.), est une banque suisse de droit privé, établie à Genève avec des succursales à Lausanne et à Zurich. Elle est membre de l'Association Suisse des Banquiers et de la Bourse suisse. Les statuts, le prospectus complet, le prospectus simplifié, le rapport annuel et le rapport semi-annuel peuvent être obtenus gratuitement auprès du représentant en Suisse.
PLEIADE
INFORMATIONS GENERALES / GENERAL INFORMATION (suite) / (continued)
14
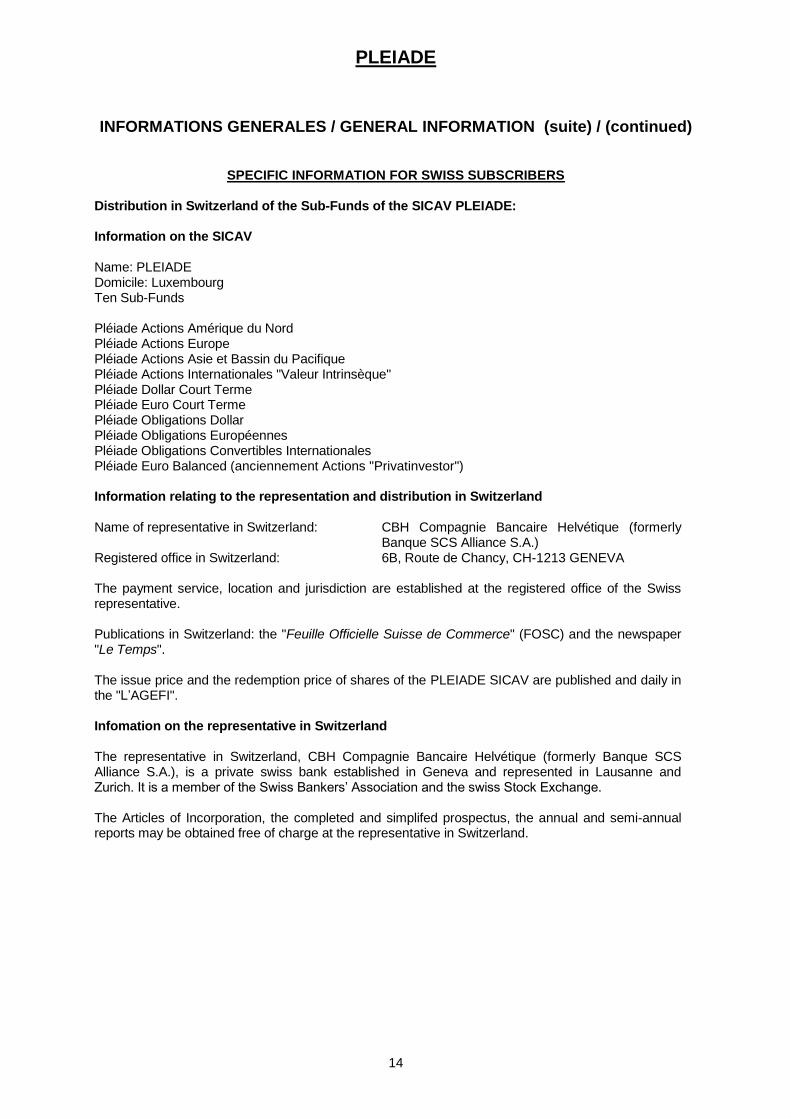
SPECIFIC INFORMATION FOR SWISS SUBSCRIBERS Distribution in Switzerland of the Sub-Funds of the SICAV PLEIADE: Information on the SICAV Name: PLEIADE Domicile: Luxembourg Ten Sub-Funds Pléiade Actions Amérique du Nord Pléiade Actions Europe Pléiade Actions Asie et Bassin du Pacifique Pléiade Actions Internationales "Valeur Intrinsèque" Pléiade Dollar Court Terme Pléiade Euro Court Terme Pléiade Obligations Dollar Pléiade Obligations Européennes Pléiade Obligations Convertibles Internationales Pléiade Euro Balanced (anciennement Actions "Privatinvestor") Information relating to the representation and distribution in Switzerland Name of representative in Switzerland: CBH Compagnie Bancaire Helvétique (formerly
Banque SCS Alliance S.A.) Registered office in Switzerland: 6B, Route de Chancy, CH-1213 GENEVA The payment service, location and jurisdiction are established at the registered office of the Swiss representative. Publications in Switzerland: the "Feuille Officielle Suisse de Commerce" (FOSC) and the newspaper "Le Temps". The issue price and the redemption price of shares of the PLEIADE SICAV are published and daily in the "L‟AGEFI". Infomation on the representative in Switzerland The representative in Switzerland, CBH Compagnie Bancaire Helvétique (formerly Banque SCS Alliance S.A.), is a private swiss bank established in Geneva and represented in Lausanne and Zurich. It is a member of the Swiss Bankers‟ Association and the swiss Stock Exchange. The Articles of Incorporation, the completed and simplifed prospectus, the annual and semi-annual reports may be obtained free of charge at the representative in Switzerland.
PLEIADE
INFORMATIONS GENERALES / GENERAL INFORMATION (suite) / (continued)
15
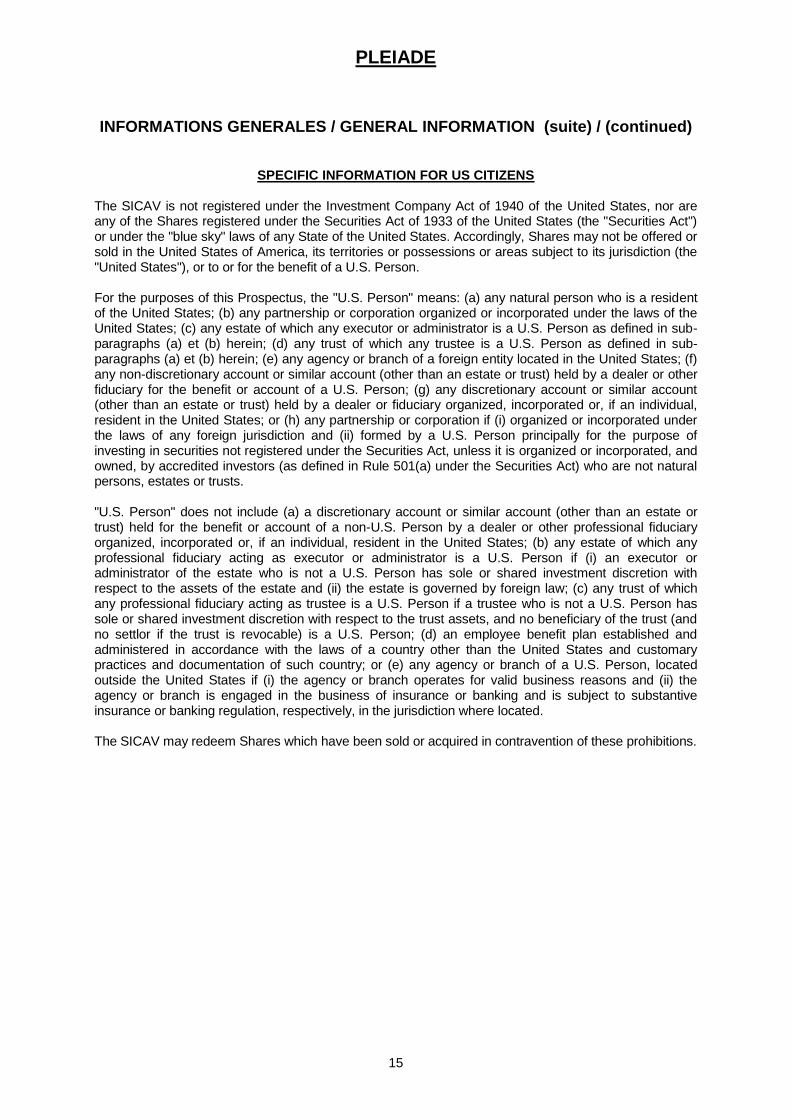
SPECIFIC INFORMATION FOR US CITIZENS The SICAV is not registered under the Investment Company Act of 1940 of the United States, nor are any of the Shares registered under the Securities Act of 1933 of the United States (the "Securities Act") or under the "blue sky" laws of any State of the United States. Accordingly, Shares may not be offered or sold in the United States of America, its territories or possessions or areas subject to its jurisdiction (the "United States"), or to or for the benefit of a U.S. Person. For the purposes of this Prospectus, the "U.S. Person" means: (a) any natural person who is a resident of the United States; (b) any partnership or corporation organized or incorporated under the laws of the United States; (c) any estate of which any executor or administrator is a U.S. Person as defined in sub-paragraphs (a) et (b) herein; (d) any trust of which any trustee is a U.S. Person as defined in sub-paragraphs (a) et (b) herein; (e) any agency or branch of a foreign entity located in the United States; (f) any non-discretionary account or similar account (other than an estate or trust) held by a dealer or other fiduciary for the benefit or account of a U.S. Person; (g) any discretionary account or similar account (other than an estate or trust) held by a dealer or fiduciary organized, incorporated or, if an individual, resident in the United States; or (h) any partnership or corporation if (i) organized or incorporated under the laws of any foreign jurisdiction and (ii) formed by a U.S. Person principally for the purpose of investing in securities not registered under the Securities Act, unless it is organized or incorporated, and owned, by accredited investors (as defined in Rule 501(a) under the Securities Act) who are not natural persons, estates or trusts. "U.S. Person" does not include (a) a discretionary account or similar account (other than an estate or trust) held for the benefit or account of a non-U.S. Person by a dealer or other professional fiduciary organized, incorporated or, if an individual, resident in the United States; (b) any estate of which any professional fiduciary acting as executor or administrator is a U.S. Person if (i) an executor or administrator of the estate who is not a U.S. Person has sole or shared investment discretion with respect to the assets of the estate and (ii) the estate is governed by foreign law; (c) any trust of which any professional fiduciary acting as trustee is a U.S. Person if a trustee who is not a U.S. Person has sole or shared investment discretion with respect to the trust assets, and no beneficiary of the trust (and no settlor if the trust is revocable) is a U.S. Person; (d) an employee benefit plan established and administered in accordance with the laws of a country other than the United States and customary practices and documentation of such country; or (e) any agency or branch of a U.S. Person, located outside the United States if (i) the agency or branch operates for valid business reasons and (ii) the agency or branch is engaged in the business of insurance or banking and is subject to substantive insurance or banking regulation, respectively, in the jurisdiction where located. The SICAV may redeem Shares which have been sold or acquired in contravention of these prohibitions.
PLEIADE
16
RAPPORT DU CONSEIL D'ADMINISTRATION / REPORT OF THE BOARD OF DIRECTORS
Cher actionnaire, La fortune de la Pléiade SICAV s‟est établi au 30 septembre 2009 à USD 145,119 mio contre USD 133,553 mio une année auparavant, soit une augmentation de 8,66 %.Cette année l‟augmentation de la fortune de la SICAV se reparti de façon suivante : - résultat des opérations USD 3.113.385,48 - écart de réévaluation (différence due aux cours de change) USD 3.924.940,26 - collecte nette (différence entre les souscriptions et les rachats) USD 4.527.649,90 - Total USD 11.565.975,64 L‟année financière du fonds est coupée en deux phases bien distinctes. Le dernier trimestre 2008 et le premier trimestre 2009 étaient dominés par la crise financière créé par le système de crédit américaine (subprime mortgages, faillite Lehman). Cette période était accompagnée de faibles performances des fonds et des remboursements des parts. En mars 2009 ce scénario a complètement changé. L‟espoir d‟une reprise conjoncturelle a relancé les marchés et les fonds ont reçu des souscriptions avec un succès particulier pour le compartiment Pléiade EURO Balanced. Les commissions de gestion des 10 compartiments se sont élevées à USD 1,102 mios, les autres charges s‟élevaient à USD 1,382 mios. Aucune commission de performance n‟a été prélevée pour l‟exercice 2008/09. Les répartitions des avoirs dans les différents compartiments a substantiellement changé pendant l‟année d‟exercice. Ainsi le compartiment Pléiade EURO Balanced (ancien Pléiade Actions "Privatinvestor") a grandi de EUR 0,218 mio à 14,917 mio. Les autres compartiments ont eu des sorts plus variés avec une diminution nette des actifs. Les événements importants de l‟année 2008/09 : - Transformation de Pléiade Actions "Privatinvestor" en Pléiade EURO Balanced - Changement du gestionnaire Pléiade Actions Amérique du Nord de GLG Partners, Londres à la - CBH Compagnie Bancaire Helvétique (anciennement Banque SCS Alliance), Genève. - Changement de siège social, d‟administration centrale et de banque dépositaire de la SICAV de
BGL, Luxembourg à BDL, Luxembourg. Pour conclure, le présent rapport nous donne l‟occasion de remercier l‟ensemble des actionnaires pour leur fidèle soutien. Luxembourg, 26 novembre 2009 Le Conseil d'Administration Note: Les informations de ce rapport sont données à titre historique et ne sont pas indicatives des résultats futurs.
PLEIADE
RAPPORT DE GESTION / MANAGER’S REPORT (suite) / (continued)
17
Dear Shareholders, As of 30th September, the net assets of the SICAV were USD 145.119 millions versus US 133.553 millions one year before. This represents an increase of 8.66%. For the period under review, the increase in assets was spread as follows: - Result of operations USD 3‟113‟385.48 - Revaluation difference (difference due to exchange rates) USD 3‟924‟940.26 - Net collection (difference between subscriptions and redemptions) USD 4‟527‟649.90 - Total USD 11'565'975.64 The financial year of the fund was cut into two easily distinguable periods. The last quarter of 2008 and the first quarter 2009 were dominated by the financial crisis of the American financial system in the aftermath of the Lehman Brothers collapse and the subprime mortgage crisis. Our funds performed poorly over this period and were facing redemptions. In March 2009 the whole scenario changed completely. The hope of an economic recovery put markets back on a bullish track and our funds received net subscriptions again with a particular success for the Pléiade EURO Balanced compartment. The management fees generated by the 10 compartments amounted to a total of USD 1.102 mil., whereas other operating expenses amounted to USD 1.382 mil. No performance fee was generated in this financial year. Investor‟s allocation to the different compartments has changed substantially over the period of exercise. The compartment Pléiade EURO Balanced (former Pléiade Actions "Privatinvestor") increased from initially EUR 0.218 mil. to EUR 14.917 mil. The other compartments reported diverging trend with an overall net reduction of assets under management. Important events for the SICAV in 2008/09:
- Transformation of Pléiade Actions "Privatinvestor" in Pléiade EURO Balanced - Change of the manager of Pléiade Actions Amérique du Nord from GLG Partners, London to
CBH Compagnie Bancaire Helvétique (formerly Banque SCS Alliance S.A.), Genève. - Change of the registred office, administrative agent and custodian bank of the SICAV from
BGL, Luxemburg to BDL, Luxemburg.
To conclude, the present report gives us the opportunity to thank all the shareholders for their trust
and support.
Luxembourg, 26th November 2009 The Board of Directors Note: The information in this report represents historical data and is not an indication of future results.
PLEIADE
18
RAPPORT DE GESTION / MANAGER’S REPORT
II. EVOLUTION II - 1 COMPARTIMENTS ACTIONS
Rétrospective La période de 12 mois entre octobre 2008 et septembre 2009 a été exceptionnelle à plusieurs titres pour le système bancaire, les marchés financiers et l‟économie mondiale. - Depuis le début du mois d‟octobre de l‟année passée, le Dow Jones par exemple a baissé de 11.000 à 6.500 points, c‟est-à-dire de -40 %. Cet effondrement des actions s‟est produit en deux temps. La première phase de 11.000 à 8.500 points a été déclenchée par la faillite de la banque d‟investissement Lehman Brothers. La seconde phase a été le résultat des peurs concernant le système bancaire et sa capacité à survivre à un effondrement structurel, suite au gel du marché mondial interbancaire des liquidités. Suite à cette interruption soudaine des marchés, le Dow Jones a baissé de 8.500 à 6.500 points en mars 2009, l‟écart entre les obligations à haut rendement et celles du Trésor s‟est agrandi de 600 points de base à 2000 et l‟Euro bondi de 1,24$ à 1,47$ fin décembre 2008. Pendant cette période de stress intense, les obligations gouvernementales ont bénéficié de l‟effet de refuge et le rendement du 10 ans des obligations du Trésor américain est tombé de 4 % en octobre à 2,05 % en décembre, ce qui constitue un des plus bas niveaux de leur histoire. - Pendant la période des 12 mois, plusieurs économies dans le monde, en particulier les plus grandes, sont entrées en récession. Les grandes économies comme les Etats-Unis ont décru de 5,6 % au troisième trimestre de 2008, 6,4 % au premier trimestre de 2009, 0,9 % au second trimestre sont finalement sortis en territoire positif au troisième trimestre de 2009 (+3,5 %). Le pétrole, qui mesure l‟activité économique dans le monde entier est tombé de 100$ le baril en septembre 2008 à 46$ en février 2009 pour remonter à 67$ en septembre 2009. L„or, qui se traitait à 900$ l‟once avant la faillite de Lehman, n‟a pas initialement bénéficié de la crise puisqu‟il est tombé à 700$ l‟once un mois plus tard et n‟a commencé à remonter qu‟ensuite pour atteindre 1.000$ l‟once à la fin du mois de septembre 2009. Les politiques des gouvernements, qui ont été mises en place à la suite du crash, ont été exceptionnelles à plusieurs titres. Du coté monétaire, les taux d‟intérêt ont été réduis à des niveaux historiquement bas et dans le même temps les Etats-Unis, le Japon, l‟Europe et la Grande Bretagne ont mis en place des mesures quantitatives de facilités monétaires afin de mettre à disposition des marchés financiers mondiaux d‟abondantes liquidité. Du coté des politiques fiscales, des mesures de déficit budgétaire ont été initiées de manière à stimuler l‟économie mondiale avec des financements stupéfiants, qui ont atteint plusieurs milliers de milliards de dollars. Plus spécifiquement, le Groupe des 20 a engagé douze mille milliards de dollars de financement public, ce qui est l‟équivalent d‟un cinquième de la production annuelle de l‟économie mondiale. L‟économie chinoise comme la plus part des économies émergeantes ont mieux résisté pendant la crise et ont évité la récession. Mais leurs marchés financiers ont exagéré la baisse subie par les bourses des pays du G7, les marchés d‟actions de Shanghai, de la Russie et du Brésil perdant plus de 70 % en ce qui concerne les deux premiers et près de 60 % pour le dernier, la plus part avant de notre période sous revue, c‟est-à-dire en septembre 2008. La période entre octobre 2008 et octobre 2009 a souvent été comparée aux événements qui se sont déroulés au début des années 30, pendant laquelle les bourses se sont effondrées et l‟économie mondiale est tombée en dépression. A cette époque, la Fed n‟a pas soutenu les marchés d‟actions comme elle l‟a fait aujourd‟hui en réduisant les taux d‟intérêt et en injectant des liquidités au travers de la monétisation des dettes des compagnies, de même que l‟administration Hoover n‟a jamais essayé
PLEIADE
RAPPORT DE GESTION / MANAGER’S REPORT (suite) / (continued)
19
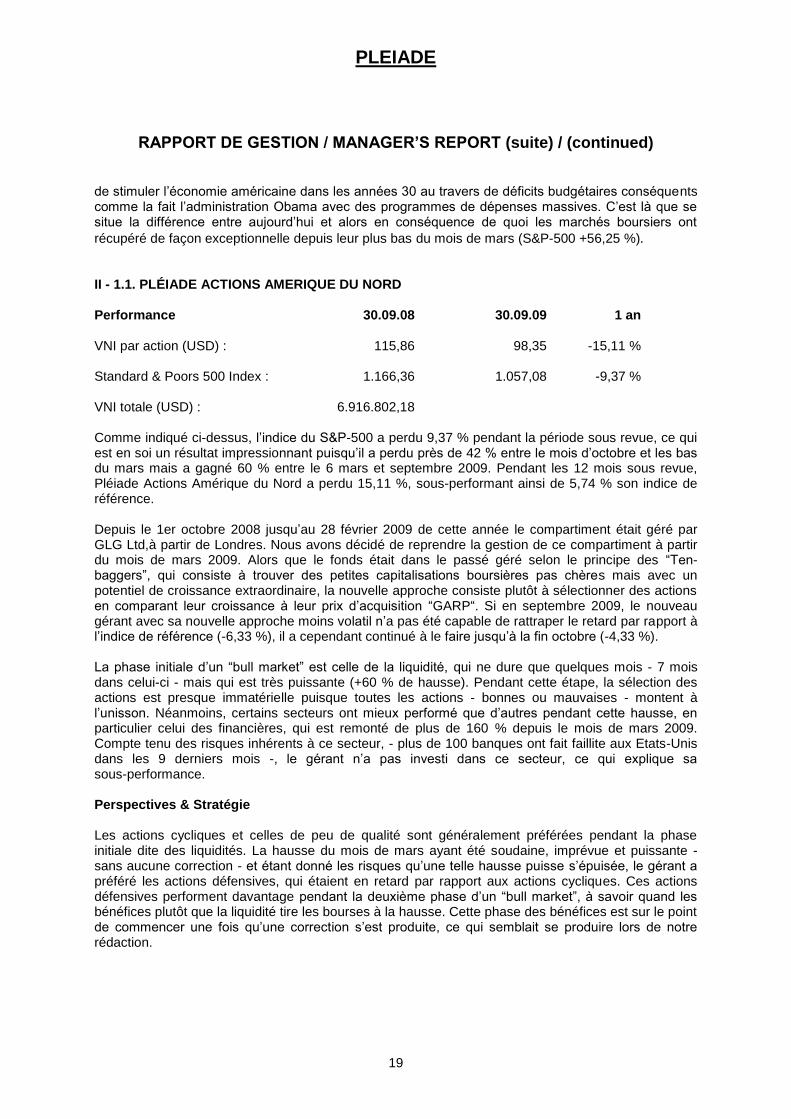
de stimuler l‟économie américaine dans les années 30 au travers de déficits budgétaires conséquents comme la fait l‟administration Obama avec des programmes de dépenses massives. C‟est là que se situe la différence entre aujourd‟hui et alors en conséquence de quoi les marchés boursiers ont
récupéré de façon exceptionnelle depuis leur plus bas du mois de mars (S&P-500 +56,25 %). II - 1.1. PLÉIADE ACTIONS AMERIQUE DU NORD Performance 30.09.08 30.09.09 1 an VNI par action (USD) : 115,86 98,35 -15,11 % Standard & Poors 500 Index : 1.166,36 1.057,08 -9,37 % VNI totale (USD) : 6.916.802,18 Comme indiqué ci-dessus, l‟indice du S&P-500 a perdu 9,37 % pendant la période sous revue, ce qui est en soi un résultat impressionnant puisqu‟il a perdu près de 42 % entre le mois d‟octobre et les bas du mars mais a gagné 60 % entre le 6 mars et septembre 2009. Pendant les 12 mois sous revue, Pléiade Actions Amérique du Nord a perdu 15,11 %, sous-performant ainsi de 5,74 % son indice de référence. Depuis le 1er octobre 2008 jusqu‟au 28 février 2009 de cette année le compartiment était géré par GLG Ltd,à partir de Londres. Nous avons décidé de reprendre la gestion de ce compartiment à partir du mois de mars 2009. Alors que le fonds était dans le passé géré selon le principe des “Ten-baggers”, qui consiste à trouver des petites capitalisations boursières pas chères mais avec un potentiel de croissance extraordinaire, la nouvelle approche consiste plutôt à sélectionner des actions en comparant leur croissance à leur prix d‟acquisition “GARP“. Si en septembre 2009, le nouveau gérant avec sa nouvelle approche moins volatil n‟a pas été capable de rattraper le retard par rapport à l‟indice de référence (-6,33 %), il a cependant continué à le faire jusqu‟à la fin octobre (-4,33 %). La phase initiale d‟un “bull market” est celle de la liquidité, qui ne dure que quelques mois - 7 mois dans celui-ci - mais qui est très puissante (+60 % de hausse). Pendant cette étape, la sélection des actions est presque immatérielle puisque toutes les actions - bonnes ou mauvaises - montent à l‟unisson. Néanmoins, certains secteurs ont mieux performé que d‟autres pendant cette hausse, en particulier celui des financières, qui est remonté de plus de 160 % depuis le mois de mars 2009. Compte tenu des risques inhérents à ce secteur, - plus de 100 banques ont fait faillite aux Etats-Unis dans les 9 derniers mois -, le gérant n‟a pas investi dans ce secteur, ce qui explique sa sous-performance. Perspectives & Stratégie Les actions cycliques et celles de peu de qualité sont généralement préférées pendant la phase initiale dite des liquidités. La hausse du mois de mars ayant été soudaine, imprévue et puissante - sans aucune correction - et étant donné les risques qu‟une telle hausse puisse s‟épuisée, le gérant a préféré les actions défensives, qui étaient en retard par rapport aux actions cycliques. Ces actions défensives performent davantage pendant la deuxième phase d‟un “bull market”, à savoir quand les bénéfices plutôt que la liquidité tire les bourses à la hausse. Cette phase des bénéfices est sur le point de commencer une fois qu‟une correction s‟est produite, ce qui semblait se produire lors de notre rédaction.
PLEIADE
RAPPORT DE GESTION / MANAGER’S REPORT (suite) / (continued)
20
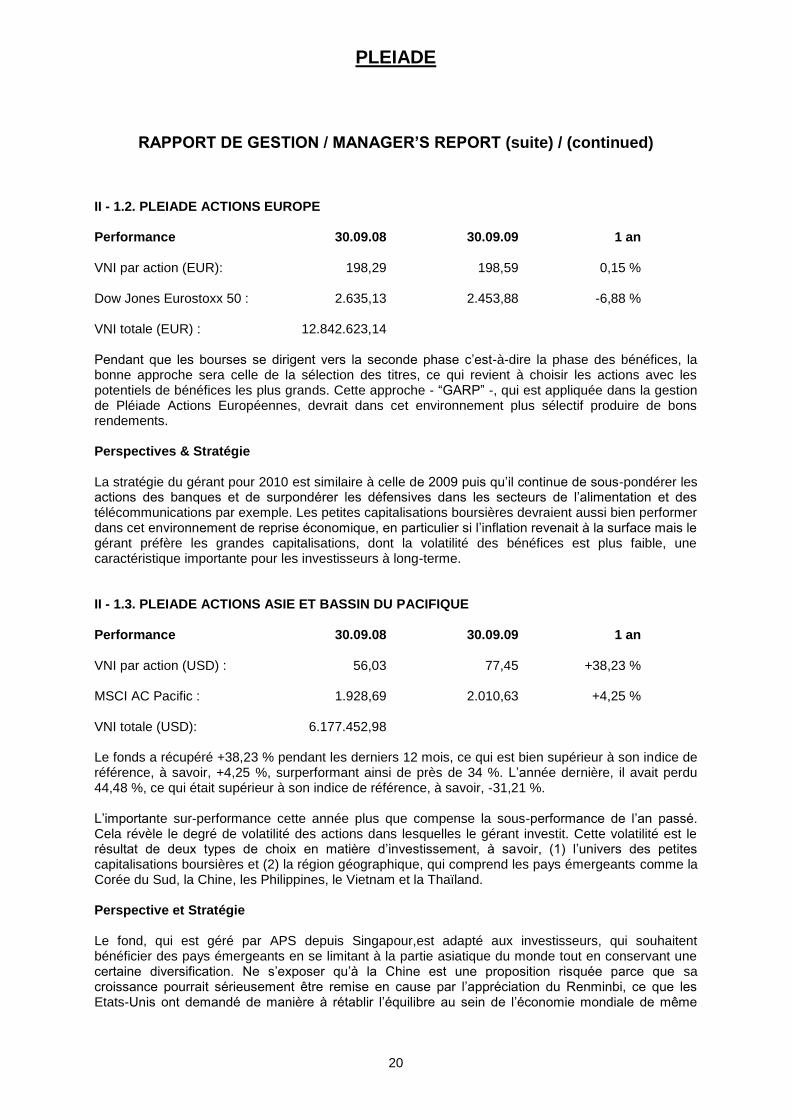
II - 1.2. PLEIADE ACTIONS EUROPE Performance 30.09.08 30.09.09 1 an VNI par action (EUR): 198,29 198,59 0,15 % Dow Jones Eurostoxx 50 : 2.635,13 2.453,88 -6,88 % VNI totale (EUR) : 12.842.623,14 Pendant que les bourses se dirigent vers la seconde phase c‟est-à-dire la phase des bénéfices, la bonne approche sera celle de la sélection des titres, ce qui revient à choisir les actions avec les potentiels de bénéfices les plus grands. Cette approche - “GARP” -, qui est appliquée dans la gestion de Pléiade Actions Européennes, devrait dans cet environnement plus sélectif produire de bons rendements. Perspectives & Stratégie La stratégie du gérant pour 2010 est similaire à celle de 2009 puis qu‟il continue de sous-pondérer les actions des banques et de surpondérer les défensives dans les secteurs de l‟alimentation et des télécommunications par exemple. Les petites capitalisations boursières devraient aussi bien performer dans cet environnement de reprise économique, en particulier si l‟inflation revenait à la surface mais le gérant préfère les grandes capitalisations, dont la volatilité des bénéfices est plus faible, une caractéristique importante pour les investisseurs à long-terme. II - 1.3. PLEIADE ACTIONS ASIE ET BASSIN DU PACIFIQUE Performance 30.09.08 30.09.09 1 an VNI par action (USD) : 56,03 77,45 +38,23 % MSCI AC Pacific : 1.928,69 2.010,63 +4,25 % VNI totale (USD): 6.177.452,98 Le fonds a récupéré +38,23 % pendant les derniers 12 mois, ce qui est bien supérieur à son indice de référence, à savoir, +4,25 %, surperformant ainsi de près de 34 %. L‟année dernière, il avait perdu 44,48 %, ce qui était supérieur à son indice de référence, à savoir, -31,21 %. L‟importante sur-performance cette année plus que compense la sous-performance de l‟an passé. Cela révèle le degré de volatilité des actions dans lesquelles le gérant investit. Cette volatilité est le résultat de deux types de choix en matière d‟investissement, à savoir, (1) l‟univers des petites capitalisations boursières et (2) la région géographique, qui comprend les pays émergeants comme la Corée du Sud, la Chine, les Philippines, le Vietnam et la Thaïland. Perspective et Stratégie Le fond, qui est géré par APS depuis Singapour,est adapté aux investisseurs, qui souhaitent bénéficier des pays émergeants en se limitant à la partie asiatique du monde tout en conservant une certaine diversification. Ne s‟exposer qu‟à la Chine est une proposition risquée parce que sa croissance pourrait sérieusement être remise en cause par l‟appréciation du Renminbi, ce que les Etats-Unis ont demandé de manière à rétablir l‟équilibre au sein de l‟économie mondiale de même
PLEIADE
RAPPORT DE GESTION / MANAGER’S REPORT (suite) / (continued)
21
qu‟un nouveau programme de relance pour stimuler à nouveau l‟économie chinoise. Pléiade Actions Asie et Bassin Pacifique devrait être capable de produire de meilleurs rendements au travers de sa sélection de titres en petites capitalisations dans toute la région (plus de diversification et moins de risque). Mais l‟investissement dans un fond aussi volatile exige une discipline d‟investissement et l‟engagement de rester investi pour une longue période, peut-être même une décennie.
II - 1.4. PLEIADE ACTIONS INTERNATIONALES "VALEUR INTRINSEQUE"
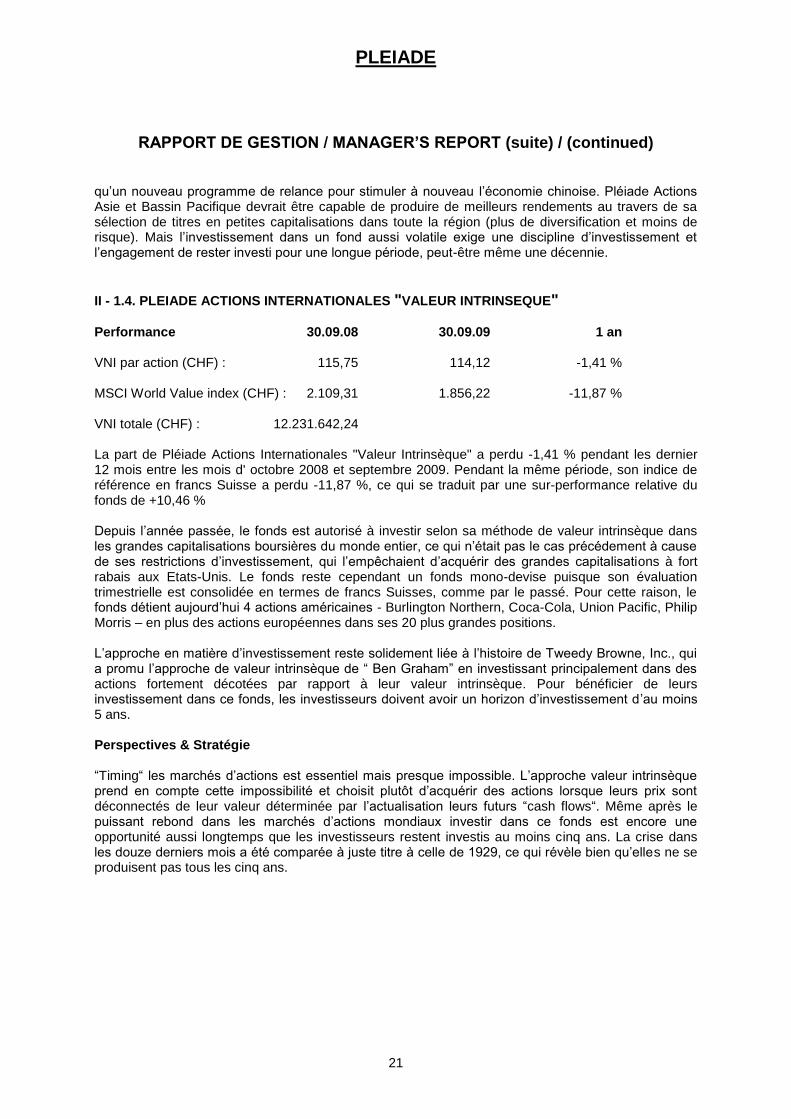
Performance 30.09.08 30.09.09 1 an VNI par action (CHF) : 115,75 114,12 -1,41 % MSCI World Value index (CHF) : 2.109,31 1.856,22 -11,87 % VNI totale (CHF) : 12.231.642,24 La part de Pléiade Actions Internationales "Valeur Intrinsèque" a perdu -1,41 % pendant les dernier 12 mois entre les mois d' octobre 2008 et septembre 2009. Pendant la même période, son indice de référence en francs Suisse a perdu -11,87 %, ce qui se traduit par une sur-performance relative du fonds de +10,46 % Depuis l‟année passée, le fonds est autorisé à investir selon sa méthode de valeur intrinsèque dans les grandes capitalisations boursières du monde entier, ce qui n‟était pas le cas précédement à cause de ses restrictions d‟investissement, qui l‟empêchaient d‟acquérir des grandes capitalisations à fort rabais aux Etats-Unis. Le fonds reste cependant un fonds mono-devise puisque son évaluation trimestrielle est consolidée en termes de francs Suisses, comme par le passé. Pour cette raison, le fonds détient aujourd‟hui 4 actions américaines - Burlington Northern, Coca-Cola, Union Pacific, Philip Morris – en plus des actions européennes dans ses 20 plus grandes positions. L‟approche en matière d‟investissement reste solidement liée à l‟histoire de Tweedy Browne, Inc., qui a promu l‟approche de valeur intrinsèque de “ Ben Graham” en investissant principalement dans des actions fortement décotées par rapport à leur valeur intrinsèque. Pour bénéficier de leurs investissement dans ce fonds, les investisseurs doivent avoir un horizon d‟investissement d‟au moins 5 ans. Perspectives & Stratégie “Timing“ les marchés d‟actions est essentiel mais presque impossible. L‟approche valeur intrinsèque prend en compte cette impossibilité et choisit plutôt d‟acquérir des actions lorsque leurs prix sont déconnectés de leur valeur déterminée par l‟actualisation leurs futurs “cash flows“. Même après le puissant rebond dans les marchés d‟actions mondiaux investir dans ce fonds est encore une opportunité aussi longtemps que les investisseurs restent investis au moins cinq ans. La crise dans les douze derniers mois a été comparée à juste titre à celle de 1929, ce qui révèle bien qu‟elles ne se produisent pas tous les cinq ans.
PLEIADE
RAPPORT DE GESTION / MANAGER’S REPORT (suite) / (continued)
22
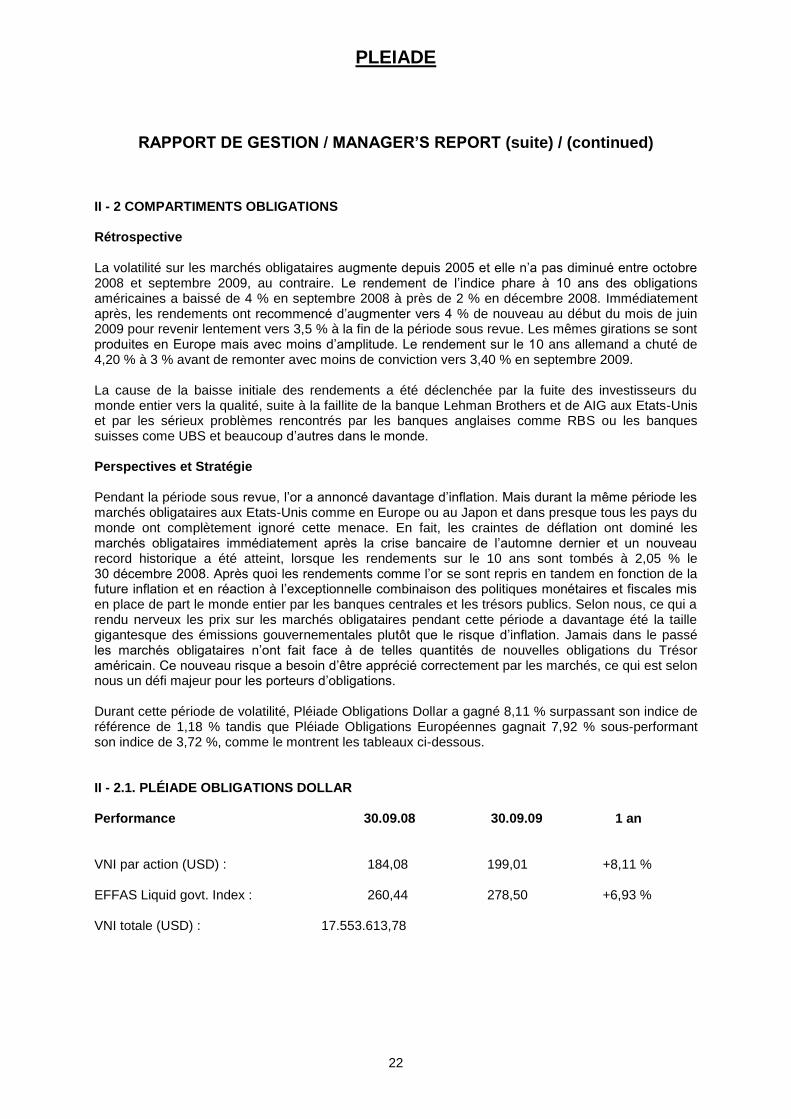
II - 2 COMPARTIMENTS OBLIGATIONS Rétrospective La volatilité sur les marchés obligataires augmente depuis 2005 et elle n‟a pas diminué entre octobre 2008 et septembre 2009, au contraire. Le rendement de l‟indice phare à 10 ans des obligations américaines a baissé de 4 % en septembre 2008 à près de 2 % en décembre 2008. Immédiatement après, les rendements ont recommencé d‟augmenter vers 4 % de nouveau au début du mois de juin 2009 pour revenir lentement vers 3,5 % à la fin de la période sous revue. Les mêmes girations se sont produites en Europe mais avec moins d‟amplitude. Le rendement sur le 10 ans allemand a chuté de 4,20 % à 3 % avant de remonter avec moins de conviction vers 3,40 % en septembre 2009. La cause de la baisse initiale des rendements a été déclenchée par la fuite des investisseurs du monde entier vers la qualité, suite à la faillite de la banque Lehman Brothers et de AIG aux Etats-Unis et par les sérieux problèmes rencontrés par les banques anglaises comme RBS ou les banques suisses come UBS et beaucoup d‟autres dans le monde. Perspectives et Stratégie Pendant la période sous revue, l‟or a annoncé davantage d‟inflation. Mais durant la même période les marchés obligataires aux Etats-Unis comme en Europe ou au Japon et dans presque tous les pays du monde ont complètement ignoré cette menace. En fait, les craintes de déflation ont dominé les marchés obligataires immédiatement après la crise bancaire de l‟automne dernier et un nouveau record historique a été atteint, lorsque les rendements sur le 10 ans sont tombés à 2,05 % le 30 décembre 2008. Après quoi les rendements comme l‟or se sont repris en tandem en fonction de la future inflation et en réaction à l‟exceptionnelle combinaison des politiques monétaires et fiscales mis en place de part le monde entier par les banques centrales et les trésors publics. Selon nous, ce qui a rendu nerveux les prix sur les marchés obligataires pendant cette période a davantage été la taille gigantesque des émissions gouvernementales plutôt que le risque d‟inflation. Jamais dans le passé les marchés obligataires n‟ont fait face à de telles quantités de nouvelles obligations du Trésor américain. Ce nouveau risque a besoin d‟être apprécié correctement par les marchés, ce qui est selon nous un défi majeur pour les porteurs d‟obligations. Durant cette période de volatilité, Pléiade Obligations Dollar a gagné 8,11 % surpassant son indice de référence de 1,18 % tandis que Pléiade Obligations Européennes gagnait 7,92 % sous-performant son indice de 3,72 %, comme le montrent les tableaux ci-dessous. II - 2.1. PLÉIADE OBLIGATIONS DOLLAR Performance 30.09.08 30.09.09 1 an VNI par action (USD) : 184,08 199,01 +8,11 % EFFAS Liquid govt. Index : 260,44 278,50 +6,93 % VNI totale (USD) : 17.553.613,78
PLEIADE
RAPPORT DE GESTION / MANAGER’S REPORT (suite) / (continued)
23
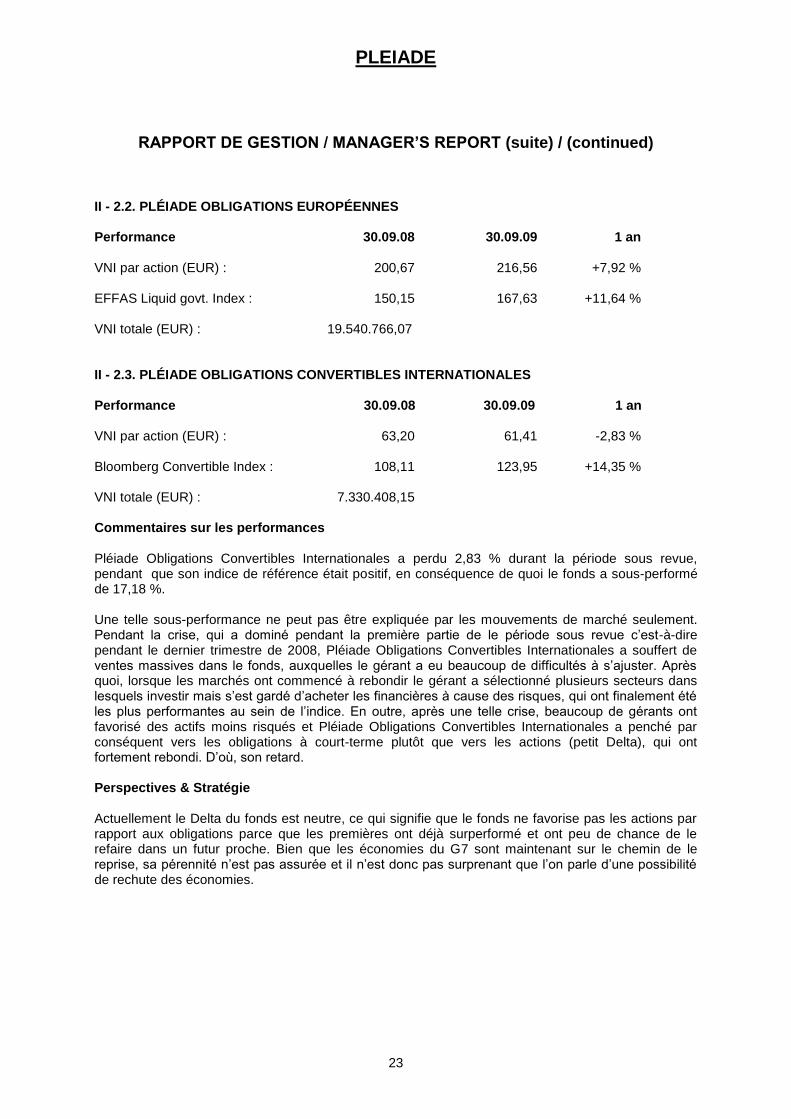
II - 2.2. PLÉIADE OBLIGATIONS EUROPÉENNES Performance 30.09.08 30.09.09 1 an VNI par action (EUR) : 200,67 216,56 +7,92 % EFFAS Liquid govt. Index : 150,15 167,63 +11,64 % VNI totale (EUR) : 19.540.766,07 II - 2.3. PLÉIADE OBLIGATIONS CONVERTIBLES INTERNATIONALES Performance 30.09.08 30.09.09 1 an VNI par action (EUR) : 63,20 61,41 -2,83 % Bloomberg Convertible Index : 108,11 123,95 +14,35 % VNI totale (EUR) : 7.330.408,15 Commentaires sur les performances Pléiade Obligations Convertibles Internationales a perdu 2,83 % durant la période sous revue, pendant que son indice de référence était positif, en conséquence de quoi le fonds a sous-performé de 17,18 %. Une telle sous-performance ne peut pas être expliquée par les mouvements de marché seulement. Pendant la crise, qui a dominé pendant la première partie de le période sous revue c‟est-à-dire pendant le dernier trimestre de 2008, Pléiade Obligations Convertibles Internationales a souffert de ventes massives dans le fonds, auxquelles le gérant a eu beaucoup de difficultés à s‟ajuster. Après quoi, lorsque les marchés ont commencé à rebondir le gérant a sélectionné plusieurs secteurs dans lesquels investir mais s‟est gardé d‟acheter les financières à cause des risques, qui ont finalement été les plus performantes au sein de l‟indice. En outre, après une telle crise, beaucoup de gérants ont favorisé des actifs moins risqués et Pléiade Obligations Convertibles Internationales a penché par conséquent vers les obligations à court-terme plutôt que vers les actions (petit Delta), qui ont fortement rebondi. D‟où, son retard. Perspectives & Stratégie
Actuellement le Delta du fonds est neutre, ce qui signifie que le fonds ne favorise pas les actions par rapport aux obligations parce que les premières ont déjà surperformé et ont peu de chance de le refaire dans un futur proche. Bien que les économies du G7 sont maintenant sur le chemin de le reprise, sa pérennité n‟est pas assurée et il n‟est donc pas surprenant que l‟on parle d‟une possibilité de rechute des économies.
PLEIADE
RAPPORT DE GESTION / MANAGER’S REPORT (suite) / (continued)
24
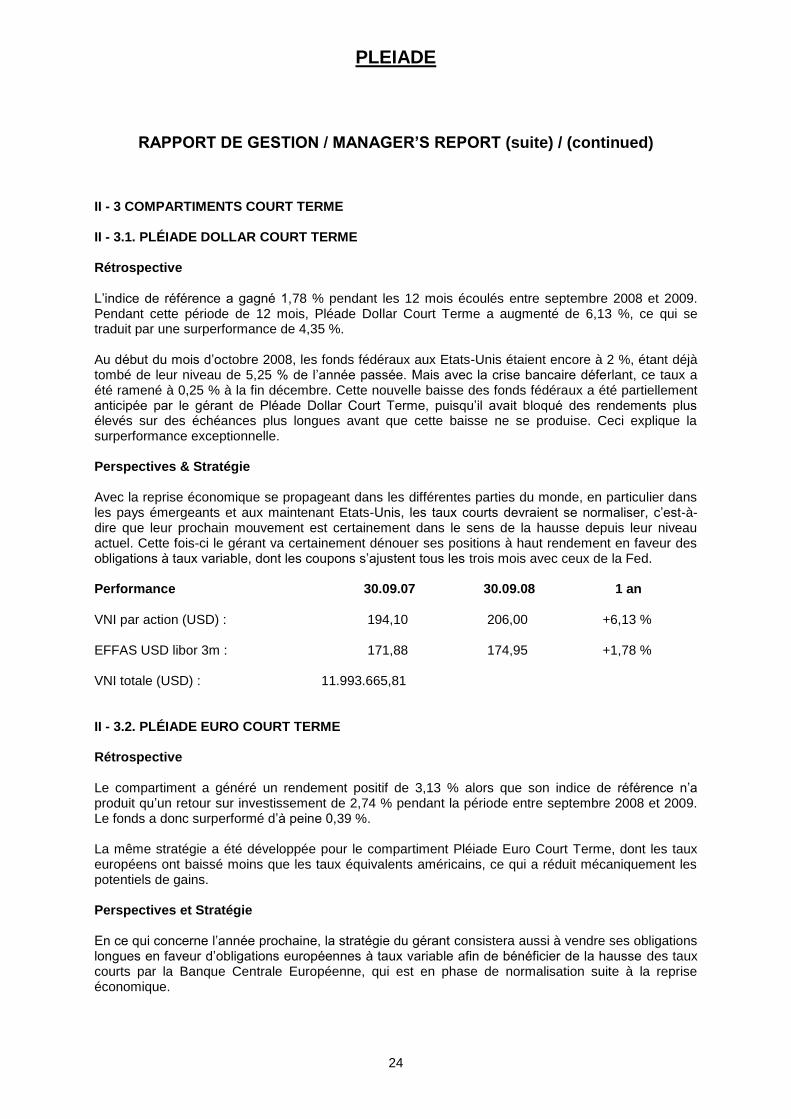
II - 3 COMPARTIMENTS COURT TERME II - 3.1. PLÉIADE DOLLAR COURT TERME Rétrospective L‟indice de référence a gagné 1,78 % pendant les 12 mois écoulés entre septembre 2008 et 2009. Pendant cette période de 12 mois, Pléade Dollar Court Terme a augmenté de 6,13 %, ce qui se traduit par une surperformance de 4,35 %. Au début du mois d‟octobre 2008, les fonds fédéraux aux Etats-Unis étaient encore à 2 %, étant déjà tombé de leur niveau de 5,25 % de l‟année passée. Mais avec la crise bancaire déferlant, ce taux a été ramené à 0,25 % à la fin décembre. Cette nouvelle baisse des fonds fédéraux a été partiellement anticipée par le gérant de Pléade Dollar Court Terme, puisqu‟il avait bloqué des rendements plus élevés sur des échéances plus longues avant que cette baisse ne se produise. Ceci explique la surperformance exceptionnelle. Perspectives & Stratégie Avec la reprise économique se propageant dans les différentes parties du monde, en particulier dans les pays émergeants et aux maintenant Etats-Unis, les taux courts devraient se normaliser, c‟est-à-dire que leur prochain mouvement est certainement dans le sens de la hausse depuis leur niveau actuel. Cette fois-ci le gérant va certainement dénouer ses positions à haut rendement en faveur des obligations à taux variable, dont les coupons s‟ajustent tous les trois mois avec ceux de la Fed. Performance 30.09.07 30.09.08 1 an VNI par action (USD) : 194,10 206,00 +6,13 % EFFAS USD libor 3m : 171,88 174,95 +1,78 % VNI totale (USD) : 11.993.665,81 II - 3.2. PLÉIADE EURO COURT TERME Rétrospective Le compartiment a généré un rendement positif de 3,13 % alors que son indice de référence n‟a produit qu‟un retour sur investissement de 2,74 % pendant la période entre septembre 2008 et 2009. Le fonds a donc surperformé d‟à peine 0,39 %. La même stratégie a été développée pour le compartiment Pléiade Euro Court Terme, dont les taux européens ont baissé moins que les taux équivalents américains, ce qui a réduit mécaniquement les potentiels de gains. Perspectives et Stratégie En ce qui concerne l‟année prochaine, la stratégie du gérant consistera aussi à vendre ses obligations longues en faveur d‟obligations européennes à taux variable afin de bénéficier de la hausse des taux courts par la Banque Centrale Européenne, qui est en phase de normalisation suite à la reprise économique.
PLEIADE
RAPPORT DE GESTION / MANAGER’S REPORT (suite) / (continued)
25
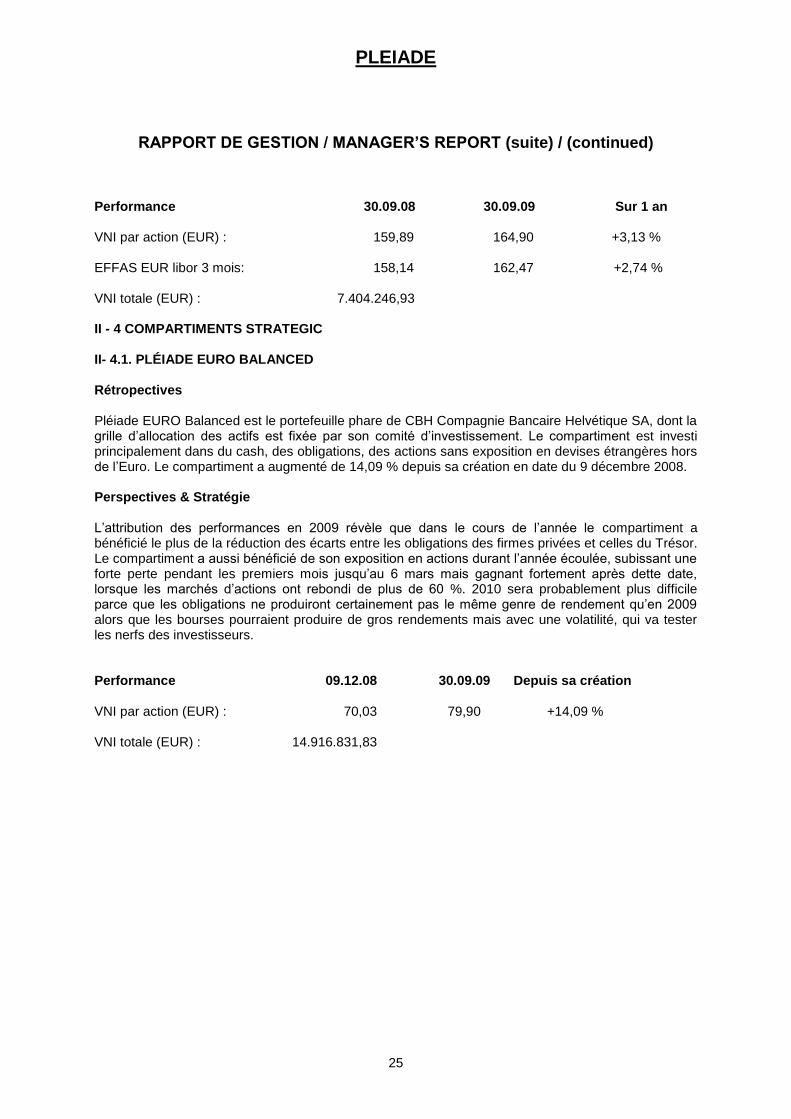
Performance 30.09.08 30.09.09 Sur 1 an VNI par action (EUR) : 159,89 164,90 +3,13 % EFFAS EUR libor 3 mois: 158,14 162,47 +2,74 % VNI totale (EUR) : 7.404.246,93 II - 4 COMPARTIMENTS STRATEGIC II- 4.1. PLÉIADE EURO BALANCED Rétropectives Pléiade EURO Balanced est le portefeuille phare de CBH Compagnie Bancaire Helvétique SA, dont la grille d‟allocation des actifs est fixée par son comité d‟investissement. Le compartiment est investi principalement dans du cash, des obligations, des actions sans exposition en devises étrangères hors de l‟Euro. Le compartiment a augmenté de 14,09 % depuis sa création en date du 9 décembre 2008. Perspectives & Stratégie L‟attribution des performances en 2009 révèle que dans le cours de l‟année le compartiment a bénéficié le plus de la réduction des écarts entre les obligations des firmes privées et celles du Trésor. Le compartiment a aussi bénéficié de son exposition en actions durant l‟année écoulée, subissant une forte perte pendant les premiers mois jusqu‟au 6 mars mais gagnant fortement après dette date, lorsque les marchés d‟actions ont rebondi de plus de 60 %. 2010 sera probablement plus difficile parce que les obligations ne produiront certainement pas le même genre de rendement qu‟en 2009 alors que les bourses pourraient produire de gros rendements mais avec une volatilité, qui va tester les nerfs des investisseurs. Performance 09.12.08 30.09.09 Depuis sa création VNI par action (EUR) : 70,03 79,90 +14,09 % VNI totale (EUR) : 14.916.831,83
PLEIADE
RAPPORT DE GESTION / MANAGER’S REPORT (suite) / (continued)
26
II. EVOLUTION II - 1 EQUITY SUB-FUNDS Review The twelve month period extending from October 2008 to September 2009 has been exceptional in many ways for the banking system, the financial markets and the world economy. - Since starting in early October of last year, the Dow Jones for example declined from 11.000 down to 6.500, i.e., -40%! That equity collapse unfolded in two stages. The first down leg from 11.000 to 8.500 was triggered by the collapse of investment bank Lehman Brothers. The second one was the result of extensive fears concerning the world banking system and their ability to survive a truly structural collapse, which translated into a lengthy freeze of the world interbank liquidity market. Following such a sudden freeze, the Dow Jones fell from 8.500 down to 6.500 in March of 2009, high yield bond spreads jumped from 600 to 2000 and the Euro jumped from 1.24$ to 1.47$ in late December 2008. During that stress-full period, world government bond markets benefited from that severe crisis, as they became a safe haven for investors and the 10-year benchmark yield on U.S. Treasuries came down from 4,00% in October of 2008 to 2.05% in December, one of the lowest levels ever recorded in past history. - During the12-month period, many economies of the world, especially the larger ones, entered into a severe recession. The largest economy, namely, the United States shrank 5,6% during the third quarter of 2008, 6,4% in the first quarter of 2009, 0,9% in the second quarter to finally rebound into positive territory in the third quarter of 2009, i.e., +3,5%. Oil, a measure of economic activity throughout the world, came down from $100 a barrel in September of 2008 to $46 in February of 2009 to rise anew to $67 in September of 2009. Gold, which was trading at $900 an ounce prior to the Lehman collapse did not initially at least reap from the crisis since it came down to $700 a month later and only began rising thereafter to reach $1.000 an ounce by the end of September of 2009. The government policy measures, which were put in place following the world market crash, were also exceptional in many ways. On the monetary side, interest rates were reduced to record low levels while at the same time the U.S., Japan, Europe and the U.K. embarked on so-called quantitative easing to provide world financial markets with abundant liquidity. On the Treasury side, deficit spending measures were put underway to stimulate the world economy with staggering financing figures reaching several trillions of dollars! To be more specific, the Group-of-20 has committed $12-trillion of taxpayer money, equivalent to a fifth of the entire globe's annual economic output. The Chinese economy along with most Emerging Market economies fared much better during the crisis and most of them avoided recessions. But their financial markets have exacerbated the down drafts experienced by the G7 equity markets, the Shanghai, Russian and Brazilian indices shedding more than 70% for the former two and close to 60% for the latter one, most of it prior to our period under review, i.e., September 2008. The period between October 2008 and October 2009 was often compared to the events that unfolded during the early 30s, during which the equity markets crashed and the world economy went into a depression. At that time, the Fed did not provide support to the equity markets, as they did now by lowering interest rates and injecting vast amounts of liquidity via monetisation of corporate debts, nor did the Hoover Administration attempt to stimulate the U.S. economy in the 30s via extensive budget deficits, as the Obama Administration undertook with massive spending programs this time around. There lies the difference between now and then, as the result of which equity markets have powerfully recovered since their March lows, i.e., S&P-500 +56,25%.
PLEIADE
RAPPORT DE GESTION / MANAGER’S REPORT (suite) / (continued)
27
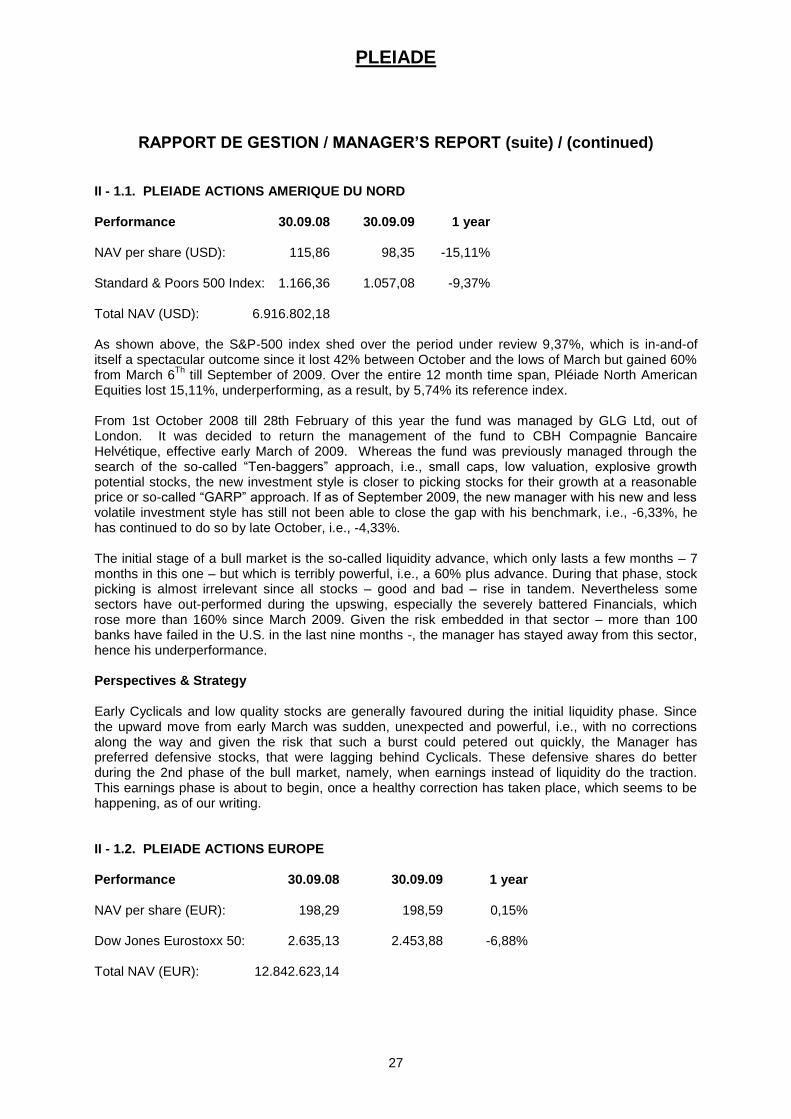
II - 1.1. PLEIADE ACTIONS AMERIQUE DU NORD Performance 30.09.08 30.09.09 1 year NAV per share (USD): 115,86 98,35 -15,11% Standard & Poors 500 Index: 1.166,36 1.057,08 -9,37% Total NAV (USD): 6.916.802,18 As shown above, the S&P-500 index shed over the period under review 9,37%, which is in-and-of itself a spectacular outcome since it lost 42% between October and the lows of March but gained 60% from March 6
Th till September of 2009. Over the entire 12 month time span, Pléiade North American
Equities lost 15,11%, underperforming, as a result, by 5,74% its reference index. From 1st October 2008 till 28th February of this year the fund was managed by GLG Ltd, out of London. It was decided to return the management of the fund to CBH Compagnie Bancaire Helvétique, effective early March of 2009. Whereas the fund was previously managed through the search of the so-called “Ten-baggers” approach, i.e., small caps, low valuation, explosive growth potential stocks, the new investment style is closer to picking stocks for their growth at a reasonable price or so-called “GARP” approach. If as of September 2009, the new manager with his new and less volatile investment style has still not been able to close the gap with his benchmark, i.e., -6,33%, he has continued to do so by late October, i.e., -4,33%. The initial stage of a bull market is the so-called liquidity advance, which only lasts a few months – 7 months in this one – but which is terribly powerful, i.e., a 60% plus advance. During that phase, stock picking is almost irrelevant since all stocks – good and bad – rise in tandem. Nevertheless some sectors have out-performed during the upswing, especially the severely battered Financials, which rose more than 160% since March 2009. Given the risk embedded in that sector – more than 100 banks have failed in the U.S. in the last nine months -, the manager has stayed away from this sector, hence his underperformance. Perspectives & Strategy Early Cyclicals and low quality stocks are generally favoured during the initial liquidity phase. Since the upward move from early March was sudden, unexpected and powerful, i.e., with no corrections along the way and given the risk that such a burst could petered out quickly, the Manager has preferred defensive stocks, that were lagging behind Cyclicals. These defensive shares do better during the 2nd phase of the bull market, namely, when earnings instead of liquidity do the traction. This earnings phase is about to begin, once a healthy correction has taken place, which seems to be happening, as of our writing. II - 1.2. PLEIADE ACTIONS EUROPE Performance 30.09.08 30.09.09 1 year NAV per share (EUR): 198,29 198,59 0,15% Dow Jones Eurostoxx 50: 2.635,13 2.453,88 -6,88% Total NAV (EUR): 12.842.623,14
PLEIADE
RAPPORT DE GESTION / MANAGER’S REPORT (suite) / (continued)
28
As the market evolves towards its second phase, namely, the earnings phase, the name of the game will be stock picking that is selecting the shares with the strongest earnings growth potential. The so-called GARP approach, which is applied in the management of Pléiade European Equities, should in this unfolding more selective environment, generate large returns. Perspectives & Strategy The manager‟s strategy for 2010 is similar to 2009 since he continues to underweight banking stocks and to over-weigh defensive companies in the Food and Telecom sectors for example. Small cap stocks should also do very well in this recovery environment, especially if inflation were to re-surface, but the manager prefers large cap stocks, whose volatility in earnings is significantly smaller, which enables him to reduce his Sharpe ratio, i.e., return over volatility, an investment characteristic of significance for long-term investors.. II - 1.3. PLEIADE ACTIONS ASIE ET BASSIN DU PACIFIQUE Performance 30.09.08 30.09.09 1 year NAV per share (USD): 56,03 77,45 +38,23% MSCI AC Pacific: 1.928,69 2.010,63 +4,25% Total NAV (USD): 6.177.452,98 The fund recouped +38,23% over the last 12 months far more than its reference index, i.e., +4,25%, out-performing, as a result, almost 34%! Last year it shed -44,48%, which was more than its reference index (-31,21%). The sheer out-performance this year far out-weighs the under-performance of last year. It reveals the high volatility of the shares into which the manager invests. This volatility results from two investment choices, namely, (1) the small cap stock universe and (2) the geographical area, which includes emerging countries such as South Korea, China, the Philippines, Vietnam and Thailand. Perspective & Strategy This fund, which is managed by APS out of Singapore, is suitable for investors, who wish to reap from the Emerging Markets play but with a restriction to the Asian part of the world with a geographical diversification. Playing only the China game is a risky proposition because its economic growth could be seriously jeopardised by the Renminbi appreciation, which the United States have been requiring for some time in order to help rebalancing the world economy together with the unlikely government program to stimulate anew the Chinese economy. Pléiade Pacific Bassin Equities will be able to generate better returns through its selection of small cap stocks in the whole region, i.e., more diversification, less risk. But investing in such a volatile fund requires an investment discipline and the commitment to remain invested for the long haul, i.e., a decade eventually!
PLEIADE
RAPPORT DE GESTION / MANAGER’S REPORT (suite) / (continued)
29
II - 1.4. PLEIADE ACTIONS INTERNATIONALES "VALEUR INTRINSEQUE" Performance 30.09.08 30.09.09 1 year NAV per share (CHF): 115,75 114,12 -1,41% MSCI World Value index (CHF): 2.109,31 1.856,22 -11,87% Total NAV (CHF): 12.231.642,24 The share price of Pleiade Actions Internationales "Valeur Intrinsèque" shed -1,41% over the 12 months between September 2008 and September 2009. Over the same period of time, its reference index in Swiss francs lost 11,87%, which results in a relative out-performance for the fund of 10,46% Since last year, the fund is allowed to implement its deep-value approach to the world universe of large cap shares, which was not the case before because of restricted guidelines, which prevent it to acquire strongly discounted shares in the United States. The fund remains however a mono-currency fund since its quarterly NAV, i.e., Net Asset Value, is consolidated in Swiss francs, as in the past. As a result, the fund is now holding 4 U.S. shares - Burlington Northern, Coca-Cola, Union Pacific, Philip Morris - along with mostly European shares in its top twenty holdings. The investment approach remains solidly grounded in the history of Tweedy Browne, Inc., which promoted the “Ben Graham” value-oriented approach by investing primarily in securities trading at discounts from their appraised intrinsic value. To reap from investments in such a fund, investors need at least a 5 years investment horizon. Perspectives & Strategy Timing the stocks markets is essential but almost impossible. The value-investment approach recognizes such impossibility and chooses rather to buy shares when their prices are disconnected from their discounted cash-flow value. Even after the powerful recent rebound in world stock markets, investing in this fund remains an attractive opportunity, as long as investors are willingly remaining in the fund for no less than five years. The last 12 months crisis is rightfully compared to 1929, meaning that it does not happen every five years. II - 2 BONDS SUB-FUNDS General Review Volatility has been increasing since 2005 on the world bond markets and it did not abate between October 2008 and September 2009, “au contraire”. The yield on the 10-year U.S. benchmark declined from 4,0% in September of 2008 down to almost 2,0% in December of 2008. Immediately thereafter, it began rising again towards 4,0% again by early June of 2009 to slightly come down towards 3,5% at the end of the period under review. A similar pattern unfolded in Europe but with less volatility. Indeed, the yield on the 10-year Bund benchmark came down to 3,0% from 4,20% before rising again but with far less conviction to 3,40% in September of 2009. The cause of the initial decline in benchmark yields was triggered by a powerful flight to quality among the world investment community following the collapse of Lehman Brothers and AIG in the U.S. and by the severe problems encountered by British banks like RBS or Swiss banks like UBS and many others around the world .
PLEIADE
RAPPORT DE GESTION / MANAGER’S REPORT (suite) / (continued)
30
Perspectives & Strategy Over the course of the period under review, gold has been pointing to more inflation. But during the same period bond markets in the U.S., in Europe, in Japan and throughout most countries of the world for that matter have been dismissing that threat altogether. In fact, deflation concerns have initially prevailed over the course of bond yields after the banking crisis of last fall and a new historical low was reached in the U.S., when the 10-year benchmark yield crashed down to 2,05% on December 30, 2008. Thereafter yields and gold recovered in tandem to factor in future inflation, in reaction to an exceptional Monetary and Fiscal policy mix put in place throughout the world by Central Banks and Treasuries. In our book, what caused bond prices to be nervous over the period was more the enormous size of government issues rather than the inflation risk. Never before had markets to face such gargantuan quantities of Treasury issues. This new risk needs to be correctly priced in and remains in our book a challenge for bond investors. . During that volatile period, Pléiade U.S. Dollar Bonds gained 8,11% out-pacing its relevant bench mark by 1,18% while Pléiade European Bonds gained 7,92% falling short of its benchmark by 3,72%, as shown below. II - 2.1. PLEIADE OBLIGATIONS DOLLAR Performance 30.09.08 30.09.09 1 year NAV per share (USD): 184,08 199,01 +8,11% EFFAS Liquid govt. Index: 260,44 278,50 +6,93% Total NAV (USD): 17.553.613,78 II - 2.2. PLEIADE OBLIGATIONS EUROPÉENNES Performance 30.09.08 30.09.09 1 year NAV per share (EUR): 200,67 216,56 +7,92% EFFAS Liquid govt. Index: 150,15 167,63 +11,64% Total NAV (EUR): 19.540.766,07 II - 2.3. PLEIADE OBLIGATIONS CONVERTIBLES INTERNATIONALES Performance 30.09.08 30.09.09 1 year NAV per share (EUR): 63,20 61,41 -2,83% Bloomberg Convertible Index: 108,11 123,95 +14,35% Total NAV (EUR): 7.330.408,15
PLEIADE
RAPPORT DE GESTION / MANAGER’S REPORT (suite) / (continued)
31
Comments on performances Pléiade International Convertible Bonds shed 2,83% during the period under review, while its reference index was widely positive, as a result of which the fund underperformed by 17,18%. Such a wide underperformance cannot be explained by market movements alone. During the crisis, which prevailed in the early part of the period under review that is during the last quarter of 2008, Pléiade International Convertibles suffered from massive sell orders, to which the fund‟s manager had great difficulty to adjust to. Thereafter, when markets began rebounding, the manager chose various sectors to invest in but stayed away from Financials for risk reasons, which happened to have been the most performing sector within the index. In addition, after such a crisis, many managers have favoured less risky assets and Pléiade International Convertibles was therefore very much tilted towards short-term bonds rather than equities, i.e., short Delta, which happened to rebound powerfully. Hence, its lag. Perspectives & Strategy Currently, the Delta for the fund is neutral, meaning the fund does not favour equities over bonds, simply because the former have already out-performed and are less likely to do so in the near future. Although the G7 economies are now on the path of an economic recovery, its sustainability is not yet granted and not surprisingly talks about a double-dip recessions still abound. II - 3 SHORT TERM BONDS SUB-FUNDS II - 3.1. PLEIADE DOLLAR COURT TERME General Review The reference index has gained 1,78% over the 12 months between September 2008 and 2009. During that 12-month timespan, the Pléiade US Dollar Reserve fund increased by 6,13%, which adds up to an over- performance of 4,35%. In early October of 2008, the Federal Funds rate in the U.S. was still at 2,0%, having already declined from 5,25% a year before. But with the banking crisis unfolding, this rate was brought down to 0,25% at the end of December. This renewed decline in the Fed Funds rate was partially well anticipated by the manager of Pléiade U.S. Dollar Reserve, since he had locked in higher rates on longer issues before it happened. Hence, the exceptional over-performance. Perspectives & Strategy With the economic recovery unfolding to numerous parts of the world, especially in the Emerging markets and now in the United States, short-term rates are more likely to be normalised, meaning that their next move is more likely to be on the upside from their current low levels. This time around the manager will sooner or later undo his longer term high yielding positions in favour of so-called floaters, whose rates are being adjusted every three months in line with the new Fed funds rate.
PLEIADE
RAPPORT DE GESTION / MANAGER’S REPORT (suite) / (continued)
32
Performance 30.09.08 30.09.09 1 year NAV per share (USD): 194,10 206,00 +6,13% EFFAS USD libor 3m: 171,88 174,95 +1,78% Total NAV (USD): 11.993.665,81 II - 3.2. PLEIADE EURO COURT TERME General Review The fund has generated a positive return of 3,13% while its reference index produced a return of 2,74% during the period between September 2008 and 2009. The fund has therefore over-performed a mild 0,39%. A similar strategy was applied to Pléiade Euro Reserve, whose short-term rates have declined by a smaller extent than their U.S. counterpart, which has mechanically reduced the potential gains. Perspectives & Strategy As for next year, the manager‟s strategy will also consist in selling his long-term issues in favour of European floaters to benefit from the European Central Bank lifting their target rate in the due course of normalisation, which follows every economic recovery. Performance 30.09.08 30.09.09 1 year NAV per share (EUR) : 159,89 164,90 +3,13% EFFAS EUR libor 3m 158,14 162,47 +2,74% Total NAV (EUR): 7.404.246,93 II - 4 STRATEGIC PORTFOLIO SUB-FUNDS II- 4.1. PLEIADE EURO BALANCED General Review Pléiade EURO Balanced is CBH Compagnie Bancaire Helvétique‟s flagship portfolio, whose asset allocation is determined by its investment committee. The fund is invested primarily in cash, bonds and stocks with no currency exposure outside the Euro. The fund increased by 14.09% since inception on December 9, 2008.
PLEIADE
RAPPORT DE GESTION / MANAGER’S REPORT (suite) / (continued)
33
Perspectives & Strategy The 2009 performance attribution reveals that in the course of that year the fund reaped most from the reduction in the spreads between corporate and Treasury bonds. The fund has also benefitted from its equity exposure over the course of the year, taking a beating in the early part of the year till March 6 but reaping extensively thereafter when equity markets rebounded more than 60%. 2010 will likely be more difficult because bonds are unlikely to return as much as they did in 2009 while equity markets could generate large returns but with a volatility that will be nerve testing. Performance 09.12.08 30.09.09 Since inception NAV per share (EUR): 70,03 79,90 +14,09% Total NAV (EUR): 14.916.831,83
PLEIADE
34
RAPPORT DU REVISEUR D'ENTREPRISES /
REPORT OF THE AUDITOR
Aux Actionnaires de PLEIADE
Nous avons effectué l'audit des états financiers ci-joints de PLEIADE (la "SICAV") et de chacun de
ses compartiments, comprenant l‟état du patrimoine, l‟état du portefeuille-titres et des autres actifs
nets au 30 septembre 2009 ainsi que l‟état des opérations et des autres variations de l'actif net
pour l'exercice clos à cette date, et des annexes contenant un résumé des principales méthodes
comptables et d'autres notes explicatives aux états financiers.
Responsabilité du conseil d’administration de la SICAV dans l'établissement et la présentation des états financiers
Le conseil d‟administration de la SICAV
est responsable de l'établissement et de la présentation
sincère de ces états financiers, conformément aux prescriptions légales et réglementaires relatives à l‟établissement et à la présentation des états financiers en vigueur au Luxembourg. Cette responsabilité comprend: la conception, la mise en place et le suivi d'un contrôle interne relatif à l'établissement et la présentation sincère d‟états financiers ne comportant pas d'anomalies significatives, que celles-ci résultent de fraudes ou d'erreurs; le choix et l‟application de méthodes comptables appropriées ainsi que la détermination d'estimations comptables raisonnables au regard des circonstances. Responsabilité du réviseur d’entreprises Notre responsabilité est d‟exprimer une opinion sur ces états financiers sur la base de notre audit. Nous avons effectué notre audit selon les Normes Internationales d‟Audit telles qu‟adoptées par l‟Institut des Réviseurs d‟Entreprises. Ces normes requièrent de notre part de nous conformer aux règles d‟éthique et de planifier et de réaliser l‟audit pour obtenir une assurance raisonnable que les états financiers ne comportent pas d‟anomalies significatives. Un audit implique la mise en œuvre de procédures en vue de recueillir des éléments probants concernant les montants et les informations fournies dans les états financiers. Le choix des procédures relève du jugement du réviseur d‟entreprises, de même que l‟évaluation du risque que les états financiers contiennent des anomalies significatives, que celles-ci résultent de fraudes ou d‟erreurs. En procédant à ces évaluations du risque, le réviseur d‟entreprises prend en compte le contrôle interne en vigueur dans l‟entité relatif à l‟établissement et la présentation sincère des états financiers afin de définir des procédures d‟audit appropriées en la circonstance, et non dans le but d‟exprimer une opinion sur l‟efficacité de celui-ci.
PLEIADE
RAPPORT DU REVISEUR D'ENTREPRISES /
REPORT OF THE AUDITOR (suite) / (continued)
36
To the Shareholders of PLEIADE We have audited the accompanying financial statements of PLEIADE (the "SICAV") and of each of its Sub-Funds, which comprise the statement of net assets and the statement of investments and other net assets as at 30th September 2009 and the statement of operations and other changes in net assets for the year then ended, and a summary of significant accounting policies and other explanatory notes to the financial statements. Responsibility of the Board of Directors of the SICAV for the financial statements The Board of Directors of the SICAV is responsible for the preparation and fair presentation of these financial statements in accordance with Luxembourg legal and regulatory requirements relating to the preparation of the financial statements. This responsibility includes: designing, implementing and maintaining internal control relevant to the preparation and fair presentation of financial statements that are free from material misstatement, whether due to fraud or error; selecting and applying appropriate accounting policies; and making accounting estimates that are reasonable in the circumstances. Responsibility of the Réviseur d'Entreprises Our responsibility is to express an opinion on these financial statements based on our audit. We conducted our audit in accordance with International Standards on Auditing as adopted by the Institut des Réviseurs d‟Entreprises. Those standards require that we comply with ethical requirements and plan and perform the audit to obtain reasonable assurance whether the financial statements are free from material misstatement. An audit involves performing procedures to obtain audit evidence about the amounts and disclosures in the financial statements. The procedures selected depend on the judgment of the Réviseur d'Entreprises, including the assessment of the risks of material misstatement of the financial statements, whether due to fraud or error. In making those risk assessments, the Réviseur d'Entreprises considers internal control relevant to the entity‟s preparation and fair presentation of the financial statements in order to design audit procedures that are appropriate in the circumstances, but not for the purpose of expressing an opinion on the effectiveness of the entity‟s internal control.
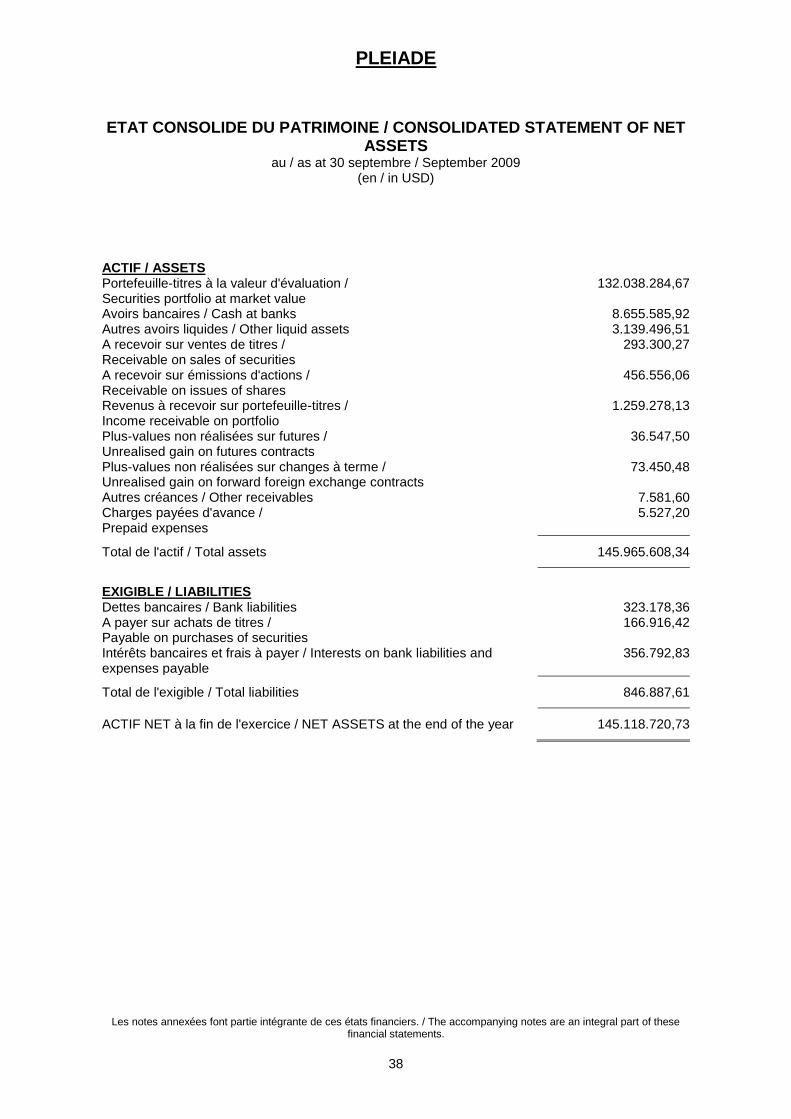
PLEIADE
ETAT CONSOLIDE DU PATRIMOINE / CONSOLIDATED STATEMENT OF NET ASSETS
au / as at 30 septembre / September 2009 (en / in USD)
Les notes annexées font partie intégrante de ces états financiers. / The accompanying notes are an integral part of these financial statements.
38
ACTIF / ASSETS Portefeuille-titres à la valeur d'évaluation / Securities portfolio at market value
132.038.284,67
Avoirs bancaires / Cash at banks 8.655.585,92 Autres avoirs liquides / Other liquid assets 3.139.496,51 A recevoir sur ventes de titres / Receivable on sales of securities
293.300,27
A recevoir sur émissions d'actions / Receivable on issues of shares
456.556,06
Revenus à recevoir sur portefeuille-titres / Income receivable on portfolio
1.259.278,13
Plus-values non réalisées sur futures / Unrealised gain on futures contracts
36.547,50
Plus-values non réalisées sur changes à terme / Unrealised gain on forward foreign exchange contracts
73.450,48
Autres créances / Other receivables 7.581,60 Charges payées d'avance / Prepaid expenses
5.527,20
Total de l'actif / Total assets 145.965.608,34
EXIGIBLE / LIABILITIES Dettes bancaires / Bank liabilities 323.178,36 A payer sur achats de titres / Payable on purchases of securities
166.916,42
Intérêts bancaires et frais à payer / Interests on bank liabilities and expenses payable
356.792,83
Total de l'exigible / Total liabilities 846.887,61
ACTIF NET à la fin de l'exercice / NET ASSETS at the end of the year 145.118.720,73
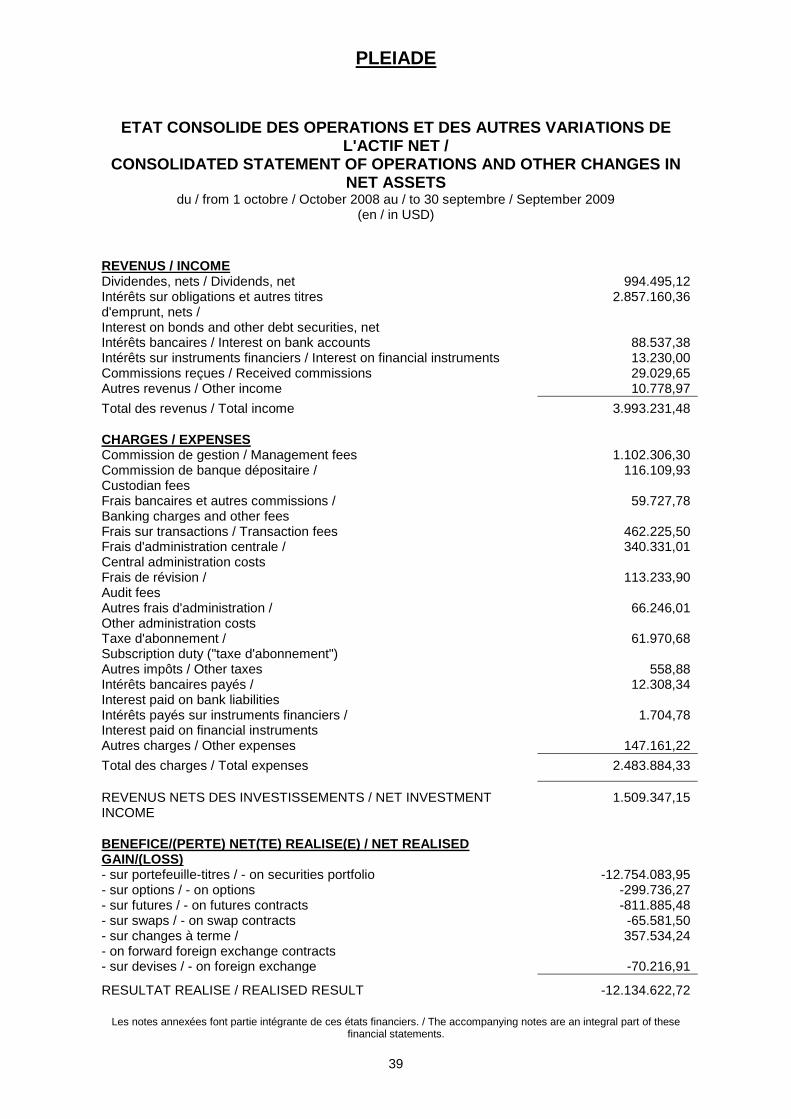
PLEIADE
ETAT CONSOLIDE DES OPERATIONS ET DES AUTRES VARIATIONS DE L'ACTIF NET /
CONSOLIDATED STATEMENT OF OPERATIONS AND OTHER CHANGES IN NET ASSETS
du / from 1 octobre / October 2008 au / to 30 septembre / September 2009 (en / in USD)
Les notes annexées font partie intégrante de ces états financiers. / The accompanying notes are an integral part of these financial statements.
39
REVENUS / INCOME Dividendes, nets / Dividends, net 994.495,12 Intérêts sur obligations et autres titres d'emprunt, nets / Interest on bonds and other debt securities, net
2.857.160,36
Intérêts bancaires / Interest on bank accounts 88.537,38 Intérêts sur instruments financiers / Interest on financial instruments 13.230,00 Commissions reçues / Received commissions 29.029,65 Autres revenus / Other income 10.778,97
Total des revenus / Total income 3.993.231,48
CHARGES / EXPENSES Commission de gestion / Management fees 1.102.306,30 Commission de banque dépositaire / Custodian fees
116.109,93
Frais bancaires et autres commissions / Banking charges and other fees
59.727,78
Frais sur transactions / Transaction fees 462.225,50 Frais d'administration centrale / Central administration costs
340.331,01
Frais de révision / Audit fees
113.233,90
Autres frais d'administration / Other administration costs
66.246,01
Taxe d'abonnement / Subscription duty ("taxe d'abonnement")
61.970,68
Autres impôts / Other taxes 558,88 Intérêts bancaires payés / Interest paid on bank liabilities
12.308,34
Intérêts payés sur instruments financiers / Interest paid on financial instruments
1.704,78
Autres charges / Other expenses 147.161,22
Total des charges / Total expenses 2.483.884,33
REVENUS NETS DES INVESTISSEMENTS / NET INVESTMENT INCOME
1.509.347,15
BENEFICE/(PERTE) NET(TE) REALISE(E) / NET REALISED GAIN/(LOSS)
- sur portefeuille-titres / - on securities portfolio -12.754.083,95 - sur options / - on options -299.736,27 - sur futures / - on futures contracts -811.885,48 - sur swaps / - on swap contracts -65.581,50 - sur changes à terme / - on forward foreign exchange contracts
357.534,24
- sur devises / - on foreign exchange -70.216,91
RESULTAT REALISE / REALISED RESULT -12.134.622,72
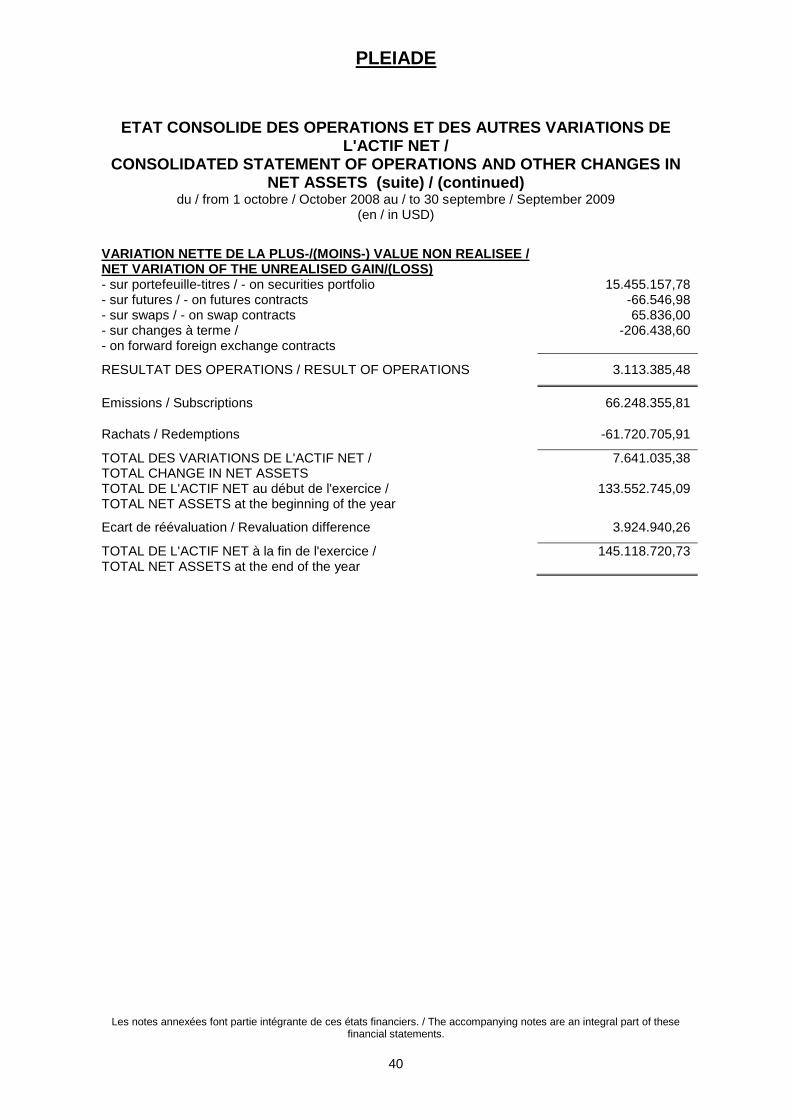
PLEIADE
ETAT CONSOLIDE DES OPERATIONS ET DES AUTRES VARIATIONS DE L'ACTIF NET /
CONSOLIDATED STATEMENT OF OPERATIONS AND OTHER CHANGES IN NET ASSETS (suite) / (continued)
du / from 1 octobre / October 2008 au / to 30 septembre / September 2009 (en / in USD)
Les notes annexées font partie intégrante de ces états financiers. / The accompanying notes are an integral part of these financial statements.
40
VARIATION NETTE DE LA PLUS-/(MOINS-) VALUE NON REALISEE / NET VARIATION OF THE UNREALISED GAIN/(LOSS)
- sur portefeuille-titres / - on securities portfolio 15.455.157,78 - sur futures / - on futures contracts -66.546,98 - sur swaps / - on swap contracts 65.836,00 - sur changes à terme / - on forward foreign exchange contracts
-206.438,60
RESULTAT DES OPERATIONS / RESULT OF OPERATIONS 3.113.385,48
Emissions / Subscriptions 66.248.355,81
Rachats / Redemptions -61.720.705,91
TOTAL DES VARIATIONS DE L'ACTIF NET / TOTAL CHANGE IN NET ASSETS
7.641.035,38
TOTAL DE L'ACTIF NET au début de l'exercice / TOTAL NET ASSETS at the beginning of the year
133.552.745,09
Ecart de réévaluation / Revaluation difference 3.924.940,26
TOTAL DE L'ACTIF NET à la fin de l'exercice / TOTAL NET ASSETS at the end of the year
145.118.720,73
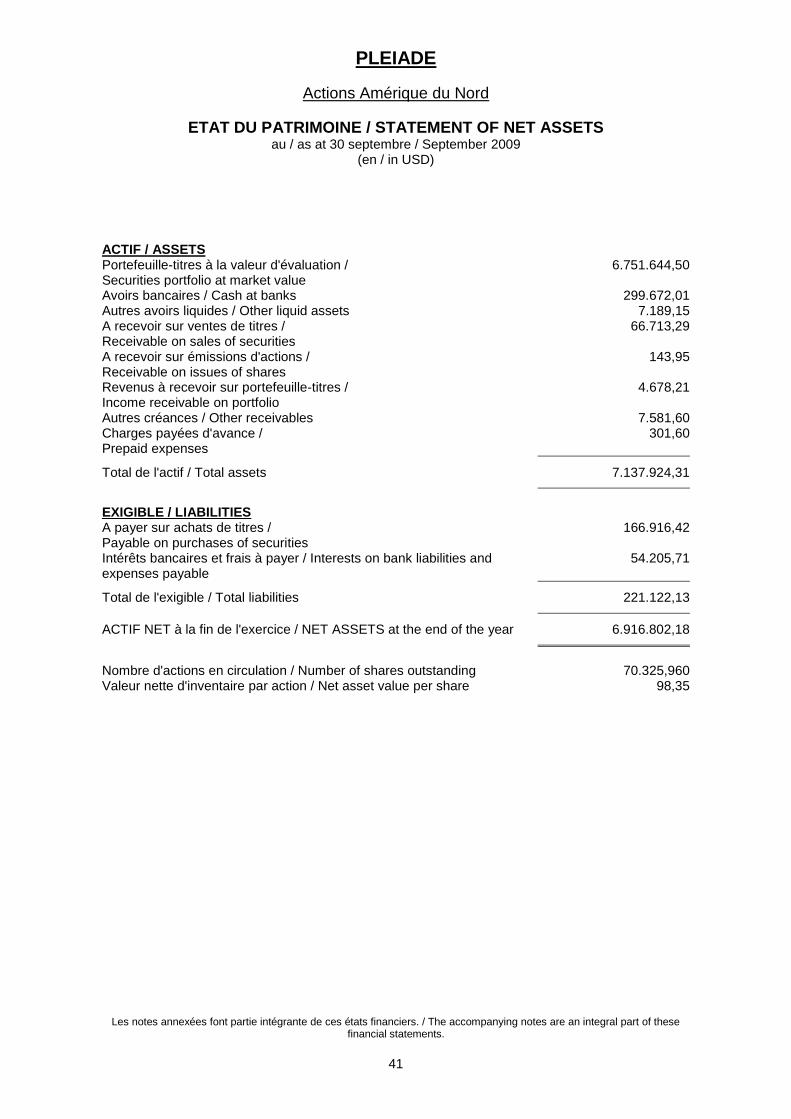
PLEIADE
Actions Amérique du Nord
ETAT DU PATRIMOINE / STATEMENT OF NET ASSETS au / as at 30 septembre / September 2009
(en / in USD)
Les notes annexées font partie intégrante de ces états financiers. / The accompanying notes are an integral part of these financial statements.
41
ACTIF / ASSETS Portefeuille-titres à la valeur d'évaluation / Securities portfolio at market value
6.751.644,50
Avoirs bancaires / Cash at banks 299.672,01 Autres avoirs liquides / Other liquid assets 7.189,15 A recevoir sur ventes de titres / Receivable on sales of securities
66.713,29
A recevoir sur émissions d'actions / Receivable on issues of shares
143,95
Revenus à recevoir sur portefeuille-titres / Income receivable on portfolio
4.678,21
Autres créances / Other receivables 7.581,60 Charges payées d'avance / Prepaid expenses
301,60
Total de l'actif / Total assets 7.137.924,31
EXIGIBLE / LIABILITIES A payer sur achats de titres / Payable on purchases of securities
166.916,42
Intérêts bancaires et frais à payer / Interests on bank liabilities and expenses payable
54.205,71
Total de l'exigible / Total liabilities 221.122,13
ACTIF NET à la fin de l'exercice / NET ASSETS at the end of the year 6.916.802,18
Nombre d'actions en circulation / Number of shares outstanding 70.325,960 Valeur nette d'inventaire par action / Net asset value per share 98,35
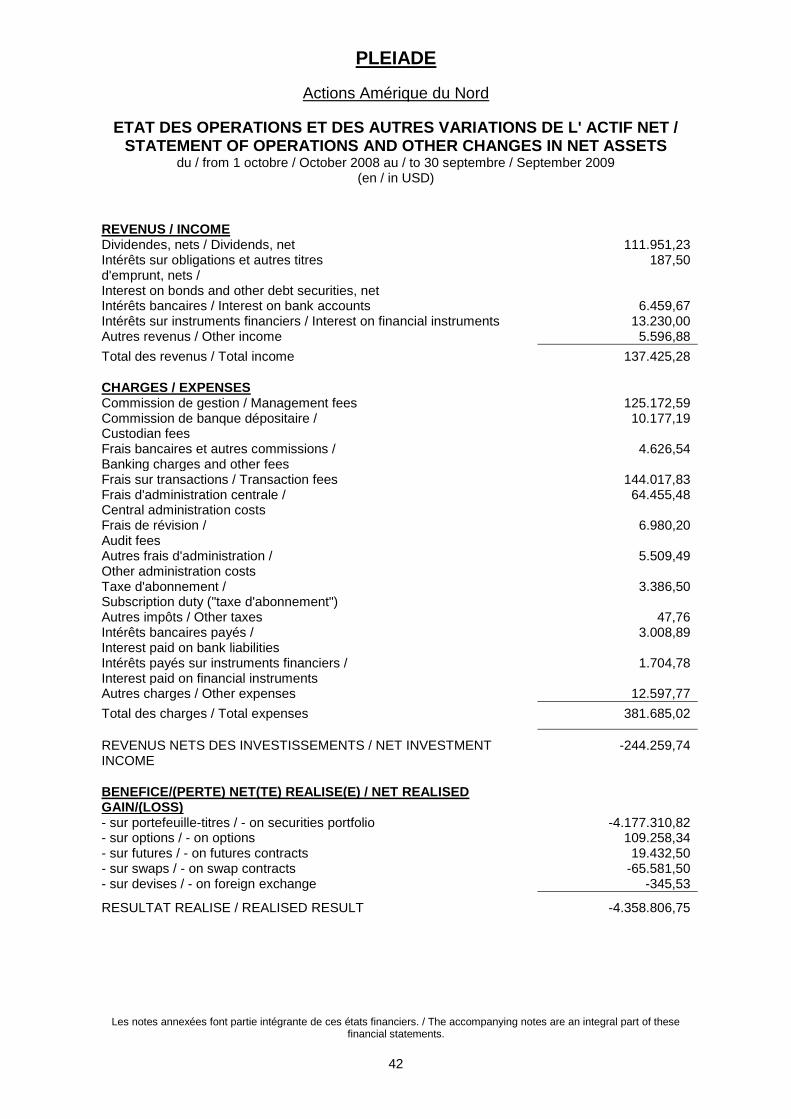
PLEIADE
Actions Amérique du Nord
ETAT DES OPERATIONS ET DES AUTRES VARIATIONS DE L' ACTIF NET / STATEMENT OF OPERATIONS AND OTHER CHANGES IN NET ASSETS
du / from 1 octobre / October 2008 au / to 30 septembre / September 2009 (en / in USD)
Les notes annexées font partie intégrante de ces états financiers. / The accompanying notes are an integral part of these financial statements.
42
REVENUS / INCOME Dividendes, nets / Dividends, net 111.951,23 Intérêts sur obligations et autres titres d'emprunt, nets / Interest on bonds and other debt securities, net
187,50
Intérêts bancaires / Interest on bank accounts 6.459,67 Intérêts sur instruments financiers / Interest on financial instruments 13.230,00 Autres revenus / Other income 5.596,88
Total des revenus / Total income 137.425,28
CHARGES / EXPENSES Commission de gestion / Management fees 125.172,59 Commission de banque dépositaire / Custodian fees
10.177,19
Frais bancaires et autres commissions / Banking charges and other fees
4.626,54
Frais sur transactions / Transaction fees 144.017,83 Frais d'administration centrale / Central administration costs
64.455,48
Frais de révision / Audit fees
6.980,20
Autres frais d'administration / Other administration costs
5.509,49
Taxe d'abonnement / Subscription duty ("taxe d'abonnement")
3.386,50
Autres impôts / Other taxes 47,76 Intérêts bancaires payés / Interest paid on bank liabilities
3.008,89
Intérêts payés sur instruments financiers / Interest paid on financial instruments
1.704,78
Autres charges / Other expenses 12.597,77
Total des charges / Total expenses 381.685,02
REVENUS NETS DES INVESTISSEMENTS / NET INVESTMENT INCOME
-244.259,74
BENEFICE/(PERTE) NET(TE) REALISE(E) / NET REALISED GAIN/(LOSS)
- sur portefeuille-titres / - on securities portfolio -4.177.310,82 - sur options / - on options 109.258,34 - sur futures / - on futures contracts 19.432,50 - sur swaps / - on swap contracts -65.581,50 - sur devises / - on foreign exchange -345,53
RESULTAT REALISE / REALISED RESULT -4.358.806,75
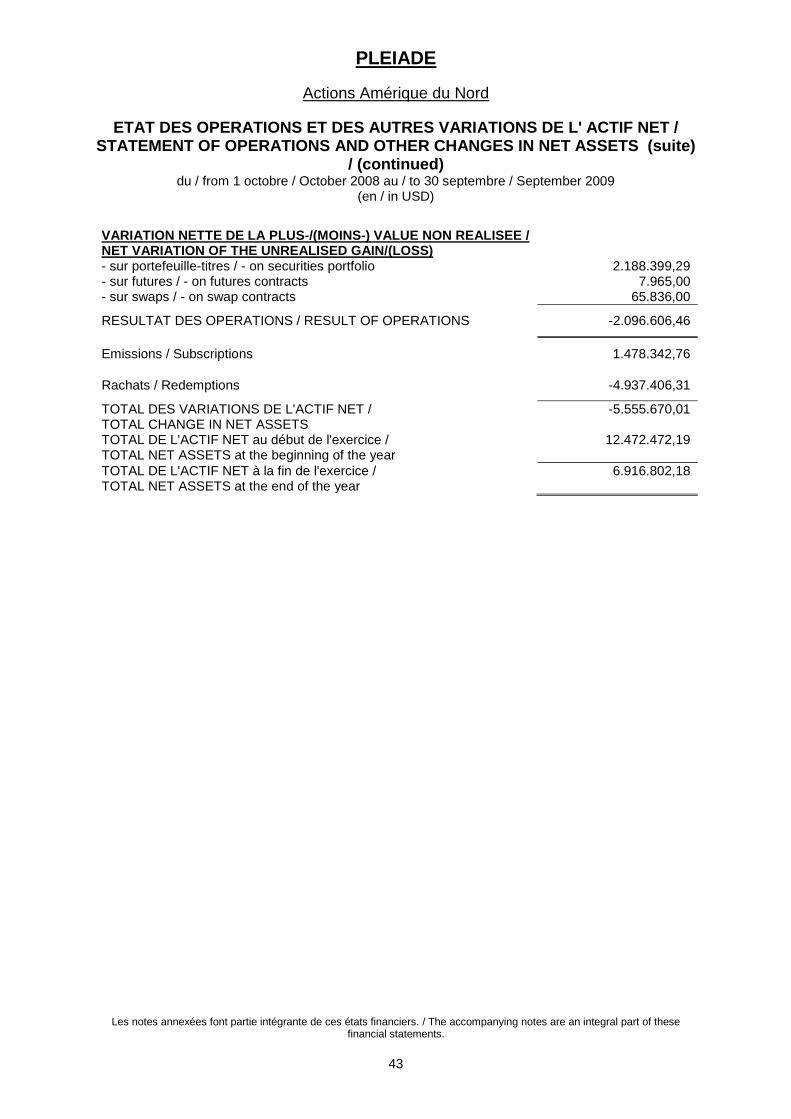
PLEIADE
Actions Amérique du Nord
ETAT DES OPERATIONS ET DES AUTRES VARIATIONS DE L' ACTIF NET / STATEMENT OF OPERATIONS AND OTHER CHANGES IN NET ASSETS (suite)
/ (continued) du / from 1 octobre / October 2008 au / to 30 septembre / September 2009
(en / in USD)
Les notes annexées font partie intégrante de ces états financiers. / The accompanying notes are an integral part of these financial statements.
43
VARIATION NETTE DE LA PLUS-/(MOINS-) VALUE NON REALISEE / NET VARIATION OF THE UNREALISED GAIN/(LOSS)
- sur portefeuille-titres / - on securities portfolio 2.188.399,29 - sur futures / - on futures contracts 7.965,00 - sur swaps / - on swap contracts 65.836,00
RESULTAT DES OPERATIONS / RESULT OF OPERATIONS -2.096.606,46
Emissions / Subscriptions 1.478.342,76
Rachats / Redemptions -4.937.406,31
TOTAL DES VARIATIONS DE L'ACTIF NET / TOTAL CHANGE IN NET ASSETS
-5.555.670,01
TOTAL DE L'ACTIF NET au début de l'exercice / TOTAL NET ASSETS at the beginning of the year
12.472.472,19
TOTAL DE L'ACTIF NET à la fin de l'exercice / TOTAL NET ASSETS at the end of the year
6.916.802,18

PLEIADE
Actions Amérique du Nord
STATISTIQUES / STATISTICAL INFORMATION au / as at 30 septembre / September 2009
(en / in USD)
Les performances annuelles ont été calculées pour les 3 derniers exercices. Pour les compartiments / catégories d'actions lancés ou liquidés en cours d'exercice, la performance annuelle correspondante n'a pas été calculée.
La performance historique ne donne pas d'indication sur la performance future. Les données de performance ne tiennent pas compte des commissions et frais perçus lors de l'émission et du rachat d'actions de la SICAV.
Annual returns were calculated for the last 3 consecutive fiscal years. For sub-funds / share types launched or liquidated during
the fiscal year, the corresponding annual return has not been calculated. The historical performance is not an indication of future results. The performance data do not take account of the commissions
and costs incurred on the issue and redemption of shares.
Les notes annexées font partie intégrante de ces états financiers. / The accompanying notes are an integral part of these financial statements.
44
Total de l'actif net / Total net assets
- au 30.09.2009 / as at 30.09.2009 6.916.802,18 - au 30.09.2008 / as at 30.09.2008 12.472.472,19 - au 30.09.2007 / as at 30.09.2007 21.629.769,08
Portfolio Turnover Rate (en %) / Portfolio Turnover Rate (in %)
les émissions et les rachats sont compensés par jour de calcul VNI / subscriptions and redemptions are netted per NAV calculation day
- au 30.09.2009 / as at 30.09.2009 726,14
Nombre d'actions / Number of shares
- en circulation au début de l'exercice / outstanding at the beginning of the year
107.652,001
- souscrites / subscribed 17.528,475 - remboursées / redeemed -54.854,516
- en circulation à la fin de l'exercice / outstanding at the end of the year
70.325,960
Valeur nette d'inventaire par action / Net asset value per share
- au 30.09.2009 / as at 30.09.2009 98,35 - au 30.09.2008 / as at 30.09.2008 115,86 - au 30.09.2007 / as at 30.09.2007 163,76
Performances des actions (en %) / Performance of shares (in %)
- au 30.09.2009 / as at 30.09.2009 -15.11 - au 30.09.2008 / as at 30.09.2008 -29,25 - au 30.09.2007 / as at 30.09.2007 10,72
TER par action (en %) / TER per share (in %)
- au 30.09.2009 / as at 30.09.2009 3,28
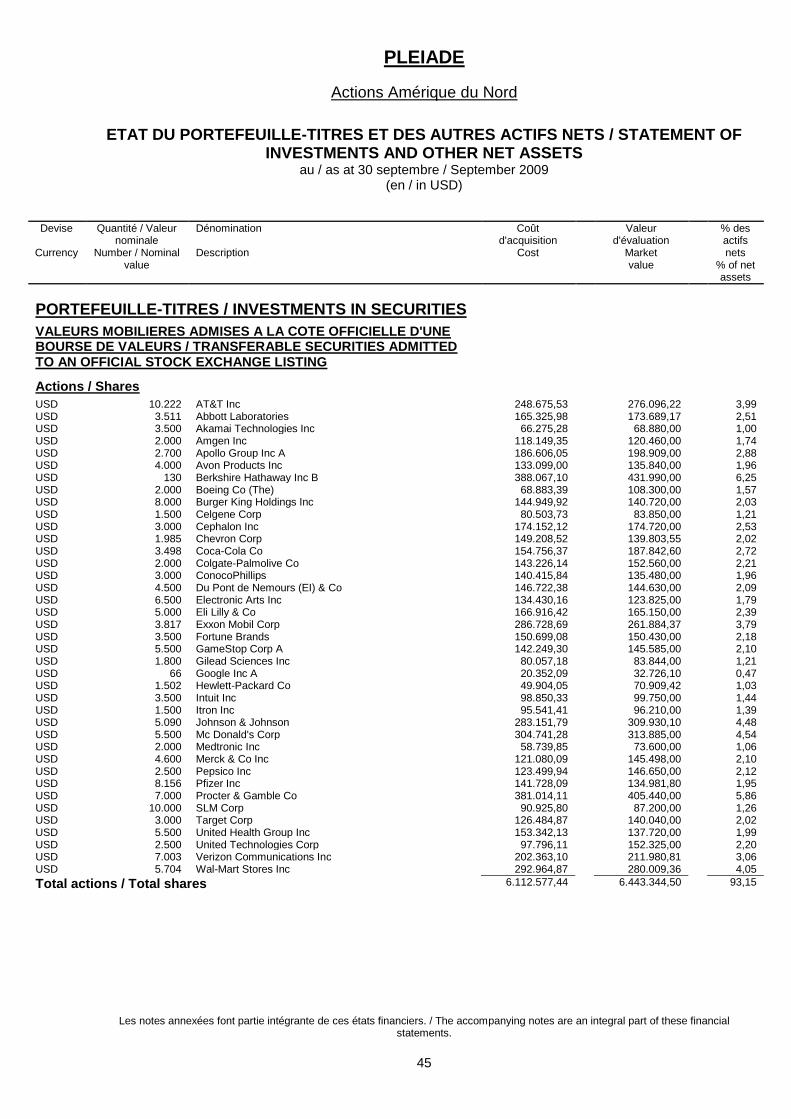
PLEIADE
Actions Amérique du Nord
ETAT DU PORTEFEUILLE-TITRES ET DES AUTRES ACTIFS NETS / STATEMENT OF INVESTMENTS AND OTHER NET ASSETS
au / as at 30 septembre / September 2009 (en / in USD)
Les notes annexées font partie intégrante de ces états financiers. / The accompanying notes are an integral part of these financial statements.
45
Devise
Currency
Quantité / Valeur nominale
Number / Nominal value
Dénomination Description
Coût d'acquisition
Cost
Valeur d'évaluation
Market value
% des actifs nets
% of net assets
PORTEFEUILLE-TITRES / INVESTMENTS IN SECURITIES
VALEURS MOBILIERES ADMISES A LA COTE OFFICIELLE D'UNE BOURSE DE VALEURS / TRANSFERABLE SECURITIES ADMITTED TO AN OFFICIAL STOCK EXCHANGE LISTING
Actions / Shares
USD 10.222 AT&T Inc 248.675,53 276.096,22 3,99 USD 3.511 Abbott Laboratories 165.325,98 173.689,17 2,51 USD 3.500 Akamai Technologies Inc 66.275,28 68.880,00 1,00 USD 2.000 Amgen Inc 118.149,35 120.460,00 1,74 USD 2.700 Apollo Group Inc A 186.606,05 198.909,00 2,88 USD 4.000 Avon Products Inc 133.099,00 135.840,00 1,96 USD 130 Berkshire Hathaway Inc B 388.067,10 431.990,00 6,25 USD 2.000 Boeing Co (The) 68.883,39 108.300,00 1,57 USD 8.000 Burger King Holdings Inc 144.949,92 140.720,00 2,03 USD 1.500 Celgene Corp 80.503,73 83.850,00 1,21 USD 3.000 Cephalon Inc 174.152,12 174.720,00 2,53 USD 1.985 Chevron Corp 149.208,52 139.803,55 2,02 USD 3.498 Coca-Cola Co 154.756,37 187.842,60 2,72 USD 2.000 Colgate-Palmolive Co 143.226,14 152.560,00 2,21 USD 3.000 ConocoPhillips 140.415,84 135.480,00 1,96 USD 4.500 Du Pont de Nemours (EI) & Co 146.722,38 144.630,00 2,09 USD 6.500 Electronic Arts Inc 134.430,16 123.825,00 1,79 USD 5.000 Eli Lilly & Co 166.916,42 165.150,00 2,39 USD 3.817 Exxon Mobil Corp 286.728,69 261.884,37 3,79 USD 3.500 Fortune Brands 150.699,08 150.430,00 2,18 USD 5.500 GameStop Corp A 142.249,30 145.585,00 2,10 USD 1.800 Gilead Sciences Inc 80.057,18 83.844,00 1,21 USD 66 Google Inc A 20.352,09 32.726,10 0,47 USD 1.502 Hewlett-Packard Co 49.904,05 70.909,42 1,03 USD 3.500 Intuit Inc 98.850,33 99.750,00 1,44 USD 1.500 Itron Inc 95.541,41 96.210,00 1,39 USD 5.090 Johnson & Johnson 283.151,79 309.930,10 4,48 USD 5.500 Mc Donald's Corp 304.741,28 313.885,00 4,54 USD 2.000 Medtronic Inc 58.739,85 73.600,00 1,06 USD 4.600 Merck & Co Inc 121.080,09 145.498,00 2,10 USD 2.500 Pepsico Inc 123.499,94 146.650,00 2,12 USD 8.156 Pfizer Inc 141.728,09 134.981,80 1,95 USD 7.000 Procter & Gamble Co 381.014,11 405.440,00 5,86 USD 10.000 SLM Corp 90.925,80 87.200,00 1,26 USD 3.000 Target Corp 126.484,87 140.040,00 2,02 USD 5.500 United Health Group Inc 153.342,13 137.720,00 1,99 USD 2.500 United Technologies Corp 97.796,11 152.325,00 2,20 USD 7.003 Verizon Communications Inc 202.363,10 211.980,81 3,06 USD 5.704 Wal-Mart Stores Inc 292.964,87 280.009,36 4,05
Total actions / Total shares 6.112.577,44 6.443.344,50 93,15
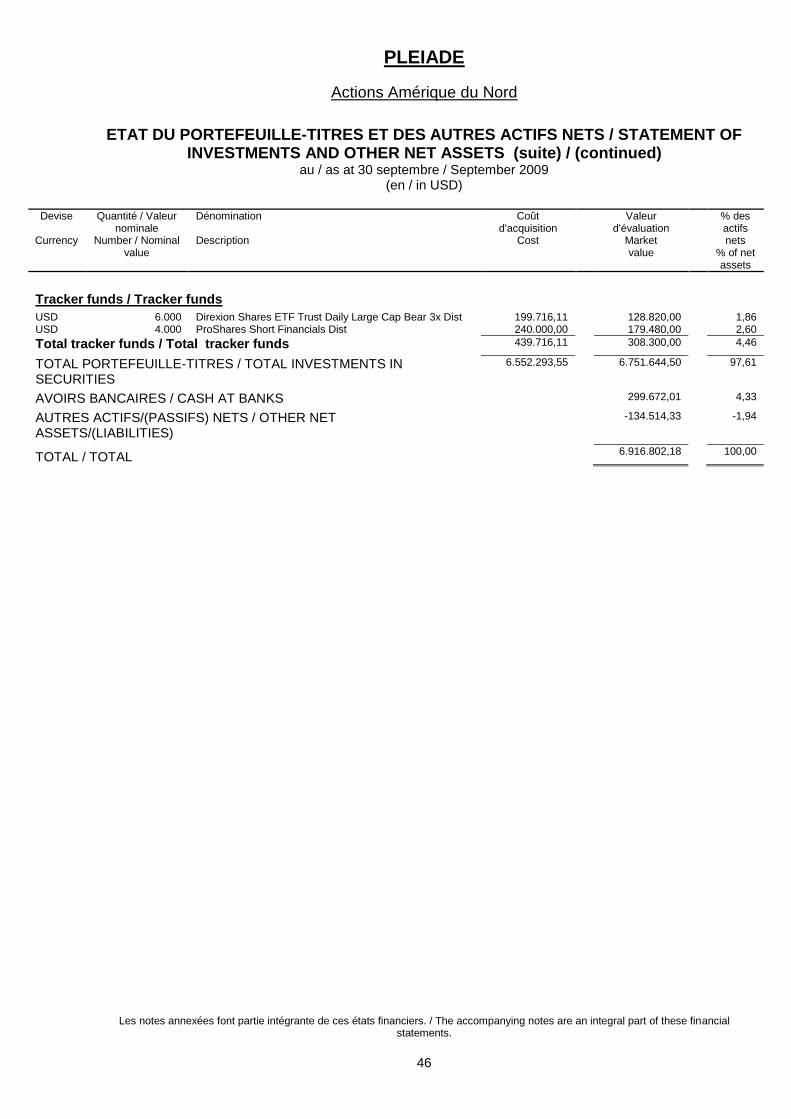
PLEIADE
Actions Amérique du Nord
ETAT DU PORTEFEUILLE-TITRES ET DES AUTRES ACTIFS NETS / STATEMENT OF INVESTMENTS AND OTHER NET ASSETS (suite) / (continued)
au / as at 30 septembre / September 2009 (en / in USD)
Les notes annexées font partie intégrante de ces états financiers. / The accompanying notes are an integral part of these financial statements.
46
Devise
Currency
Quantité / Valeur nominale
Number / Nominal value
Dénomination Description
Coût d'acquisition
Cost
Valeur d'évaluation
Market value
% des actifs nets
% of net assets
Tracker funds / Tracker funds
USD 6.000 Direxion Shares ETF Trust Daily Large Cap Bear 3x Dist 199.716,11 128.820,00 1,86 USD 4.000 ProShares Short Financials Dist 240.000,00 179.480,00 2,60
Total tracker funds / Total tracker funds 439.716,11 308.300,00 4,46
TOTAL PORTEFEUILLE-TITRES / TOTAL INVESTMENTS IN SECURITIES
6.552.293,55 6.751.644,50 97,61
AVOIRS BANCAIRES / CASH AT BANKS 299.672,01 4,33
AUTRES ACTIFS/(PASSIFS) NETS / OTHER NET ASSETS/(LIABILITIES)
-134.514,33 -1,94
TOTAL / TOTAL 6.916.802,18 100,00
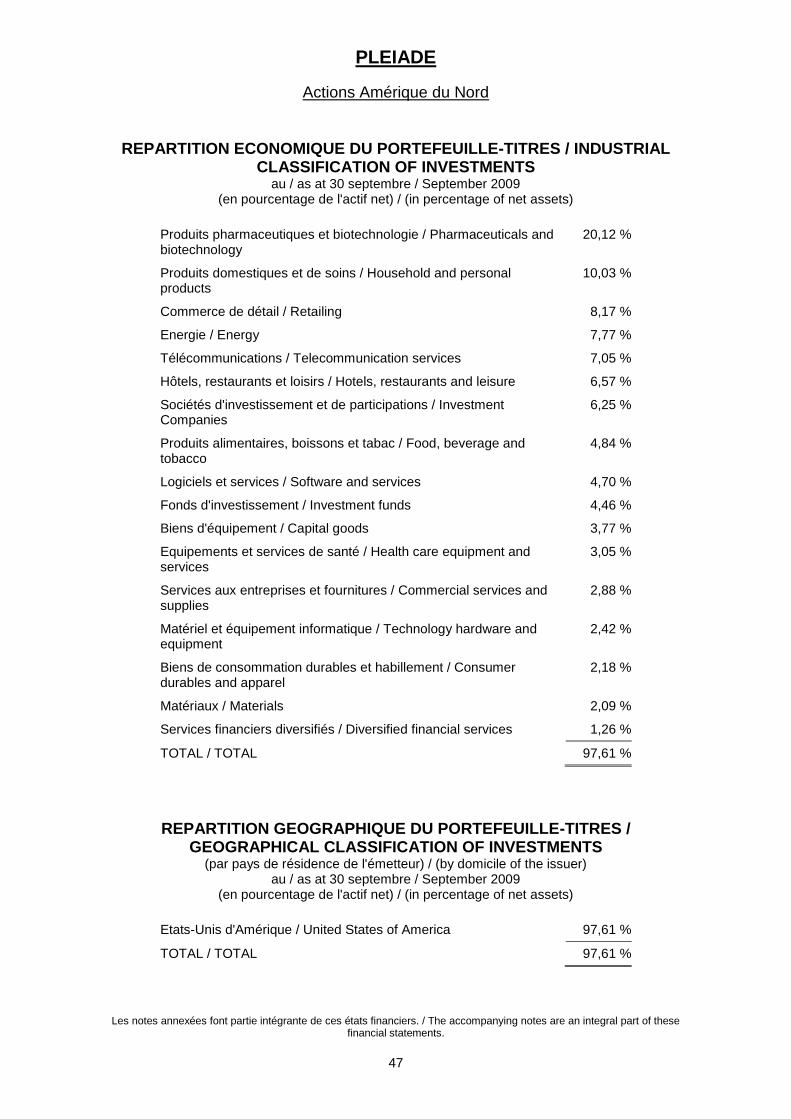
PLEIADE
Actions Amérique du Nord
Les notes annexées font partie intégrante de ces états financiers. / The accompanying notes are an integral part of these financial statements.
47
REPARTITION ECONOMIQUE DU PORTEFEUILLE-TITRES / INDUSTRIAL CLASSIFICATION OF INVESTMENTS
au / as at 30 septembre / September 2009 (en pourcentage de l'actif net) / (in percentage of net assets)
Produits pharmaceutiques et biotechnologie / Pharmaceuticals and biotechnology
20,12 %
Produits domestiques et de soins / Household and personal products
10,03 %
Commerce de détail / Retailing 8,17 %
Energie / Energy 7,77 %
Télécommunications / Telecommunication services 7,05 %
Hôtels, restaurants et loisirs / Hotels, restaurants and leisure 6,57 %
Sociétés d'investissement et de participations / Investment Companies
6,25 %
Produits alimentaires, boissons et tabac / Food, beverage and tobacco
4,84 %
Logiciels et services / Software and services 4,70 %
Fonds d'investissement / Investment funds 4,46 %
Biens d'équipement / Capital goods 3,77 %
Equipements et services de santé / Health care equipment and services
3,05 %
Services aux entreprises et fournitures / Commercial services and supplies
2,88 %
Matériel et équipement informatique / Technology hardware and equipment
2,42 %
Biens de consommation durables et habillement / Consumer durables and apparel
2,18 %
Matériaux / Materials 2,09 %
Services financiers diversifiés / Diversified financial services 1,26 %
TOTAL / TOTAL 97,61 %
REPARTITION GEOGRAPHIQUE DU PORTEFEUILLE-TITRES / GEOGRAPHICAL CLASSIFICATION OF INVESTMENTS
(par pays de résidence de l'émetteur) / (by domicile of the issuer) au / as at 30 septembre / September 2009
(en pourcentage de l'actif net) / (in percentage of net assets)
Etats-Unis d'Amérique / United States of America 97,61 %
TOTAL / TOTAL 97,61 %
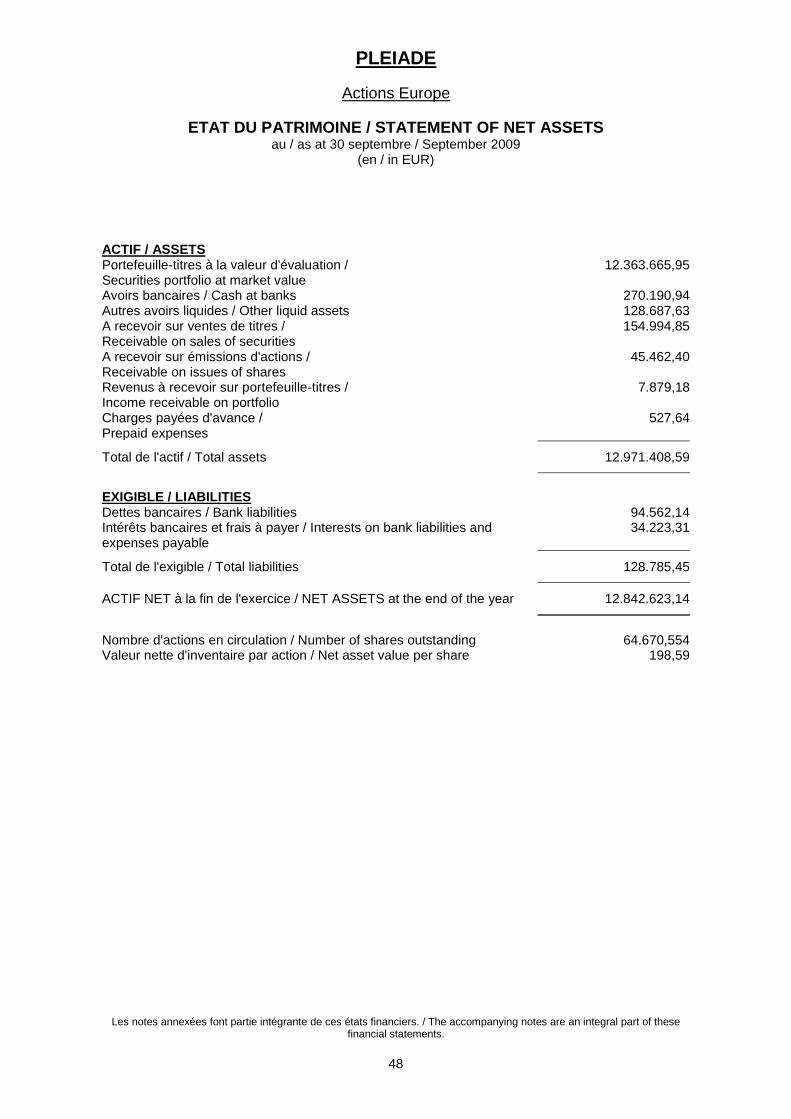
PLEIADE
Actions Europe
ETAT DU PATRIMOINE / STATEMENT OF NET ASSETS au / as at 30 septembre / September 2009
(en / in EUR)
Les notes annexées font partie intégrante de ces états financiers. / The accompanying notes are an integral part of these financial statements.
48
ACTIF / ASSETS Portefeuille-titres à la valeur d'évaluation / Securities portfolio at market value
12.363.665,95
Avoirs bancaires / Cash at banks 270.190,94 Autres avoirs liquides / Other liquid assets 128.687,63 A recevoir sur ventes de titres / Receivable on sales of securities
154.994,85
A recevoir sur émissions d'actions / Receivable on issues of shares
45.462,40
Revenus à recevoir sur portefeuille-titres / Income receivable on portfolio
7.879,18
Charges payées d'avance / Prepaid expenses
527,64
Total de l'actif / Total assets 12.971.408,59
EXIGIBLE / LIABILITIES Dettes bancaires / Bank liabilities 94.562,14 Intérêts bancaires et frais à payer / Interests on bank liabilities and expenses payable
34.223,31
Total de l'exigible / Total liabilities 128.785,45
ACTIF NET à la fin de l'exercice / NET ASSETS at the end of the year 12.842.623,14
Nombre d'actions en circulation / Number of shares outstanding 64.670,554 Valeur nette d'inventaire par action / Net asset value per share 198,59
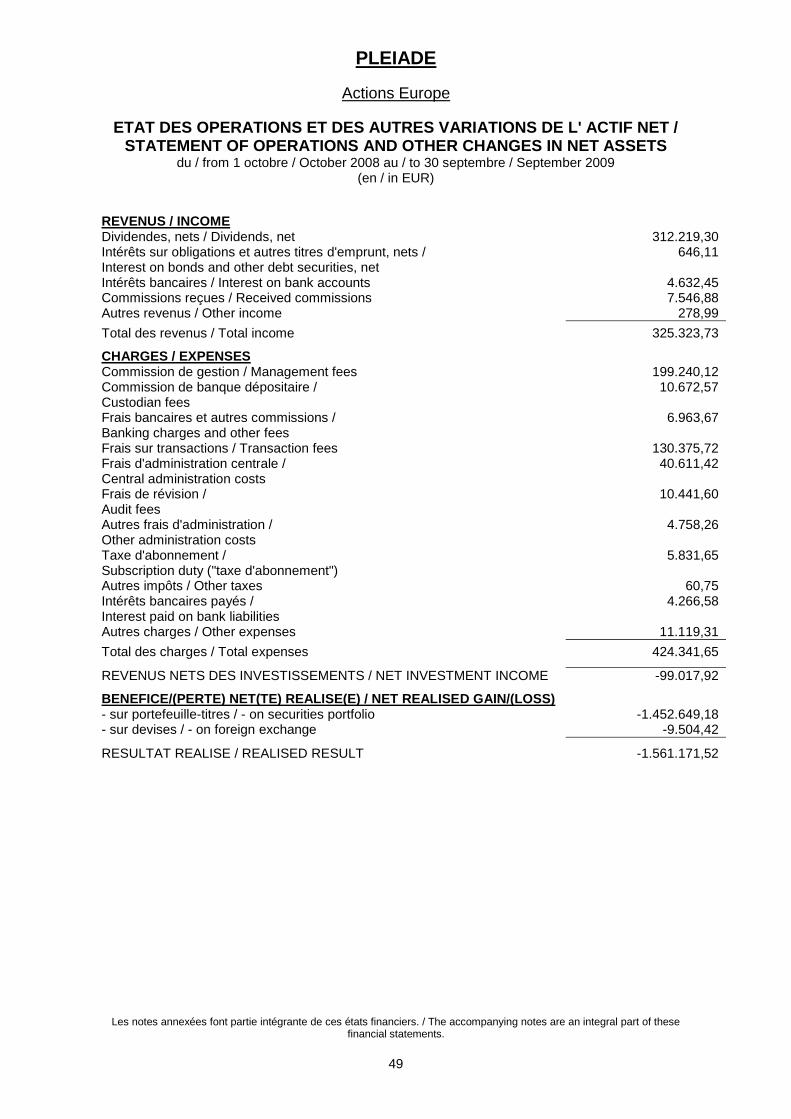
PLEIADE
Actions Europe
ETAT DES OPERATIONS ET DES AUTRES VARIATIONS DE L' ACTIF NET / STATEMENT OF OPERATIONS AND OTHER CHANGES IN NET ASSETS
du / from 1 octobre / October 2008 au / to 30 septembre / September 2009 (en / in EUR)
Les notes annexées font partie intégrante de ces états financiers. / The accompanying notes are an integral part of these financial statements.
49
REVENUS / INCOME Dividendes, nets / Dividends, net 312.219,30 Intérêts sur obligations et autres titres d'emprunt, nets / Interest on bonds and other debt securities, net
646,11
Intérêts bancaires / Interest on bank accounts 4.632,45 Commissions reçues / Received commissions 7.546,88 Autres revenus / Other income 278,99
Total des revenus / Total income 325.323,73
CHARGES / EXPENSES Commission de gestion / Management fees 199.240,12 Commission de banque dépositaire / Custodian fees
10.672,57
Frais bancaires et autres commissions / Banking charges and other fees
6.963,67
Frais sur transactions / Transaction fees 130.375,72 Frais d'administration centrale / Central administration costs
40.611,42
Frais de révision / Audit fees
10.441,60
Autres frais d'administration / Other administration costs
4.758,26
Taxe d'abonnement / Subscription duty ("taxe d'abonnement")
5.831,65
Autres impôts / Other taxes 60,75 Intérêts bancaires payés / Interest paid on bank liabilities
4.266,58
Autres charges / Other expenses 11.119,31
Total des charges / Total expenses 424.341,65
REVENUS NETS DES INVESTISSEMENTS / NET INVESTMENT INCOME -99.017,92
BENEFICE/(PERTE) NET(TE) REALISE(E) / NET REALISED GAIN/(LOSS) - sur portefeuille-titres / - on securities portfolio -1.452.649,18 - sur devises / - on foreign exchange -9.504,42
RESULTAT REALISE / REALISED RESULT -1.561.171,52
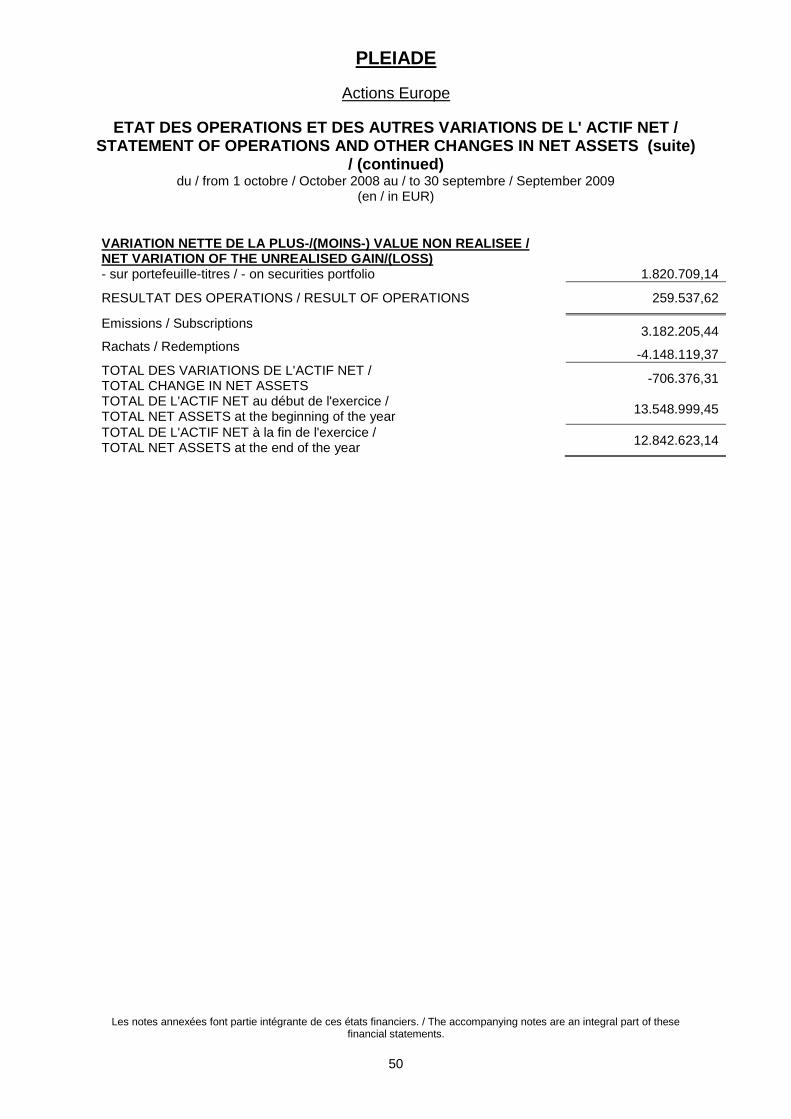
PLEIADE
Actions Europe
ETAT DES OPERATIONS ET DES AUTRES VARIATIONS DE L' ACTIF NET / STATEMENT OF OPERATIONS AND OTHER CHANGES IN NET ASSETS (suite)
/ (continued) du / from 1 octobre / October 2008 au / to 30 septembre / September 2009
(en / in EUR)
Les notes annexées font partie intégrante de ces états financiers. / The accompanying notes are an integral part of these financial statements.
50
VARIATION NETTE DE LA PLUS-/(MOINS-) VALUE NON REALISEE / NET VARIATION OF THE UNREALISED GAIN/(LOSS)
- sur portefeuille-titres / - on securities portfolio 1.820.709,14
RESULTAT DES OPERATIONS / RESULT OF OPERATIONS 259.537,62
Emissions / Subscriptions 3.182.205,44
Rachats / Redemptions -4.148.119,37
TOTAL DES VARIATIONS DE L'ACTIF NET / TOTAL CHANGE IN NET ASSETS
-706.376,31
TOTAL DE L'ACTIF NET au début de l'exercice / TOTAL NET ASSETS at the beginning of the year
13.548.999,45
TOTAL DE L'ACTIF NET à la fin de l'exercice / TOTAL NET ASSETS at the end of the year
12.842.623,14
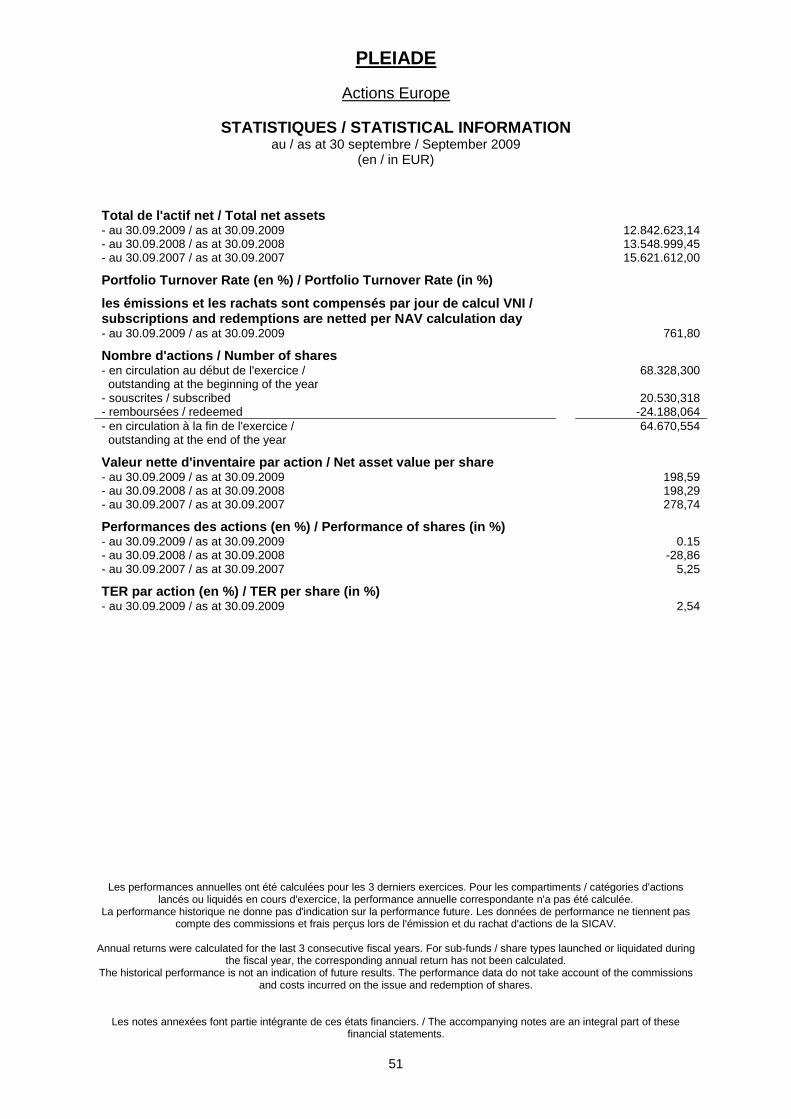
PLEIADE
Actions Europe
STATISTIQUES / STATISTICAL INFORMATION au / as at 30 septembre / September 2009
(en / in EUR)
Les performances annuelles ont été calculées pour les 3 derniers exercices. Pour les compartiments / catégories d'actions lancés ou liquidés en cours d'exercice, la performance annuelle correspondante n'a pas été calculée.
La performance historique ne donne pas d'indication sur la performance future. Les données de performance ne tiennent pas compte des commissions et frais perçus lors de l'émission et du rachat d'actions de la SICAV.
Annual returns were calculated for the last 3 consecutive fiscal years. For sub-funds / share types launched or liquidated during
the fiscal year, the corresponding annual return has not been calculated. The historical performance is not an indication of future results. The performance data do not take account of the commissions
and costs incurred on the issue and redemption of shares.
Les notes annexées font partie intégrante de ces états financiers. / The accompanying notes are an integral part of these financial statements.
51
Total de l'actif net / Total net assets
- au 30.09.2009 / as at 30.09.2009 12.842.623,14 - au 30.09.2008 / as at 30.09.2008 13.548.999,45 - au 30.09.2007 / as at 30.09.2007 15.621.612,00
Portfolio Turnover Rate (en %) / Portfolio Turnover Rate (in %)
les émissions et les rachats sont compensés par jour de calcul VNI / subscriptions and redemptions are netted per NAV calculation day
- au 30.09.2009 / as at 30.09.2009 761,80
Nombre d'actions / Number of shares
- en circulation au début de l'exercice / outstanding at the beginning of the year
68.328,300
- souscrites / subscribed 20.530,318 - remboursées / redeemed -24.188,064
- en circulation à la fin de l'exercice / outstanding at the end of the year
64.670,554
Valeur nette d'inventaire par action / Net asset value per share
- au 30.09.2009 / as at 30.09.2009 198,59 - au 30.09.2008 / as at 30.09.2008 198,29 - au 30.09.2007 / as at 30.09.2007 278,74
Performances des actions (en %) / Performance of shares (in %)
- au 30.09.2009 / as at 30.09.2009 0.15 - au 30.09.2008 / as at 30.09.2008 -28,86 - au 30.09.2007 / as at 30.09.2007 5,25
TER par action (en %) / TER per share (in %)
- au 30.09.2009 / as at 30.09.2009 2,54
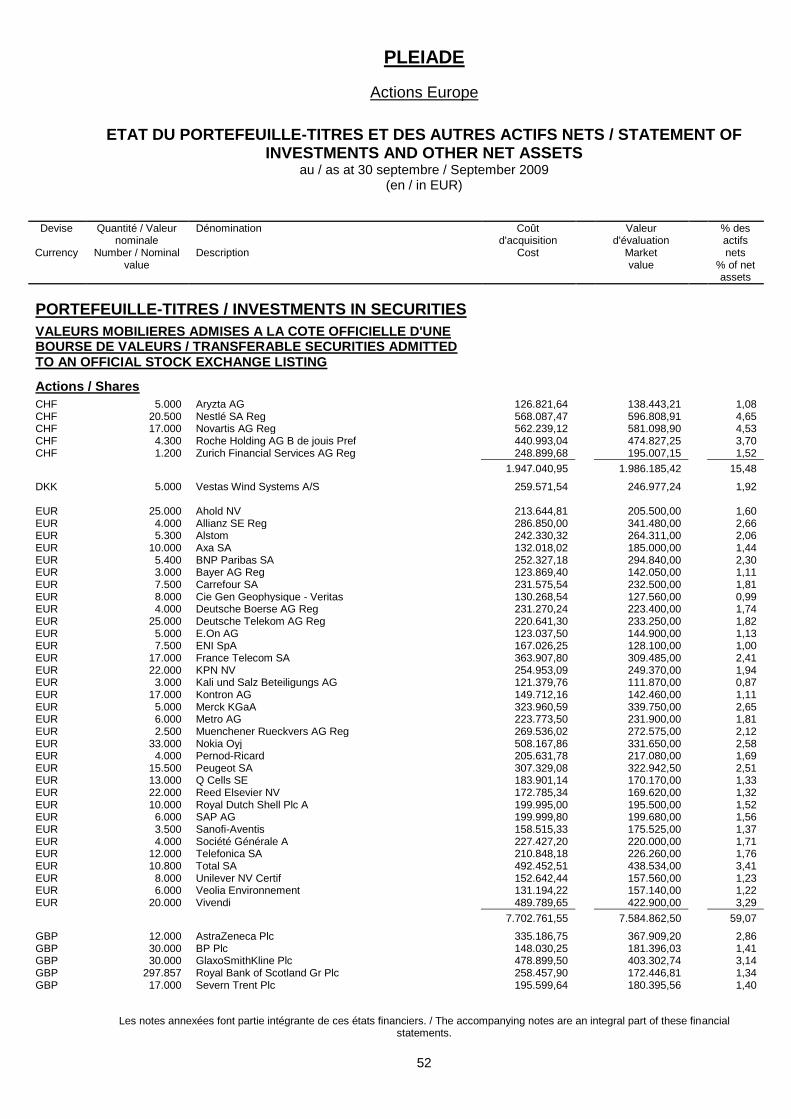
PLEIADE
Actions Europe
ETAT DU PORTEFEUILLE-TITRES ET DES AUTRES ACTIFS NETS / STATEMENT OF INVESTMENTS AND OTHER NET ASSETS
au / as at 30 septembre / September 2009 (en / in EUR)
Les notes annexées font partie intégrante de ces états financiers. / The accompanying notes are an integral part of these financial statements.
52
Devise
Currency
Quantité / Valeur nominale
Number / Nominal value
Dénomination Description
Coût d'acquisition
Cost
Valeur d'évaluation
Market value
% des actifs nets
% of net assets
PORTEFEUILLE-TITRES / INVESTMENTS IN SECURITIES
VALEURS MOBILIERES ADMISES A LA COTE OFFICIELLE D'UNE BOURSE DE VALEURS / TRANSFERABLE SECURITIES ADMITTED TO AN OFFICIAL STOCK EXCHANGE LISTING
Actions / Shares
CHF 5.000 Aryzta AG 126.821,64 138.443,21 1,08 CHF 20.500 Nestlé SA Reg 568.087,47 596.808,91 4,65 CHF 17.000 Novartis AG Reg 562.239,12 581.098,90 4,53 CHF 4.300 Roche Holding AG B de jouis Pref 440.993,04 474.827,25 3,70 CHF 1.200 Zurich Financial Services AG Reg 248.899,68 195.007,15 1,52
1.947.040,95 1.986.185,42 15,48
DKK 5.000 Vestas Wind Systems A/S 259.571,54 246.977,24 1,92 EUR 25.000 Ahold NV 213.644,81 205.500,00 1,60 EUR 4.000 Allianz SE Reg 286.850,00 341.480,00 2,66 EUR 5.300 Alstom 242.330,32 264.311,00 2,06 EUR 10.000 Axa SA 132.018,02 185.000,00 1,44 EUR 5.400 BNP Paribas SA 252.327,18 294.840,00 2,30 EUR 3.000 Bayer AG Reg 123.869,40 142.050,00 1,11 EUR 7.500 Carrefour SA 231.575,54 232.500,00 1,81 EUR 8.000 Cie Gen Geophysique - Veritas 130.268,54 127.560,00 0,99 EUR 4.000 Deutsche Boerse AG Reg 231.270,24 223.400,00 1,74 EUR 25.000 Deutsche Telekom AG Reg 220.641,30 233.250,00 1,82 EUR 5.000 E.On AG 123.037,50 144.900,00 1,13 EUR 7.500 ENI SpA 167.026,25 128.100,00 1,00 EUR 17.000 France Telecom SA 363.907,80 309.485,00 2,41 EUR 22.000 KPN NV 254.953,09 249.370,00 1,94 EUR 3.000 Kali und Salz Beteiligungs AG 121.379,76 111.870,00 0,87 EUR 17.000 Kontron AG 149.712,16 142.460,00 1,11 EUR 5.000 Merck KGaA 323.960,59 339.750,00 2,65 EUR 6.000 Metro AG 223.773,50 231.900,00 1,81 EUR 2.500 Muenchener Rueckvers AG Reg 269.536,02 272.575,00 2,12 EUR 33.000 Nokia Oyj 508.167,86 331.650,00 2,58 EUR 4.000 Pernod-Ricard 205.631,78 217.080,00 1,69 EUR 15.500 Peugeot SA 307.329,08 322.942,50 2,51 EUR 13.000 Q Cells SE 183.901,14 170.170,00 1,33 EUR 22.000 Reed Elsevier NV 172.785,34 169.620,00 1,32 EUR 10.000 Royal Dutch Shell Plc A 199.995,00 195.500,00 1,52 EUR 6.000 SAP AG 199.999,80 199.680,00 1,56 EUR 3.500 Sanofi-Aventis 158.515,33 175.525,00 1,37 EUR 4.000 Société Générale A 227.427,20 220.000,00 1,71 EUR 12.000 Telefonica SA 210.848,18 226.260,00 1,76 EUR 10.800 Total SA 492.452,51 438.534,00 3,41 EUR 8.000 Unilever NV Certif 152.642,44 157.560,00 1,23 EUR 6.000 Veolia Environnement 131.194,22 157.140,00 1,22 EUR 20.000 Vivendi 489.789,65 422.900,00 3,29
7.702.761,55 7.584.862,50 59,07
GBP 12.000 AstraZeneca Plc 335.186,75 367.909,20 2,86 GBP 30.000 BP Plc 148.030,25 181.396,03 1,41 GBP 30.000 GlaxoSmithKline Plc 478.899,50 403.302,74 3,14 GBP 297.857 Royal Bank of Scotland Gr Plc 258.457,90 172.446,81 1,34 GBP 17.000 Severn Trent Plc 195.599,64 180.395,56 1,40
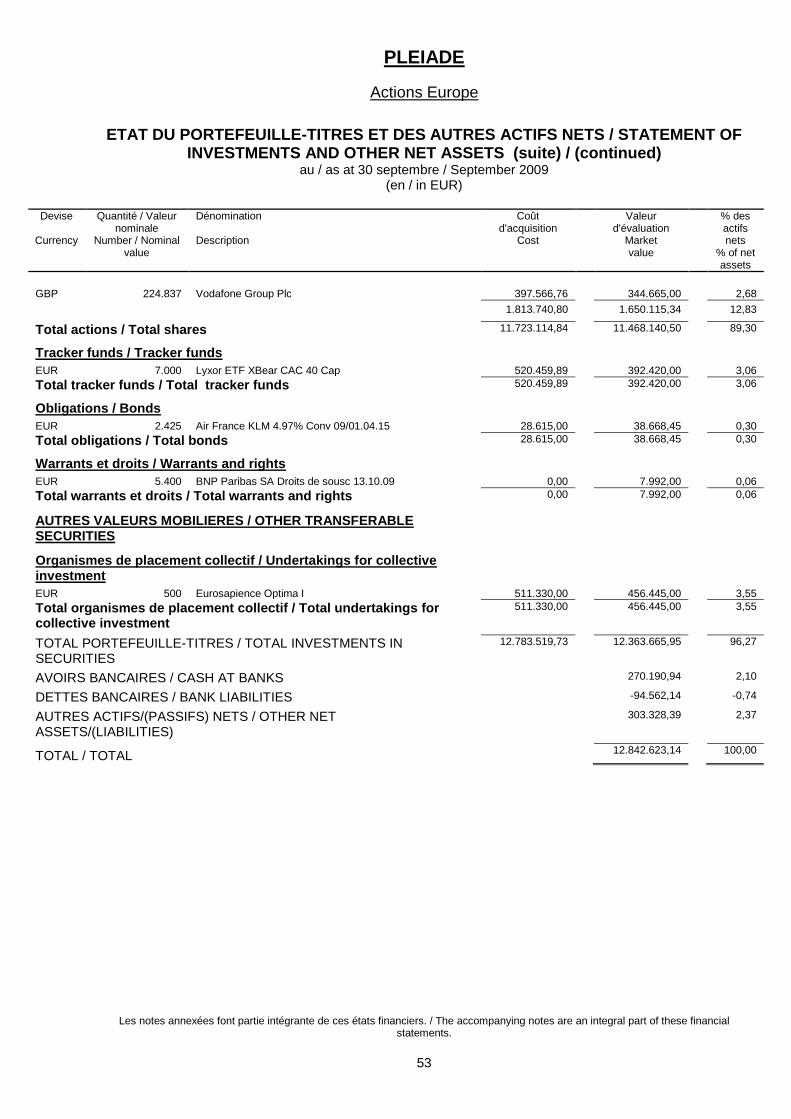
PLEIADE
Actions Europe
ETAT DU PORTEFEUILLE-TITRES ET DES AUTRES ACTIFS NETS / STATEMENT OF INVESTMENTS AND OTHER NET ASSETS (suite) / (continued)
au / as at 30 septembre / September 2009 (en / in EUR)
Les notes annexées font partie intégrante de ces états financiers. / The accompanying notes are an integral part of these financial statements.
53
Devise
Currency
Quantité / Valeur nominale
Number / Nominal value
Dénomination Description
Coût d'acquisition
Cost
Valeur d'évaluation
Market value
% des actifs nets
% of net assets
GBP 224.837 Vodafone Group Plc 397.566,76 344.665,00 2,68
1.813.740,80 1.650.115,34 12,83
Total actions / Total shares 11.723.114,84 11.468.140,50 89,30
Tracker funds / Tracker funds
EUR 7.000 Lyxor ETF XBear CAC 40 Cap 520.459,89 392.420,00 3,06
Total tracker funds / Total tracker funds 520.459,89 392.420,00 3,06
Obligations / Bonds
EUR 2.425 Air France KLM 4.97% Conv 09/01.04.15 28.615,00 38.668,45 0,30
Total obligations / Total bonds 28.615,00 38.668,45 0,30
Warrants et droits / Warrants and rights
EUR 5.400 BNP Paribas SA Droits de sousc 13.10.09 0,00 7.992,00 0,06
Total warrants et droits / Total warrants and rights 0,00 7.992,00 0,06
AUTRES VALEURS MOBILIERES / OTHER TRANSFERABLE SECURITIES
Organismes de placement collectif / Undertakings for collective investment
EUR 500 Eurosapience Optima I 511.330,00 456.445,00 3,55
Total organismes de placement collectif / Total undertakings for collective investment
511.330,00 456.445,00 3,55
TOTAL PORTEFEUILLE-TITRES / TOTAL INVESTMENTS IN SECURITIES
12.783.519,73 12.363.665,95 96,27
AVOIRS BANCAIRES / CASH AT BANKS 270.190,94 2,10
DETTES BANCAIRES / BANK LIABILITIES -94.562,14 -0,74
AUTRES ACTIFS/(PASSIFS) NETS / OTHER NET ASSETS/(LIABILITIES)
303.328,39 2,37
TOTAL / TOTAL 12.842.623,14 100,00
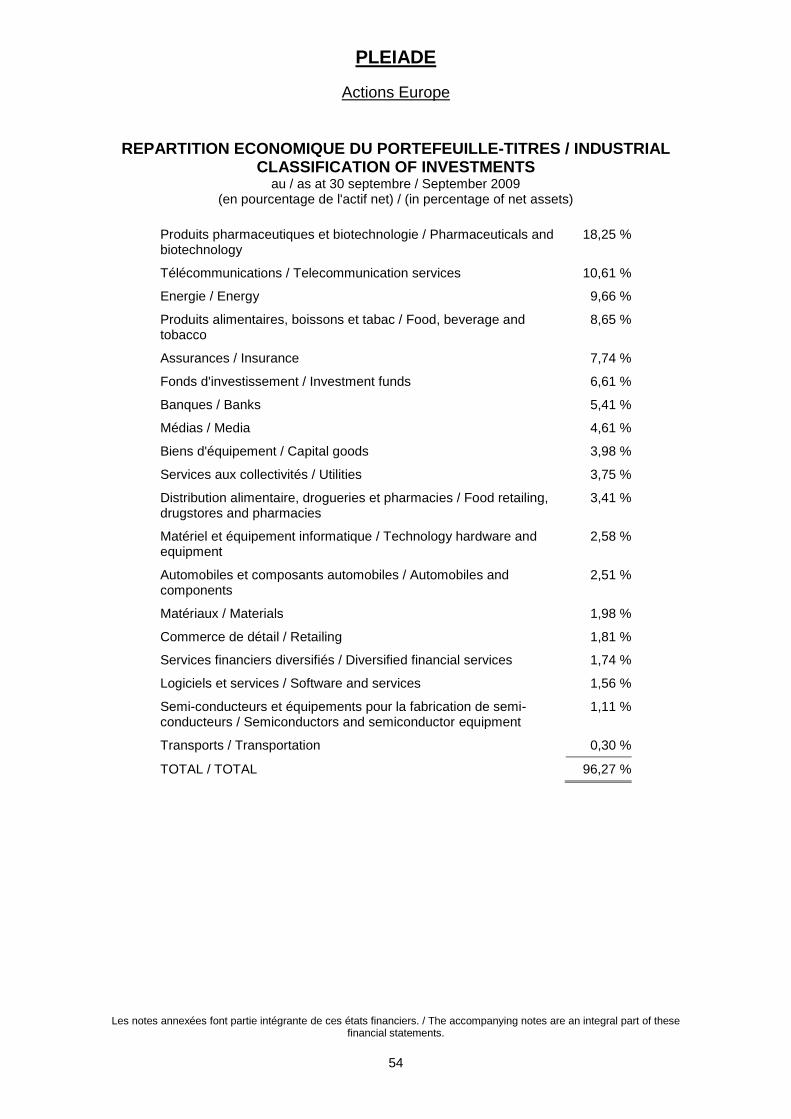
PLEIADE
Actions Europe
Les notes annexées font partie intégrante de ces états financiers. / The accompanying notes are an integral part of these financial statements.
54
REPARTITION ECONOMIQUE DU PORTEFEUILLE-TITRES / INDUSTRIAL CLASSIFICATION OF INVESTMENTS
au / as at 30 septembre / September 2009 (en pourcentage de l'actif net) / (in percentage of net assets)
Produits pharmaceutiques et biotechnologie / Pharmaceuticals and biotechnology
18,25 %
Télécommunications / Telecommunication services 10,61 %
Energie / Energy 9,66 %
Produits alimentaires, boissons et tabac / Food, beverage and tobacco
8,65 %
Assurances / Insurance 7,74 %
Fonds d'investissement / Investment funds 6,61 %
Banques / Banks 5,41 %
Médias / Media 4,61 %
Biens d'équipement / Capital goods 3,98 %
Services aux collectivités / Utilities 3,75 %
Distribution alimentaire, drogueries et pharmacies / Food retailing, drugstores and pharmacies
3,41 %
Matériel et équipement informatique / Technology hardware and equipment
2,58 %
Automobiles et composants automobiles / Automobiles and components
2,51 %
Matériaux / Materials 1,98 %
Commerce de détail / Retailing 1,81 %
Services financiers diversifiés / Diversified financial services 1,74 %
Logiciels et services / Software and services 1,56 %
Semi-conducteurs et équipements pour la fabrication de semi-conducteurs / Semiconductors and semiconductor equipment
1,11 %
Transports / Transportation 0,30 %
TOTAL / TOTAL 96,27 %
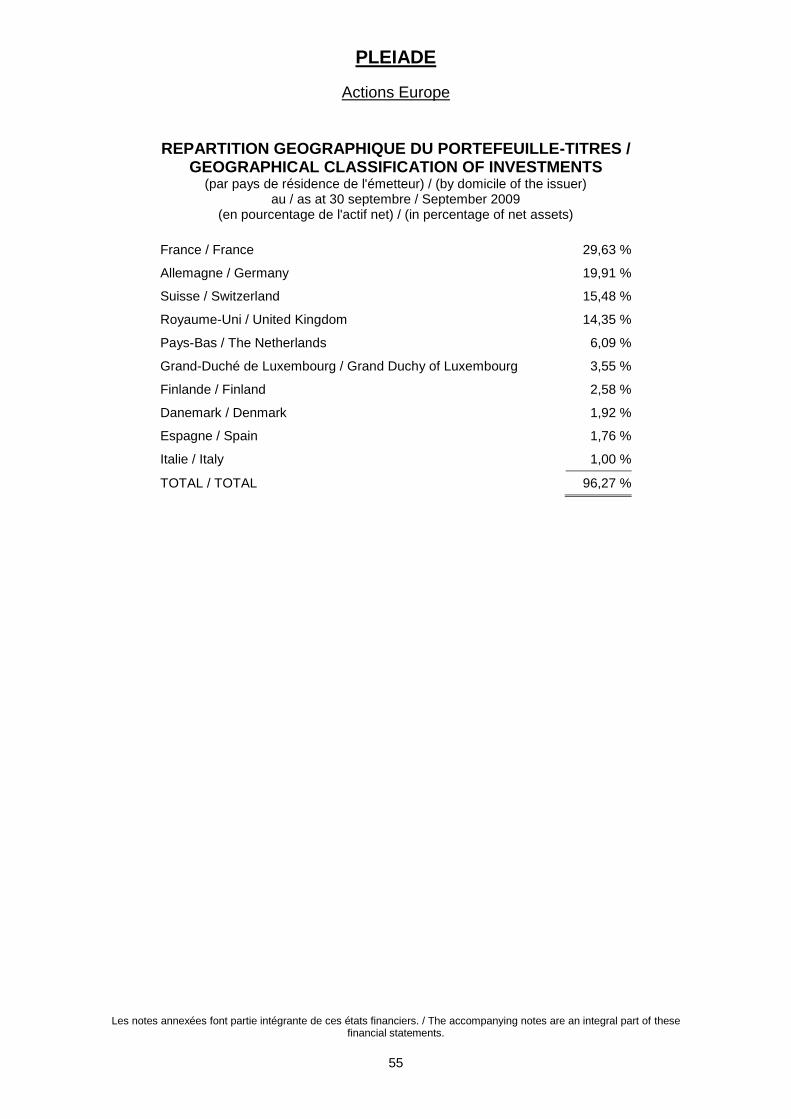
PLEIADE
Actions Europe
Les notes annexées font partie intégrante de ces états financiers. / The accompanying notes are an integral part of these financial statements.
55
REPARTITION GEOGRAPHIQUE DU PORTEFEUILLE-TITRES / GEOGRAPHICAL CLASSIFICATION OF INVESTMENTS
(par pays de résidence de l'émetteur) / (by domicile of the issuer) au / as at 30 septembre / September 2009
(en pourcentage de l'actif net) / (in percentage of net assets)
France / France 29,63 %
Allemagne / Germany 19,91 %
Suisse / Switzerland 15,48 %
Royaume-Uni / United Kingdom 14,35 %
Pays-Bas / The Netherlands 6,09 %
Grand-Duché de Luxembourg / Grand Duchy of Luxembourg 3,55 %
Finlande / Finland 2,58 %
Danemark / Denmark 1,92 %
Espagne / Spain 1,76 %
Italie / Italy 1,00 %
TOTAL / TOTAL 96,27 %

PLEIADE
Asie et Bassin du Pacifique
ETAT DU PATRIMOINE / STATEMENT OF NET ASSETS au / as at 30 septembre / September 2009
(en / in USD)
Les notes annexées font partie intégrante de ces états financiers. / The accompanying notes are an integral part of these financial statements.
56
ACTIF / ASSETS Portefeuille-titres à la valeur d'évaluation / Securities portfolio at market value
5.879.233,97
Avoirs bancaires / Cash at banks 312.184,05 A recevoir sur émissions d'actions / Receivable on issues of shares
109,95
Revenus à recevoir sur portefeuille-titres / Income receivable on portfolio
6.683,90
Charges payées d'avance / Prepaid expenses
244,96
Total de l'actif / Total assets 6.198.456,83
EXIGIBLE / LIABILITIES Intérêts bancaires et frais à payer / Interests on bank liabilities and expenses payable
21.003,85
Total de l'exigible / Total liabilities 21.003,85
ACTIF NET à la fin de l'exercice / NET ASSETS at the end of the year 6.177.452,98
Nombre d'actions en circulation / Number of shares outstanding 79.760,870 Valeur nette d'inventaire par action / Net asset value per share 77,45
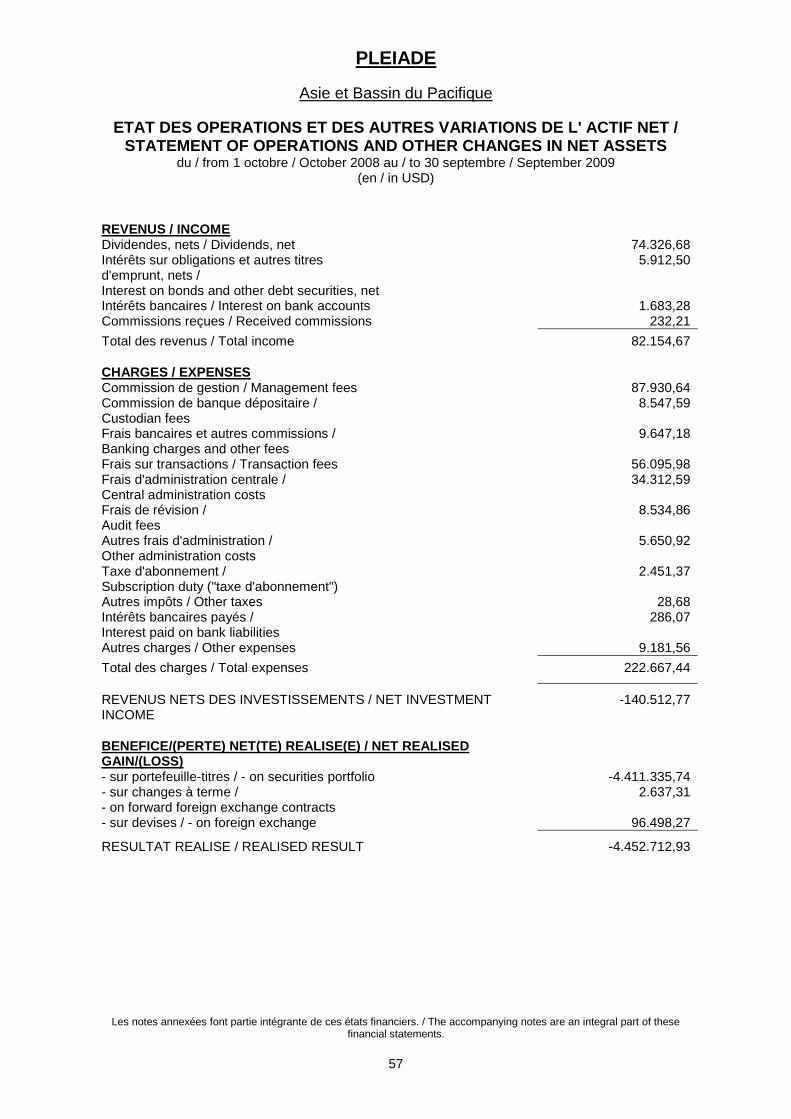
PLEIADE
Asie et Bassin du Pacifique
ETAT DES OPERATIONS ET DES AUTRES VARIATIONS DE L' ACTIF NET / STATEMENT OF OPERATIONS AND OTHER CHANGES IN NET ASSETS
du / from 1 octobre / October 2008 au / to 30 septembre / September 2009 (en / in USD)
Les notes annexées font partie intégrante de ces états financiers. / The accompanying notes are an integral part of these financial statements.
57
REVENUS / INCOME Dividendes, nets / Dividends, net 74.326,68 Intérêts sur obligations et autres titres d'emprunt, nets / Interest on bonds and other debt securities, net
5.912,50
Intérêts bancaires / Interest on bank accounts 1.683,28 Commissions reçues / Received commissions 232,21
Total des revenus / Total income 82.154,67
CHARGES / EXPENSES Commission de gestion / Management fees 87.930,64 Commission de banque dépositaire / Custodian fees
8.547,59
Frais bancaires et autres commissions / Banking charges and other fees
9.647,18
Frais sur transactions / Transaction fees 56.095,98 Frais d'administration centrale / Central administration costs
34.312,59
Frais de révision / Audit fees
8.534,86
Autres frais d'administration / Other administration costs
5.650,92
Taxe d'abonnement / Subscription duty ("taxe d'abonnement")
2.451,37
Autres impôts / Other taxes 28,68 Intérêts bancaires payés / Interest paid on bank liabilities
286,07
Autres charges / Other expenses 9.181,56
Total des charges / Total expenses 222.667,44
REVENUS NETS DES INVESTISSEMENTS / NET INVESTMENT INCOME
-140.512,77
BENEFICE/(PERTE) NET(TE) REALISE(E) / NET REALISED GAIN/(LOSS)
- sur portefeuille-titres / - on securities portfolio -4.411.335,74 - sur changes à terme / - on forward foreign exchange contracts
2.637,31
- sur devises / - on foreign exchange 96.498,27
RESULTAT REALISE / REALISED RESULT -4.452.712,93
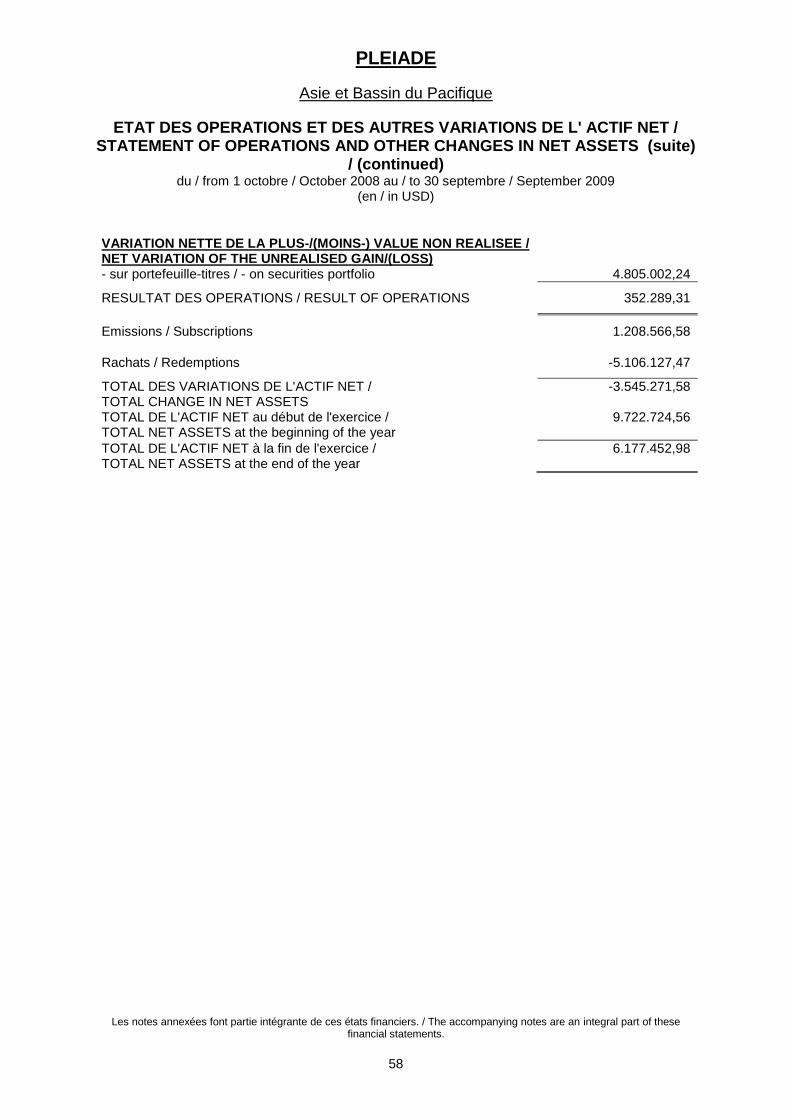
PLEIADE
Asie et Bassin du Pacifique
ETAT DES OPERATIONS ET DES AUTRES VARIATIONS DE L' ACTIF NET / STATEMENT OF OPERATIONS AND OTHER CHANGES IN NET ASSETS (suite)
/ (continued) du / from 1 octobre / October 2008 au / to 30 septembre / September 2009
(en / in USD)
Les notes annexées font partie intégrante de ces états financiers. / The accompanying notes are an integral part of these financial statements.
58
VARIATION NETTE DE LA PLUS-/(MOINS-) VALUE NON REALISEE / NET VARIATION OF THE UNREALISED GAIN/(LOSS)
- sur portefeuille-titres / - on securities portfolio 4.805.002,24
RESULTAT DES OPERATIONS / RESULT OF OPERATIONS 352.289,31
Emissions / Subscriptions 1.208.566,58
Rachats / Redemptions -5.106.127,47
TOTAL DES VARIATIONS DE L'ACTIF NET / TOTAL CHANGE IN NET ASSETS
-3.545.271,58
TOTAL DE L'ACTIF NET au début de l'exercice / TOTAL NET ASSETS at the beginning of the year
9.722.724,56
TOTAL DE L'ACTIF NET à la fin de l'exercice / TOTAL NET ASSETS at the end of the year
6.177.452,98

PLEIADE
Asie et Bassin du Pacifique
STATISTIQUES / STATISTICAL INFORMATION au / as at 30 septembre / September 2009
(en / in USD)
Les performances annuelles ont été calculées pour les 3 derniers exercices. Pour les compartiments / catégories d'actions lancés ou liquidés en cours d'exercice, la performance annuelle correspondante n'a pas été calculée.
La performance historique ne donne pas d'indication sur la performance future. Les données de performance ne tiennent pas compte des commissions et frais perçus lors de l'émission et du rachat d'actions de la SICAV.
Annual returns were calculated for the last 3 consecutive fiscal years. For sub-funds / share types launched or liquidated during
the fiscal year, the corresponding annual return has not been calculated. The historical performance is not an indication of future results. The performance data do not take account of the commissions
and costs incurred on the issue and redemption of shares.
Les notes annexées font partie intégrante de ces états financiers. / The accompanying notes are an integral part of these financial statements.
59
Total de l'actif net / Total net assets
- au 30.09.2009 / as at 30.09.2009 6.177.452,98 - au 30.09.2008 / as at 30.09.2008 9.722.724,56 - au 30.09.2007 / as at 30.09.2007 21.719.099,28
Portfolio Turnover Rate (en %) / Portfolio Turnover Rate (in %)
les émissions et les rachats sont compensés par jour de calcul VNI / subscriptions and redemptions are netted per NAV calculation day
- au 30.09.2009 / as at 30.09.2009 42,09
Nombre d'actions / Number of shares
- en circulation au début de l'exercice / outstanding at the beginning of the year
173.512,024
- souscrites / subscribed 27.319,045 - remboursées / redeemed -121.070,199
- en circulation à la fin de l'exercice / outstanding at the end of the year
79.760,870
Valeur nette d'inventaire par action / Net asset value per share
- au 30.09.2009 / as at 30.09.2009 77,45 - au 30.09.2008 / as at 30.09.2008 56,03 - au 30.09.2007 / as at 30.09.2007 101,00
Performances des actions (en %) / Performance of shares (in %)
- au 30.09.2009 / as at 30.09.2009 38.23 - au 30.09.2008 / as at 30.09.2008 -44,52 - au 30.09.2007 / as at 30.09.2007 19,12
TER par action (en %) / TER per share (in %)
- au 30.09.2009 / as at 30.09.2009 3,32
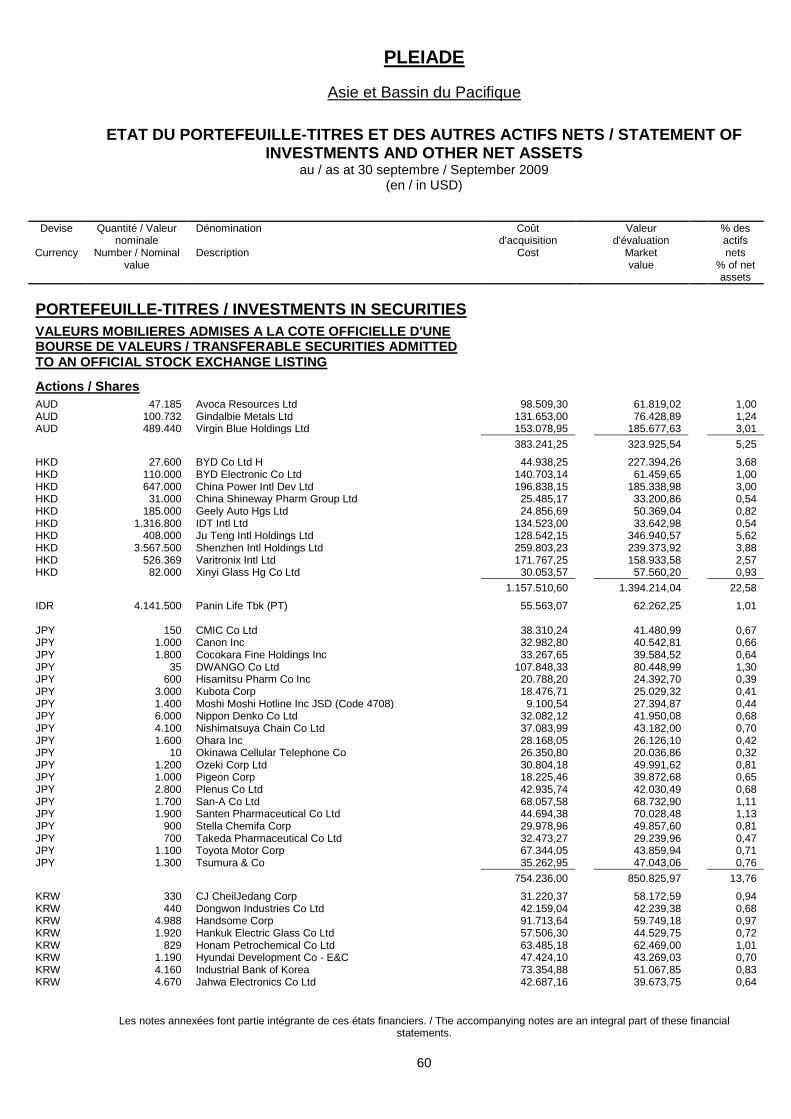
PLEIADE
Asie et Bassin du Pacifique
ETAT DU PORTEFEUILLE-TITRES ET DES AUTRES ACTIFS NETS / STATEMENT OF INVESTMENTS AND OTHER NET ASSETS
au / as at 30 septembre / September 2009 (en / in USD)
Les notes annexées font partie intégrante de ces états financiers. / The accompanying notes are an integral part of these financial statements.
60
Devise
Currency
Quantité / Valeur nominale
Number / Nominal value
Dénomination Description
Coût d'acquisition
Cost
Valeur d'évaluation
Market value
% des actifs nets
% of net assets
PORTEFEUILLE-TITRES / INVESTMENTS IN SECURITIES
VALEURS MOBILIERES ADMISES A LA COTE OFFICIELLE D'UNE BOURSE DE VALEURS / TRANSFERABLE SECURITIES ADMITTED TO AN OFFICIAL STOCK EXCHANGE LISTING
Actions / Shares
AUD 47.185 Avoca Resources Ltd 98.509,30 61.819,02 1,00 AUD 100.732 Gindalbie Metals Ltd 131.653,00 76.428,89 1,24 AUD 489.440 Virgin Blue Holdings Ltd 153.078,95 185.677,63 3,01
383.241,25 323.925,54 5,25
HKD 27.600 BYD Co Ltd H 44.938,25 227.394,26 3,68 HKD 110.000 BYD Electronic Co Ltd 140.703,14 61.459,65 1,00 HKD 647.000 China Power Intl Dev Ltd 196.838,15 185.338,98 3,00 HKD 31.000 China Shineway Pharm Group Ltd 25.485,17 33.200,86 0,54 HKD 185.000 Geely Auto Hgs Ltd 24.856,69 50.369,04 0,82 HKD 1.316.800 IDT Intl Ltd 134.523,00 33.642,98 0,54 HKD 408.000 Ju Teng Intl Holdings Ltd 128.542,15 346.940,57 5,62 HKD 3.567.500 Shenzhen Intl Holdings Ltd 259.803,23 239.373,92 3,88 HKD 526.369 Varitronix Intl Ltd 171.767,25 158.933,58 2,57 HKD 82.000 Xinyi Glass Hg Co Ltd 30.053,57 57.560,20 0,93
1.157.510,60 1.394.214,04 22,58
IDR 4.141.500 Panin Life Tbk (PT) 55.563,07 62.262,25 1,01 JPY 150 CMIC Co Ltd 38.310,24 41.480,99 0,67 JPY 1.000 Canon Inc 32.982,80 40.542,81 0,66 JPY 1.800 Cocokara Fine Holdings Inc 33.267,65 39.584,52 0,64 JPY 35 DWANGO Co Ltd 107.848,33 80.448,99 1,30 JPY 600 Hisamitsu Pharm Co Inc 20.788,20 24.392,70 0,39 JPY 3.000 Kubota Corp 18.476,71 25.029,32 0,41 JPY 1.400 Moshi Moshi Hotline Inc JSD (Code 4708) 9.100,54 27.394,87 0,44 JPY 6.000 Nippon Denko Co Ltd 32.082,12 41.950,08 0,68 JPY 4.100 Nishimatsuya Chain Co Ltd 37.083,99 43.182,00 0,70 JPY 1.600 Ohara Inc 28.168,05 26.126,10 0,42 JPY 10 Okinawa Cellular Telephone Co 26.350,80 20.036,86 0,32 JPY 1.200 Ozeki Corp Ltd 30.804,18 49.991,62 0,81 JPY 1.000 Pigeon Corp 18.225,46 39.872,68 0,65 JPY 2.800 Plenus Co Ltd 42.935,74 42.030,49 0,68 JPY 1.700 San-A Co Ltd 68.057,58 68.732,90 1,11 JPY 1.900 Santen Pharmaceutical Co Ltd 44.694,38 70.028,48 1,13 JPY 900 Stella Chemifa Corp 29.978,96 49.857,60 0,81 JPY 700 Takeda Pharmaceutical Co Ltd 32.473,27 29.239,96 0,47 JPY 1.100 Toyota Motor Corp 67.344,05 43.859,94 0,71 JPY 1.300 Tsumura & Co 35.262,95 47.043,06 0,76
754.236,00 850.825,97 13,76
KRW 330 CJ CheilJedang Corp 31.220,37 58.172,59 0,94 KRW 440 Dongwon Industries Co Ltd 42.159,04 42.239,38 0,68 KRW 4.988 Handsome Corp 91.713,64 59.749,18 0,97 KRW 1.920 Hankuk Electric Glass Co Ltd 57.506,30 44.529,75 0,72 KRW 829 Honam Petrochemical Co Ltd 63.485,18 62.469,00 1,01 KRW 1.190 Hyundai Development Co - E&C 47.424,10 43.269,03 0,70 KRW 4.160 Industrial Bank of Korea 73.354,88 51.067,85 0,83 KRW 4.670 Jahwa Electronics Co Ltd 42.687,16 39.673,75 0,64
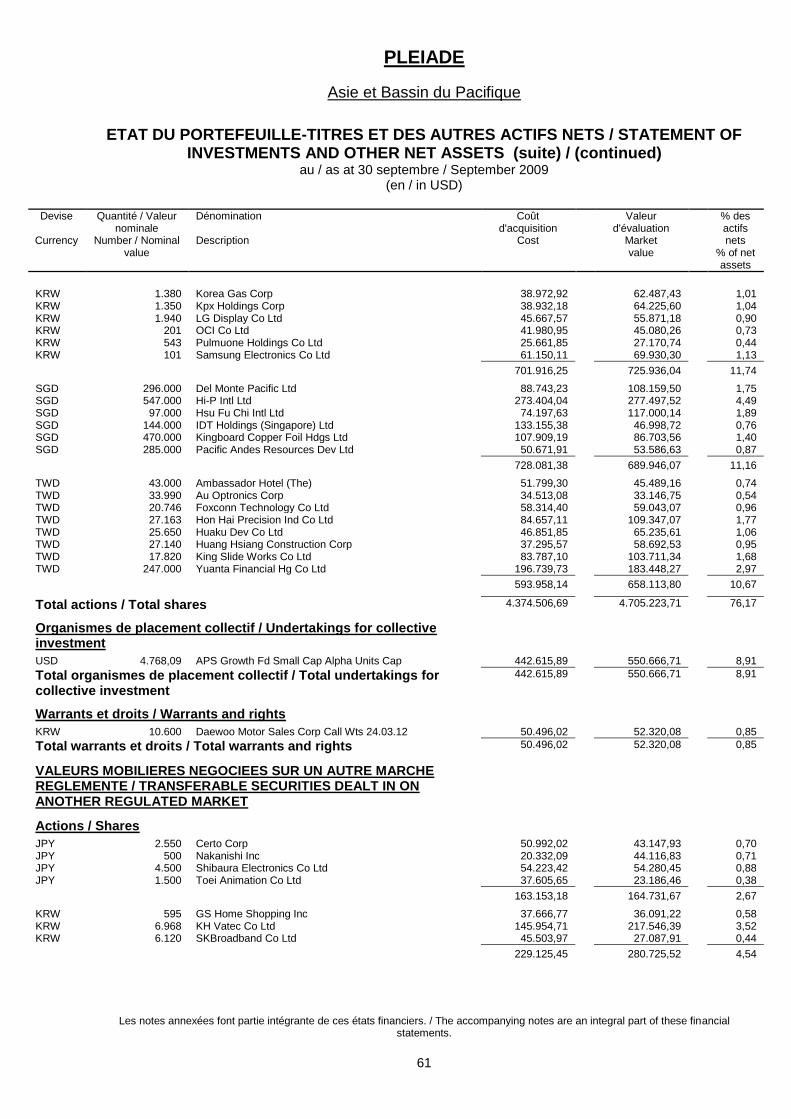
PLEIADE
Asie et Bassin du Pacifique
ETAT DU PORTEFEUILLE-TITRES ET DES AUTRES ACTIFS NETS / STATEMENT OF INVESTMENTS AND OTHER NET ASSETS (suite) / (continued)
au / as at 30 septembre / September 2009 (en / in USD)
Les notes annexées font partie intégrante de ces états financiers. / The accompanying notes are an integral part of these financial statements.
61
Devise
Currency
Quantité / Valeur nominale
Number / Nominal value
Dénomination Description
Coût d'acquisition
Cost
Valeur d'évaluation
Market value
% des actifs nets
% of net assets
KRW 1.380 Korea Gas Corp 38.972,92 62.487,43 1,01 KRW 1.350 Kpx Holdings Corp 38.932,18 64.225,60 1,04 KRW 1.940 LG Display Co Ltd 45.667,57 55.871,18 0,90 KRW 201 OCI Co Ltd 41.980,95 45.080,26 0,73 KRW 543 Pulmuone Holdings Co Ltd 25.661,85 27.170,74 0,44 KRW 101 Samsung Electronics Co Ltd 61.150,11 69.930,30 1,13
701.916,25 725.936,04 11,74
SGD 296.000 Del Monte Pacific Ltd 88.743,23 108.159,50 1,75 SGD 547.000 Hi-P Intl Ltd 273.404,04 277.497,52 4,49 SGD 97.000 Hsu Fu Chi Intl Ltd 74.197,63 117.000,14 1,89 SGD 144.000 IDT Holdings (Singapore) Ltd 133.155,38 46.998,72 0,76 SGD 470.000 Kingboard Copper Foil Hdgs Ltd 107.909,19 86.703,56 1,40 SGD 285.000 Pacific Andes Resources Dev Ltd 50.671,91 53.586,63 0,87
728.081,38 689.946,07 11,16
TWD 43.000 Ambassador Hotel (The) 51.799,30 45.489,16 0,74 TWD 33.990 Au Optronics Corp 34.513,08 33.146,75 0,54 TWD 20.746 Foxconn Technology Co Ltd 58.314,40 59.043,07 0,96 TWD 27.163 Hon Hai Precision Ind Co Ltd 84.657,11 109.347,07 1,77 TWD 25.650 Huaku Dev Co Ltd 46.851,85 65.235,61 1,06 TWD 27.140 Huang Hsiang Construction Corp 37.295,57 58.692,53 0,95 TWD 17.820 King Slide Works Co Ltd 83.787,10 103.711,34 1,68 TWD 247.000 Yuanta Financial Hg Co Ltd 196.739,73 183.448,27 2,97
593.958,14 658.113,80 10,67
Total actions / Total shares 4.374.506,69 4.705.223,71 76,17
Organismes de placement collectif / Undertakings for collective investment
USD 4.768,09 APS Growth Fd Small Cap Alpha Units Cap 442.615,89 550.666,71 8,91
Total organismes de placement collectif / Total undertakings for collective investment
442.615,89 550.666,71 8,91
Warrants et droits / Warrants and rights
KRW 10.600 Daewoo Motor Sales Corp Call Wts 24.03.12 50.496,02 52.320,08 0,85
Total warrants et droits / Total warrants and rights 50.496,02 52.320,08 0,85
VALEURS MOBILIERES NEGOCIEES SUR UN AUTRE MARCHE REGLEMENTE / TRANSFERABLE SECURITIES DEALT IN ON ANOTHER REGULATED MARKET
Actions / Shares
JPY 2.550 Certo Corp 50.992,02 43.147,93 0,70 JPY 500 Nakanishi Inc 20.332,09 44.116,83 0,71 JPY 4.500 Shibaura Electronics Co Ltd 54.223,42 54.280,45 0,88 JPY 1.500 Toei Animation Co Ltd 37.605,65 23.186,46 0,38
163.153,18 164.731,67 2,67
KRW 595 GS Home Shopping Inc 37.666,77 36.091,22 0,58 KRW 6.968 KH Vatec Co Ltd 145.954,71 217.546,39 3,52 KRW 6.120 SKBroadband Co Ltd 45.503,97 27.087,91 0,44
229.125,45 280.725,52 4,54
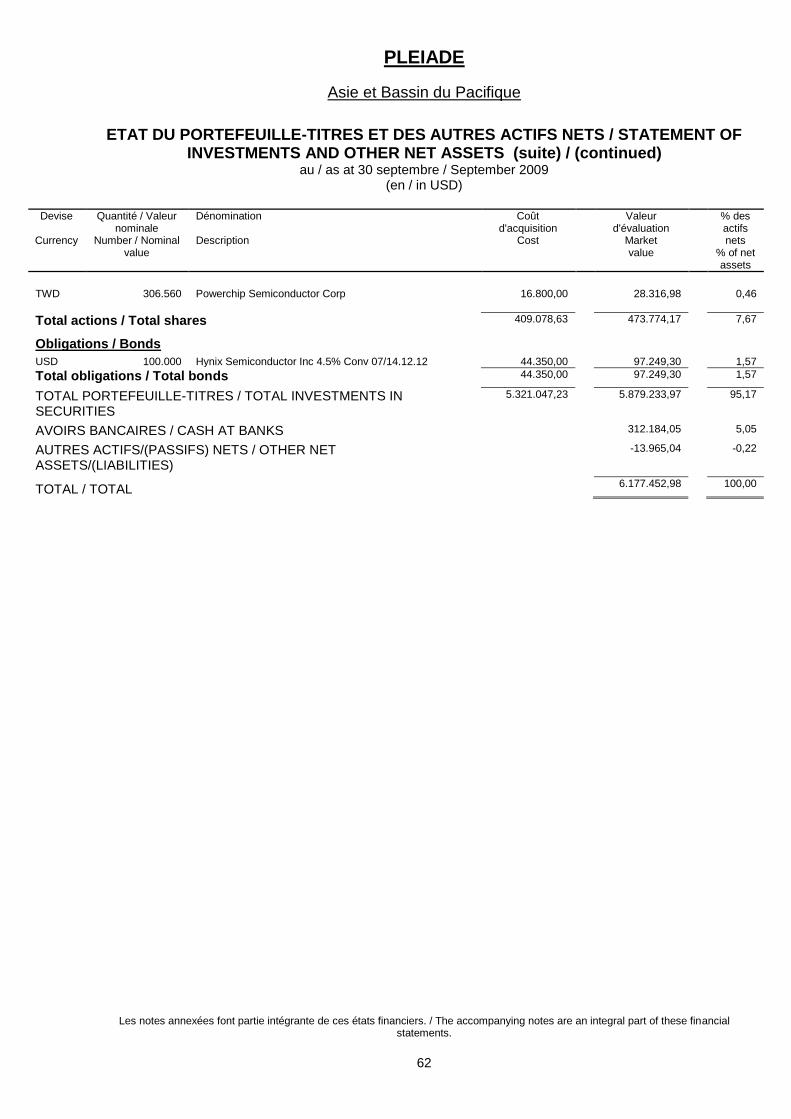
PLEIADE
Asie et Bassin du Pacifique
ETAT DU PORTEFEUILLE-TITRES ET DES AUTRES ACTIFS NETS / STATEMENT OF INVESTMENTS AND OTHER NET ASSETS (suite) / (continued)
au / as at 30 septembre / September 2009 (en / in USD)
Les notes annexées font partie intégrante de ces états financiers. / The accompanying notes are an integral part of these financial statements.
62
Devise
Currency
Quantité / Valeur nominale
Number / Nominal value
Dénomination Description
Coût d'acquisition
Cost
Valeur d'évaluation
Market value
% des actifs nets
% of net assets
TWD 306.560 Powerchip Semiconductor Corp 16.800,00 28.316,98 0,46
Total actions / Total shares 409.078,63 473.774,17 7,67
Obligations / Bonds
USD 100.000 Hynix Semiconductor Inc 4.5% Conv 07/14.12.12 44.350,00 97.249,30 1,57
Total obligations / Total bonds 44.350,00 97.249,30 1,57
TOTAL PORTEFEUILLE-TITRES / TOTAL INVESTMENTS IN SECURITIES
5.321.047,23 5.879.233,97 95,17
AVOIRS BANCAIRES / CASH AT BANKS 312.184,05 5,05
AUTRES ACTIFS/(PASSIFS) NETS / OTHER NET ASSETS/(LIABILITIES)
-13.965,04 -0,22
TOTAL / TOTAL 6.177.452,98 100,00
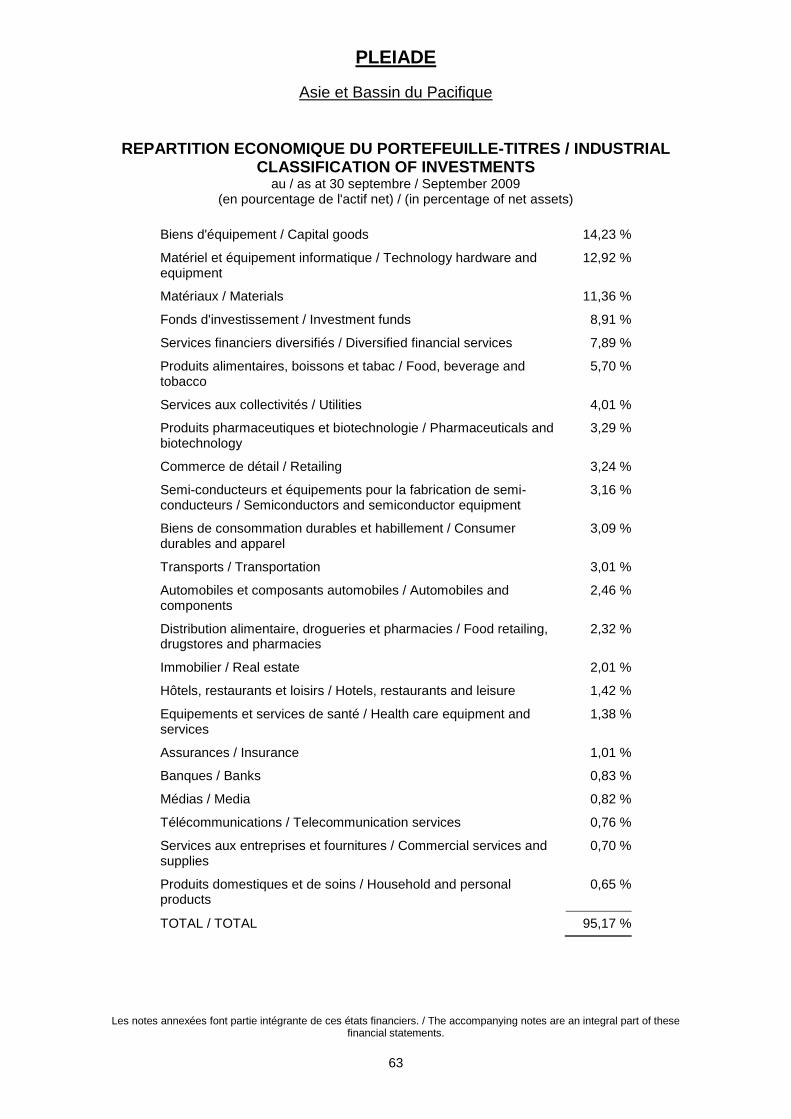
PLEIADE
Asie et Bassin du Pacifique
Les notes annexées font partie intégrante de ces états financiers. / The accompanying notes are an integral part of these financial statements.
63
REPARTITION ECONOMIQUE DU PORTEFEUILLE-TITRES / INDUSTRIAL CLASSIFICATION OF INVESTMENTS
au / as at 30 septembre / September 2009 (en pourcentage de l'actif net) / (in percentage of net assets)
Biens d'équipement / Capital goods 14,23 %
Matériel et équipement informatique / Technology hardware and equipment
12,92 %
Matériaux / Materials 11,36 %
Fonds d'investissement / Investment funds 8,91 %
Services financiers diversifiés / Diversified financial services 7,89 %
Produits alimentaires, boissons et tabac / Food, beverage and tobacco
5,70 %
Services aux collectivités / Utilities 4,01 %
Produits pharmaceutiques et biotechnologie / Pharmaceuticals and biotechnology
3,29 %
Commerce de détail / Retailing 3,24 %
Semi-conducteurs et équipements pour la fabrication de semi-conducteurs / Semiconductors and semiconductor equipment
3,16 %
Biens de consommation durables et habillement / Consumer durables and apparel
3,09 %
Transports / Transportation 3,01 %
Automobiles et composants automobiles / Automobiles and components
2,46 %
Distribution alimentaire, drogueries et pharmacies / Food retailing, drugstores and pharmacies
2,32 %
Immobilier / Real estate 2,01 %
Hôtels, restaurants et loisirs / Hotels, restaurants and leisure 1,42 %
Equipements et services de santé / Health care equipment and services
1,38 %
Assurances / Insurance 1,01 %
Banques / Banks 0,83 %
Médias / Media 0,82 %
Télécommunications / Telecommunication services 0,76 %
Services aux entreprises et fournitures / Commercial services and supplies
0,70 %
Produits domestiques et de soins / Household and personal products
0,65 %
TOTAL / TOTAL 95,17 %
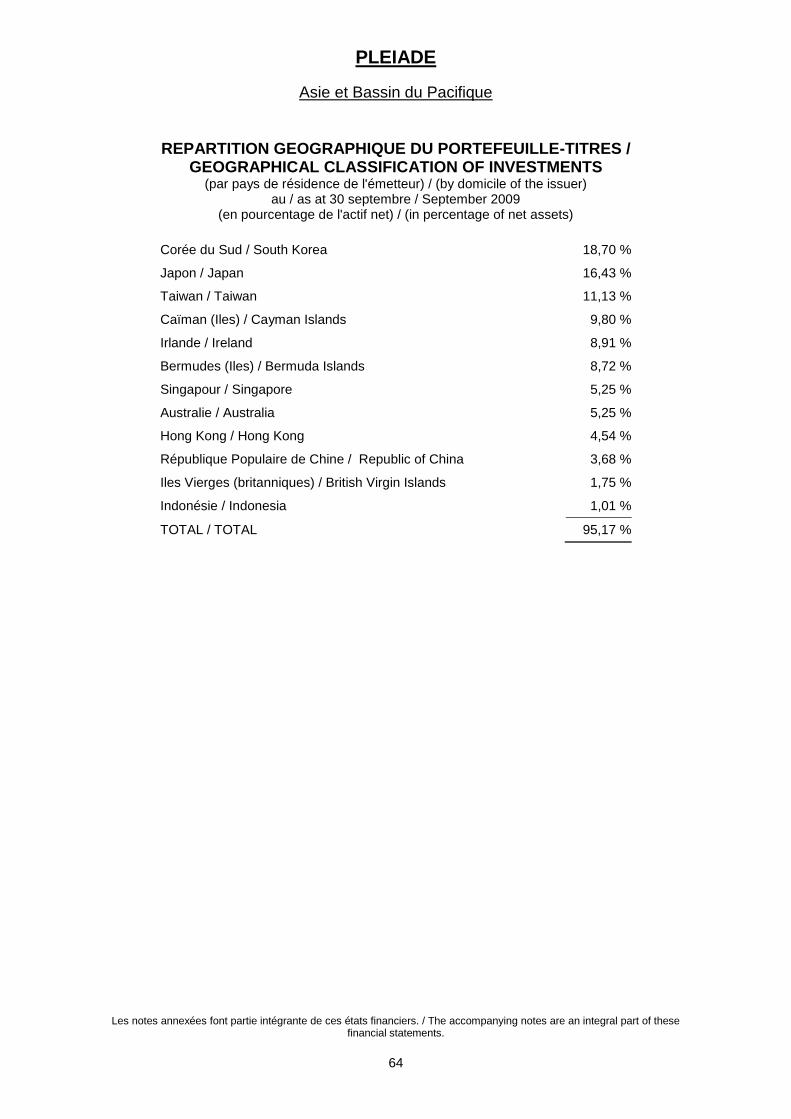
PLEIADE
Asie et Bassin du Pacifique
Les notes annexées font partie intégrante de ces états financiers. / The accompanying notes are an integral part of these financial statements.
64
REPARTITION GEOGRAPHIQUE DU PORTEFEUILLE-TITRES / GEOGRAPHICAL CLASSIFICATION OF INVESTMENTS
(par pays de résidence de l'émetteur) / (by domicile of the issuer) au / as at 30 septembre / September 2009
(en pourcentage de l'actif net) / (in percentage of net assets)
Corée du Sud / South Korea 18,70 %
Japon / Japan 16,43 %
Taiwan / Taiwan 11,13 %
Caïman (Iles) / Cayman Islands 9,80 %
Irlande / Ireland 8,91 %
Bermudes (Iles) / Bermuda Islands 8,72 %
Singapour / Singapore 5,25 %
Australie / Australia 5,25 %
Hong Kong / Hong Kong 4,54 %
République Populaire de Chine / Republic of China 3,68 %
Iles Vierges (britanniques) / British Virgin Islands 1,75 %
Indonésie / Indonesia 1,01 %
TOTAL / TOTAL 95,17 %
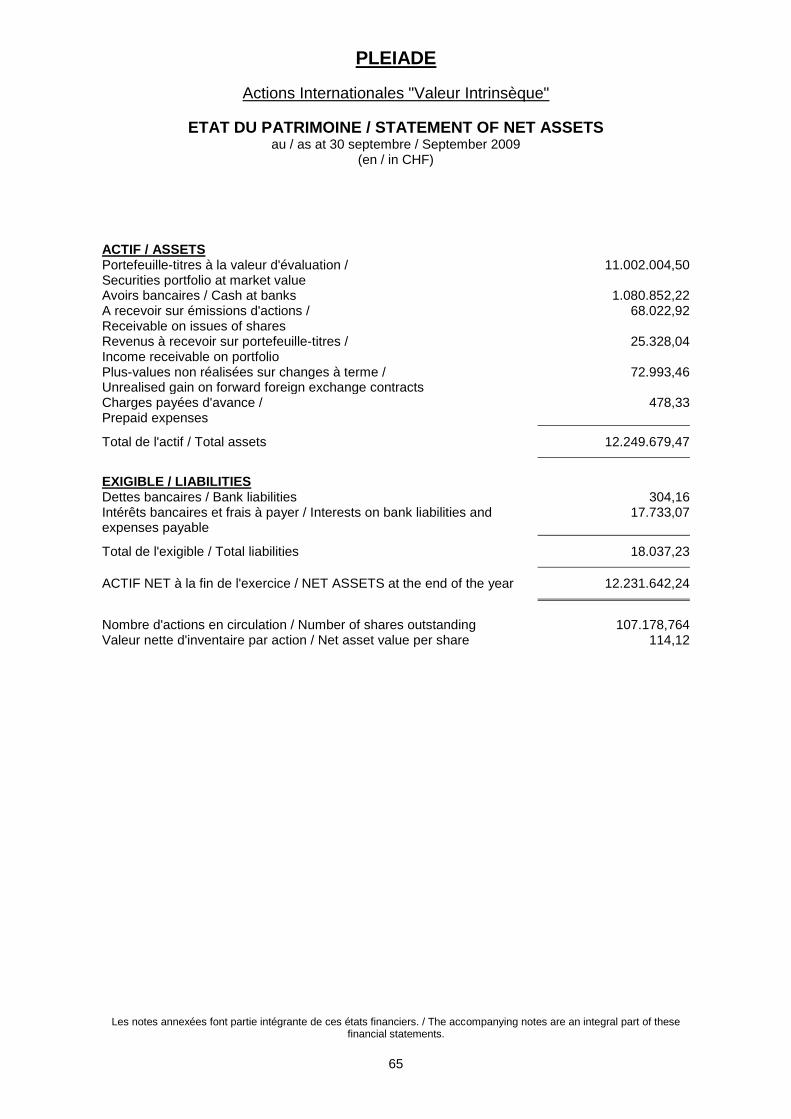
PLEIADE
Actions Internationales "Valeur Intrinsèque"
ETAT DU PATRIMOINE / STATEMENT OF NET ASSETS au / as at 30 septembre / September 2009
(en / in CHF)
Les notes annexées font partie intégrante de ces états financiers. / The accompanying notes are an integral part of these financial statements.
65
ACTIF / ASSETS Portefeuille-titres à la valeur d'évaluation / Securities portfolio at market value
11.002.004,50
Avoirs bancaires / Cash at banks 1.080.852,22 A recevoir sur émissions d'actions / Receivable on issues of shares
68.022,92
Revenus à recevoir sur portefeuille-titres / Income receivable on portfolio
25.328,04
Plus-values non réalisées sur changes à terme / Unrealised gain on forward foreign exchange contracts
72.993,46
Charges payées d'avance / Prepaid expenses
478,33
Total de l'actif / Total assets 12.249.679,47
EXIGIBLE / LIABILITIES Dettes bancaires / Bank liabilities 304,16 Intérêts bancaires et frais à payer / Interests on bank liabilities and expenses payable
17.733,07
Total de l'exigible / Total liabilities 18.037,23
ACTIF NET à la fin de l'exercice / NET ASSETS at the end of the year 12.231.642,24
Nombre d'actions en circulation / Number of shares outstanding 107.178,764 Valeur nette d'inventaire par action / Net asset value per share 114,12
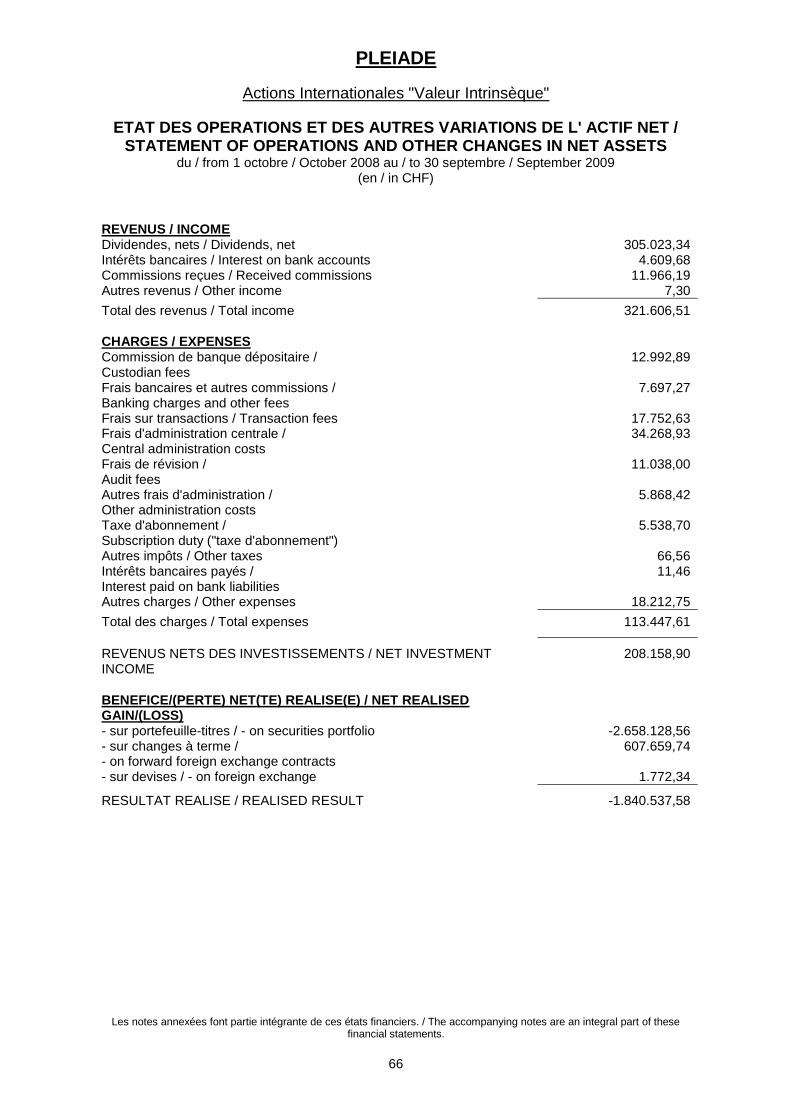
PLEIADE
Actions Internationales "Valeur Intrinsèque"
ETAT DES OPERATIONS ET DES AUTRES VARIATIONS DE L' ACTIF NET / STATEMENT OF OPERATIONS AND OTHER CHANGES IN NET ASSETS
du / from 1 octobre / October 2008 au / to 30 septembre / September 2009 (en / in CHF)
Les notes annexées font partie intégrante de ces états financiers. / The accompanying notes are an integral part of these financial statements.
66
REVENUS / INCOME Dividendes, nets / Dividends, net 305.023,34 Intérêts bancaires / Interest on bank accounts 4.609,68 Commissions reçues / Received commissions 11.966,19 Autres revenus / Other income 7,30
Total des revenus / Total income 321.606,51
CHARGES / EXPENSES Commission de banque dépositaire / Custodian fees
12.992,89
Frais bancaires et autres commissions / Banking charges and other fees
7.697,27
Frais sur transactions / Transaction fees 17.752,63 Frais d'administration centrale / Central administration costs
34.268,93
Frais de révision / Audit fees
11.038,00
Autres frais d'administration / Other administration costs
5.868,42
Taxe d'abonnement / Subscription duty ("taxe d'abonnement")
5.538,70
Autres impôts / Other taxes 66,56 Intérêts bancaires payés / Interest paid on bank liabilities
11,46
Autres charges / Other expenses 18.212,75
Total des charges / Total expenses 113.447,61
REVENUS NETS DES INVESTISSEMENTS / NET INVESTMENT INCOME
208.158,90
BENEFICE/(PERTE) NET(TE) REALISE(E) / NET REALISED GAIN/(LOSS)
- sur portefeuille-titres / - on securities portfolio -2.658.128,56 - sur changes à terme / - on forward foreign exchange contracts
607.659,74
- sur devises / - on foreign exchange 1.772,34
RESULTAT REALISE / REALISED RESULT -1.840.537,58
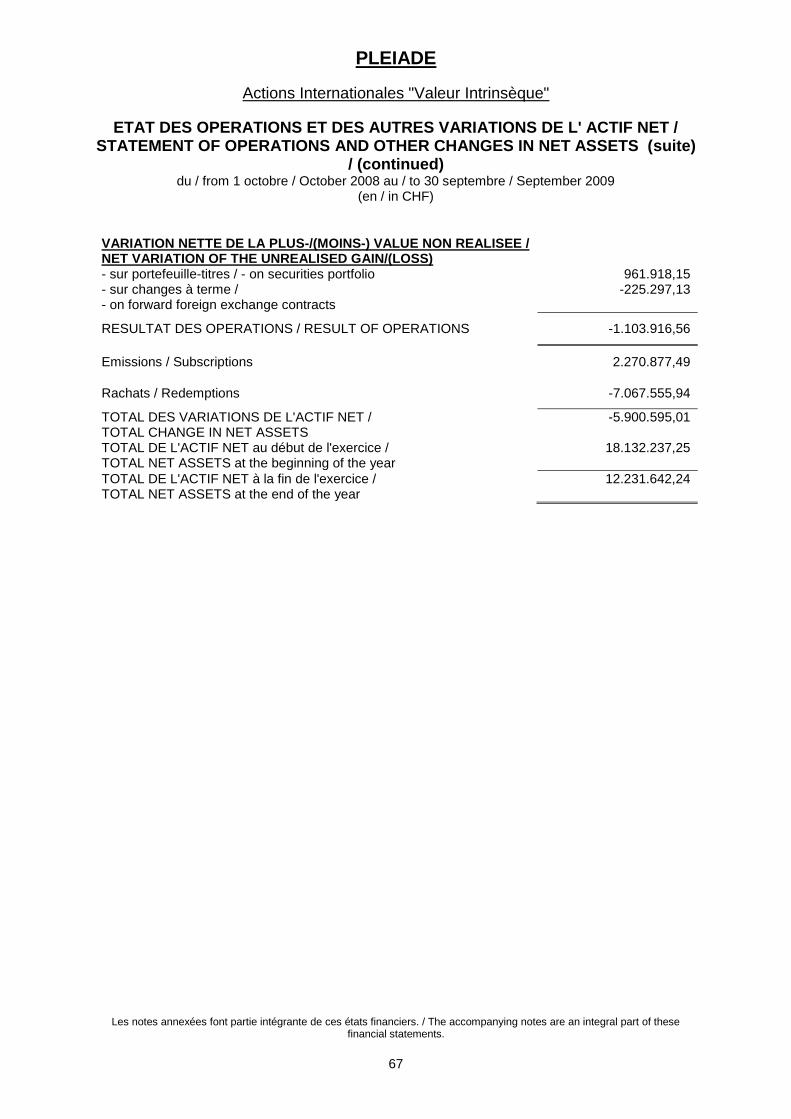
PLEIADE
Actions Internationales "Valeur Intrinsèque"
ETAT DES OPERATIONS ET DES AUTRES VARIATIONS DE L' ACTIF NET / STATEMENT OF OPERATIONS AND OTHER CHANGES IN NET ASSETS (suite)
/ (continued) du / from 1 octobre / October 2008 au / to 30 septembre / September 2009
(en / in CHF)
Les notes annexées font partie intégrante de ces états financiers. / The accompanying notes are an integral part of these financial statements.
67
VARIATION NETTE DE LA PLUS-/(MOINS-) VALUE NON REALISEE / NET VARIATION OF THE UNREALISED GAIN/(LOSS)
- sur portefeuille-titres / - on securities portfolio 961.918,15 - sur changes à terme / - on forward foreign exchange contracts
-225.297,13
RESULTAT DES OPERATIONS / RESULT OF OPERATIONS -1.103.916,56
Emissions / Subscriptions 2.270.877,49
Rachats / Redemptions -7.067.555,94
TOTAL DES VARIATIONS DE L'ACTIF NET / TOTAL CHANGE IN NET ASSETS
-5.900.595,01
TOTAL DE L'ACTIF NET au début de l'exercice / TOTAL NET ASSETS at the beginning of the year
18.132.237,25
TOTAL DE L'ACTIF NET à la fin de l'exercice / TOTAL NET ASSETS at the end of the year
12.231.642,24
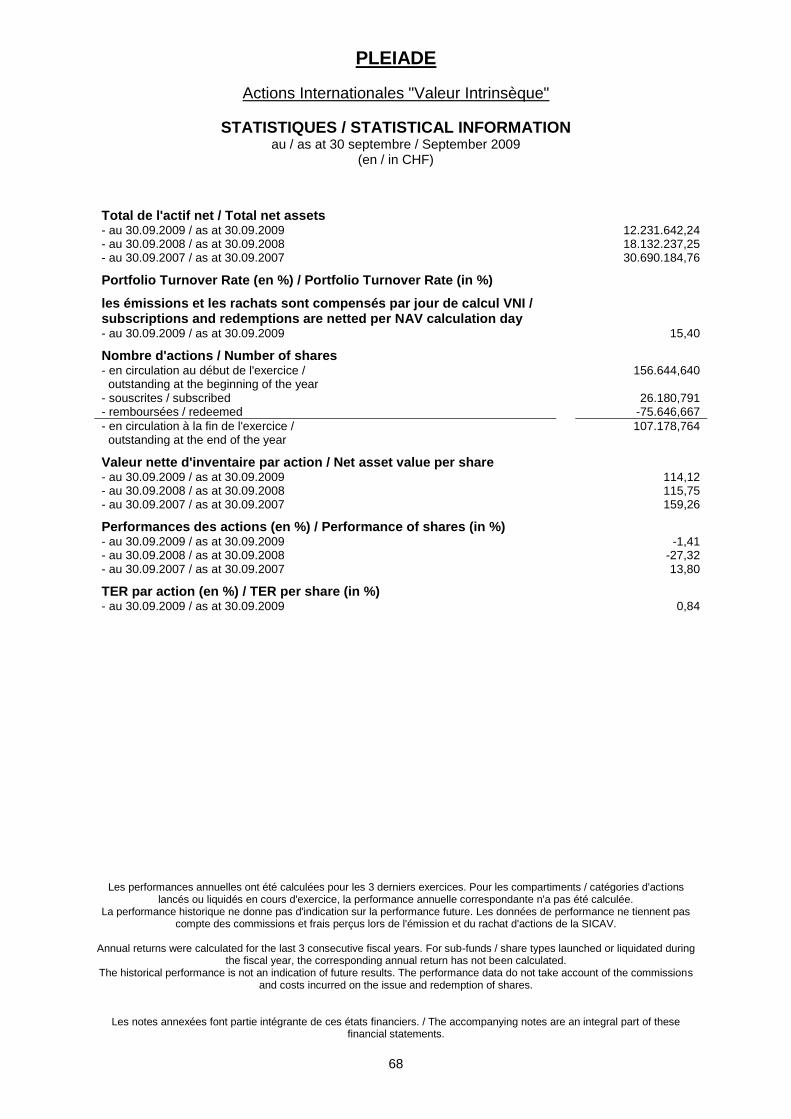
PLEIADE
Actions Internationales "Valeur Intrinsèque"
STATISTIQUES / STATISTICAL INFORMATION au / as at 30 septembre / September 2009
(en / in CHF)
Les performances annuelles ont été calculées pour les 3 derniers exercices. Pour les compartiments / catégories d'actions lancés ou liquidés en cours d'exercice, la performance annuelle correspondante n'a pas été calculée.
La performance historique ne donne pas d'indication sur la performance future. Les données de performance ne tiennent pas compte des commissions et frais perçus lors de l'émission et du rachat d'actions de la SICAV.
Annual returns were calculated for the last 3 consecutive fiscal years. For sub-funds / share types launched or liquidated during
the fiscal year, the corresponding annual return has not been calculated. The historical performance is not an indication of future results. The performance data do not take account of the commissions
and costs incurred on the issue and redemption of shares.
Les notes annexées font partie intégrante de ces états financiers. / The accompanying notes are an integral part of these financial statements.
68
Total de l'actif net / Total net assets
- au 30.09.2009 / as at 30.09.2009 12.231.642,24 - au 30.09.2008 / as at 30.09.2008 18.132.237,25 - au 30.09.2007 / as at 30.09.2007 30.690.184,76
Portfolio Turnover Rate (en %) / Portfolio Turnover Rate (in %)
les émissions et les rachats sont compensés par jour de calcul VNI / subscriptions and redemptions are netted per NAV calculation day
- au 30.09.2009 / as at 30.09.2009 15,40
Nombre d'actions / Number of shares
- en circulation au début de l'exercice / outstanding at the beginning of the year
156.644,640
- souscrites / subscribed 26.180,791 - remboursées / redeemed -75.646,667
- en circulation à la fin de l'exercice / outstanding at the end of the year
107.178,764
Valeur nette d'inventaire par action / Net asset value per share
- au 30.09.2009 / as at 30.09.2009 114,12 - au 30.09.2008 / as at 30.09.2008 115,75 - au 30.09.2007 / as at 30.09.2007 159,26
Performances des actions (en %) / Performance of shares (in %)
- au 30.09.2009 / as at 30.09.2009 -1,41 - au 30.09.2008 / as at 30.09.2008 -27,32 - au 30.09.2007 / as at 30.09.2007 13,80
TER par action (en %) / TER per share (in %)
- au 30.09.2009 / as at 30.09.2009 0,84
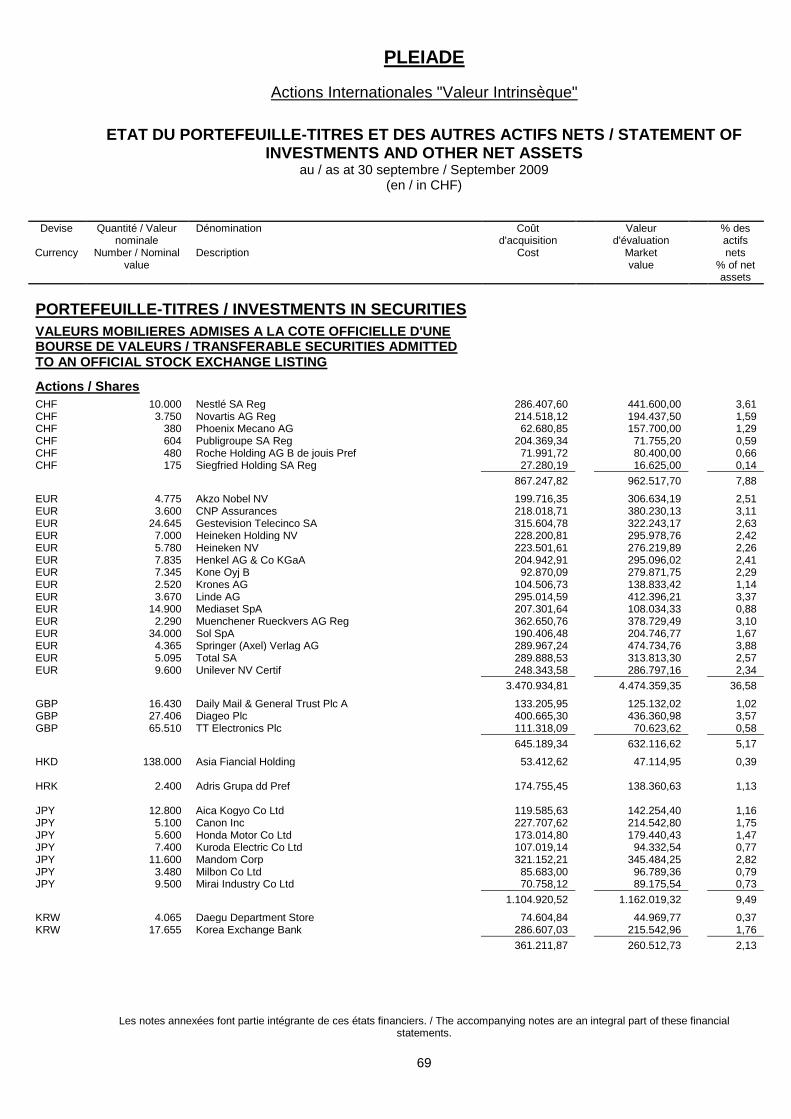
PLEIADE
Actions Internationales "Valeur Intrinsèque"
ETAT DU PORTEFEUILLE-TITRES ET DES AUTRES ACTIFS NETS / STATEMENT OF INVESTMENTS AND OTHER NET ASSETS
au / as at 30 septembre / September 2009 (en / in CHF)
Les notes annexées font partie intégrante de ces états financiers. / The accompanying notes are an integral part of these financial statements.
69
Devise
Currency
Quantité / Valeur nominale
Number / Nominal value
Dénomination Description
Coût d'acquisition
Cost
Valeur d'évaluation
Market value
% des actifs nets
% of net assets
PORTEFEUILLE-TITRES / INVESTMENTS IN SECURITIES
VALEURS MOBILIERES ADMISES A LA COTE OFFICIELLE D'UNE BOURSE DE VALEURS / TRANSFERABLE SECURITIES ADMITTED TO AN OFFICIAL STOCK EXCHANGE LISTING
Actions / Shares
CHF 10.000 Nestlé SA Reg 286.407,60 441.600,00 3,61 CHF 3.750 Novartis AG Reg 214.518,12 194.437,50 1,59 CHF 380 Phoenix Mecano AG 62.680,85 157.700,00 1,29 CHF 604 Publigroupe SA Reg 204.369,34 71.755,20 0,59 CHF 480 Roche Holding AG B de jouis Pref 71.991,72 80.400,00 0,66 CHF 175 Siegfried Holding SA Reg 27.280,19 16.625,00 0,14
867.247,82 962.517,70 7,88
EUR 4.775 Akzo Nobel NV 199.716,35 306.634,19 2,51 EUR 3.600 CNP Assurances 218.018,71 380.230,13 3,11 EUR 24.645 Gestevision Telecinco SA 315.604,78 322.243,17 2,63 EUR 7.000 Heineken Holding NV 228.200,81 295.978,76 2,42 EUR 5.780 Heineken NV 223.501,61 276.219,89 2,26 EUR 7.835 Henkel AG & Co KGaA 204.942,91 295.096,02 2,41 EUR 7.345 Kone Oyj B 92.870,09 279.871,75 2,29 EUR 2.520 Krones AG 104.506,73 138.833,42 1,14 EUR 3.670 Linde AG 295.014,59 412.396,21 3,37 EUR 14.900 Mediaset SpA 207.301,64 108.034,33 0,88 EUR 2.290 Muenchener Rueckvers AG Reg 362.650,76 378.729,49 3,10 EUR 34.000 Sol SpA 190.406,48 204.746,77 1,67 EUR 4.365 Springer (Axel) Verlag AG 289.967,24 474.734,76 3,88 EUR 5.095 Total SA 289.888,53 313.813,30 2,57 EUR 9.600 Unilever NV Certif 248.343,58 286.797,16 2,34
3.470.934,81 4.474.359,35 36,58
GBP 16.430 Daily Mail & General Trust Plc A 133.205,95 125.132,02 1,02 GBP 27.406 Diageo Plc 400.665,30 436.360,98 3,57 GBP 65.510 TT Electronics Plc 111.318,09 70.623,62 0,58
645.189,34 632.116,62 5,17
HKD 138.000 Asia Fiancial Holding 53.412,62 47.114,95 0,39 HRK 2.400 Adris Grupa dd Pref 174.755,45 138.360,63 1,13 JPY 12.800 Aica Kogyo Co Ltd 119.585,63 142.254,40 1,16 JPY 5.100 Canon Inc 227.707,62 214.542,80 1,75 JPY 5.600 Honda Motor Co Ltd 173.014,80 179.440,43 1,47 JPY 7.400 Kuroda Electric Co Ltd 107.019,14 94.332,54 0,77 JPY 11.600 Mandom Corp 321.152,21 345.484,25 2,82 JPY 3.480 Milbon Co Ltd 85.683,00 96.789,36 0,79 JPY 9.500 Mirai Industry Co Ltd 70.758,12 89.175,54 0,73
1.104.920,52 1.162.019,32 9,49
KRW 4.065 Daegu Department Store 74.604,84 44.969,77 0,37 KRW 17.655 Korea Exchange Bank 286.607,03 215.542,96 1,76
361.211,87 260.512,73 2,13
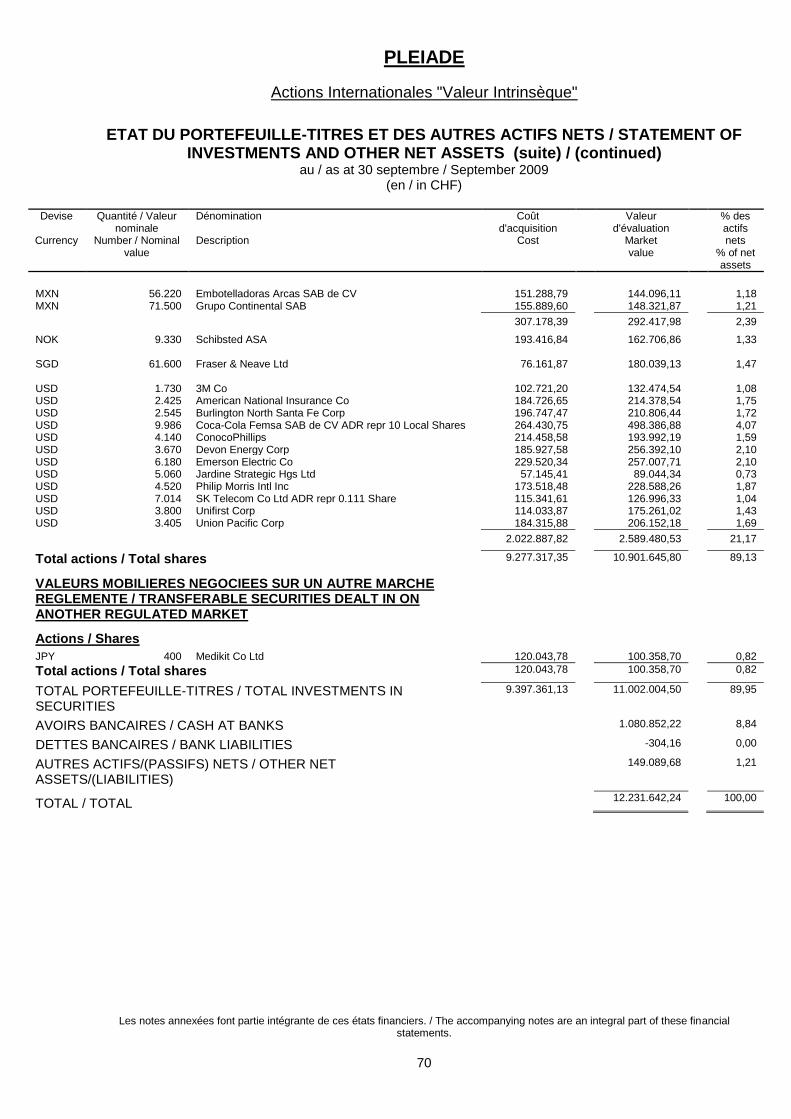
PLEIADE
Actions Internationales "Valeur Intrinsèque"
ETAT DU PORTEFEUILLE-TITRES ET DES AUTRES ACTIFS NETS / STATEMENT OF INVESTMENTS AND OTHER NET ASSETS (suite) / (continued)
au / as at 30 septembre / September 2009 (en / in CHF)
Les notes annexées font partie intégrante de ces états financiers. / The accompanying notes are an integral part of these financial statements.
70
Devise
Currency
Quantité / Valeur nominale
Number / Nominal value
Dénomination Description
Coût d'acquisition
Cost
Valeur d'évaluation
Market value
% des actifs nets
% of net assets
MXN 56.220 Embotelladoras Arcas SAB de CV 151.288,79 144.096,11 1,18 MXN 71.500 Grupo Continental SAB 155.889,60 148.321,87 1,21
307.178,39 292.417,98 2,39
NOK 9.330 Schibsted ASA 193.416,84 162.706,86 1,33 SGD 61.600 Fraser & Neave Ltd 76.161,87 180.039,13 1,47 USD 1.730 3M Co 102.721,20 132.474,54 1,08 USD 2.425 American National Insurance Co 184.726,65 214.378,54 1,75 USD 2.545 Burlington North Santa Fe Corp 196.747,47 210.806,44 1,72 USD 9.986 Coca-Cola Femsa SAB de CV ADR repr 10 Local Shares 264.430,75 498.386,88 4,07 USD 4.140 ConocoPhillips 214.458,58 193.992,19 1,59 USD 3.670 Devon Energy Corp 185.927,58 256.392,10 2,10 USD 6.180 Emerson Electric Co 229.520,34 257.007,71 2,10 USD 5.060 Jardine Strategic Hgs Ltd 57.145,41 89.044,34 0,73 USD 4.520 Philip Morris Intl Inc 173.518,48 228.588,26 1,87 USD 7.014 SK Telecom Co Ltd ADR repr 0.111 Share 115.341,61 126.996,33 1,04 USD 3.800 Unifirst Corp 114.033,87 175.261,02 1,43 USD 3.405 Union Pacific Corp 184.315,88 206.152,18 1,69
2.022.887,82 2.589.480,53 21,17
Total actions / Total shares 9.277.317,35 10.901.645,80 89,13
VALEURS MOBILIERES NEGOCIEES SUR UN AUTRE MARCHE REGLEMENTE / TRANSFERABLE SECURITIES DEALT IN ON ANOTHER REGULATED MARKET
Actions / Shares
JPY 400 Medikit Co Ltd 120.043,78 100.358,70 0,82
Total actions / Total shares 120.043,78 100.358,70 0,82
TOTAL PORTEFEUILLE-TITRES / TOTAL INVESTMENTS IN SECURITIES
9.397.361,13 11.002.004,50 89,95
AVOIRS BANCAIRES / CASH AT BANKS 1.080.852,22 8,84
DETTES BANCAIRES / BANK LIABILITIES -304,16 0,00
AUTRES ACTIFS/(PASSIFS) NETS / OTHER NET ASSETS/(LIABILITIES)
149.089,68 1,21
TOTAL / TOTAL 12.231.642,24 100,00
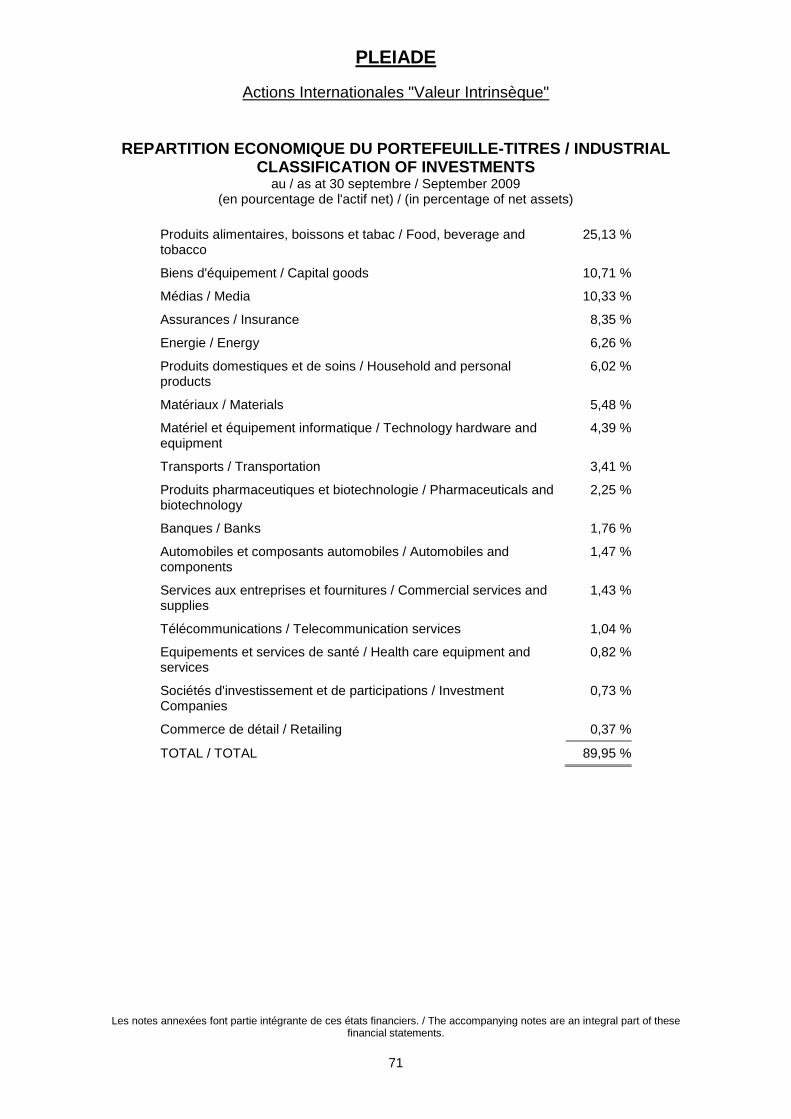
PLEIADE
Actions Internationales "Valeur Intrinsèque"
Les notes annexées font partie intégrante de ces états financiers. / The accompanying notes are an integral part of these financial statements.
71
REPARTITION ECONOMIQUE DU PORTEFEUILLE-TITRES / INDUSTRIAL CLASSIFICATION OF INVESTMENTS
au / as at 30 septembre / September 2009 (en pourcentage de l'actif net) / (in percentage of net assets)
Produits alimentaires, boissons et tabac / Food, beverage and tobacco
25,13 %
Biens d'équipement / Capital goods 10,71 %
Médias / Media 10,33 %
Assurances / Insurance 8,35 %
Energie / Energy 6,26 %
Produits domestiques et de soins / Household and personal products
6,02 %
Matériaux / Materials 5,48 %
Matériel et équipement informatique / Technology hardware and equipment
4,39 %
Transports / Transportation 3,41 %
Produits pharmaceutiques et biotechnologie / Pharmaceuticals and biotechnology
2,25 %
Banques / Banks 1,76 %
Automobiles et composants automobiles / Automobiles and components
1,47 %
Services aux entreprises et fournitures / Commercial services and supplies
1,43 %
Télécommunications / Telecommunication services 1,04 %
Equipements et services de santé / Health care equipment and services
0,82 %
Sociétés d'investissement et de participations / Investment Companies
0,73 %
Commerce de détail / Retailing 0,37 %
TOTAL / TOTAL 89,95 %
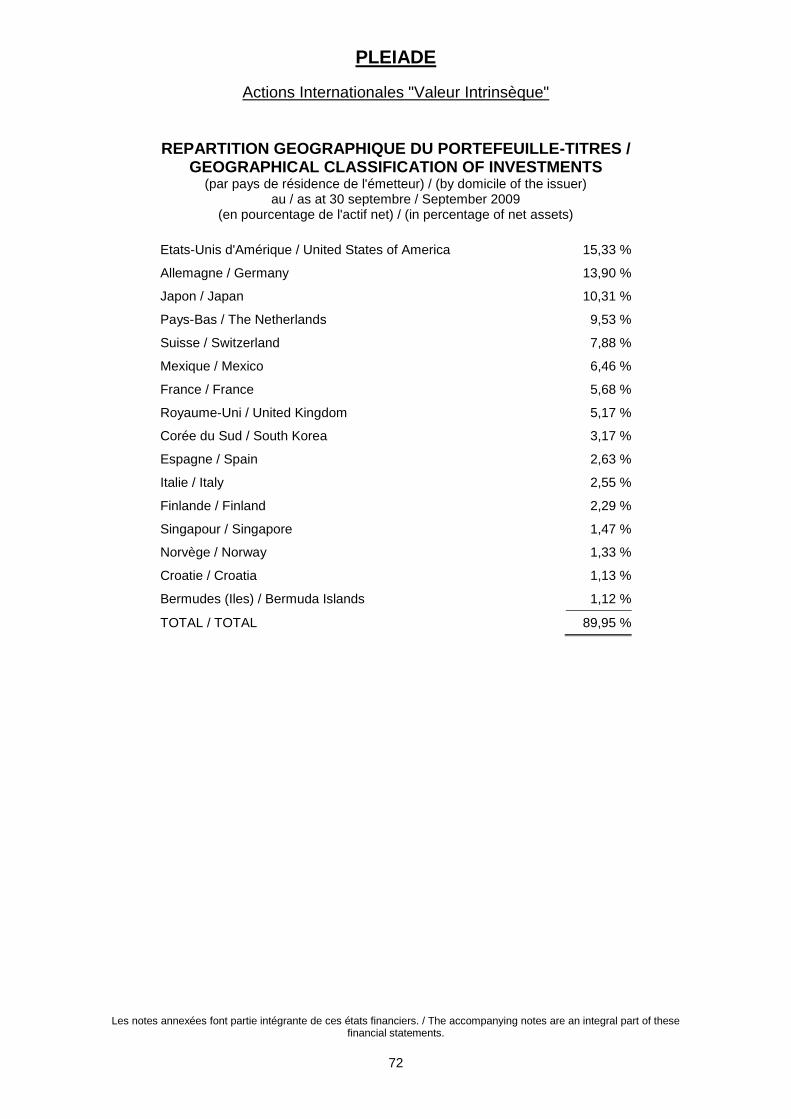
PLEIADE
Actions Internationales "Valeur Intrinsèque"
Les notes annexées font partie intégrante de ces états financiers. / The accompanying notes are an integral part of these financial statements.
72
REPARTITION GEOGRAPHIQUE DU PORTEFEUILLE-TITRES / GEOGRAPHICAL CLASSIFICATION OF INVESTMENTS
(par pays de résidence de l'émetteur) / (by domicile of the issuer) au / as at 30 septembre / September 2009
(en pourcentage de l'actif net) / (in percentage of net assets)
Etats-Unis d'Amérique / United States of America 15,33 %
Allemagne / Germany 13,90 %
Japon / Japan 10,31 %
Pays-Bas / The Netherlands 9,53 %
Suisse / Switzerland 7,88 %
Mexique / Mexico 6,46 %
France / France 5,68 %
Royaume-Uni / United Kingdom 5,17 %
Corée du Sud / South Korea 3,17 %
Espagne / Spain 2,63 %
Italie / Italy 2,55 %
Finlande / Finland 2,29 %
Singapour / Singapore 1,47 %
Norvège / Norway 1,33 %
Croatie / Croatia 1,13 %
Bermudes (Iles) / Bermuda Islands 1,12 %
TOTAL / TOTAL 89,95 %
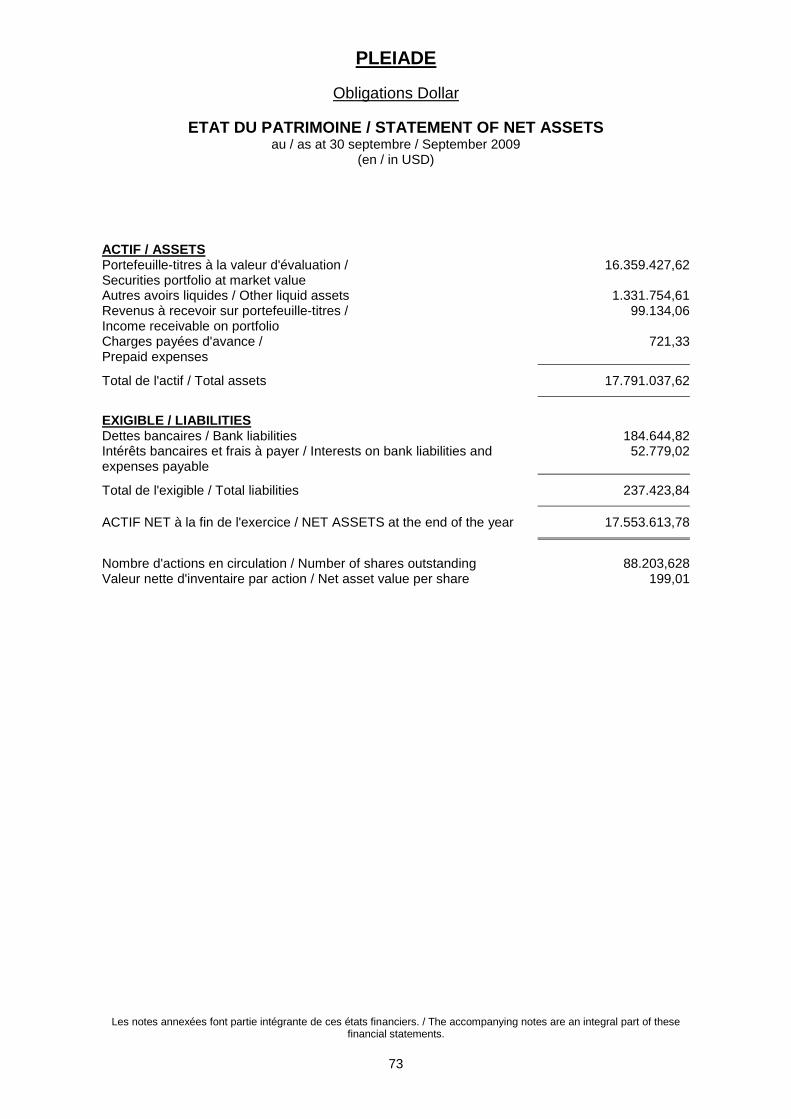
PLEIADE
Obligations Dollar
ETAT DU PATRIMOINE / STATEMENT OF NET ASSETS au / as at 30 septembre / September 2009
(en / in USD)
Les notes annexées font partie intégrante de ces états financiers. / The accompanying notes are an integral part of these financial statements.
73
ACTIF / ASSETS Portefeuille-titres à la valeur d'évaluation / Securities portfolio at market value
16.359.427,62
Autres avoirs liquides / Other liquid assets 1.331.754,61 Revenus à recevoir sur portefeuille-titres / Income receivable on portfolio
99.134,06
Charges payées d'avance / Prepaid expenses
721,33
Total de l'actif / Total assets 17.791.037,62
EXIGIBLE / LIABILITIES Dettes bancaires / Bank liabilities 184.644,82 Intérêts bancaires et frais à payer / Interests on bank liabilities and expenses payable
52.779,02
Total de l'exigible / Total liabilities 237.423,84
ACTIF NET à la fin de l'exercice / NET ASSETS at the end of the year 17.553.613,78
Nombre d'actions en circulation / Number of shares outstanding 88.203,628 Valeur nette d'inventaire par action / Net asset value per share 199,01
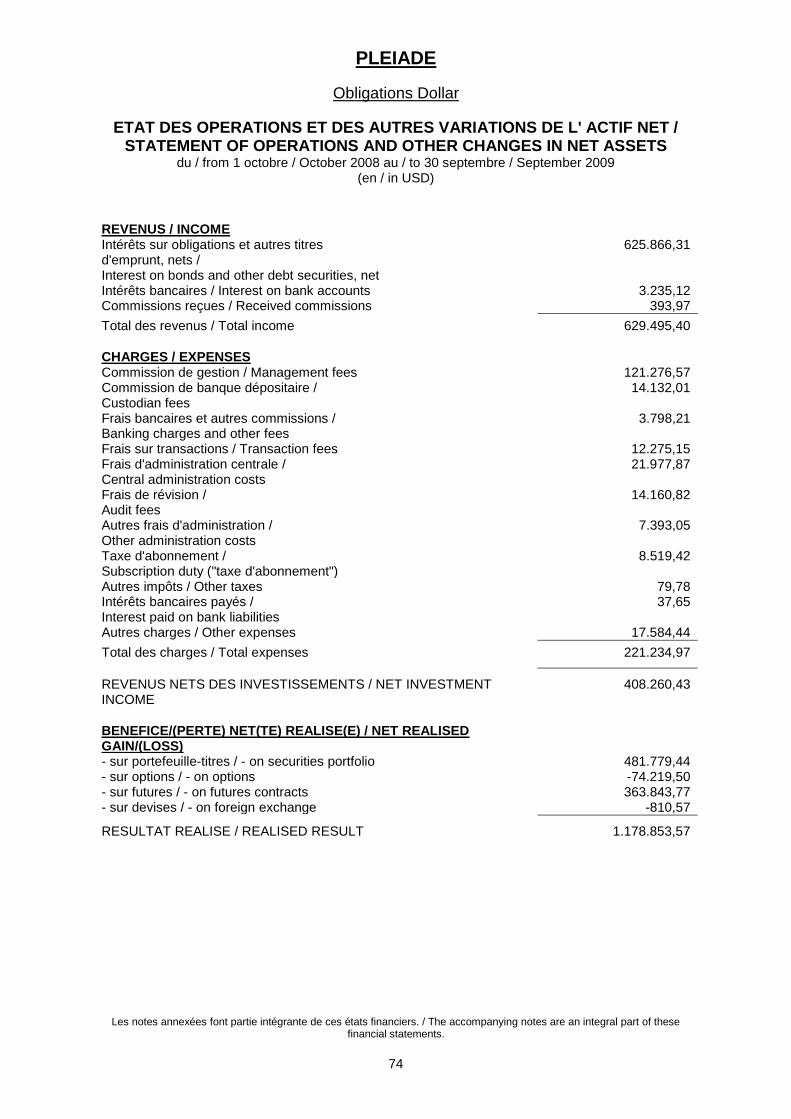
PLEIADE
Obligations Dollar
ETAT DES OPERATIONS ET DES AUTRES VARIATIONS DE L' ACTIF NET / STATEMENT OF OPERATIONS AND OTHER CHANGES IN NET ASSETS
du / from 1 octobre / October 2008 au / to 30 septembre / September 2009 (en / in USD)
Les notes annexées font partie intégrante de ces états financiers. / The accompanying notes are an integral part of these financial statements.
74
REVENUS / INCOME Intérêts sur obligations et autres titres d'emprunt, nets / Interest on bonds and other debt securities, net
625.866,31
Intérêts bancaires / Interest on bank accounts 3.235,12 Commissions reçues / Received commissions 393,97
Total des revenus / Total income 629.495,40
CHARGES / EXPENSES Commission de gestion / Management fees 121.276,57 Commission de banque dépositaire / Custodian fees
14.132,01
Frais bancaires et autres commissions / Banking charges and other fees
3.798,21
Frais sur transactions / Transaction fees 12.275,15 Frais d'administration centrale / Central administration costs
21.977,87
Frais de révision / Audit fees
14.160,82
Autres frais d'administration / Other administration costs
7.393,05
Taxe d'abonnement / Subscription duty ("taxe d'abonnement")
8.519,42
Autres impôts / Other taxes 79,78 Intérêts bancaires payés / Interest paid on bank liabilities
37,65
Autres charges / Other expenses 17.584,44
Total des charges / Total expenses 221.234,97
REVENUS NETS DES INVESTISSEMENTS / NET INVESTMENT INCOME
408.260,43
BENEFICE/(PERTE) NET(TE) REALISE(E) / NET REALISED GAIN/(LOSS)
- sur portefeuille-titres / - on securities portfolio 481.779,44 - sur options / - on options -74.219,50 - sur futures / - on futures contracts 363.843,77 - sur devises / - on foreign exchange -810,57
RESULTAT REALISE / REALISED RESULT 1.178.853,57

PLEIADE
Obligations Dollar
ETAT DES OPERATIONS ET DES AUTRES VARIATIONS DE L' ACTIF NET / STATEMENT OF OPERATIONS AND OTHER CHANGES IN NET ASSETS (suite)
/ (continued) du / from 1 octobre / October 2008 au / to 30 septembre / September 2009
(en / in USD)
Les notes annexées font partie intégrante de ces états financiers. / The accompanying notes are an integral part of these financial statements.
75
VARIATION NETTE DE LA PLUS-/(MOINS-) VALUE NON REALISEE / NET VARIATION OF THE UNREALISED GAIN/(LOSS)
- sur portefeuille-titres / - on securities portfolio 241.395,13 - sur futures / - on futures contracts -50.390,63
RESULTAT DES OPERATIONS / RESULT OF OPERATIONS 1.369.858,07
Emissions / Subscriptions 4.950.749,80
Rachats / Redemptions -6.990.553,39
TOTAL DES VARIATIONS DE L'ACTIF NET / TOTAL CHANGE IN NET ASSETS
-669.945,52
TOTAL DE L'ACTIF NET au début de l'exercice / TOTAL NET ASSETS at the beginning of the year
18.223.559,30
TOTAL DE L'ACTIF NET à la fin de l'exercice / TOTAL NET ASSETS at the end of the year
17.553.613,78

PLEIADE
Obligations Dollar
STATISTIQUES / STATISTICAL INFORMATION au / as at 30 septembre / September 2009
(en / in USD)
Les performances annuelles ont été calculées pour les 3 derniers exercices. Pour les compartiments / catégories d'actions lancés ou liquidés en cours d'exercice, la performance annuelle correspondante n'a pas été calculée.
La performance historique ne donne pas d'indication sur la performance future. Les données de performance ne tiennent pas compte des commissions et frais perçus lors de l'émission et du rachat d'actions de la SICAV.
Annual returns were calculated for the last 3 consecutive fiscal years. For sub-funds / share types launched or liquidated during
the fiscal year, the corresponding annual return has not been calculated. The historical performance is not an indication of future results. The performance data do not take account of the commissions
and costs incurred on the issue and redemption of shares.
Les notes annexées font partie intégrante de ces états financiers. / The accompanying notes are an integral part of these financial statements.
76
Total de l'actif net / Total net assets
- au 30.09.2009 / as at 30.09.2009 17.553.613,78 - au 30.09.2008 / as at 30.09.2008 18.223.559,30 - au 30.09.2007 / as at 30.09.2007 10.804.736,08
Portfolio Turnover Rate (en %) / Portfolio Turnover Rate (in %)
les émissions et les rachats sont compensés par jour de calcul VNI / subscriptions and redemptions are netted per NAV calculation day
- au 30.09.2009 / as at 30.09.2009 311,26
Nombre d'actions / Number of shares
- en circulation au début de l'exercice / outstanding at the beginning of the year
98.997,192
- souscrites / subscribed 25.343,078 - remboursées / redeemed -36.136,642
- en circulation à la fin de l'exercice / outstanding at the end of the year
88.203,628
Valeur nette d'inventaire par action / Net asset value per share
- au 30.09.2009 / as at 30.09.2009 199,01 - au 30.09.2008 / as at 30.09.2008 184,08 - au 30.09.2007 / as at 30.09.2007 178,59
Performances des actions (en %) / Performance of shares (in %)
- au 30.09.2009 / as at 30.09.2009 8,11 - au 30.09.2008 / as at 30.09.2008 3,07 - au 30.09.2007 / as at 30.09.2007 4,26
TER par action (en %) / TER per share (in %)
- au 30.09.2009 / as at 30.09.2009 1,21
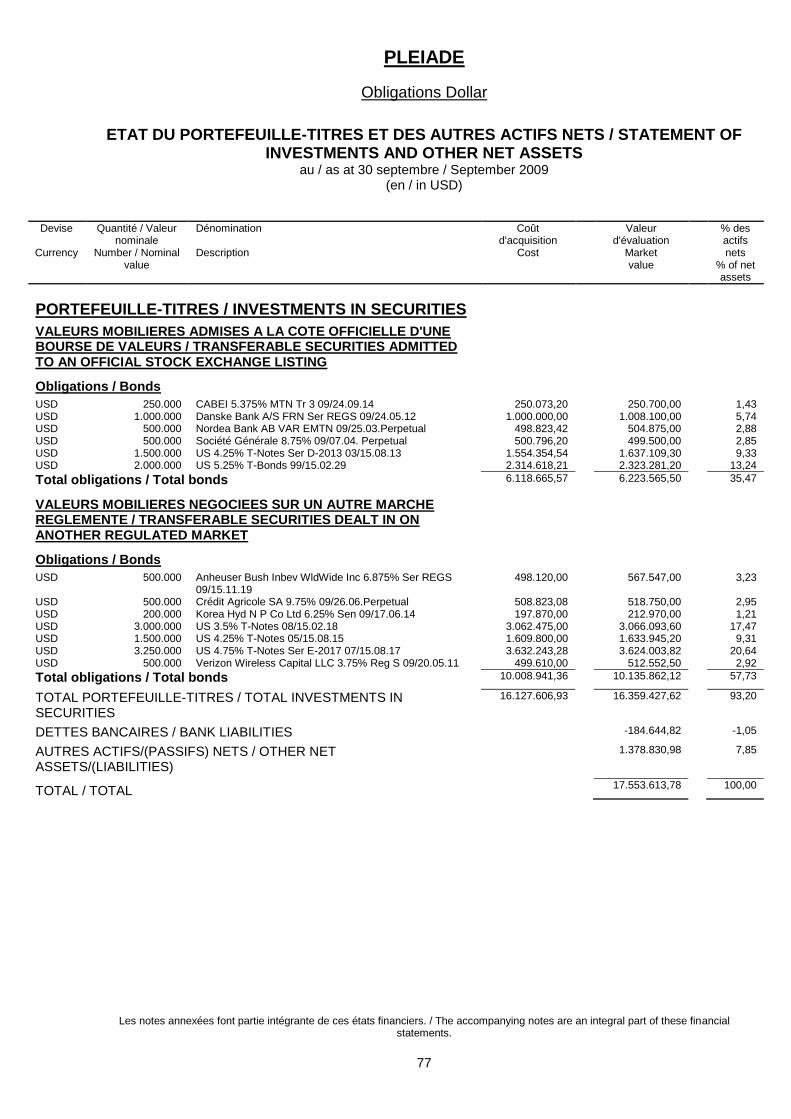
PLEIADE
Obligations Dollar
ETAT DU PORTEFEUILLE-TITRES ET DES AUTRES ACTIFS NETS / STATEMENT OF INVESTMENTS AND OTHER NET ASSETS
au / as at 30 septembre / September 2009 (en / in USD)
Les notes annexées font partie intégrante de ces états financiers. / The accompanying notes are an integral part of these financial statements.
77
Devise
Currency
Quantité / Valeur nominale
Number / Nominal value
Dénomination Description
Coût d'acquisition
Cost
Valeur d'évaluation
Market value
% des actifs nets
% of net assets
PORTEFEUILLE-TITRES / INVESTMENTS IN SECURITIES
VALEURS MOBILIERES ADMISES A LA COTE OFFICIELLE D'UNE BOURSE DE VALEURS / TRANSFERABLE SECURITIES ADMITTED TO AN OFFICIAL STOCK EXCHANGE LISTING
Obligations / Bonds
USD 250.000 CABEI 5.375% MTN Tr 3 09/24.09.14 250.073,20 250.700,00 1,43 USD 1.000.000 Danske Bank A/S FRN Ser REGS 09/24.05.12 1.000.000,00 1.008.100,00 5,74 USD 500.000 Nordea Bank AB VAR EMTN 09/25.03.Perpetual 498.823,42 504.875,00 2,88 USD 500.000 Société Générale 8.75% 09/07.04. Perpetual 500.796,20 499.500,00 2,85 USD 1.500.000 US 4.25% T-Notes Ser D-2013 03/15.08.13 1.554.354,54 1.637.109,30 9,33 USD 2.000.000 US 5.25% T-Bonds 99/15.02.29 2.314.618,21 2.323.281,20 13,24
Total obligations / Total bonds 6.118.665,57 6.223.565,50 35,47
VALEURS MOBILIERES NEGOCIEES SUR UN AUTRE MARCHE REGLEMENTE / TRANSFERABLE SECURITIES DEALT IN ON ANOTHER REGULATED MARKET
Obligations / Bonds
USD 500.000 Anheuser Bush Inbev WldWide Inc 6.875% Ser REGS 09/15.11.19
498.120,00 567.547,00 3,23
USD 500.000 Crédit Agricole SA 9.75% 09/26.06.Perpetual 508.823,08 518.750,00 2,95 USD 200.000 Korea Hyd N P Co Ltd 6.25% Sen 09/17.06.14 197.870,00 212.970,00 1,21 USD 3.000.000 US 3.5% T-Notes 08/15.02.18 3.062.475,00 3.066.093,60 17,47 USD 1.500.000 US 4.25% T-Notes 05/15.08.15 1.609.800,00 1.633.945,20 9,31 USD 3.250.000 US 4.75% T-Notes Ser E-2017 07/15.08.17 3.632.243,28 3.624.003,82 20,64 USD 500.000 Verizon Wireless Capital LLC 3.75% Reg S 09/20.05.11 499.610,00 512.552,50 2,92
Total obligations / Total bonds 10.008.941,36 10.135.862,12 57,73
TOTAL PORTEFEUILLE-TITRES / TOTAL INVESTMENTS IN SECURITIES
16.127.606,93 16.359.427,62 93,20
DETTES BANCAIRES / BANK LIABILITIES -184.644,82 -1,05
AUTRES ACTIFS/(PASSIFS) NETS / OTHER NET ASSETS/(LIABILITIES)
1.378.830,98 7,85
TOTAL / TOTAL 17.553.613,78 100,00
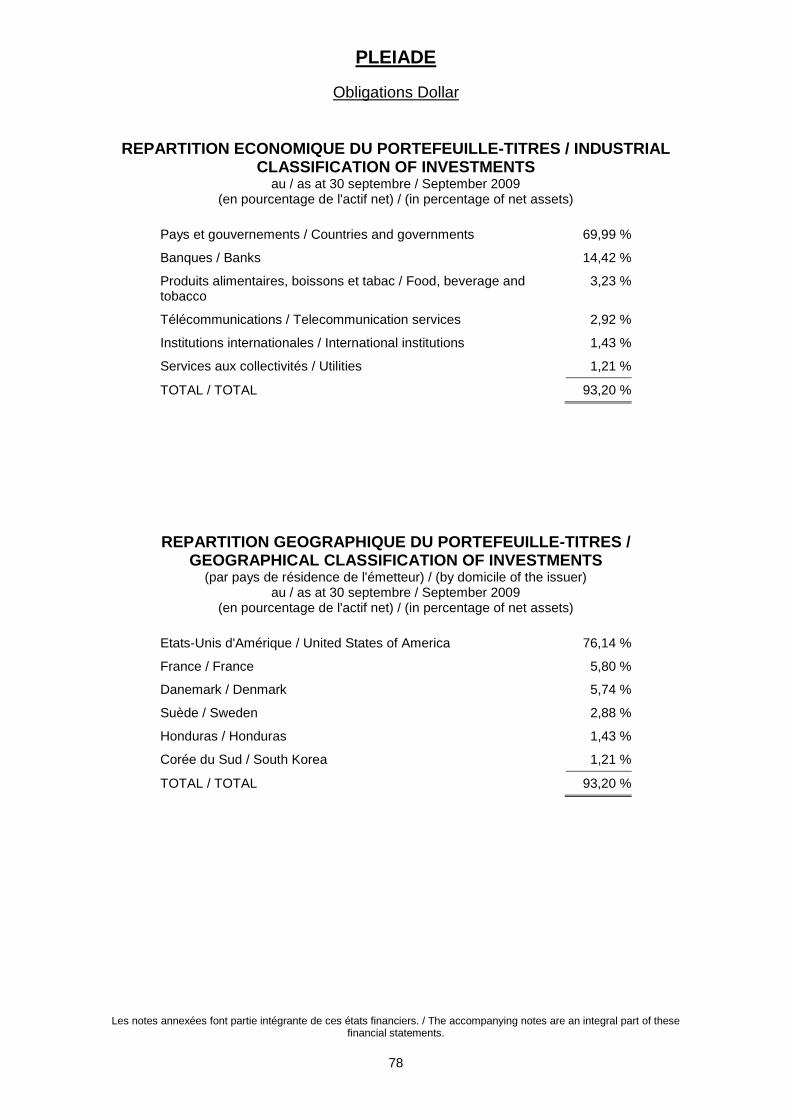
PLEIADE
Obligations Dollar
Les notes annexées font partie intégrante de ces états financiers. / The accompanying notes are an integral part of these financial statements.
78
REPARTITION ECONOMIQUE DU PORTEFEUILLE-TITRES / INDUSTRIAL CLASSIFICATION OF INVESTMENTS
au / as at 30 septembre / September 2009 (en pourcentage de l'actif net) / (in percentage of net assets)
Pays et gouvernements / Countries and governments 69,99 %
Banques / Banks 14,42 %
Produits alimentaires, boissons et tabac / Food, beverage and tobacco
3,23 %
Télécommunications / Telecommunication services 2,92 %
Institutions internationales / International institutions 1,43 %
Services aux collectivités / Utilities 1,21 %
TOTAL / TOTAL 93,20 %
REPARTITION GEOGRAPHIQUE DU PORTEFEUILLE-TITRES / GEOGRAPHICAL CLASSIFICATION OF INVESTMENTS
(par pays de résidence de l'émetteur) / (by domicile of the issuer) au / as at 30 septembre / September 2009
(en pourcentage de l'actif net) / (in percentage of net assets)
Etats-Unis d'Amérique / United States of America 76,14 %
France / France 5,80 %
Danemark / Denmark 5,74 %
Suède / Sweden 2,88 %
Honduras / Honduras 1,43 %
Corée du Sud / South Korea 1,21 %
TOTAL / TOTAL 93,20 %

PLEIADE
Obligations Européennes
ETAT DU PATRIMOINE / STATEMENT OF NET ASSETS au / as at 30 septembre / September 2009
(en / in EUR)
Les notes annexées font partie intégrante de ces états financiers. / The accompanying notes are an integral part of these financial statements.
79
ACTIF / ASSETS Portefeuille-titres à la valeur d'évaluation / Securities portfolio at market value
17.491.126,12
Avoirs bancaires / Cash at banks 1.279.353,61 Autres avoirs liquides / Other liquid assets 479.779,18 A recevoir sur émissions d'actions / Receivable on issues of shares
101,81
Revenus à recevoir sur portefeuille-titres / Income receivable on portfolio
320.788,36
Charges payées d'avance / Prepaid expenses
750,27
Total de l'actif / Total assets 19.571.899,35
EXIGIBLE / LIABILITIES Intérêts bancaires et frais à payer / Interests on bank liabilities and expenses payable
31.133,28
Total de l'exigible / Total liabilities 31.133,28
ACTIF NET à la fin de l'exercice / NET ASSETS at the end of the year 19.540.766,07
Nombre d'actions en circulation / Number of shares outstanding 90.231,900 Valeur nette d'inventaire par action / Net asset value per share 216,56
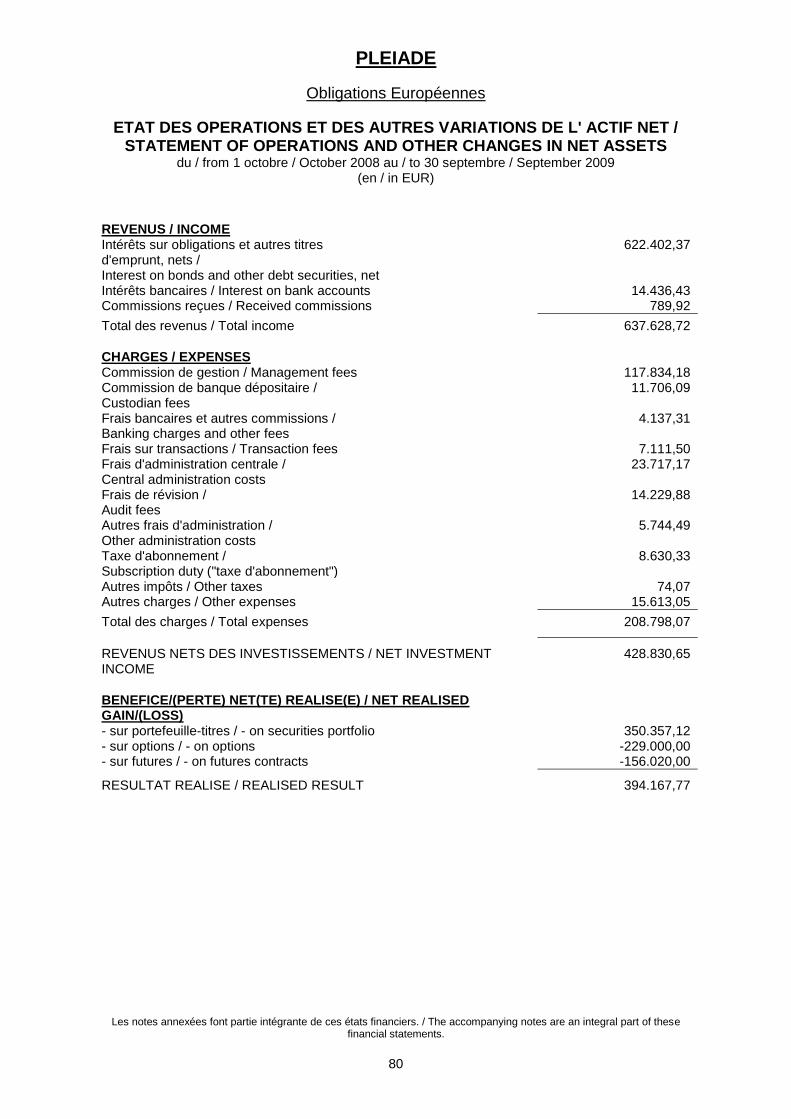
PLEIADE
Obligations Européennes
ETAT DES OPERATIONS ET DES AUTRES VARIATIONS DE L' ACTIF NET / STATEMENT OF OPERATIONS AND OTHER CHANGES IN NET ASSETS
du / from 1 octobre / October 2008 au / to 30 septembre / September 2009 (en / in EUR)
Les notes annexées font partie intégrante de ces états financiers. / The accompanying notes are an integral part of these financial statements.
80
REVENUS / INCOME Intérêts sur obligations et autres titres d'emprunt, nets / Interest on bonds and other debt securities, net
622.402,37
Intérêts bancaires / Interest on bank accounts 14.436,43 Commissions reçues / Received commissions 789,92
Total des revenus / Total income 637.628,72
CHARGES / EXPENSES Commission de gestion / Management fees 117.834,18 Commission de banque dépositaire / Custodian fees
11.706,09
Frais bancaires et autres commissions / Banking charges and other fees
4.137,31
Frais sur transactions / Transaction fees 7.111,50 Frais d'administration centrale / Central administration costs
23.717,17
Frais de révision / Audit fees
14.229,88
Autres frais d'administration / Other administration costs
5.744,49
Taxe d'abonnement / Subscription duty ("taxe d'abonnement")
8.630,33
Autres impôts / Other taxes 74,07 Autres charges / Other expenses 15.613,05
Total des charges / Total expenses 208.798,07
REVENUS NETS DES INVESTISSEMENTS / NET INVESTMENT INCOME
428.830,65
BENEFICE/(PERTE) NET(TE) REALISE(E) / NET REALISED GAIN/(LOSS)
- sur portefeuille-titres / - on securities portfolio 350.357,12 - sur options / - on options -229.000,00 - sur futures / - on futures contracts -156.020,00
RESULTAT REALISE / REALISED RESULT 394.167,77
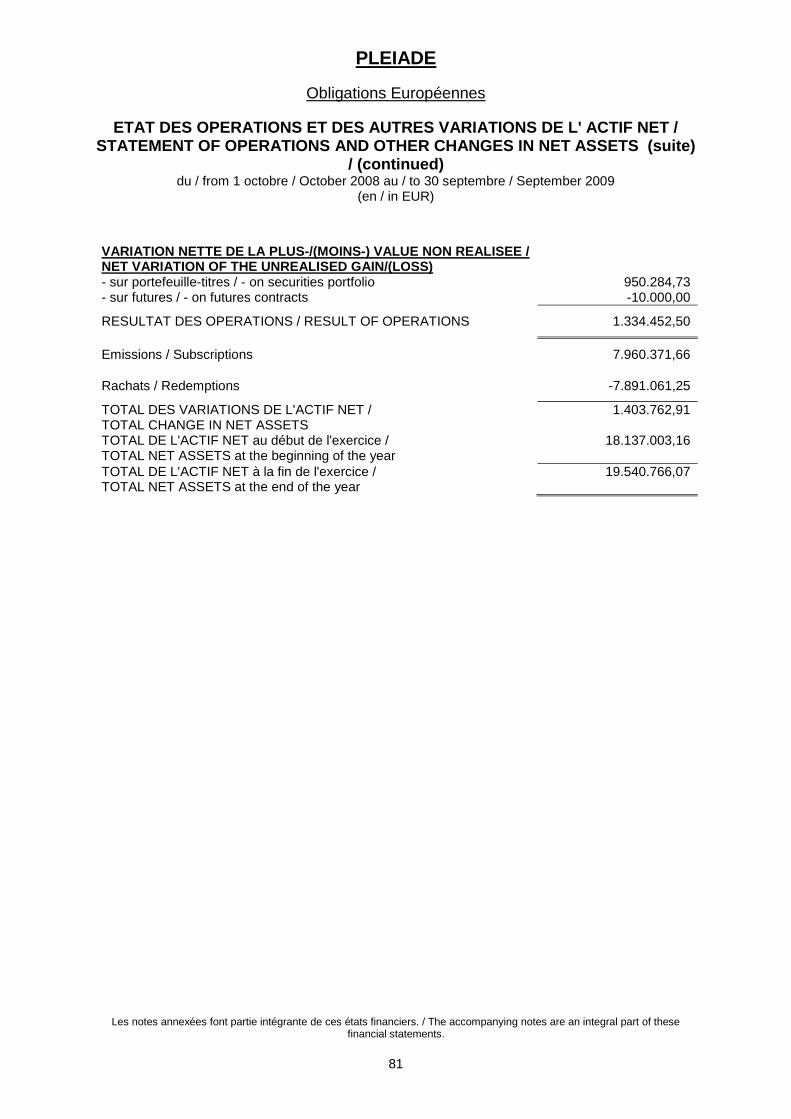
PLEIADE
Obligations Européennes
ETAT DES OPERATIONS ET DES AUTRES VARIATIONS DE L' ACTIF NET / STATEMENT OF OPERATIONS AND OTHER CHANGES IN NET ASSETS (suite)
/ (continued) du / from 1 octobre / October 2008 au / to 30 septembre / September 2009
(en / in EUR)
Les notes annexées font partie intégrante de ces états financiers. / The accompanying notes are an integral part of these financial statements.
81
VARIATION NETTE DE LA PLUS-/(MOINS-) VALUE NON REALISEE / NET VARIATION OF THE UNREALISED GAIN/(LOSS)
- sur portefeuille-titres / - on securities portfolio 950.284,73 - sur futures / - on futures contracts -10.000,00
RESULTAT DES OPERATIONS / RESULT OF OPERATIONS 1.334.452,50
Emissions / Subscriptions 7.960.371,66
Rachats / Redemptions -7.891.061,25
TOTAL DES VARIATIONS DE L'ACTIF NET / TOTAL CHANGE IN NET ASSETS
1.403.762,91
TOTAL DE L'ACTIF NET au début de l'exercice / TOTAL NET ASSETS at the beginning of the year
18.137.003,16
TOTAL DE L'ACTIF NET à la fin de l'exercice / TOTAL NET ASSETS at the end of the year
19.540.766,07

PLEIADE
Obligations Européennes
STATISTIQUES / STATISTICAL INFORMATION au / as at 30 septembre / September 2009
(en / in EUR)
Les performances annuelles ont été calculées pour les 3 derniers exercices. Pour les compartiments / catégories d'actions lancés ou liquidés en cours d'exercice, la performance annuelle correspondante n'a pas été calculée.
La performance historique ne donne pas d'indication sur la performance future. Les données de performance ne tiennent pas compte des commissions et frais perçus lors de l'émission et du rachat d'actions de la SICAV.
Annual returns were calculated for the last 3 consecutive fiscal years. For sub-funds / share types launched or liquidated during
the fiscal year, the corresponding annual return has not been calculated. The historical performance is not an indication of future results. The performance data do not take account of the commissions
and costs incurred on the issue and redemption of shares.
Les notes annexées font partie intégrante de ces états financiers. / The accompanying notes are an integral part of these financial statements.
82
Total de l'actif net / Total net assets
- au 30.09.2009 / as at 30.09.2009 19.540.766,07 - au 30.09.2008 / as at 30.09.2008 18.137.003,16 - au 30.09.2007 / as at 30.09.2007 18.637.158,78
Portfolio Turnover Rate (en %) / Portfolio Turnover Rate (in %)
les émissions et les rachats sont compensés par jour de calcul VNI / subscriptions and redemptions are netted per NAV calculation day
- au 30.09.2009 / as at 30.09.2009 230,32
Nombre d'actions / Number of shares
- en circulation au début de l'exercice / outstanding at the beginning of the year
90.383,045
- souscrites / subscribed 37.780,260 - remboursées / redeemed -37.931,405
- en circulation à la fin de l'exercice / outstanding at the end of the year
90.231,900
Valeur nette d'inventaire par action / Net asset value per share
- au 30.09.2009 / as at 30.09.2009 216,56 - au 30.09.2008 / as at 30.09.2008 200,67 - au 30.09.2007 / as at 30.09.2007 200,44
Performances des actions (en %) / Performance of shares (in %)
- au 30.09.2009 / as at 30.09.2009 7,92 - au 30.09.2008 / as at 30.09.2008 0,11 - au 30.09.2007 / as at 30.09.2007 -1,31
TER par action (en %) / TER per share (in %)
- au 30.09.2009 / as at 30.09.2009 1,20
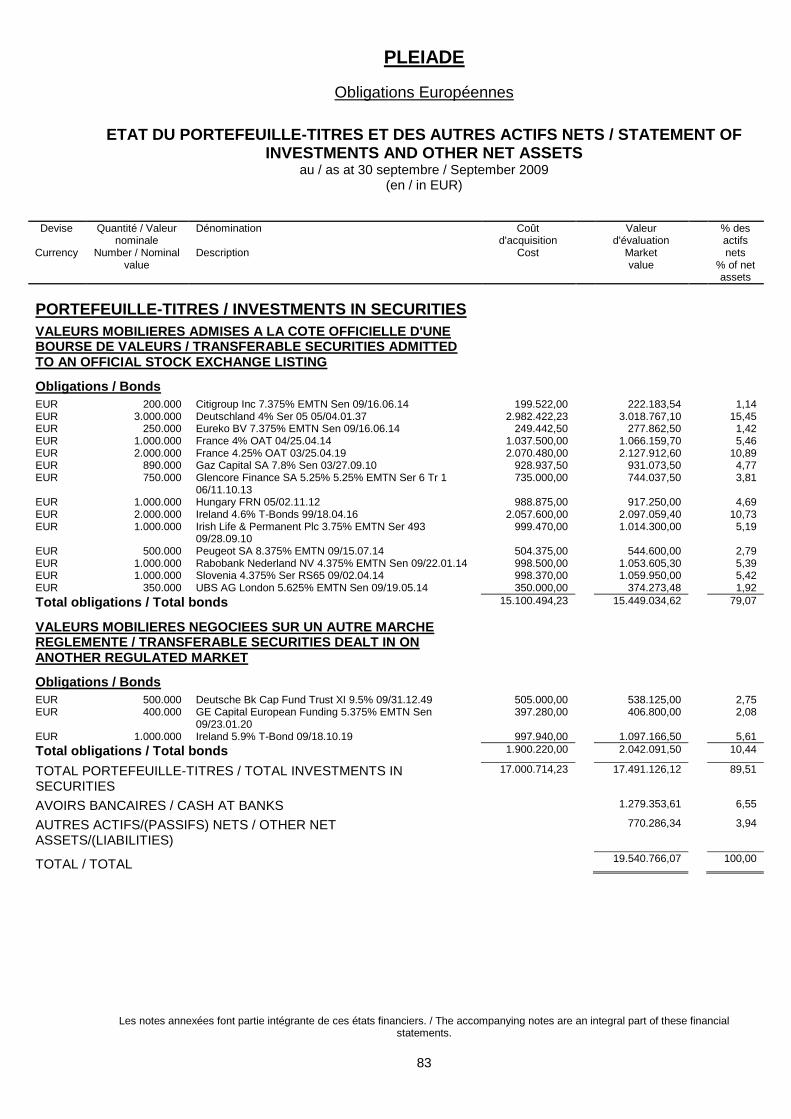
PLEIADE
Obligations Européennes
ETAT DU PORTEFEUILLE-TITRES ET DES AUTRES ACTIFS NETS / STATEMENT OF INVESTMENTS AND OTHER NET ASSETS
au / as at 30 septembre / September 2009 (en / in EUR)
Les notes annexées font partie intégrante de ces états financiers. / The accompanying notes are an integral part of these financial statements.
83
Devise
Currency
Quantité / Valeur nominale
Number / Nominal value
Dénomination Description
Coût d'acquisition
Cost
Valeur d'évaluation
Market value
% des actifs nets
% of net assets
PORTEFEUILLE-TITRES / INVESTMENTS IN SECURITIES
VALEURS MOBILIERES ADMISES A LA COTE OFFICIELLE D'UNE BOURSE DE VALEURS / TRANSFERABLE SECURITIES ADMITTED TO AN OFFICIAL STOCK EXCHANGE LISTING
Obligations / Bonds
EUR 200.000 Citigroup Inc 7.375% EMTN Sen 09/16.06.14 199.522,00 222.183,54 1,14 EUR 3.000.000 Deutschland 4% Ser 05 05/04.01.37 2.982.422,23 3.018.767,10 15,45 EUR 250.000 Eureko BV 7.375% EMTN Sen 09/16.06.14 249.442,50 277.862,50 1,42 EUR 1.000.000 France 4% OAT 04/25.04.14 1.037.500,00 1.066.159,70 5,46 EUR 2.000.000 France 4.25% OAT 03/25.04.19 2.070.480,00 2.127.912,60 10,89 EUR 890.000 Gaz Capital SA 7.8% Sen 03/27.09.10 928.937,50 931.073,50 4,77 EUR 750.000 Glencore Finance SA 5.25% 5.25% EMTN Ser 6 Tr 1
06/11.10.13 735.000,00 744.037,50 3,81
EUR 1.000.000 Hungary FRN 05/02.11.12 988.875,00 917.250,00 4,69 EUR 2.000.000 Ireland 4.6% T-Bonds 99/18.04.16 2.057.600,00 2.097.059,40 10,73 EUR 1.000.000 Irish Life & Permanent Plc 3.75% EMTN Ser 493
09/28.09.10 999.470,00 1.014.300,00 5,19
EUR 500.000 Peugeot SA 8.375% EMTN 09/15.07.14 504.375,00 544.600,00 2,79 EUR 1.000.000 Rabobank Nederland NV 4.375% EMTN Sen 09/22.01.14 998.500,00 1.053.605,30 5,39 EUR 1.000.000 Slovenia 4.375% Ser RS65 09/02.04.14 998.370,00 1.059.950,00 5,42 EUR 350.000 UBS AG London 5.625% EMTN Sen 09/19.05.14 350.000,00 374.273,48 1,92
Total obligations / Total bonds 15.100.494,23 15.449.034,62 79,07
VALEURS MOBILIERES NEGOCIEES SUR UN AUTRE MARCHE REGLEMENTE / TRANSFERABLE SECURITIES DEALT IN ON ANOTHER REGULATED MARKET
Obligations / Bonds
EUR 500.000 Deutsche Bk Cap Fund Trust XI 9.5% 09/31.12.49 505.000,00 538.125,00 2,75 EUR 400.000 GE Capital European Funding 5.375% EMTN Sen
09/23.01.20 397.280,00 406.800,00 2,08
EUR 1.000.000 Ireland 5.9% T-Bond 09/18.10.19 997.940,00 1.097.166,50 5,61
Total obligations / Total bonds 1.900.220,00 2.042.091,50 10,44
TOTAL PORTEFEUILLE-TITRES / TOTAL INVESTMENTS IN SECURITIES
17.000.714,23 17.491.126,12 89,51
AVOIRS BANCAIRES / CASH AT BANKS 1.279.353,61 6,55
AUTRES ACTIFS/(PASSIFS) NETS / OTHER NET ASSETS/(LIABILITIES)
770.286,34 3,94
TOTAL / TOTAL 19.540.766,07 100,00
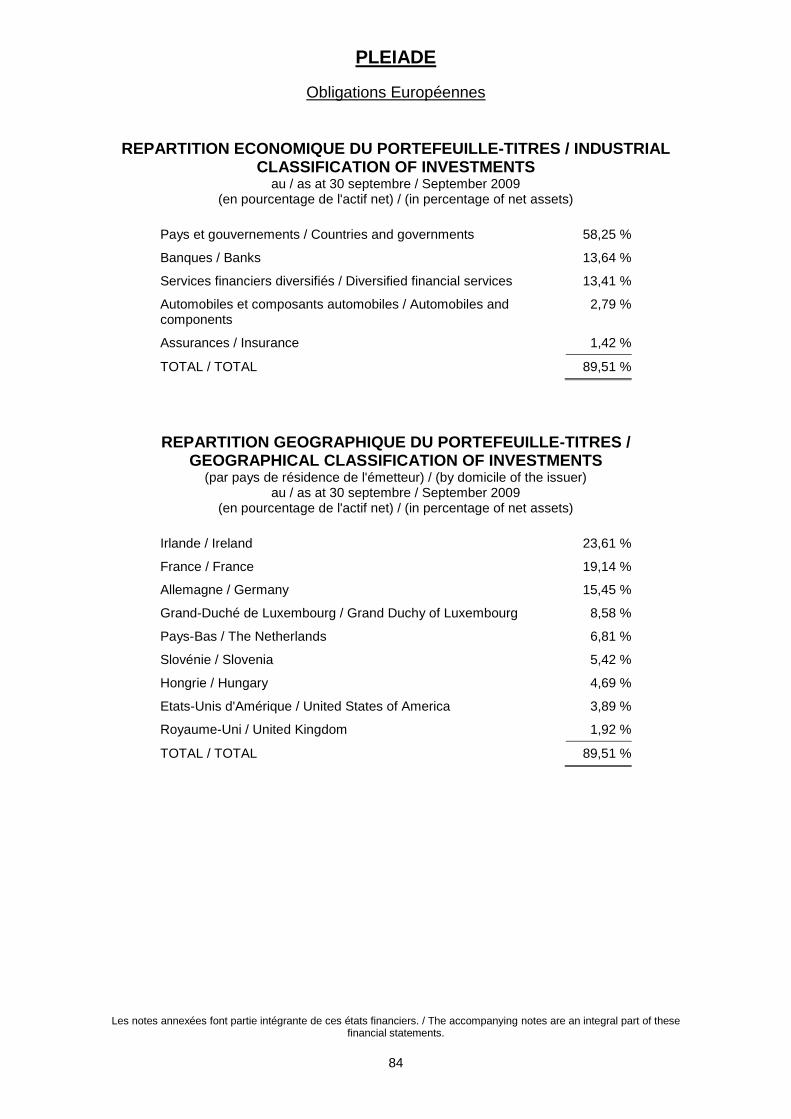
PLEIADE
Obligations Européennes
Les notes annexées font partie intégrante de ces états financiers. / The accompanying notes are an integral part of these financial statements.
84
REPARTITION ECONOMIQUE DU PORTEFEUILLE-TITRES / INDUSTRIAL CLASSIFICATION OF INVESTMENTS
au / as at 30 septembre / September 2009 (en pourcentage de l'actif net) / (in percentage of net assets)
Pays et gouvernements / Countries and governments 58,25 %
Banques / Banks 13,64 %
Services financiers diversifiés / Diversified financial services 13,41 %
Automobiles et composants automobiles / Automobiles and components
2,79 %
Assurances / Insurance 1,42 %
TOTAL / TOTAL 89,51 %
REPARTITION GEOGRAPHIQUE DU PORTEFEUILLE-TITRES / GEOGRAPHICAL CLASSIFICATION OF INVESTMENTS
(par pays de résidence de l'émetteur) / (by domicile of the issuer) au / as at 30 septembre / September 2009
(en pourcentage de l'actif net) / (in percentage of net assets)
Irlande / Ireland 23,61 %
France / France 19,14 %
Allemagne / Germany 15,45 %
Grand-Duché de Luxembourg / Grand Duchy of Luxembourg 8,58 %
Pays-Bas / The Netherlands 6,81 %
Slovénie / Slovenia 5,42 %
Hongrie / Hungary 4,69 %
Etats-Unis d'Amérique / United States of America 3,89 %
Royaume-Uni / United Kingdom 1,92 %
TOTAL / TOTAL 89,51 %
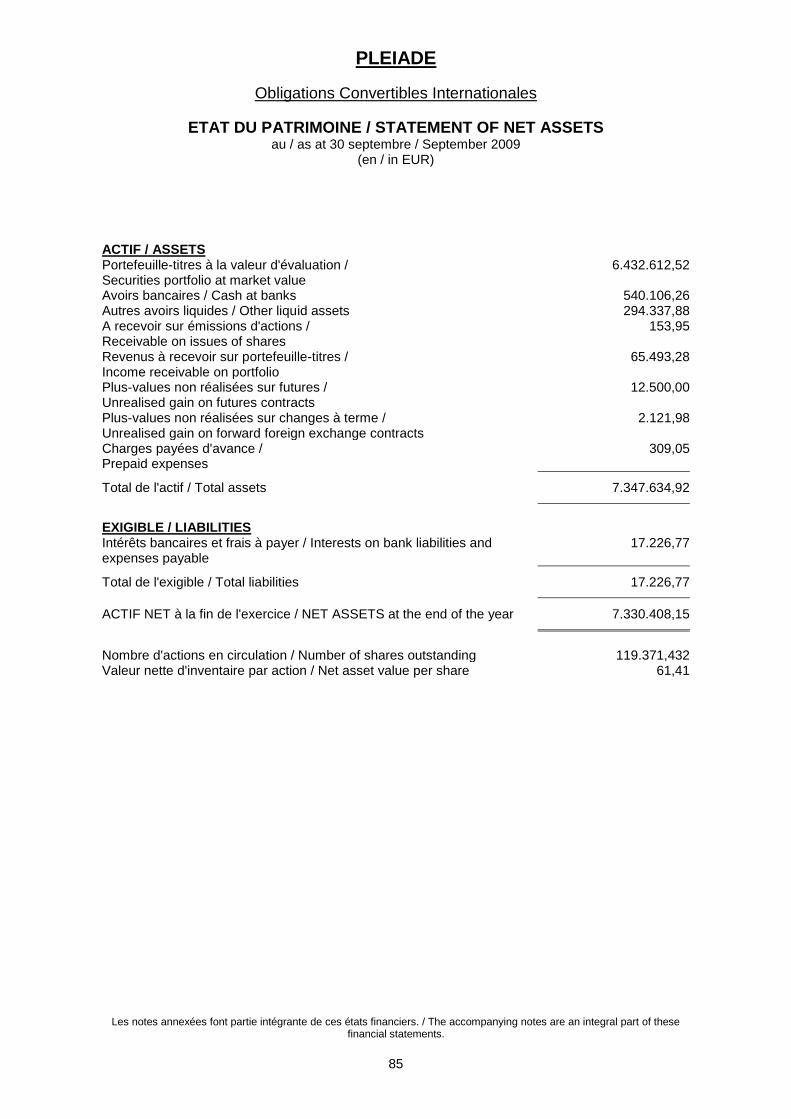
PLEIADE
Obligations Convertibles Internationales
ETAT DU PATRIMOINE / STATEMENT OF NET ASSETS au / as at 30 septembre / September 2009
(en / in EUR)
Les notes annexées font partie intégrante de ces états financiers. / The accompanying notes are an integral part of these financial statements.
85
ACTIF / ASSETS Portefeuille-titres à la valeur d'évaluation / Securities portfolio at market value
6.432.612,52
Avoirs bancaires / Cash at banks 540.106,26 Autres avoirs liquides / Other liquid assets 294.337,88 A recevoir sur émissions d'actions / Receivable on issues of shares
153,95
Revenus à recevoir sur portefeuille-titres / Income receivable on portfolio
65.493,28
Plus-values non réalisées sur futures / Unrealised gain on futures contracts
12.500,00
Plus-values non réalisées sur changes à terme / Unrealised gain on forward foreign exchange contracts
2.121,98
Charges payées d'avance / Prepaid expenses
309,05
Total de l'actif / Total assets 7.347.634,92
EXIGIBLE / LIABILITIES Intérêts bancaires et frais à payer / Interests on bank liabilities and expenses payable
17.226,77
Total de l'exigible / Total liabilities 17.226,77
ACTIF NET à la fin de l'exercice / NET ASSETS at the end of the year 7.330.408,15
Nombre d'actions en circulation / Number of shares outstanding 119.371,432 Valeur nette d'inventaire par action / Net asset value per share 61,41
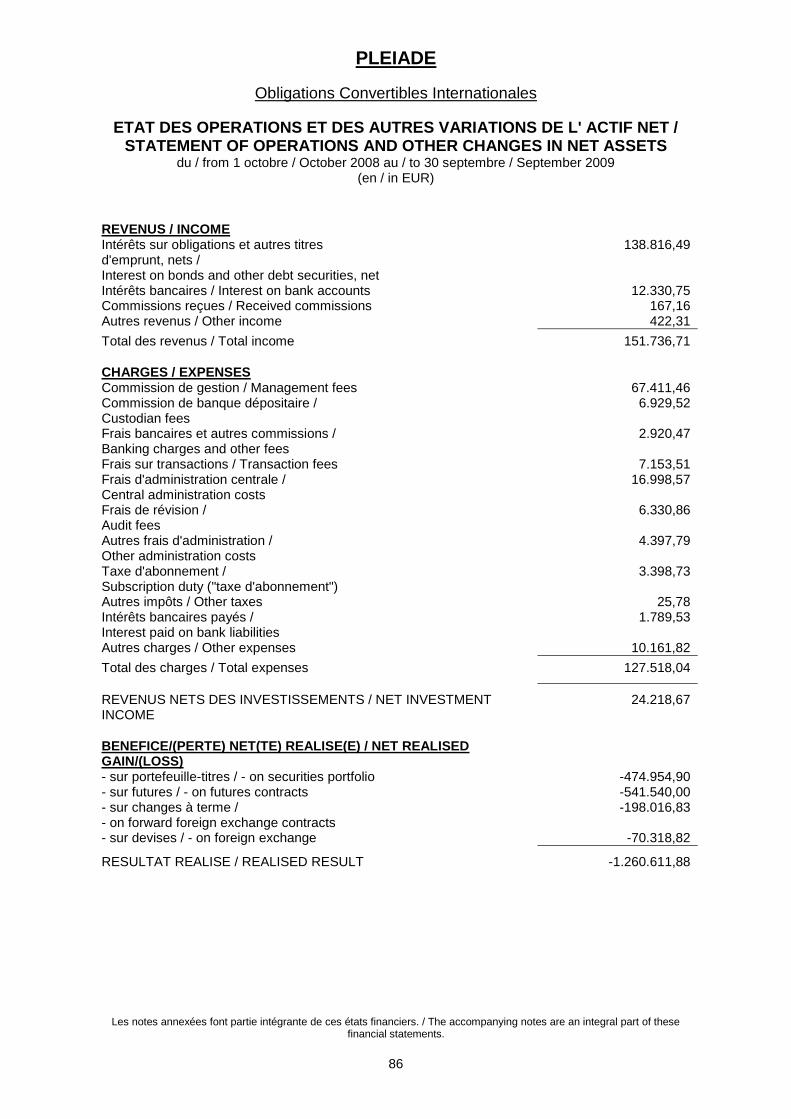
PLEIADE
Obligations Convertibles Internationales
ETAT DES OPERATIONS ET DES AUTRES VARIATIONS DE L' ACTIF NET / STATEMENT OF OPERATIONS AND OTHER CHANGES IN NET ASSETS
du / from 1 octobre / October 2008 au / to 30 septembre / September 2009 (en / in EUR)
Les notes annexées font partie intégrante de ces états financiers. / The accompanying notes are an integral part of these financial statements.
86
REVENUS / INCOME Intérêts sur obligations et autres titres d'emprunt, nets / Interest on bonds and other debt securities, net
138.816,49
Intérêts bancaires / Interest on bank accounts 12.330,75 Commissions reçues / Received commissions 167,16 Autres revenus / Other income 422,31
Total des revenus / Total income 151.736,71
CHARGES / EXPENSES Commission de gestion / Management fees 67.411,46 Commission de banque dépositaire / Custodian fees
6.929,52
Frais bancaires et autres commissions / Banking charges and other fees
2.920,47
Frais sur transactions / Transaction fees 7.153,51 Frais d'administration centrale / Central administration costs
16.998,57
Frais de révision / Audit fees
6.330,86
Autres frais d'administration / Other administration costs
4.397,79
Taxe d'abonnement / Subscription duty ("taxe d'abonnement")
3.398,73
Autres impôts / Other taxes 25,78 Intérêts bancaires payés / Interest paid on bank liabilities
1.789,53
Autres charges / Other expenses 10.161,82
Total des charges / Total expenses 127.518,04
REVENUS NETS DES INVESTISSEMENTS / NET INVESTMENT INCOME
24.218,67
BENEFICE/(PERTE) NET(TE) REALISE(E) / NET REALISED GAIN/(LOSS)
- sur portefeuille-titres / - on securities portfolio -474.954,90 - sur futures / - on futures contracts -541.540,00 - sur changes à terme / - on forward foreign exchange contracts
-198.016,83
- sur devises / - on foreign exchange -70.318,82
RESULTAT REALISE / REALISED RESULT -1.260.611,88
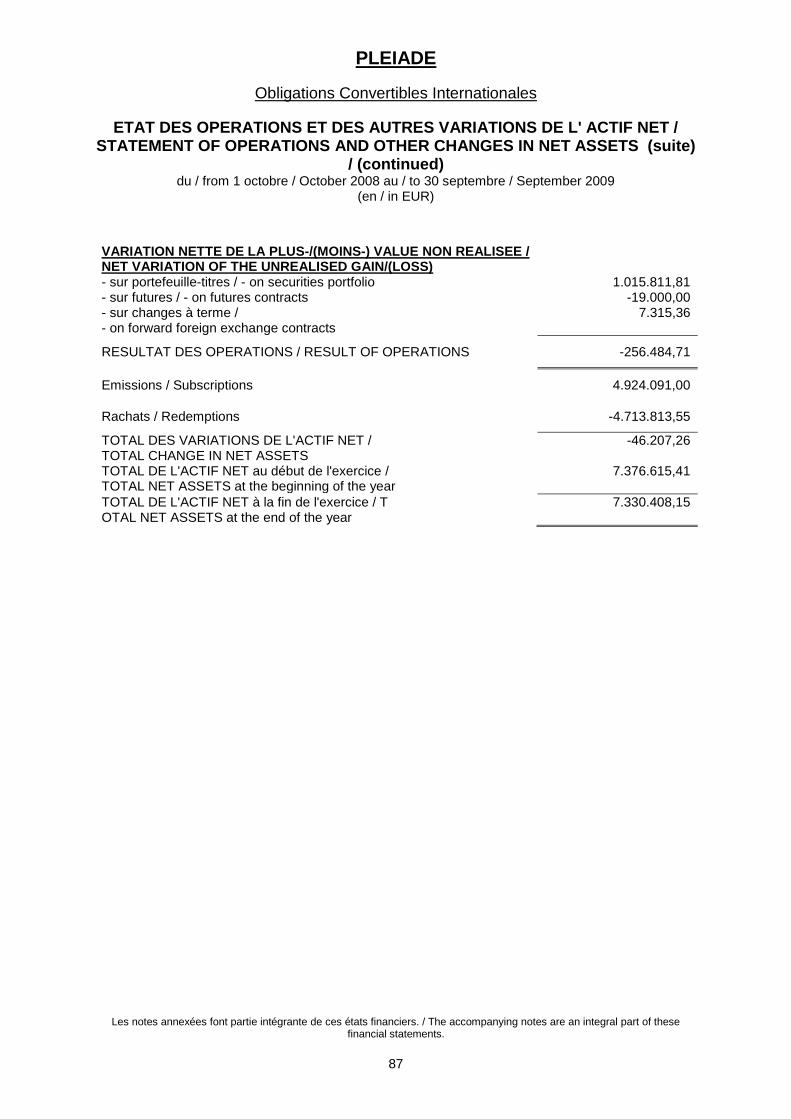
PLEIADE
Obligations Convertibles Internationales
ETAT DES OPERATIONS ET DES AUTRES VARIATIONS DE L' ACTIF NET / STATEMENT OF OPERATIONS AND OTHER CHANGES IN NET ASSETS (suite)
/ (continued) du / from 1 octobre / October 2008 au / to 30 septembre / September 2009
(en / in EUR)
Les notes annexées font partie intégrante de ces états financiers. / The accompanying notes are an integral part of these financial statements.
87
VARIATION NETTE DE LA PLUS-/(MOINS-) VALUE NON REALISEE / NET VARIATION OF THE UNREALISED GAIN/(LOSS)
- sur portefeuille-titres / - on securities portfolio 1.015.811,81 - sur futures / - on futures contracts -19.000,00 - sur changes à terme / - on forward foreign exchange contracts
7.315,36
RESULTAT DES OPERATIONS / RESULT OF OPERATIONS -256.484,71
Emissions / Subscriptions 4.924.091,00
Rachats / Redemptions -4.713.813,55
TOTAL DES VARIATIONS DE L'ACTIF NET / TOTAL CHANGE IN NET ASSETS
-46.207,26
TOTAL DE L'ACTIF NET au début de l'exercice / TOTAL NET ASSETS at the beginning of the year
7.376.615,41
TOTAL DE L'ACTIF NET à la fin de l'exercice / T OTAL NET ASSETS at the end of the year
7.330.408,15
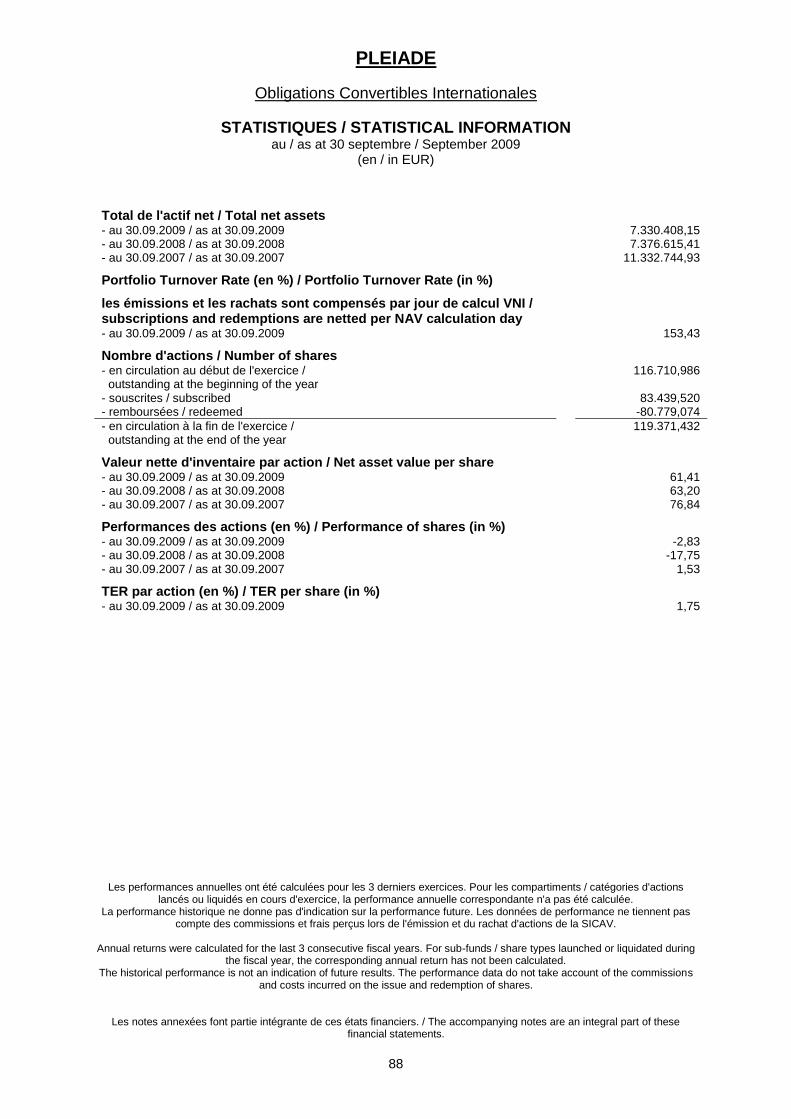
PLEIADE
Obligations Convertibles Internationales
STATISTIQUES / STATISTICAL INFORMATION au / as at 30 septembre / September 2009
(en / in EUR)
Les performances annuelles ont été calculées pour les 3 derniers exercices. Pour les compartiments / catégories d'actions lancés ou liquidés en cours d'exercice, la performance annuelle correspondante n'a pas été calculée.
La performance historique ne donne pas d'indication sur la performance future. Les données de performance ne tiennent pas compte des commissions et frais perçus lors de l'émission et du rachat d'actions de la SICAV.
Annual returns were calculated for the last 3 consecutive fiscal years. For sub-funds / share types launched or liquidated during
the fiscal year, the corresponding annual return has not been calculated. The historical performance is not an indication of future results. The performance data do not take account of the commissions
and costs incurred on the issue and redemption of shares.
Les notes annexées font partie intégrante de ces états financiers. / The accompanying notes are an integral part of these financial statements.
88
Total de l'actif net / Total net assets
- au 30.09.2009 / as at 30.09.2009 7.330.408,15 - au 30.09.2008 / as at 30.09.2008 7.376.615,41 - au 30.09.2007 / as at 30.09.2007 11.332.744,93
Portfolio Turnover Rate (en %) / Portfolio Turnover Rate (in %)
les émissions et les rachats sont compensés par jour de calcul VNI / subscriptions and redemptions are netted per NAV calculation day
- au 30.09.2009 / as at 30.09.2009 153,43
Nombre d'actions / Number of shares
- en circulation au début de l'exercice / outstanding at the beginning of the year
116.710,986
- souscrites / subscribed 83.439,520 - remboursées / redeemed -80.779,074
- en circulation à la fin de l'exercice / outstanding at the end of the year
119.371,432
Valeur nette d'inventaire par action / Net asset value per share
- au 30.09.2009 / as at 30.09.2009 61,41 - au 30.09.2008 / as at 30.09.2008 63,20 - au 30.09.2007 / as at 30.09.2007 76,84
Performances des actions (en %) / Performance of shares (in %)
- au 30.09.2009 / as at 30.09.2009 -2,83 - au 30.09.2008 / as at 30.09.2008 -17,75 - au 30.09.2007 / as at 30.09.2007 1,53
TER par action (en %) / TER per share (in %)
- au 30.09.2009 / as at 30.09.2009 1,75
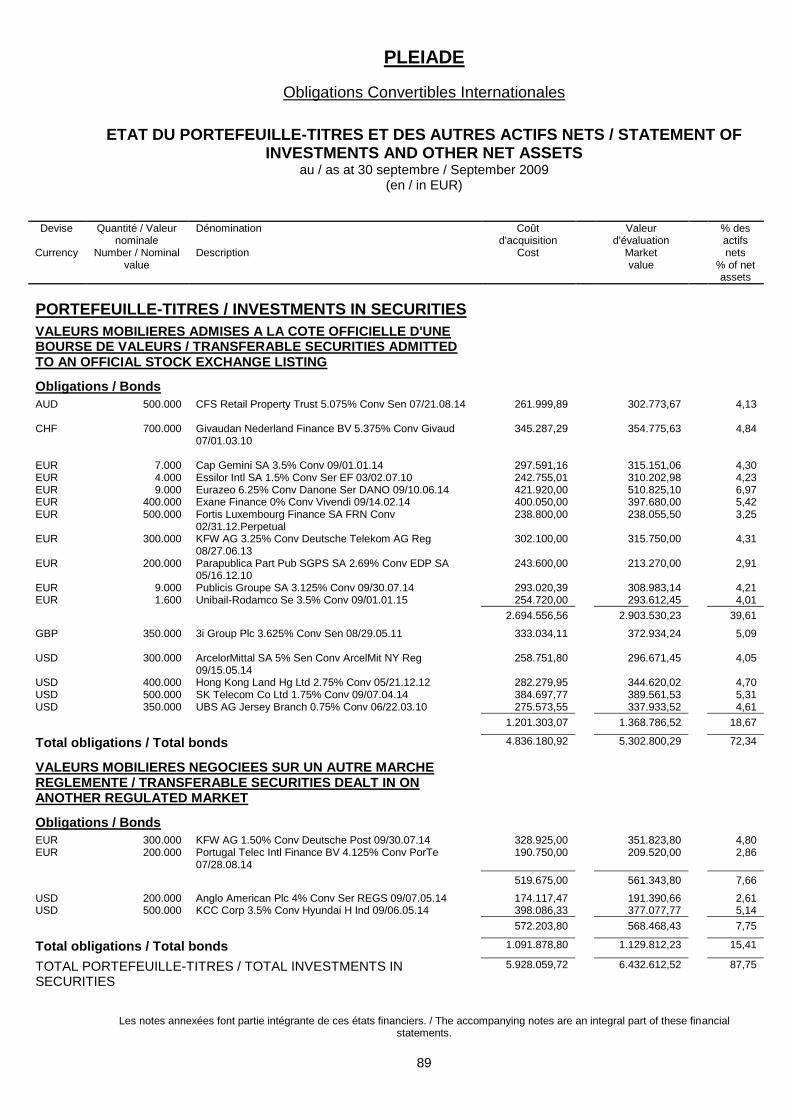
PLEIADE
Obligations Convertibles Internationales
ETAT DU PORTEFEUILLE-TITRES ET DES AUTRES ACTIFS NETS / STATEMENT OF INVESTMENTS AND OTHER NET ASSETS
au / as at 30 septembre / September 2009 (en / in EUR)
Les notes annexées font partie intégrante de ces états financiers. / The accompanying notes are an integral part of these financial statements.
89
Devise
Currency
Quantité / Valeur nominale
Number / Nominal value
Dénomination Description
Coût d'acquisition
Cost
Valeur d'évaluation
Market value
% des actifs nets
% of net assets
PORTEFEUILLE-TITRES / INVESTMENTS IN SECURITIES
VALEURS MOBILIERES ADMISES A LA COTE OFFICIELLE D'UNE BOURSE DE VALEURS / TRANSFERABLE SECURITIES ADMITTED TO AN OFFICIAL STOCK EXCHANGE LISTING
Obligations / Bonds
AUD 500.000 CFS Retail Property Trust 5.075% Conv Sen 07/21.08.14 261.999,89 302.773,67 4,13 CHF 700.000 Givaudan Nederland Finance BV 5.375% Conv Givaud
07/01.03.10 345.287,29 354.775,63 4,84
EUR 7.000 Cap Gemini SA 3.5% Conv 09/01.01.14 297.591,16 315.151,06 4,30 EUR 4.000 Essilor Intl SA 1.5% Conv Ser EF 03/02.07.10 242.755,01 310.202,98 4,23 EUR 9.000 Eurazeo 6.25% Conv Danone Ser DANO 09/10.06.14 421.920,00 510.825,10 6,97 EUR 400.000 Exane Finance 0% Conv Vivendi 09/14.02.14 400.050,00 397.680,00 5,42 EUR 500.000 Fortis Luxembourg Finance SA FRN Conv
02/31.12.Perpetual 238.800,00 238.055,50 3,25
EUR 300.000 KFW AG 3.25% Conv Deutsche Telekom AG Reg 08/27.06.13
302.100,00 315.750,00 4,31
EUR 200.000 Parapublica Part Pub SGPS SA 2.69% Conv EDP SA 05/16.12.10
243.600,00 213.270,00 2,91
EUR 9.000 Publicis Groupe SA 3.125% Conv 09/30.07.14 293.020,39 308.983,14 4,21 EUR 1.600 Unibail-Rodamco Se 3.5% Conv 09/01.01.15 254.720,00 293.612,45 4,01
2.694.556,56 2.903.530,23 39,61
GBP 350.000 3i Group Plc 3.625% Conv Sen 08/29.05.11 333.034,11 372.934,24 5,09 USD 300.000 ArcelorMittal SA 5% Sen Conv ArcelMit NY Reg
09/15.05.14 258.751,80 296.671,45 4,05
USD 400.000 Hong Kong Land Hg Ltd 2.75% Conv 05/21.12.12 282.279,95 344.620,02 4,70 USD 500.000 SK Telecom Co Ltd 1.75% Conv 09/07.04.14 384.697,77 389.561,53 5,31 USD 350.000 UBS AG Jersey Branch 0.75% Conv 06/22.03.10 275.573,55 337.933,52 4,61
1.201.303,07 1.368.786,52 18,67
Total obligations / Total bonds 4.836.180,92 5.302.800,29 72,34
VALEURS MOBILIERES NEGOCIEES SUR UN AUTRE MARCHE REGLEMENTE / TRANSFERABLE SECURITIES DEALT IN ON ANOTHER REGULATED MARKET
Obligations / Bonds
EUR 300.000 KFW AG 1.50% Conv Deutsche Post 09/30.07.14 328.925,00 351.823,80 4,80 EUR 200.000 Portugal Telec Intl Finance BV 4.125% Conv PorTe
07/28.08.14 190.750,00 209.520,00 2,86
519.675,00 561.343,80 7,66
USD 200.000 Anglo American Plc 4% Conv Ser REGS 09/07.05.14 174.117,47 191.390,66 2,61 USD 500.000 KCC Corp 3.5% Conv Hyundai H Ind 09/06.05.14 398.086,33 377.077,77 5,14
572.203,80 568.468,43 7,75
Total obligations / Total bonds 1.091.878,80 1.129.812,23 15,41
TOTAL PORTEFEUILLE-TITRES / TOTAL INVESTMENTS IN SECURITIES
5.928.059,72 6.432.612,52 87,75
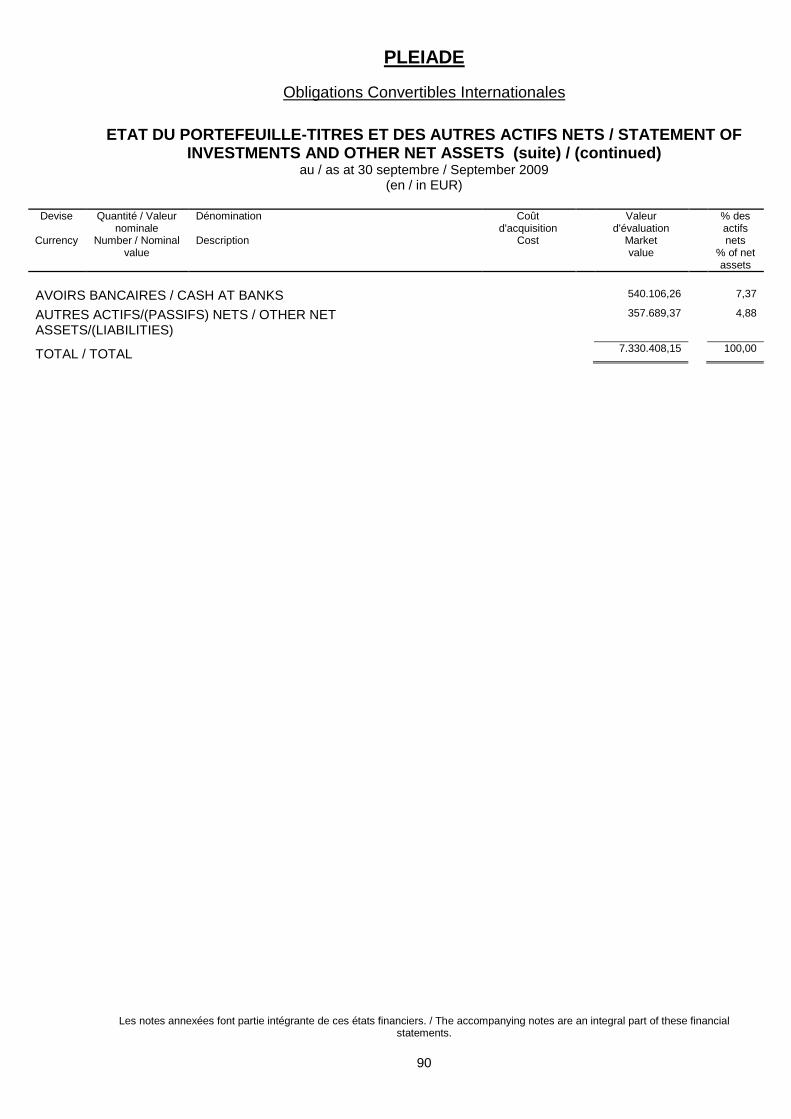
PLEIADE
Obligations Convertibles Internationales
ETAT DU PORTEFEUILLE-TITRES ET DES AUTRES ACTIFS NETS / STATEMENT OF INVESTMENTS AND OTHER NET ASSETS (suite) / (continued)
au / as at 30 septembre / September 2009 (en / in EUR)
Les notes annexées font partie intégrante de ces états financiers. / The accompanying notes are an integral part of these financial statements.
90
Devise
Currency
Quantité / Valeur nominale
Number / Nominal value
Dénomination Description
Coût d'acquisition
Cost
Valeur d'évaluation
Market value
% des actifs nets
% of net assets
AVOIRS BANCAIRES / CASH AT BANKS 540.106,26 7,37
AUTRES ACTIFS/(PASSIFS) NETS / OTHER NET ASSETS/(LIABILITIES)
357.689,37 4,88
TOTAL / TOTAL 7.330.408,15 100,00
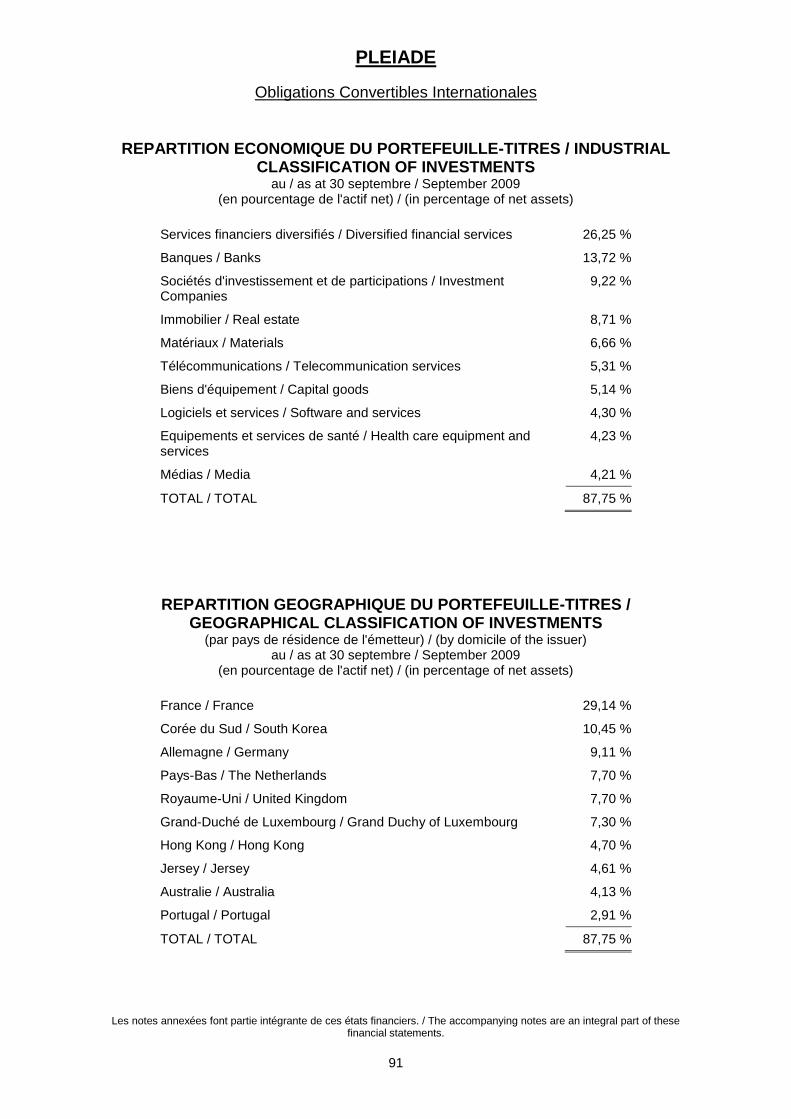
PLEIADE
Obligations Convertibles Internationales
Les notes annexées font partie intégrante de ces états financiers. / The accompanying notes are an integral part of these financial statements.
91
REPARTITION ECONOMIQUE DU PORTEFEUILLE-TITRES / INDUSTRIAL CLASSIFICATION OF INVESTMENTS
au / as at 30 septembre / September 2009 (en pourcentage de l'actif net) / (in percentage of net assets)
Services financiers diversifiés / Diversified financial services 26,25 %
Banques / Banks 13,72 %
Sociétés d'investissement et de participations / Investment Companies
9,22 %
Immobilier / Real estate 8,71 %
Matériaux / Materials 6,66 %
Télécommunications / Telecommunication services 5,31 %
Biens d'équipement / Capital goods 5,14 %
Logiciels et services / Software and services 4,30 %
Equipements et services de santé / Health care equipment and services
4,23 %
Médias / Media 4,21 %
TOTAL / TOTAL 87,75 %
REPARTITION GEOGRAPHIQUE DU PORTEFEUILLE-TITRES / GEOGRAPHICAL CLASSIFICATION OF INVESTMENTS
(par pays de résidence de l'émetteur) / (by domicile of the issuer) au / as at 30 septembre / September 2009
(en pourcentage de l'actif net) / (in percentage of net assets)
France / France 29,14 %
Corée du Sud / South Korea 10,45 %
Allemagne / Germany 9,11 %
Pays-Bas / The Netherlands 7,70 %
Royaume-Uni / United Kingdom 7,70 %
Grand-Duché de Luxembourg / Grand Duchy of Luxembourg 7,30 %
Hong Kong / Hong Kong 4,70 %
Jersey / Jersey 4,61 %
Australie / Australia 4,13 %
Portugal / Portugal 2,91 %
TOTAL / TOTAL 87,75 %
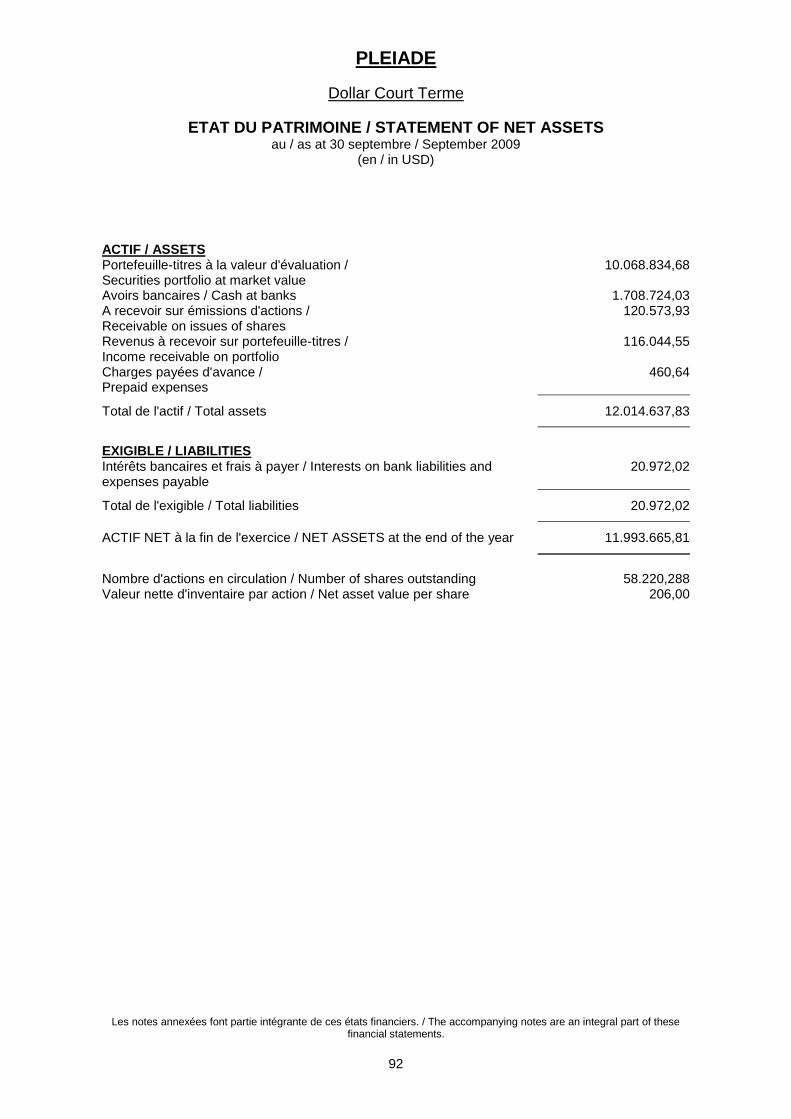
PLEIADE
Dollar Court Terme
ETAT DU PATRIMOINE / STATEMENT OF NET ASSETS au / as at 30 septembre / September 2009
(en / in USD)
Les notes annexées font partie intégrante de ces états financiers. / The accompanying notes are an integral part of these financial statements.
92
ACTIF / ASSETS Portefeuille-titres à la valeur d'évaluation / Securities portfolio at market value
10.068.834,68
Avoirs bancaires / Cash at banks 1.708.724,03 A recevoir sur émissions d'actions / Receivable on issues of shares
120.573,93
Revenus à recevoir sur portefeuille-titres / Income receivable on portfolio
116.044,55
Charges payées d'avance / Prepaid expenses
460,64
Total de l'actif / Total assets 12.014.637,83
EXIGIBLE / LIABILITIES Intérêts bancaires et frais à payer / Interests on bank liabilities and expenses payable
20.972,02
Total de l'exigible / Total liabilities 20.972,02
ACTIF NET à la fin de l'exercice / NET ASSETS at the end of the year 11.993.665,81
Nombre d'actions en circulation / Number of shares outstanding 58.220,288 Valeur nette d'inventaire par action / Net asset value per share 206,00
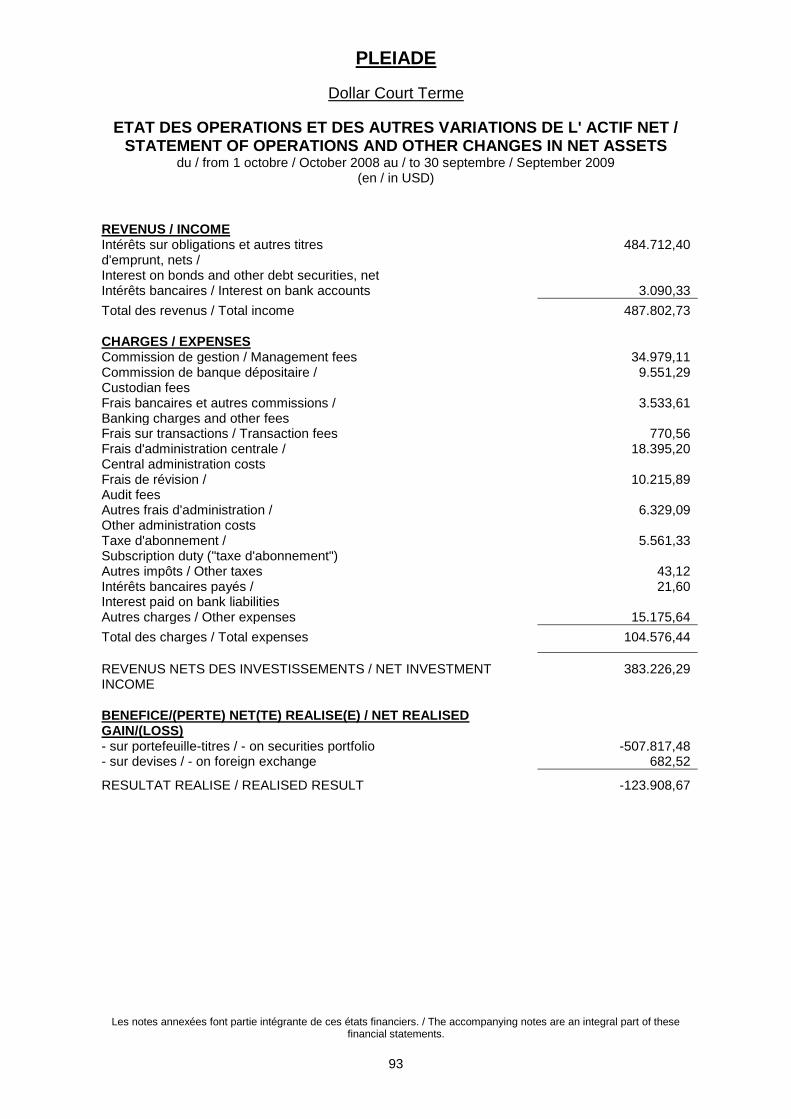
PLEIADE
Dollar Court Terme
ETAT DES OPERATIONS ET DES AUTRES VARIATIONS DE L' ACTIF NET / STATEMENT OF OPERATIONS AND OTHER CHANGES IN NET ASSETS
du / from 1 octobre / October 2008 au / to 30 septembre / September 2009 (en / in USD)
Les notes annexées font partie intégrante de ces états financiers. / The accompanying notes are an integral part of these financial statements.
93
REVENUS / INCOME Intérêts sur obligations et autres titres d'emprunt, nets / Interest on bonds and other debt securities, net
484.712,40
Intérêts bancaires / Interest on bank accounts 3.090,33
Total des revenus / Total income 487.802,73
CHARGES / EXPENSES Commission de gestion / Management fees 34.979,11 Commission de banque dépositaire / Custodian fees
9.551,29
Frais bancaires et autres commissions / Banking charges and other fees
3.533,61
Frais sur transactions / Transaction fees 770,56 Frais d'administration centrale / Central administration costs
18.395,20
Frais de révision / Audit fees
10.215,89
Autres frais d'administration / Other administration costs
6.329,09
Taxe d'abonnement / Subscription duty ("taxe d'abonnement")
5.561,33
Autres impôts / Other taxes 43,12 Intérêts bancaires payés / Interest paid on bank liabilities
21,60
Autres charges / Other expenses 15.175,64
Total des charges / Total expenses 104.576,44
REVENUS NETS DES INVESTISSEMENTS / NET INVESTMENT INCOME
383.226,29
BENEFICE/(PERTE) NET(TE) REALISE(E) / NET REALISED GAIN/(LOSS)
- sur portefeuille-titres / - on securities portfolio -507.817,48 - sur devises / - on foreign exchange 682,52
RESULTAT REALISE / REALISED RESULT -123.908,67

PLEIADE
Dollar Court Terme
ETAT DES OPERATIONS ET DES AUTRES VARIATIONS DE L' ACTIF NET / STATEMENT OF OPERATIONS AND OTHER CHANGES IN NET ASSETS (suite)
/ (continued) du / from 1 octobre / October 2008 au / to 30 septembre / September 2009
(en / in USD)
Les notes annexées font partie intégrante de ces états financiers. / The accompanying notes are an integral part of these financial statements.
94
VARIATION NETTE DE LA PLUS-/(MOINS-) VALUE NON REALISEE / NET VARIATION OF THE UNREALISED GAIN/(LOSS)
- sur portefeuille-titres / - on securities portfolio 796.705,57
RESULTAT DES OPERATIONS / RESULT OF OPERATIONS 672.796,90
Emissions / Subscriptions 4.812.221,61
Rachats / Redemptions -6.150.881,82
TOTAL DES VARIATIONS DE L'ACTIF NET / TOTAL CHANGE IN NET ASSETS
-665.863,31
TOTAL DE L'ACTIF NET au début de l'exercice / TOTAL NET ASSETS at the beginning of the year
12.659.529,12
TOTAL DE L'ACTIF NET à la fin de l'exercice / TOTAL NET ASSETS at the end of the year
11.993.665,81

PLEIADE
Dollar Court Terme
STATISTIQUES / STATISTICAL INFORMATION au / as at 30 septembre / September 2009
(en / in USD)
Les performances annuelles ont été calculées pour les 3 derniers exercices. Pour les compartiments / catégories d'actions lancés ou liquidés en cours d'exercice, la performance annuelle correspondante n'a pas été calculée.
La performance historique ne donne pas d'indication sur la performance future. Les données de performance ne tiennent pas compte des commissions et frais perçus lors de l'émission et du rachat d'actions de la SICAV.
Annual returns were calculated for the last 3 consecutive fiscal years. For sub-funds / share types launched or liquidated during
the fiscal year, the corresponding annual return has not been calculated. The historical performance is not an indication of future results. The performance data do not take account of the commissions
and costs incurred on the issue and redemption of shares.
Les notes annexées font partie intégrante de ces états financiers. / The accompanying notes are an integral part of these financial statements.
95
Total de l'actif net / Total net assets
- au 30.09.2009 / as at 30.09.2009 11.993.665,81 - au 30.09.2008 / as at 30.09.2008 12.659.529,12 - au 30.09.2007 / as at 30.09.2007 21.788.775,08
Portfolio Turnover Rate (en %) / Portfolio Turnover Rate (in %)
les émissions et les rachats sont compensés par jour de calcul VNI / subscriptions and redemptions are netted per NAV calculation day
- au 30.09.2009 / as at 30.09.2009 75,90
Nombre d'actions / Number of shares
- en circulation au début de l'exercice / outstanding at the beginning of the year
65.220,643
- souscrites / subscribed 23.938,519 - remboursées / redeemed -30.938,874
- en circulation à la fin de l'exercice / outstanding at the end of the year
58.220,288
Valeur nette d'inventaire par action / Net asset value per share
- au 30.09.2009 / as at 30.09.2009 206,00 - au 30.09.2008 / as at 30.09.2008 194,10 - au 30.09.2007 / as at 30.09.2007 194,81
Performances des actions (en %) / Performance of shares (in %)
- au 30.09.2009 / as at 30.09.2009 6,13 - au 30.09.2008 / as at 30.09.2008 -0,36 - au 30.09.2007 / as at 30.09.2007 3,88
TER par action (en %) / TER per share (in %)
- au 30.09.2009 / as at 30.09.2009 0,89
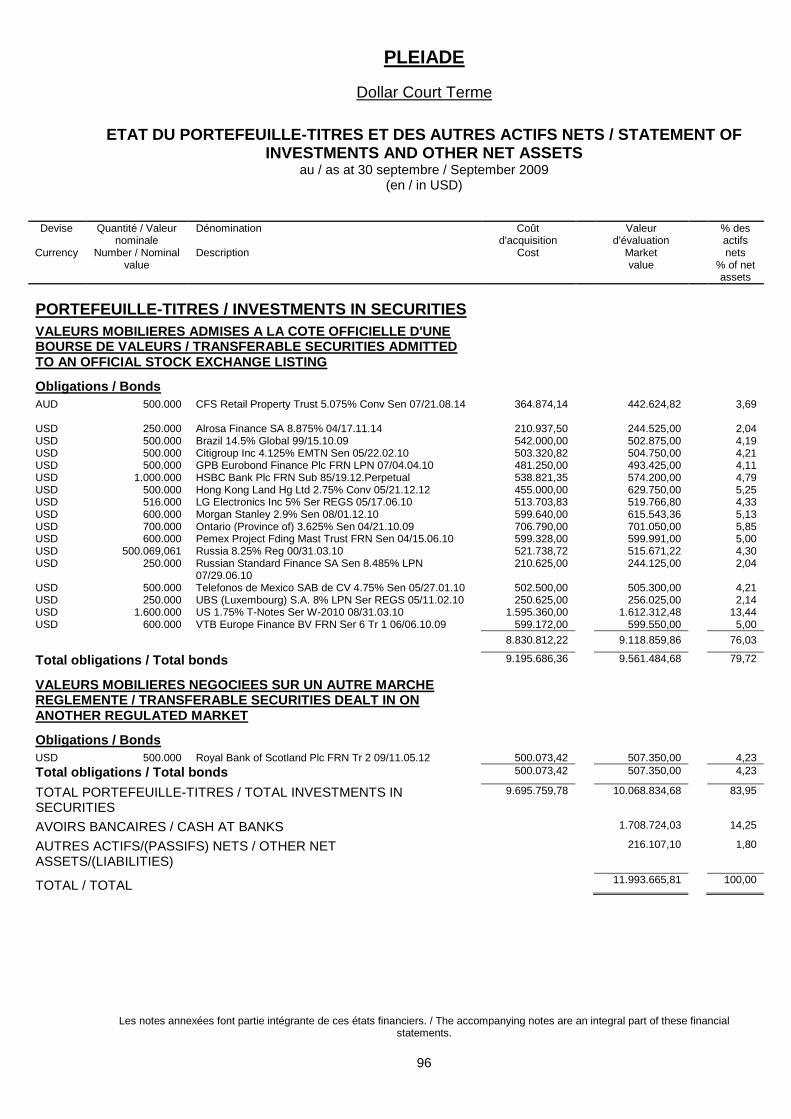
PLEIADE
Dollar Court Terme
ETAT DU PORTEFEUILLE-TITRES ET DES AUTRES ACTIFS NETS / STATEMENT OF INVESTMENTS AND OTHER NET ASSETS
au / as at 30 septembre / September 2009 (en / in USD)
Les notes annexées font partie intégrante de ces états financiers. / The accompanying notes are an integral part of these financial statements.
96
Devise
Currency
Quantité / Valeur nominale
Number / Nominal value
Dénomination Description
Coût d'acquisition
Cost
Valeur d'évaluation
Market value
% des actifs nets
% of net assets
PORTEFEUILLE-TITRES / INVESTMENTS IN SECURITIES
VALEURS MOBILIERES ADMISES A LA COTE OFFICIELLE D'UNE BOURSE DE VALEURS / TRANSFERABLE SECURITIES ADMITTED TO AN OFFICIAL STOCK EXCHANGE LISTING
Obligations / Bonds
AUD 500.000 CFS Retail Property Trust 5.075% Conv Sen 07/21.08.14 364.874,14 442.624,82 3,69 USD 250.000 Alrosa Finance SA 8.875% 04/17.11.14 210.937,50 244.525,00 2,04 USD 500.000 Brazil 14.5% Global 99/15.10.09 542.000,00 502.875,00 4,19 USD 500.000 Citigroup Inc 4.125% EMTN Sen 05/22.02.10 503.320,82 504.750,00 4,21 USD 500.000 GPB Eurobond Finance Plc FRN LPN 07/04.04.10 481.250,00 493.425,00 4,11 USD 1.000.000 HSBC Bank Plc FRN Sub 85/19.12.Perpetual 538.821,35 574.200,00 4,79 USD 500.000 Hong Kong Land Hg Ltd 2.75% Conv 05/21.12.12 455.000,00 629.750,00 5,25 USD 516.000 LG Electronics Inc 5% Ser REGS 05/17.06.10 513.703,83 519.766,80 4,33 USD 600.000 Morgan Stanley 2.9% Sen 08/01.12.10 599.640,00 615.543,36 5,13 USD 700.000 Ontario (Province of) 3.625% Sen 04/21.10.09 706.790,00 701.050,00 5,85 USD 600.000 Pemex Project Fding Mast Trust FRN Sen 04/15.06.10 599.328,00 599.991,00 5,00 USD 500.069,061 Russia 8.25% Reg 00/31.03.10 521.738,72 515.671,22 4,30 USD 250.000 Russian Standard Finance SA Sen 8.485% LPN
07/29.06.10 210.625,00 244.125,00 2,04
USD 500.000 Telefonos de Mexico SAB de CV 4.75% Sen 05/27.01.10 502.500,00 505.300,00 4,21 USD 250.000 UBS (Luxembourg) S.A. 8% LPN Ser REGS 05/11.02.10 250.625,00 256.025,00 2,14 USD 1.600.000 US 1.75% T-Notes Ser W-2010 08/31.03.10 1.595.360,00 1.612.312,48 13,44 USD 600.000 VTB Europe Finance BV FRN Ser 6 Tr 1 06/06.10.09 599.172,00 599.550,00 5,00
8.830.812,22 9.118.859,86 76,03
Total obligations / Total bonds 9.195.686,36 9.561.484,68 79,72
VALEURS MOBILIERES NEGOCIEES SUR UN AUTRE MARCHE REGLEMENTE / TRANSFERABLE SECURITIES DEALT IN ON ANOTHER REGULATED MARKET
Obligations / Bonds
USD 500.000 Royal Bank of Scotland Plc FRN Tr 2 09/11.05.12 500.073,42 507.350,00 4,23
Total obligations / Total bonds 500.073,42 507.350,00 4,23
TOTAL PORTEFEUILLE-TITRES / TOTAL INVESTMENTS IN SECURITIES
9.695.759,78 10.068.834,68 83,95
AVOIRS BANCAIRES / CASH AT BANKS 1.708.724,03 14,25
AUTRES ACTIFS/(PASSIFS) NETS / OTHER NET ASSETS/(LIABILITIES)
216.107,10 1,80
TOTAL / TOTAL 11.993.665,81 100,00
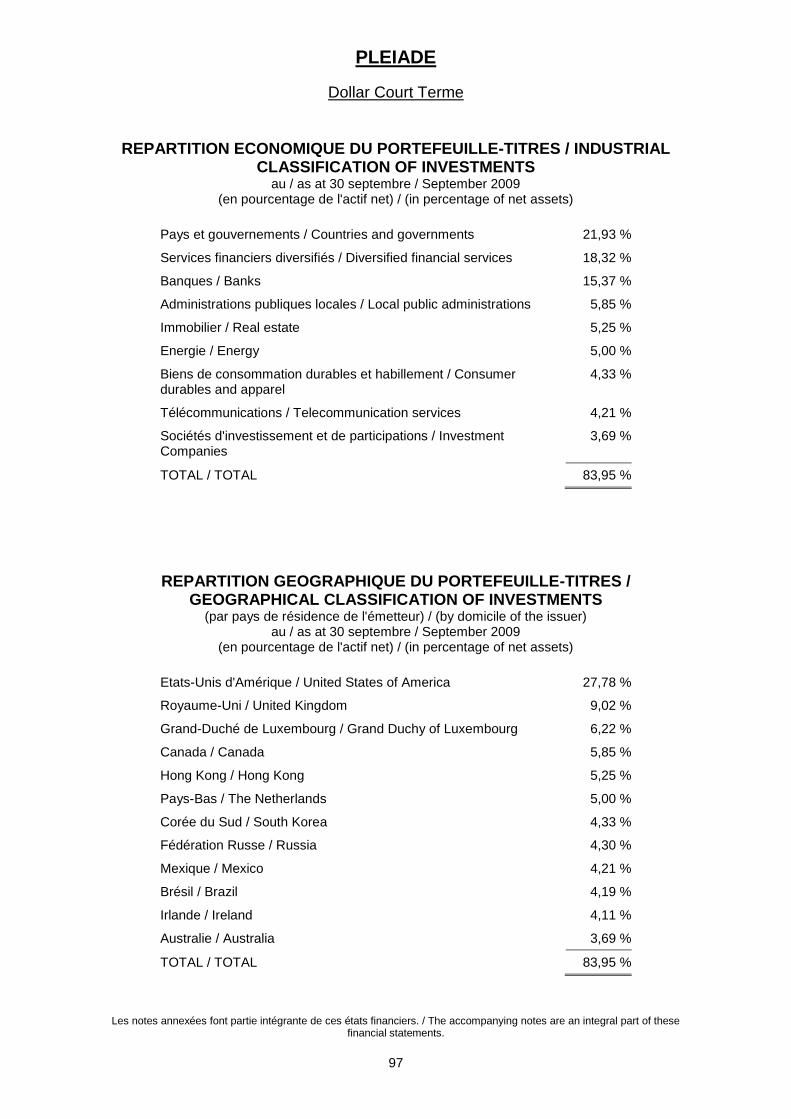
PLEIADE
Dollar Court Terme
Les notes annexées font partie intégrante de ces états financiers. / The accompanying notes are an integral part of these financial statements.
97
REPARTITION ECONOMIQUE DU PORTEFEUILLE-TITRES / INDUSTRIAL CLASSIFICATION OF INVESTMENTS
au / as at 30 septembre / September 2009 (en pourcentage de l'actif net) / (in percentage of net assets)
Pays et gouvernements / Countries and governments 21,93 %
Services financiers diversifiés / Diversified financial services 18,32 %
Banques / Banks 15,37 %
Administrations publiques locales / Local public administrations 5,85 %
Immobilier / Real estate 5,25 %
Energie / Energy 5,00 %
Biens de consommation durables et habillement / Consumer durables and apparel
4,33 %
Télécommunications / Telecommunication services 4,21 %
Sociétés d'investissement et de participations / Investment Companies
3,69 %
TOTAL / TOTAL 83,95 %
REPARTITION GEOGRAPHIQUE DU PORTEFEUILLE-TITRES / GEOGRAPHICAL CLASSIFICATION OF INVESTMENTS
(par pays de résidence de l'émetteur) / (by domicile of the issuer) au / as at 30 septembre / September 2009
(en pourcentage de l'actif net) / (in percentage of net assets)
Etats-Unis d'Amérique / United States of America 27,78 %
Royaume-Uni / United Kingdom 9,02 %
Grand-Duché de Luxembourg / Grand Duchy of Luxembourg 6,22 %
Canada / Canada 5,85 %
Hong Kong / Hong Kong 5,25 %
Pays-Bas / The Netherlands 5,00 %
Corée du Sud / South Korea 4,33 %
Fédération Russe / Russia 4,30 %
Mexique / Mexico 4,21 %
Brésil / Brazil 4,19 %
Irlande / Ireland 4,11 %
Australie / Australia 3,69 %
TOTAL / TOTAL 83,95 %

PLEIADE
Euro Court Terme
ETAT DU PATRIMOINE / STATEMENT OF NET ASSETS au / as at 30 septembre / September 2009
(en / in EUR)
Les notes annexées font partie intégrante de ces états financiers. / The accompanying notes are an integral part of these financial statements.
98
ACTIF / ASSETS Portefeuille-titres à la valeur d'évaluation / Securities portfolio at market value
6.620.926,10
Avoirs bancaires / Cash at banks 629.384,88 A recevoir sur émissions d'actions / Receivable on issues of shares
167,88
Revenus à recevoir sur portefeuille-titres / Income receivable on portfolio
166.008,57
Charges payées d'avance / Prepaid expenses
248,54
Total de l'actif / Total assets 7.416.735,97
EXIGIBLE / LIABILITIES Intérêts bancaires et frais à payer / Interests on bank liabilities and expenses payable
12.489,04
Total de l'exigible / Total liabilities 12.489,04
ACTIF NET à la fin de l'exercice / NET ASSETS at the end of the year 7.404.246,93
Nombre d'actions en circulation / Number of shares outstanding 44.901,641 Valeur nette d'inventaire par action / Net asset value per share 164,90
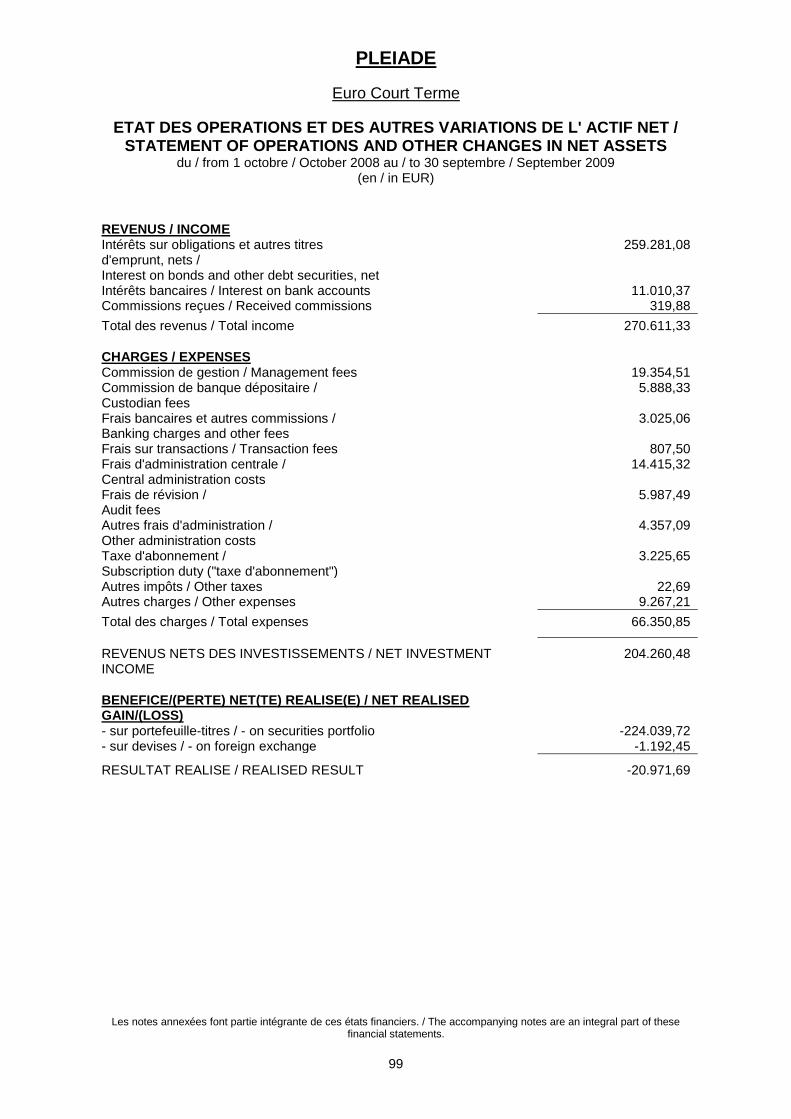
PLEIADE
Euro Court Terme
ETAT DES OPERATIONS ET DES AUTRES VARIATIONS DE L' ACTIF NET / STATEMENT OF OPERATIONS AND OTHER CHANGES IN NET ASSETS
du / from 1 octobre / October 2008 au / to 30 septembre / September 2009 (en / in EUR)
Les notes annexées font partie intégrante de ces états financiers. / The accompanying notes are an integral part of these financial statements.
99
REVENUS / INCOME Intérêts sur obligations et autres titres d'emprunt, nets / Interest on bonds and other debt securities, net
259.281,08
Intérêts bancaires / Interest on bank accounts 11.010,37 Commissions reçues / Received commissions 319,88
Total des revenus / Total income 270.611,33
CHARGES / EXPENSES Commission de gestion / Management fees 19.354,51 Commission de banque dépositaire / Custodian fees
5.888,33
Frais bancaires et autres commissions / Banking charges and other fees
3.025,06
Frais sur transactions / Transaction fees 807,50 Frais d'administration centrale / Central administration costs
14.415,32
Frais de révision / Audit fees
5.987,49
Autres frais d'administration / Other administration costs
4.357,09
Taxe d'abonnement / Subscription duty ("taxe d'abonnement")
3.225,65
Autres impôts / Other taxes 22,69 Autres charges / Other expenses 9.267,21
Total des charges / Total expenses 66.350,85
REVENUS NETS DES INVESTISSEMENTS / NET INVESTMENT INCOME
204.260,48
BENEFICE/(PERTE) NET(TE) REALISE(E) / NET REALISED GAIN/(LOSS)
- sur portefeuille-titres / - on securities portfolio -224.039,72 - sur devises / - on foreign exchange -1.192,45
RESULTAT REALISE / REALISED RESULT -20.971,69
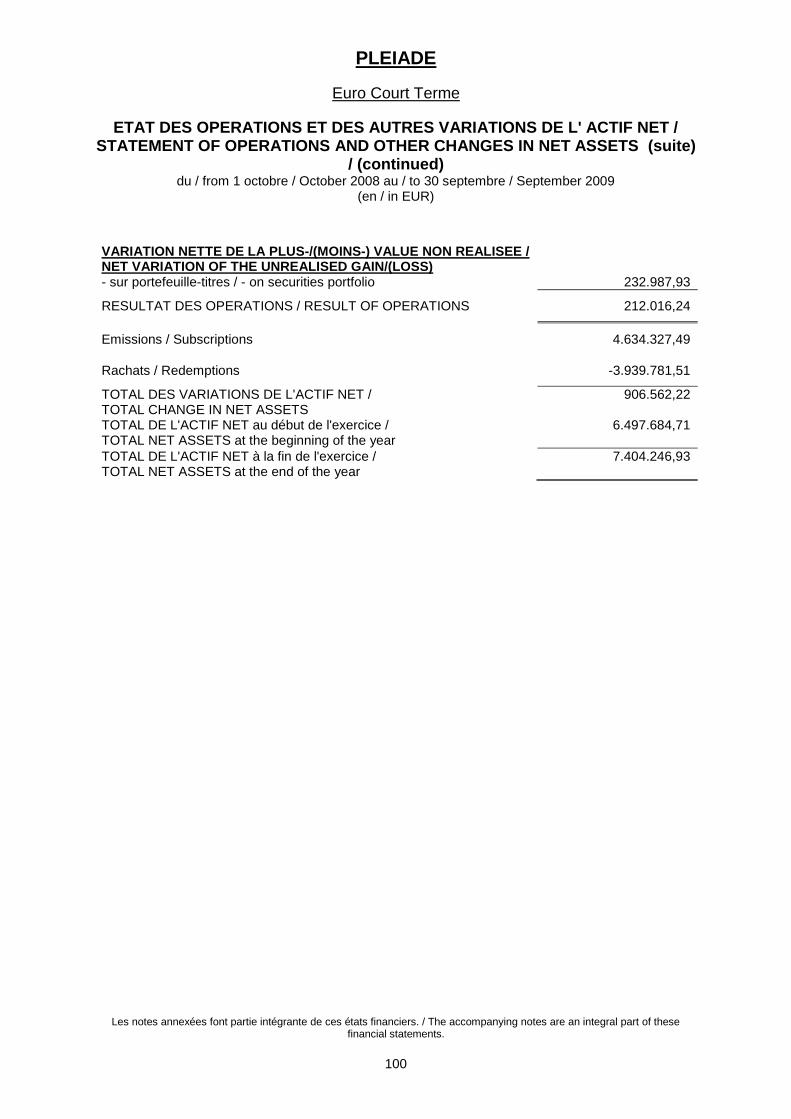
PLEIADE
Euro Court Terme
ETAT DES OPERATIONS ET DES AUTRES VARIATIONS DE L' ACTIF NET / STATEMENT OF OPERATIONS AND OTHER CHANGES IN NET ASSETS (suite)
/ (continued) du / from 1 octobre / October 2008 au / to 30 septembre / September 2009
(en / in EUR)
Les notes annexées font partie intégrante de ces états financiers. / The accompanying notes are an integral part of these financial statements.
100
VARIATION NETTE DE LA PLUS-/(MOINS-) VALUE NON REALISEE / NET VARIATION OF THE UNREALISED GAIN/(LOSS)
- sur portefeuille-titres / - on securities portfolio 232.987,93
RESULTAT DES OPERATIONS / RESULT OF OPERATIONS 212.016,24
Emissions / Subscriptions 4.634.327,49
Rachats / Redemptions -3.939.781,51
TOTAL DES VARIATIONS DE L'ACTIF NET / TOTAL CHANGE IN NET ASSETS
906.562,22
TOTAL DE L'ACTIF NET au début de l'exercice / TOTAL NET ASSETS at the beginning of the year
6.497.684,71
TOTAL DE L'ACTIF NET à la fin de l'exercice / TOTAL NET ASSETS at the end of the year
7.404.246,93

PLEIADE
Euro Court Terme
STATISTIQUES / STATISTICAL INFORMATION au / as at 30 septembre / September 2009
(en / in EUR)
Les performances annuelles ont été calculées pour les 3 derniers exercices. Pour les compartiments / catégories d'actions lancés ou liquidés en cours d'exercice, la performance annuelle correspondante n'a pas été calculée.
La performance historique ne donne pas d'indication sur la performance future. Les données de performance ne tiennent pas compte des commissions et frais perçus lors de l'émission et du rachat d'actions de la SICAV.
Annual returns were calculated for the last 3 consecutive fiscal years. For sub-funds / share types launched or liquidated during
the fiscal year, the corresponding annual return has not been calculated. The historical performance is not an indication of future results. The performance data do not take account of the commissions
and costs incurred on the issue and redemption of shares.
Les notes annexées font partie intégrante de ces états financiers. / The accompanying notes are an integral part of these financial statements.
101
Total de l'actif net / Total net assets
- au 30.09.2009 / as at 30.09.2009 7.404.246,93 - au 30.09.2008 / as at 30.09.2008 6.497.684,71 - au 30.09.2007 / as at 30.09.2007 12.902.970,65
Portfolio Turnover Rate (en %) / Portfolio Turnover Rate (in %)
les émissions et les rachats sont compensés par jour de calcul VNI / subscriptions and redemptions are netted per NAV calculation day
- au 30.09.2009 / as at 30.09.2009 143,39
Nombre d'actions / Number of shares
- en circulation au début de l'exercice / outstanding at the beginning of the year
40.638,051
- souscrites / subscribed 28.780,059 - remboursées / redeemed -24.516,469
- en circulation à la fin de l'exercice / outstanding at the end of the year
44.901,641
Valeur nette d'inventaire par action / Net asset value per share
- au 30.09.2009 / as at 30.09.2009 164,90 - au 30.09.2008 / as at 30.09.2008 159,89 - au 30.09.2007 / as at 30.09.2007 159,92
Performances des actions (en %) / Performance of shares (in %)
- au 30.09.2009 / as at 30.09.2009 3,13 - au 30.09.2008 / as at 30.09.2008 -0,02 - au 30.09.2007 / as at 30.09.2007 2,41
TER par action (en %) / TER per share (in %)
- au 30.09.2009 / as at 30.09.2009 1,01
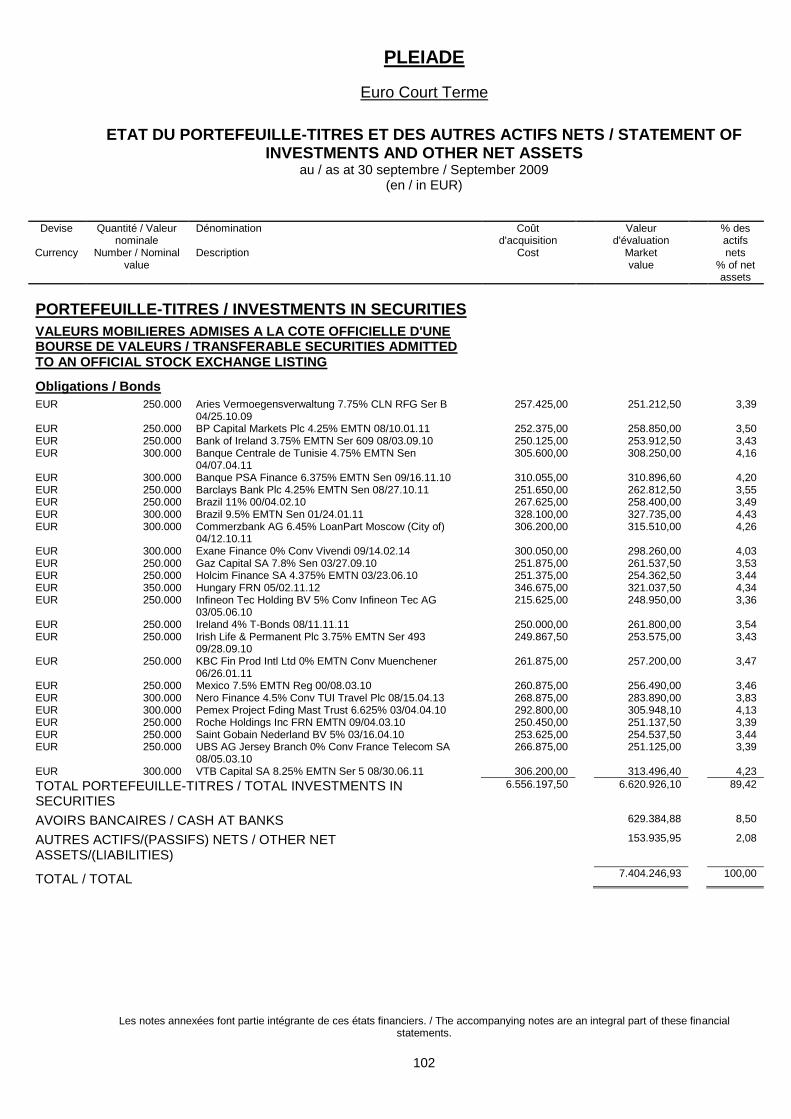
PLEIADE
Euro Court Terme
ETAT DU PORTEFEUILLE-TITRES ET DES AUTRES ACTIFS NETS / STATEMENT OF INVESTMENTS AND OTHER NET ASSETS
au / as at 30 septembre / September 2009 (en / in EUR)
Les notes annexées font partie intégrante de ces états financiers. / The accompanying notes are an integral part of these financial statements.
102
Devise
Currency
Quantité / Valeur nominale
Number / Nominal value
Dénomination Description
Coût d'acquisition
Cost
Valeur d'évaluation
Market value
% des actifs nets
% of net assets
PORTEFEUILLE-TITRES / INVESTMENTS IN SECURITIES
VALEURS MOBILIERES ADMISES A LA COTE OFFICIELLE D'UNE BOURSE DE VALEURS / TRANSFERABLE SECURITIES ADMITTED TO AN OFFICIAL STOCK EXCHANGE LISTING
Obligations / Bonds
EUR 250.000 Aries Vermoegensverwaltung 7.75% CLN RFG Ser B 04/25.10.09
257.425,00 251.212,50 3,39
EUR 250.000 BP Capital Markets Plc 4.25% EMTN 08/10.01.11 252.375,00 258.850,00 3,50 EUR 250.000 Bank of Ireland 3.75% EMTN Ser 609 08/03.09.10 250.125,00 253.912,50 3,43 EUR 300.000 Banque Centrale de Tunisie 4.75% EMTN Sen
04/07.04.11 305.600,00 308.250,00 4,16
EUR 300.000 Banque PSA Finance 6.375% EMTN Sen 09/16.11.10 310.055,00 310.896,60 4,20 EUR 250.000 Barclays Bank Plc 4.25% EMTN Sen 08/27.10.11 251.650,00 262.812,50 3,55 EUR 250.000 Brazil 11% 00/04.02.10 267.625,00 258.400,00 3,49 EUR 300.000 Brazil 9.5% EMTN Sen 01/24.01.11 328.100,00 327.735,00 4,43 EUR 300.000 Commerzbank AG 6.45% LoanPart Moscow (City of)
04/12.10.11 306.200,00 315.510,00 4,26
EUR 300.000 Exane Finance 0% Conv Vivendi 09/14.02.14 300.050,00 298.260,00 4,03 EUR 250.000 Gaz Capital SA 7.8% Sen 03/27.09.10 251.875,00 261.537,50 3,53 EUR 250.000 Holcim Finance SA 4.375% EMTN 03/23.06.10 251.375,00 254.362,50 3,44 EUR 350.000 Hungary FRN 05/02.11.12 346.675,00 321.037,50 4,34 EUR 250.000 Infineon Tec Holding BV 5% Conv Infineon Tec AG
03/05.06.10 215.625,00 248.950,00 3,36
EUR 250.000 Ireland 4% T-Bonds 08/11.11.11 250.000,00 261.800,00 3,54 EUR 250.000 Irish Life & Permanent Plc 3.75% EMTN Ser 493
09/28.09.10 249.867,50 253.575,00 3,43
EUR 250.000 KBC Fin Prod Intl Ltd 0% EMTN Conv Muenchener 06/26.01.11
261.875,00 257.200,00 3,47
EUR 250.000 Mexico 7.5% EMTN Reg 00/08.03.10 260.875,00 256.490,00 3,46 EUR 300.000 Nero Finance 4.5% Conv TUI Travel Plc 08/15.04.13 268.875,00 283.890,00 3,83 EUR 300.000 Pemex Project Fding Mast Trust 6.625% 03/04.04.10 292.800,00 305.948,10 4,13 EUR 250.000 Roche Holdings Inc FRN EMTN 09/04.03.10 250.450,00 251.137,50 3,39 EUR 250.000 Saint Gobain Nederland BV 5% 03/16.04.10 253.625,00 254.537,50 3,44 EUR 250.000 UBS AG Jersey Branch 0% Conv France Telecom SA
08/05.03.10 266.875,00 251.125,00 3,39
EUR 300.000 VTB Capital SA 8.25% EMTN Ser 5 08/30.06.11 306.200,00 313.496,40 4,23
TOTAL PORTEFEUILLE-TITRES / TOTAL INVESTMENTS IN SECURITIES
6.556.197,50 6.620.926,10 89,42
AVOIRS BANCAIRES / CASH AT BANKS 629.384,88 8,50
AUTRES ACTIFS/(PASSIFS) NETS / OTHER NET ASSETS/(LIABILITIES)
153.935,95 2,08
TOTAL / TOTAL 7.404.246,93 100,00
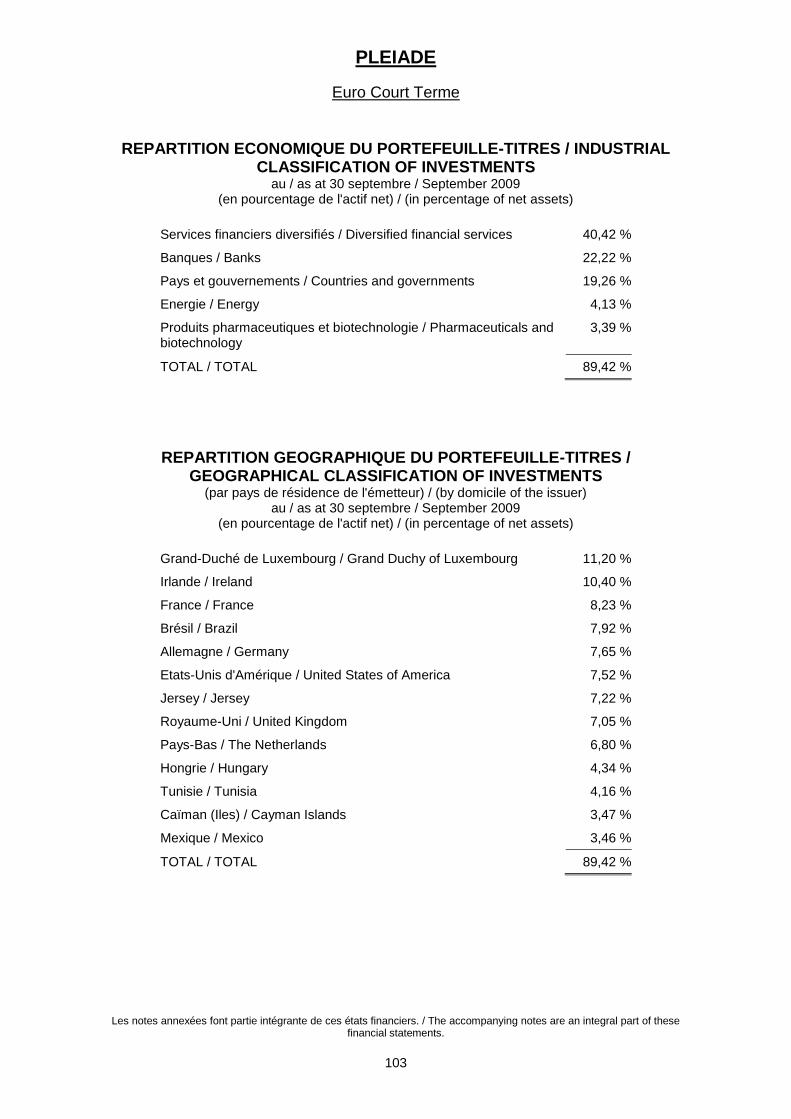
PLEIADE
Euro Court Terme
Les notes annexées font partie intégrante de ces états financiers. / The accompanying notes are an integral part of these financial statements.
103
REPARTITION ECONOMIQUE DU PORTEFEUILLE-TITRES / INDUSTRIAL CLASSIFICATION OF INVESTMENTS
au / as at 30 septembre / September 2009 (en pourcentage de l'actif net) / (in percentage of net assets)
Services financiers diversifiés / Diversified financial services 40,42 %
Banques / Banks 22,22 %
Pays et gouvernements / Countries and governments 19,26 %
Energie / Energy 4,13 %
Produits pharmaceutiques et biotechnologie / Pharmaceuticals and biotechnology
3,39 %
TOTAL / TOTAL 89,42 %
REPARTITION GEOGRAPHIQUE DU PORTEFEUILLE-TITRES / GEOGRAPHICAL CLASSIFICATION OF INVESTMENTS
(par pays de résidence de l'émetteur) / (by domicile of the issuer) au / as at 30 septembre / September 2009
(en pourcentage de l'actif net) / (in percentage of net assets)
Grand-Duché de Luxembourg / Grand Duchy of Luxembourg 11,20 %
Irlande / Ireland 10,40 %
France / France 8,23 %
Brésil / Brazil 7,92 %
Allemagne / Germany 7,65 %
Etats-Unis d'Amérique / United States of America 7,52 %
Jersey / Jersey 7,22 %
Royaume-Uni / United Kingdom 7,05 %
Pays-Bas / The Netherlands 6,80 %
Hongrie / Hungary 4,34 %
Tunisie / Tunisia 4,16 %
Caïman (Iles) / Cayman Islands 3,47 %
Mexique / Mexico 3,46 %
TOTAL / TOTAL 89,42 %

PLEIADE
Euro Balanced (anciennement / formerly Actions "Privatinvestor")
ETAT DU PATRIMOINE / STATEMENT OF NET ASSETS au / as at 30 septembre / September 2009
(en / in EUR)
Les notes annexées font partie intégrante de ces états financiers. / The accompanying notes are an integral part of these financial statements.
104
ACTIF / ASSETS Portefeuille-titres à la valeur d'évaluation / Securities portfolio at market value
13.440.135,20
Avoirs bancaires / Cash at banks 901.814,46 Autres avoirs liquides / Other liquid assets 328.847,75 A recevoir sur émissions d'actions / Receivable on issues of shares
138.921,60
Revenus à recevoir sur portefeuille-titres / Income receivable on portfolio
129.568,06
Plus-values non réalisées sur futures / Unrealised gain on futures contracts
12.500,00
Charges payées d'avance / Prepaid expenses
447,60
Total de l'actif / Total assets 14.952.234,67
EXIGIBLE / LIABILITIES Intérêts bancaires et frais à payer / Interests on bank liabilities and expenses payable
35.402,84
Total de l'exigible / Total liabilities 35.402,84
ACTIF NET à la fin de l'exercice / NET ASSETS at the end of the year 14.916.831,83
Nombre d'actions en circulation / Number of shares outstanding 186.682,996 Valeur nette d'inventaire par action / Net asset value per share 79,90
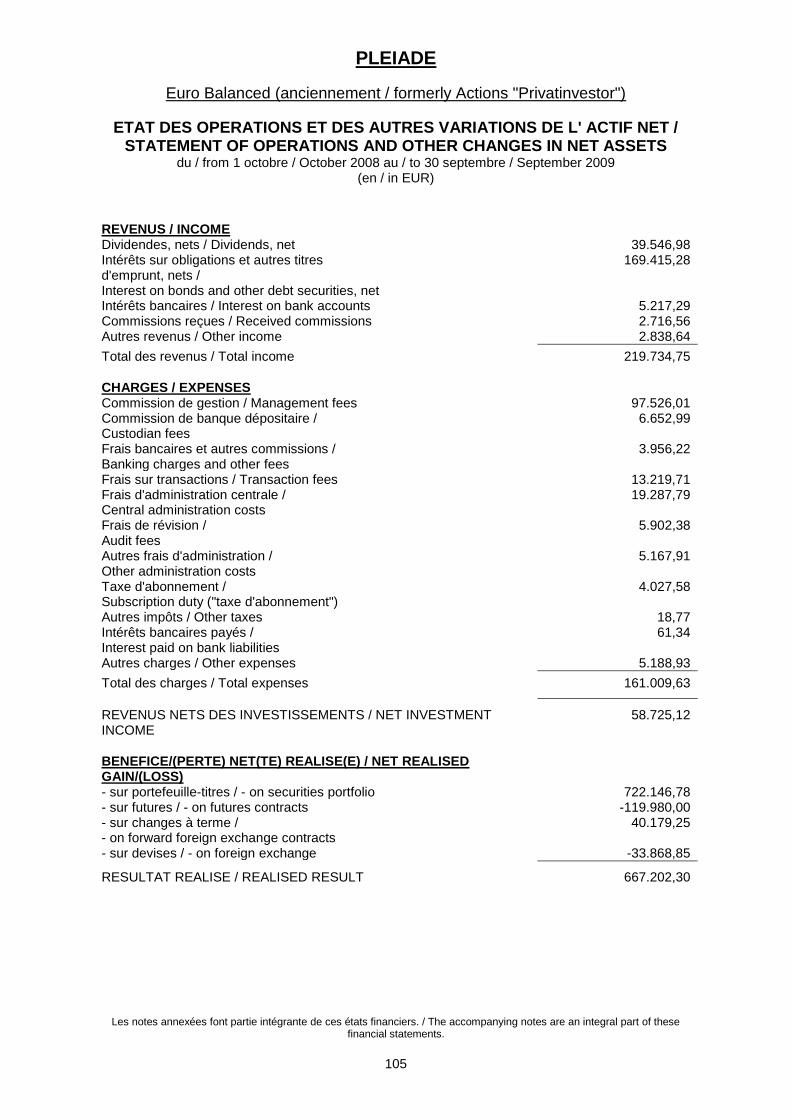
PLEIADE
Euro Balanced (anciennement / formerly Actions "Privatinvestor")
ETAT DES OPERATIONS ET DES AUTRES VARIATIONS DE L' ACTIF NET / STATEMENT OF OPERATIONS AND OTHER CHANGES IN NET ASSETS
du / from 1 octobre / October 2008 au / to 30 septembre / September 2009 (en / in EUR)
Les notes annexées font partie intégrante de ces états financiers. / The accompanying notes are an integral part of these financial statements.
105
REVENUS / INCOME Dividendes, nets / Dividends, net 39.546,98 Intérêts sur obligations et autres titres d'emprunt, nets / Interest on bonds and other debt securities, net
169.415,28
Intérêts bancaires / Interest on bank accounts 5.217,29 Commissions reçues / Received commissions 2.716,56 Autres revenus / Other income 2.838,64
Total des revenus / Total income 219.734,75
CHARGES / EXPENSES Commission de gestion / Management fees 97.526,01 Commission de banque dépositaire / Custodian fees
6.652,99
Frais bancaires et autres commissions / Banking charges and other fees
3.956,22
Frais sur transactions / Transaction fees 13.219,71 Frais d'administration centrale / Central administration costs
19.287,79
Frais de révision / Audit fees
5.902,38
Autres frais d'administration / Other administration costs
5.167,91
Taxe d'abonnement / Subscription duty ("taxe d'abonnement")
4.027,58
Autres impôts / Other taxes 18,77 Intérêts bancaires payés / Interest paid on bank liabilities
61,34
Autres charges / Other expenses 5.188,93
Total des charges / Total expenses 161.009,63
REVENUS NETS DES INVESTISSEMENTS / NET INVESTMENT INCOME
58.725,12
BENEFICE/(PERTE) NET(TE) REALISE(E) / NET REALISED GAIN/(LOSS)
- sur portefeuille-titres / - on securities portfolio 722.146,78 - sur futures / - on futures contracts -119.980,00 - sur changes à terme / - on forward foreign exchange contracts
40.179,25
- sur devises / - on foreign exchange -33.868,85
RESULTAT REALISE / REALISED RESULT 667.202,30
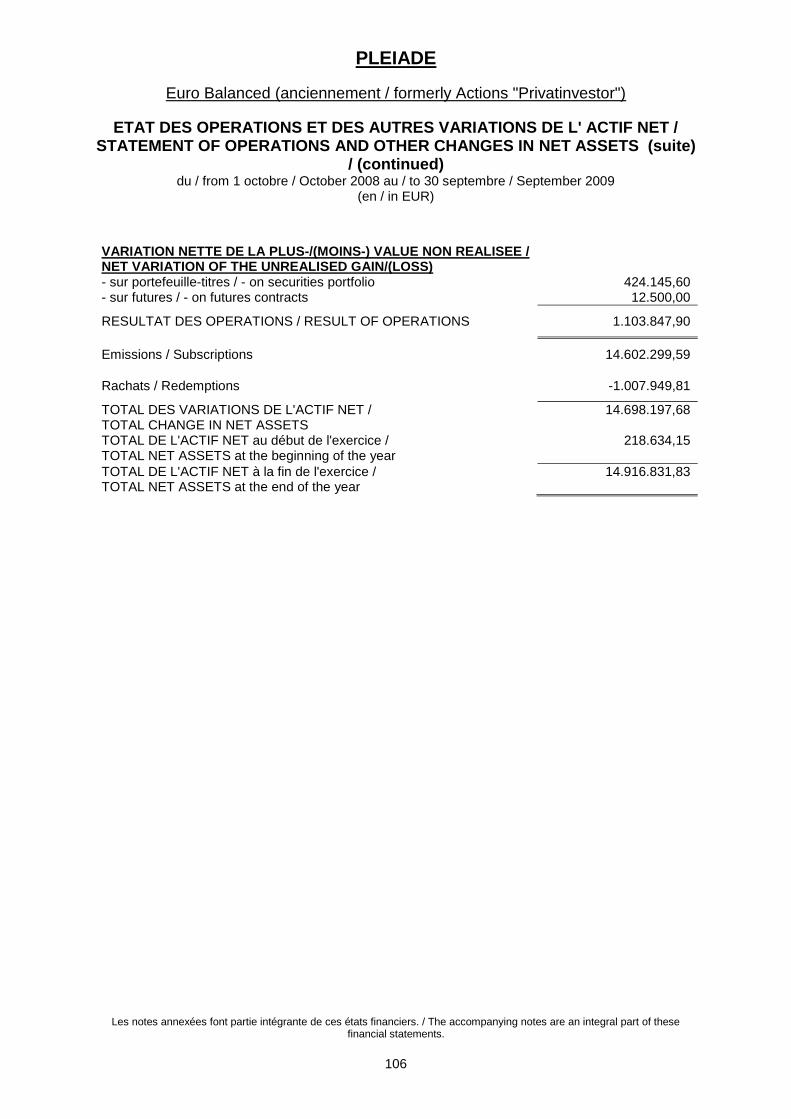
PLEIADE
Euro Balanced (anciennement / formerly Actions "Privatinvestor")
ETAT DES OPERATIONS ET DES AUTRES VARIATIONS DE L' ACTIF NET / STATEMENT OF OPERATIONS AND OTHER CHANGES IN NET ASSETS (suite)
/ (continued) du / from 1 octobre / October 2008 au / to 30 septembre / September 2009
(en / in EUR)
Les notes annexées font partie intégrante de ces états financiers. / The accompanying notes are an integral part of these financial statements.
106
VARIATION NETTE DE LA PLUS-/(MOINS-) VALUE NON REALISEE / NET VARIATION OF THE UNREALISED GAIN/(LOSS)
- sur portefeuille-titres / - on securities portfolio 424.145,60 - sur futures / - on futures contracts 12.500,00
RESULTAT DES OPERATIONS / RESULT OF OPERATIONS 1.103.847,90
Emissions / Subscriptions 14.602.299,59
Rachats / Redemptions -1.007.949,81
TOTAL DES VARIATIONS DE L'ACTIF NET / TOTAL CHANGE IN NET ASSETS
14.698.197,68
TOTAL DE L'ACTIF NET au début de l'exercice / TOTAL NET ASSETS at the beginning of the year
218.634,15
TOTAL DE L'ACTIF NET à la fin de l'exercice / TOTAL NET ASSETS at the end of the year
14.916.831,83
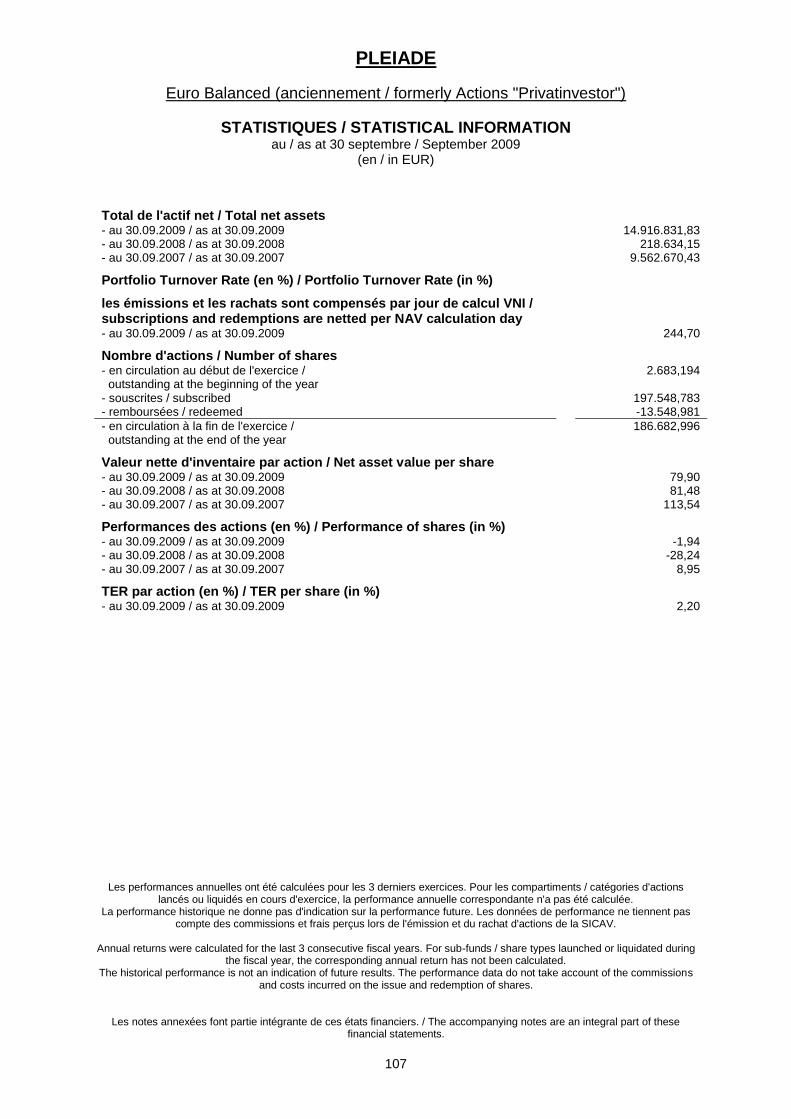
PLEIADE
Euro Balanced (anciennement / formerly Actions "Privatinvestor")
STATISTIQUES / STATISTICAL INFORMATION au / as at 30 septembre / September 2009
(en / in EUR)
Les performances annuelles ont été calculées pour les 3 derniers exercices. Pour les compartiments / catégories d'actions lancés ou liquidés en cours d'exercice, la performance annuelle correspondante n'a pas été calculée.
La performance historique ne donne pas d'indication sur la performance future. Les données de performance ne tiennent pas compte des commissions et frais perçus lors de l'émission et du rachat d'actions de la SICAV.
Annual returns were calculated for the last 3 consecutive fiscal years. For sub-funds / share types launched or liquidated during
the fiscal year, the corresponding annual return has not been calculated. The historical performance is not an indication of future results. The performance data do not take account of the commissions
and costs incurred on the issue and redemption of shares.
Les notes annexées font partie intégrante de ces états financiers. / The accompanying notes are an integral part of these financial statements.
107
Total de l'actif net / Total net assets
- au 30.09.2009 / as at 30.09.2009 14.916.831,83 - au 30.09.2008 / as at 30.09.2008 218.634,15 - au 30.09.2007 / as at 30.09.2007 9.562.670,43
Portfolio Turnover Rate (en %) / Portfolio Turnover Rate (in %)
les émissions et les rachats sont compensés par jour de calcul VNI / subscriptions and redemptions are netted per NAV calculation day
- au 30.09.2009 / as at 30.09.2009 244,70
Nombre d'actions / Number of shares
- en circulation au début de l'exercice / outstanding at the beginning of the year
2.683,194
- souscrites / subscribed 197.548,783 - remboursées / redeemed -13.548,981
- en circulation à la fin de l'exercice / outstanding at the end of the year
186.682,996
Valeur nette d'inventaire par action / Net asset value per share
- au 30.09.2009 / as at 30.09.2009 79,90 - au 30.09.2008 / as at 30.09.2008 81,48 - au 30.09.2007 / as at 30.09.2007 113,54
Performances des actions (en %) / Performance of shares (in %)
- au 30.09.2009 / as at 30.09.2009 -1,94 - au 30.09.2008 / as at 30.09.2008 -28,24 - au 30.09.2007 / as at 30.09.2007 8,95
TER par action (en %) / TER per share (in %)
- au 30.09.2009 / as at 30.09.2009 2,20
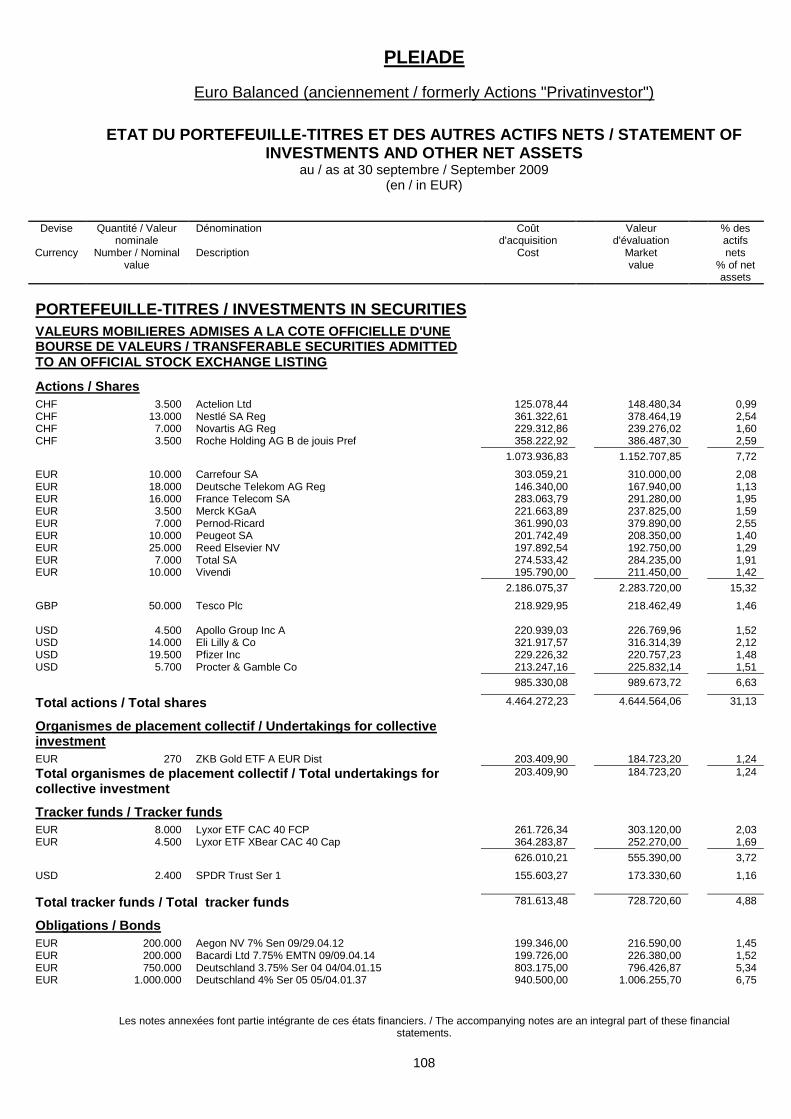
PLEIADE
Euro Balanced (anciennement / formerly Actions "Privatinvestor")
ETAT DU PORTEFEUILLE-TITRES ET DES AUTRES ACTIFS NETS / STATEMENT OF INVESTMENTS AND OTHER NET ASSETS
au / as at 30 septembre / September 2009 (en / in EUR)
Les notes annexées font partie intégrante de ces états financiers. / The accompanying notes are an integral part of these financial statements.
108
Devise
Currency
Quantité / Valeur nominale
Number / Nominal value
Dénomination Description
Coût d'acquisition
Cost
Valeur d'évaluation
Market value
% des actifs nets
% of net assets
PORTEFEUILLE-TITRES / INVESTMENTS IN SECURITIES
VALEURS MOBILIERES ADMISES A LA COTE OFFICIELLE D'UNE BOURSE DE VALEURS / TRANSFERABLE SECURITIES ADMITTED TO AN OFFICIAL STOCK EXCHANGE LISTING
Actions / Shares
CHF 3.500 Actelion Ltd 125.078,44 148.480,34 0,99 CHF 13.000 Nestlé SA Reg 361.322,61 378.464,19 2,54 CHF 7.000 Novartis AG Reg 229.312,86 239.276,02 1,60 CHF 3.500 Roche Holding AG B de jouis Pref 358.222,92 386.487,30 2,59
1.073.936,83 1.152.707,85 7,72
EUR 10.000 Carrefour SA 303.059,21 310.000,00 2,08 EUR 18.000 Deutsche Telekom AG Reg 146.340,00 167.940,00 1,13 EUR 16.000 France Telecom SA 283.063,79 291.280,00 1,95 EUR 3.500 Merck KGaA 221.663,89 237.825,00 1,59 EUR 7.000 Pernod-Ricard 361.990,03 379.890,00 2,55 EUR 10.000 Peugeot SA 201.742,49 208.350,00 1,40 EUR 25.000 Reed Elsevier NV 197.892,54 192.750,00 1,29 EUR 7.000 Total SA 274.533,42 284.235,00 1,91 EUR 10.000 Vivendi 195.790,00 211.450,00 1,42
2.186.075,37 2.283.720,00 15,32
GBP 50.000 Tesco Plc 218.929,95 218.462,49 1,46 USD 4.500 Apollo Group Inc A 220.939,03 226.769,96 1,52 USD 14.000 Eli Lilly & Co 321.917,57 316.314,39 2,12 USD 19.500 Pfizer Inc 229.226,32 220.757,23 1,48 USD 5.700 Procter & Gamble Co 213.247,16 225.832,14 1,51
985.330,08 989.673,72 6,63
Total actions / Total shares 4.464.272,23 4.644.564,06 31,13
Organismes de placement collectif / Undertakings for collective investment
EUR 270 ZKB Gold ETF A EUR Dist 203.409,90 184.723,20 1,24
Total organismes de placement collectif / Total undertakings for collective investment
203.409,90 184.723,20 1,24
Tracker funds / Tracker funds
EUR 8.000 Lyxor ETF CAC 40 FCP 261.726,34 303.120,00 2,03 EUR 4.500 Lyxor ETF XBear CAC 40 Cap 364.283,87 252.270,00 1,69
626.010,21 555.390,00 3,72
USD 2.400 SPDR Trust Ser 1 155.603,27 173.330,60 1,16
Total tracker funds / Total tracker funds 781.613,48 728.720,60 4,88
Obligations / Bonds
EUR 200.000 Aegon NV 7% Sen 09/29.04.12 199.346,00 216.590,00 1,45 EUR 200.000 Bacardi Ltd 7.75% EMTN 09/09.04.14 199.726,00 226.380,00 1,52 EUR 750.000 Deutschland 3.75% Ser 04 04/04.01.15 803.175,00 796.426,87 5,34 EUR 1.000.000 Deutschland 4% Ser 05 05/04.01.37 940.500,00 1.006.255,70 6,75
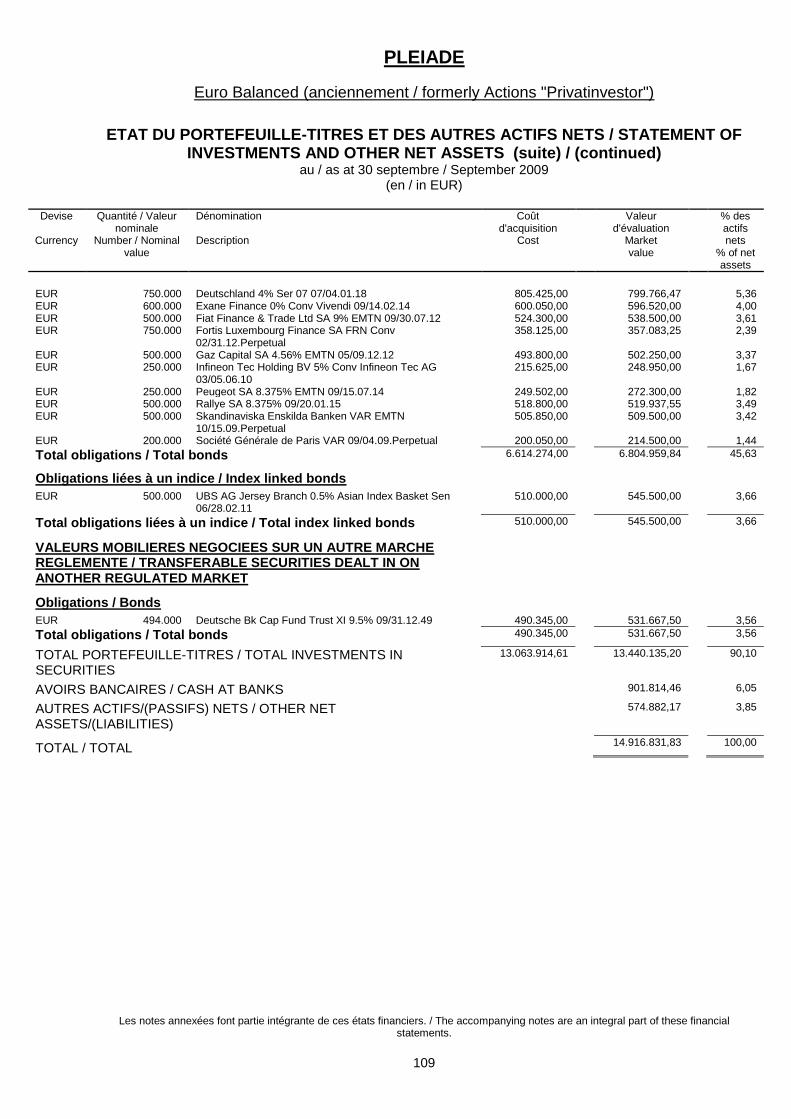
PLEIADE
Euro Balanced (anciennement / formerly Actions "Privatinvestor")
ETAT DU PORTEFEUILLE-TITRES ET DES AUTRES ACTIFS NETS / STATEMENT OF INVESTMENTS AND OTHER NET ASSETS (suite) / (continued)
au / as at 30 septembre / September 2009 (en / in EUR)
Les notes annexées font partie intégrante de ces états financiers. / The accompanying notes are an integral part of these financial statements.
109
Devise
Currency
Quantité / Valeur nominale
Number / Nominal value
Dénomination Description
Coût d'acquisition
Cost
Valeur d'évaluation
Market value
% des actifs nets
% of net assets
EUR 750.000 Deutschland 4% Ser 07 07/04.01.18 805.425,00 799.766,47 5,36 EUR 600.000 Exane Finance 0% Conv Vivendi 09/14.02.14 600.050,00 596.520,00 4,00 EUR 500.000 Fiat Finance & Trade Ltd SA 9% EMTN 09/30.07.12 524.300,00 538.500,00 3,61 EUR 750.000 Fortis Luxembourg Finance SA FRN Conv
02/31.12.Perpetual 358.125,00 357.083,25 2,39
EUR 500.000 Gaz Capital SA 4.56% EMTN 05/09.12.12 493.800,00 502.250,00 3,37 EUR 250.000 Infineon Tec Holding BV 5% Conv Infineon Tec AG
03/05.06.10 215.625,00 248.950,00 1,67
EUR 250.000 Peugeot SA 8.375% EMTN 09/15.07.14 249.502,00 272.300,00 1,82 EUR 500.000 Rallye SA 8.375% 09/20.01.15 518.800,00 519.937,55 3,49 EUR 500.000 Skandinaviska Enskilda Banken VAR EMTN
10/15.09.Perpetual 505.850,00 509.500,00 3,42
EUR 200.000 Société Générale de Paris VAR 09/04.09.Perpetual 200.050,00 214.500,00 1,44
Total obligations / Total bonds 6.614.274,00 6.804.959,84 45,63
Obligations liées à un indice / Index linked bonds
EUR 500.000 UBS AG Jersey Branch 0.5% Asian Index Basket Sen 06/28.02.11
510.000,00 545.500,00 3,66
Total obligations liées à un indice / Total index linked bonds 510.000,00 545.500,00 3,66
VALEURS MOBILIERES NEGOCIEES SUR UN AUTRE MARCHE REGLEMENTE / TRANSFERABLE SECURITIES DEALT IN ON ANOTHER REGULATED MARKET
Obligations / Bonds
EUR 494.000 Deutsche Bk Cap Fund Trust XI 9.5% 09/31.12.49 490.345,00 531.667,50 3,56
Total obligations / Total bonds 490.345,00 531.667,50 3,56
TOTAL PORTEFEUILLE-TITRES / TOTAL INVESTMENTS IN SECURITIES
13.063.914,61 13.440.135,20 90,10
AVOIRS BANCAIRES / CASH AT BANKS 901.814,46 6,05
AUTRES ACTIFS/(PASSIFS) NETS / OTHER NET ASSETS/(LIABILITIES)
574.882,17 3,85
TOTAL / TOTAL 14.916.831,83 100,00
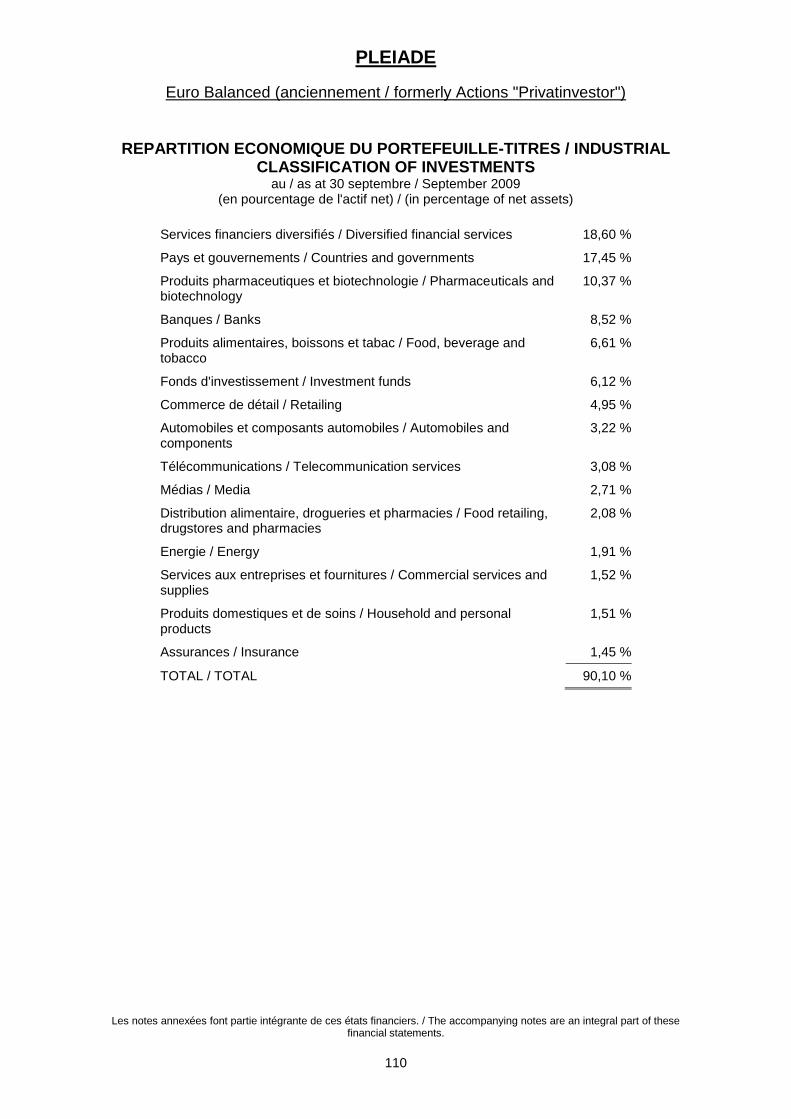
PLEIADE
Euro Balanced (anciennement / formerly Actions "Privatinvestor")
Les notes annexées font partie intégrante de ces états financiers. / The accompanying notes are an integral part of these financial statements.
110
REPARTITION ECONOMIQUE DU PORTEFEUILLE-TITRES / INDUSTRIAL CLASSIFICATION OF INVESTMENTS
au / as at 30 septembre / September 2009 (en pourcentage de l'actif net) / (in percentage of net assets)
Services financiers diversifiés / Diversified financial services 18,60 %
Pays et gouvernements / Countries and governments 17,45 %
Produits pharmaceutiques et biotechnologie / Pharmaceuticals and biotechnology
10,37 %
Banques / Banks 8,52 %
Produits alimentaires, boissons et tabac / Food, beverage and tobacco
6,61 %
Fonds d'investissement / Investment funds 6,12 %
Commerce de détail / Retailing 4,95 %
Automobiles et composants automobiles / Automobiles and components
3,22 %
Télécommunications / Telecommunication services 3,08 %
Médias / Media 2,71 %
Distribution alimentaire, drogueries et pharmacies / Food retailing, drugstores and pharmacies
2,08 %
Energie / Energy 1,91 %
Services aux entreprises et fournitures / Commercial services and supplies
1,52 %
Produits domestiques et de soins / Household and personal products
1,51 %
Assurances / Insurance 1,45 %
TOTAL / TOTAL 90,10 %
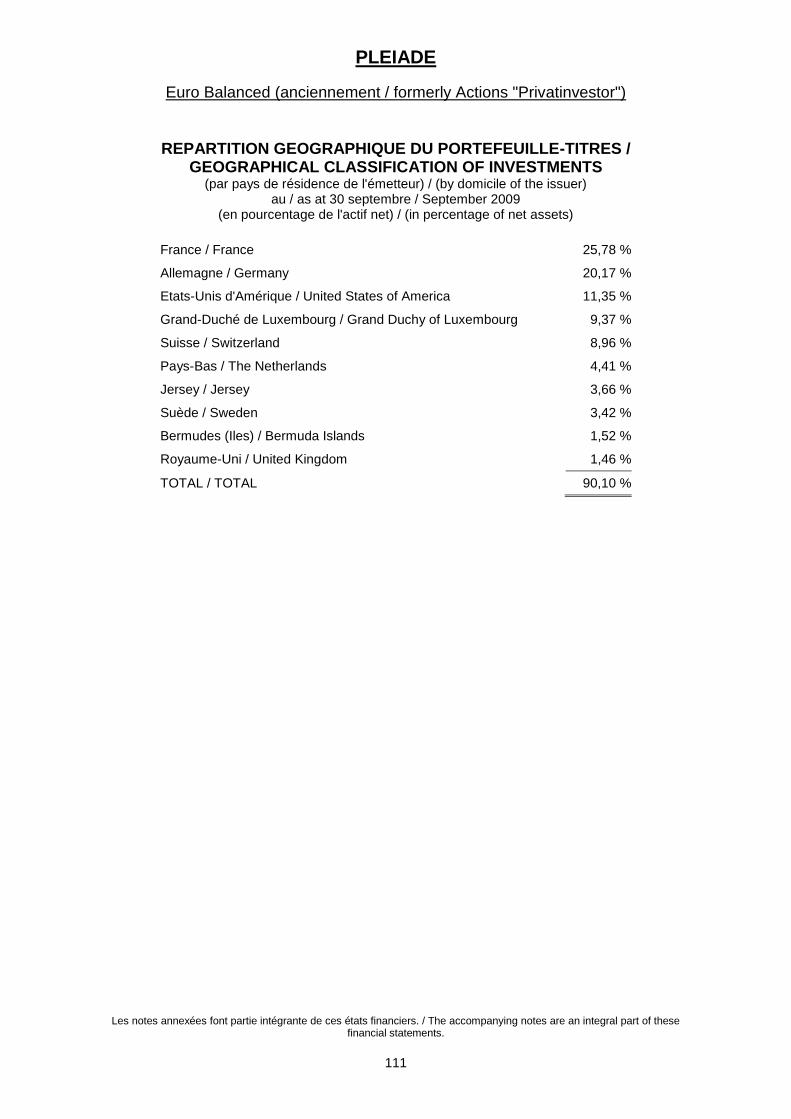
PLEIADE
Euro Balanced (anciennement / formerly Actions "Privatinvestor")
Les notes annexées font partie intégrante de ces états financiers. / The accompanying notes are an integral part of these financial statements.
111
REPARTITION GEOGRAPHIQUE DU PORTEFEUILLE-TITRES / GEOGRAPHICAL CLASSIFICATION OF INVESTMENTS
(par pays de résidence de l'émetteur) / (by domicile of the issuer) au / as at 30 septembre / September 2009
(en pourcentage de l'actif net) / (in percentage of net assets)
France / France 25,78 %
Allemagne / Germany 20,17 %
Etats-Unis d'Amérique / United States of America 11,35 %
Grand-Duché de Luxembourg / Grand Duchy of Luxembourg 9,37 %
Suisse / Switzerland 8,96 %
Pays-Bas / The Netherlands 4,41 %
Jersey / Jersey 3,66 %
Suède / Sweden 3,42 %
Bermudes (Iles) / Bermuda Islands 1,52 %
Royaume-Uni / United Kingdom 1,46 %
TOTAL / TOTAL 90,10 %
PLEIADE
NOTES AUX ETATS FINANCIERS / NOTES TO THE FINANCIAL STATEMENTS au / as at 30 septembre / September 2009
112
NOTE 1 - PRINCIPALES METHODES COMPTABLES a) Présentation des états financiers
Les états financiers de la SICAV sont établis conformément aux prescriptions légales et réglementaires en vigueur au Luxembourg relatives aux Organismes de Placement Collectif.
b) Evaluation des actifs
La valeur des espèces en caisse ou à recevoir ou en dépôts, effets et billets payables à vue et tous montants à recevoir, des dépenses payées d'avance, des dividendes et intérêts annoncés ou échus et non encore encaissés, sera constituée par la valeur nominale de ces avoirs, sauf toutefois s'il s'avère improbable que cette valeur puisse être encaissée en entier; dans ce dernier cas, la valeur sera déterminée en retranchant un certain montant jugé adéquat par PLEIADE en vue de refléter la valeur réelle de ces actifs. La valeur de tous les titres en portefeuille qui sont admis à la cote officielle d'une bourse de valeurs ou traités sur tout autre marché réglementé sera déterminée sur la base du dernier prix disponible du marché principal sur lequel ces valeurs sont traitées. Si ces prix ne sont pas représentatifs de leur juste valeur, les valeurs mobilières de même que tous autres actifs autorisés y compris les valeurs qui ne sont pas cotées à une bourse de valeurs ou traitées sur un marché réglementé, seront évaluées à leur juste valeur déterminé de bonne foi, par et sous la direction de PLEIADE.
Les actions ou parts d‟OPC sont évaluées sur base de leur dernières valeur nette d‟inventaire disponible.
c) Bénéfices nets/(pertes nettes) réalisé(e)s sur ventes de titres
Les bénéfices nets/(pertes nettes) réalisé(e)s sur ventes de titres sont calculé(e)s sur base du coût moyen des titres vendus.
d) Conversion des devises étrangères
Les actifs et passifs libellés en d'autres devises que celles d'un compartiment donné sont convertis en devise du compartiment au cours de change en vigueur à la date de clôture de l'exercice. Les transactions en devises étrangères sont converties au cours de change en vigueur le jour même de la transaction. Les plus-values et moins-values de change réalisées et non-réalisées résultant de l'évaluation sont reconnues dans la détermination du résultat des opérations.
e) Consolidation
Les états financiers consolidés de la SICAV sont établis en USD et sont égaux à la somme des postes correspondants dans les états financiers de chaque compartiment convertis en USD aux cours de change en vigueur à la date de clôture :
1 USD = 1,0376000 CHF Franc suisse 0,6840413 EUR Euro
PLEIADE
NOTES AUX ETATS FINANCIERS / NOTES TO THE FINANCIAL STATEMENTS (suite) / (continued)
au / as at 30 septembre / September 2009
113
f) Evaluation des contrats de change à terme
Les contrats de change à terme non encore échus au jour d'évaluation sont évalués sur base des taux de change à terme en vigueur à cette date. Les plus- et moins-values non réalisées en résultant sont enregistrées dans l'état du patrimoine et dans l‟état des opérations et autres variations de l‟actif net.
g) Evaluation des futures
Les contrats de futures sont enregistrés en hors-bilan et sont évalués suivant leur dernier cours connu aux bourses de valeurs ou marchés réglementés à cet effet. Les plus- ou moins-values réalisées et non-réalisées sont enregistrées dans l‟état du patrimoine et dans l‟état des opérations et autres variations de l‟actif net.
NOTE 2 - COMMISSION DE SOUSCRIPTION ET DE REMBOURSEMENT D'ACTIONS Une commission maximum de 5 % du montant de souscription, au bénéfice des Agents de Distribution sera déduite du montant de souscription, pour tout investissement dans les Compartiments Actions et Obligations. Une commission, réduite, de 0,5 % du montant de souscription, au bénéfice des Agents de Distribution, sera déduite du montant de souscription, pour tout investissement dans les Compartiments Court Terme. Une commission de 0,5 % sera prélevée lors de la conversion d'actions d'un Compartiment en actions d'un autre Compartiment, pour couvrir les frais administratifs y afférent, encourus par les Agents de Distribution. Toutefois, lors de la première conversion d'actions d'un Compartiment Court Terme en actions d'un Compartiment Actions ou d'un Compartiment Obligations, une commission unique maximum de 4,50 % sera déduite au bénéfice des Agents de Distribution. Ultérieurement, toute conversion entre quelques compartiments que ce soient, fera l'objet d'une seule commission de 0,5 %. Une commission 0,5 % sera prélevée lors du rachat d'Actions de tout compartiment, pour couvrir les frais administratifs y afférent, encourus par les Agents de Distribution. NOTE 3 - COMMISSION DE GESTION Les différents intervenants de la gestion bénéficient d‟une rémunération totale annuelle correspondant à un pourcentage de la Valeur Nette d'Inventaire de chaque compartiment :
Compartiment Rémunération Totale Annuelle
Pléiade Actions Amérique du Nord 1,75 % Pléiade Actions Europe 1,75 % Pléiade Actions Asie et Bassin du Pacifique 1,75 % Pléiade Actions Internationales "Valeur Intrinsèque" 0,00 % Pléiade Obligations Dollar 0,70 % Pléiade Obligations Européennes 0,70 % Pléiade Obligations Convertibles Internationales 1,00 % Pléiade Dollar Court Terme 0,30 % Pléiade Euro Court Terme 0,30 % Pléiade Euro Balanced (anciennement Pléiade Actions "Privatinvestor")
1,50 %
PLEIADE
NOTES AUX ETATS FINANCIERS / NOTES TO THE FINANCIAL STATEMENTS (suite) / (continued)
au / as at 30 septembre / September 2009
114
Ces rémunérations sont calculées sur base de la Valeur Nette d'Inventaire moyenne de chaque compartiment du mois en question et amorties lors de chaque Jour de Transaction, et sont comptabilisées à la fin de chaque mois. NOTE 4 - COMMISSION DE PERFORMANCE Pour le compartiment PLEIADE Actions Internationales "Valeur Intrinsèque", il est prélevé depuis le 7 mars 2003, une commission de performance par action égale à 20% de la différence positive entre la dernière Valeur Nette d‟Inventaire par action de l‟exercice fiscal concerné et la plus haute Valeur Nette d‟Inventaire par action calculée le dernier jour de transaction des exercices fiscaux précédents. Pour le compartiment PLEIADE Actions Amérique du Nord, il est prélevé depuis le 3 juillet 2006 une commission de performance par action, au bénéfice du gestionnaire, égale à 20% de la différence positive entre la dernière valeur nette d‟inventaire par action de l‟exercice fiscal concerné qui excède le taux LIBOR USD 3 mois sur la même période et la plus haute valeur nette d‟inventaire par action calculée le dernier jour de transaction des exercices fiscaux précédents. La commission de performance est payable annuellement et est provisionnée et calculée sur base du nombre moyen des actions en circulation durant l‟exercice fiscal concerné. Aucune commission de performance n‟a été prélevée pour l‟exercice clos au 30 septembre 2009. NOTE 5 - CONTRATS DE CHANGE A TERME A la date du rapport, les compartiments suivants de la SICAV sont engagés dans les contrats de change à terme suivants :
Pléiade Actions Internationales "Valeur Intrinsèque" Devise
Achats Devise Ventes Echéance Résultat non
réalisé (en CHF)
CHF 530.000,00 USD 503.084,95 08.01.2010 8.403,28 CHF 260.000,00 JPY 22.531.600,00 08.04.2010 -1.012,25 CHF 310.000,00 USD 275.849,80 08.04.2010 24.288,67 CHF 550.000,00 EUR 368.509,21 21.05.2010 -7.385,98 CHF 100.000,00 MXN 1.270.500,00 21.05.2010 5.967,51 CHF 420.000,00 USD 381.957,08 21.05.2010 24.674,28 CHF 220.000,00 EUR 146.568,95 11.06.2010 -1.611,43 CHF 100.000,00 HKD 729.100,00 11.06.2010 2.502,67 CHF 400.000,00 JPY 35.870.000,00 11.06.2010 -15.517,31 CHF 80.000,00 MXN 1.057.720,00 11.06.2010 1.888,46 CHF 130.000,00 SGD 177.232,45 11.06.2010 36,56 CHF 240.000,00 USD 226.244,34 11.06.2010 5.919,82 SGD 25.000,00 CHF 18.063,58 11.06.2010 269,85 SGD 35.000,00 CHF 25.560,51 11.06.2010 105,21 CHF 170.000,00 EUR 112.189,01 13.08.2010 570,94 CHF 100.000,00 GBP 56.293,63 13.08.2010 7.053,38 CHF 230.000,00 JPY 20.697.700,00 13.08.2010 -9.806,23 CHF 80.000,00 NOK 464.648,00 13.08.2010 -1.702,63 CHF 70.000,00 SGD 95.445,00 13.08.2010 105,59 CHF 2.000.000,00 EUR 1.328.021,25 27.08.2010 -5.045,46 CHF 180.000,00 EUR 119.244,78 03.09.2010 -11,13 CHF 130.000,00 USD 122.792,10 03.09.2010 3.169,78 CHF 680.000,00 EUR 451.018,11 08.09.2010 -787,66 CHF 490.000,00 GBP 287.002,87 08.09.2010 16.423,01 CHF 270.000,00 JPY 23.730.300,00 08.09.2010 -4.975,13 CHF 310.000,00 MXN 4.149.288,00 08.09.2010 8.271,10
PLEIADE
NOTES AUX ETATS FINANCIERS / NOTES TO THE FINANCIAL STATEMENTS (suite) / (continued)
au / as at 30 septembre / September 2009
115
Devise
Achats Devise Ventes Echéance Résultat non réalisé
(en CHF)
CHF 180.000,00 EUR 119.513,98 24.09.2010 -343,72 CHF 220.000,00 MXN 2.888.160,00 13.10.2010 11.542,28
72.993,46
Pléiade Obligations Convertibles Internationales Devise Achats Devise Ventes Echéance Résultat non
réalisé (en EUR)
EUR 1.712.328,77 USD 2.500.000,00 14.12.2009 2.121,98
2.121,98
NOTE 6 - CONTRATS DE FUTURES A la date du rapport, les compartiments suivants de la SICAV sont engagés dans les contrats futures suivants :
Pléiade Obligations Convertibles Internationales Quantité Dénomination Devise Valeur
d'évaluation (en EUR)
Résultat non réalisé
(en EUR)
Vente 50 DJ EURO STOXX 50 (Price) Index FUT 12/09 EUX
EUR -1.428.500,00 12.500,00
12.500,00
Pléiade Euro Balanced (anciennement Pléiade Actions "Privatinvestor") Quantité Dénomination Devise Valeur
d'évaluation (en EUR)
Résultat non réalisé
(en EUR)
Vente 50 DJ EURO STOXX 50 (Price) Index FUT 12/09 EUX
EUR -1.428.500,00 12.500,00
12.500,00
NOTE 7 - TAXE D'ABONNEMENT La SICAV est régie par les lois fiscales luxembourgeoises. En vertu de la législation et des règlements actuellement en vigueur, la SICAV est soumise à une taxe d'abonnement au taux annuel de 0,05 % de l‟actif net, calculée et payable par trimestre, sur base de l'actif net à la fin de chaque trimestre. Selon l‟article 129 (3) de la loi modifiée du 20 décembre 2002, les actifs nets investis en OPC déjà soumis à la taxe d‟abonnement sont exonérés de cette taxe. NOTE 8 - PRÊTS DE TITRES Au 30 septembre 2009, aucun des compartiments de la SICAV n‟a d‟opérations de prêts de titres en cours.
PLEIADE
NOTES AUX ETATS FINANCIERS / NOTES TO THE FINANCIAL STATEMENTS (suite) / (continued)
au / as at 30 septembre / September 2009
116
NOTE 9 - TOTAL EXPENSE RATIO ("TER") et PORTFOLIO TURNOVER RATE ("PTR") Le TER et le PTR présentés dans les "STATISTIQUES" de ce rapport sont calculés en respect de la Directive sur le calcul et la publication du TER et du PTR, émise le 16 mai 2008 par l‟association suisse des fonds de placement ("Swiss Funds Association SFA"). Le TER et le PTR sont calculés sur les 12 derniers mois précédant la date de ce rapport. Les frais sur transactions ne sont pas repris dans le calcul du TER. Si une commission de performance est prévue et a été calculée, le TER présenté inclut cette commission. De plus, le ratio de commission de performance est calculé en pourcentage de la moyenne des actifs nets pour les 12 derniers mois précédant la date de ce rapport. Le PTR est calculé selon la formule (Total 1 - Total 2)/M*100 avec Total 1 = Total des transactions sur valeurs mobilières = X + Y
X = achats de valeurs mobilières Y = ventes de valeurs mobilières
Total 2 = Total des émissions et des rachats = S + T S = émissions T = rachats S+T: les émissions et les rachats sont compensés par jour de calcul de VNI. M = moyenne de l'actif net total
NOTE 10 - CHANGEMENTS INTERVENUS DANS LA COMPOSITION DU PORTEFEUILLE-TITRES Les changements intervenus dans la composition du portefeuille-titres au cours de la période se référant au rapport sont disponibles gratuitement, sur simple demande :
auprès du siège social de la SICAV
auprès des différents Représentants et Agents de Distribution des pays suivants : - Suisse : CBH Compagnie Bancaire Helvétique (anciennement BANQUE SCS
ALLIANCE S.A.), 6B, Route de Chancy, CH-1213 GENÈVE - France : C.I.C. SECURITIES, 6, Avenue de Provence, F-75009 PARIS.
NOTE 11 - EVENEMENTS a) En date du 6 décembre 2008, le Conseil d‟Administration a décidé de modifier le nom de
Compartiment de Pléiade Actions "Privatinvestor" en Pléiade "Euro Balanced" et de modifier la politique d‟investissement du Compartiment afin de lire comme suit :
"Le Compartiment Euro Balanced peut investir, dans des proportions variables, ses avoirs en actions (maximum 60 % des actifs nets), obligations (maximum 60 % des actifs nets) et instruments du marché monétaire ou dépôts (maximum 60 % des actifs nets) et peut accessoirement générer une exposition à l‟immobilier, aux matières premières, à des hedge funds et des fonds de hedge funds et à des devises par des investissements en valeurs mobilières, dans des instruments financiers dérivés sur indices et dans des OPC qui investissent dans ce type d‟avoirs. Des techniques de couverture de risque autorisées seront utilisées, si nécessaire. La devise du compte du Compartiment est l‟Euro."
PLEIADE
NOTES AUX ETATS FINANCIERS / NOTES TO THE FINANCIAL STATEMENTS (suite) / (continued)
au / as at 30 septembre / September 2009
117
Le changement de la politique d‟investissement n‟entraîne pas d‟augmentation des frais pour les actionnaires. Les frais de gestion restent fixés à 1,50 % par an. Les autres frais supportés par le compartiment restent inchangés.
b) En date du 18 décembre 2008, le Conseil a décidé de procéder à des ajustements concernant la
VNI du compartiment Pléiade Actions Amérique du Nord. Les ajustements sont liés aux conséquences de la faillite de Lehman Brothers et sont les suivants :
- Dépréciation du cash Lehman Brothers à 10 % de sa valeur.
Sont concernés : USD 71.891,50 réévalués à USD 7.189,15 dans la VNI du 30/09/08 (dépréciation de USD 64.702,35).
- Dépréciation de 20 % de la valeur du TRS (total return swap) KKR par rapport à la
valorisation du gestionnaire et en tenant compte du collatéral déposé par la Sicav chez Lehman Brothers. USD 75.313 (collatéral) moins les USD 65.836 (perte non réalisée de valorisation TRS KKR) correspond à USD 9.477, moins 20 % soit USD 7.581,60 (dépréciation de USD 1.895,40).
Ces deux ajustements sont reflétés dans l‟Etat du Patrimoine respectivement sous "Autres avoirs liquides" et "Autres créances" du compartiment. Ces évaluations ont fait l'objet de revues régulières du Conseil d'Administration de la SICAV au cours de l'exercice clos au 30 septembre 2009 et jusqu'à la date de ce rapport. Le Conseil d‟Administration considère, notamment sur base d‟un avis juridique émis par une firme d‟avocat anglaise, que la date de « termination » du TRS telle que signifiée à Lehman Brothers par la SICAV était le 18 septembre 2008 et que le principe de compensation entre le collatéral et la valeur du swap à cette date s‟appliquait.
PLEIADE
NOTES AUX ETATS FINANCIERS / NOTES TO THE FINANCIAL STATEMENTS (suite) / (continued)
au / as at 30 septembre / September 2009
118
NOTE 1 - PRINCIPAL ACCOUNTING METHODS a) Presentation of the financial statements
The financial statements of the SICAV are established in accordance with the legal and regulatory requirements in force in Luxembourg concerning undertakings for collective investment.
b) Valuation of the assets
The value of cash in hand or receivable or on deposit, of bills and demand notes payable and accounts receivable, pre-paid expenses, dividends and interest declared or accrued but not yet received is the nominal value of such assets, unless it appears unlikely that the full value can be received in its entirety, in which case the value will be determined by making such deduction as PLEIADE considers appropriate to reflect the true value thereof. The value of all the securities held in the portfolio that are quoted on the official list of a stock exchange or traded on any other regulated market is determined on the basis of the last price available on the main market on which these securities are traded. If these prices are not representative of the fair market value, the securities as well as all other authorised including those not quoted on the stock exchange or regulated market, are established on the basis of the faire market value, as determined prudently and in good faith by PLEIADE. The Shares and Units of the Undertakings for Collective Investments will be valued on the basis of their last available net asset value.
c) Net realised profits (losses) on sales of securities
The net realised profits (losses) on sales of securities are determined on the basis of the average cost of the securities sold.
d) Conversion of foreign currencies
Assets and liabilities denominated in currencies other than the sub-fund‟s reporting currency are converted at the exchange rates effective on the closing date. Transactions in foreign currencies are converted at the exchange rate prevailing on the date of the transaction. Realised and unrealised exchange gains and losses arising on the valuation are recognised in income on operations.
e) Consolidation
The consolidated financial statements of the SICAV are drawn up in USD and are the sum of the corresponding entries in the financial statements of each sub-fund, converted into USD at the exchange rate prevailing on the closing date:
1 USD = 1,0376000 CHF Swiss Franc 0,6840413 EUR Euro
PLEIADE
NOTES AUX ETATS FINANCIERS / NOTES TO THE FINANCIAL STATEMENTS (suite) / (continued)
au / as at 30 septembre / September 2009
119
f) Valuation of forward foreign exchange
Forward foreign exchange contracts that have not matured on the valuation date are valued on the basis of the forward rates applicable on that date. Resulting unrealised gains and losses are recorded in the statement of net assets and in the statement of operations and other changes in net assets.
g) Valuation of Futures contracts
Futures contracts are posted off-balance sheet and valued at their last known price on the stock exchanges or regulated markets for that purpose. Realised and unrealised gain or loss are recorded in the statement of net assets and in the statement of operations and other changes in net assets.
NOTE 2 - COMMISSION ON SHARES ISSUED, CONVERTED AND REDEEMED A maximum fee of 5% of the subscribed amount, payable to the Distribution Agents is deducted from the subscribed amount, for all investment in the Equity Sub-Funds and the Bonds Sub-Funds. A reduced fee of 0.50% of the subscribed amount, payable to the Distribution Agents, is deducted from the subscribed amount, for all investment in the Short-Term Sub-Funds. In case of conversion of shares between the Sub-Funds, a conversion fee of 0.5% is payable to cover the relevant administration fees incurred by the Distribution Agents. For a first conversion of shares from the Short-Term Sub-Funds to shares in an Equity Sub-Fund or Bonds Sub-Fund, a unique maximum fee of 4.50% is deducted and payable to the Distribution Agents. After, only a single fee of 0.50% will be deducted for all conversions between the Sub-Funds. A redemption fee of 0.5% is payable to cover the relevant administration fees incurred by the Distribution Agents. NOTE 3 - MANAGEMENT FEE The different managers receive a total annual management fee corresponding to a percentage of the Net Asset Value of each Sub-Fund:
Sub-Fund Total annual management fee
Pléiade Actions Amérique du Nord 1.75 % Pléiade Actions Europe 1.75 % Pléiade Actions Asie et Bassin du Pacifique 1.75 % Pléiade Actions Internationales "Valeur Intrinsèque" 0.00 % Pléiade Obligations Dollar 0.70 % Pléiade Obligations Européennes 0.70 % Pléiade Obligations Convertibles Internationales 1.00 % Pléiade Dollar Court Terme 0.30 % Pléiade Euro Court Terme 0.30 % Pléiade Euro Balanced (formerly Pléiade Actions "Privatinvestor")
1.50 %
These fees are calculated on the basis of the average Net Asset Value of each Sub-Fund for the corresponding month and amortised on each trading day and payable at each end of month.
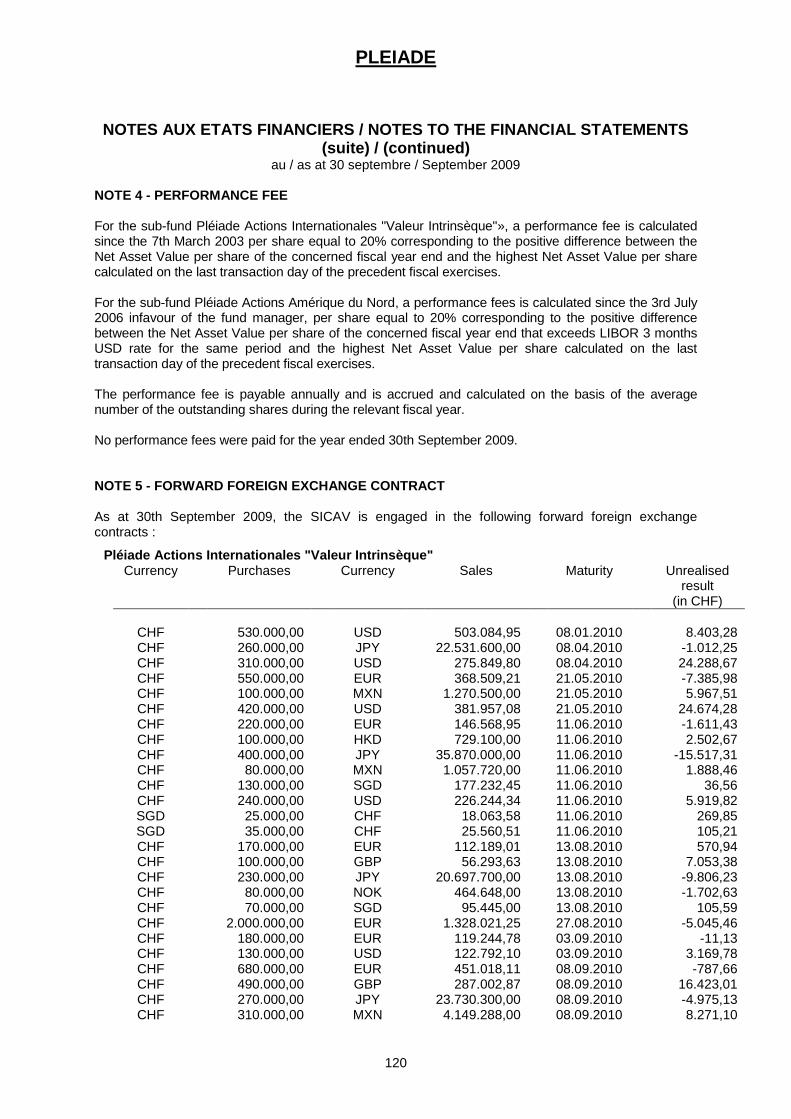
PLEIADE
NOTES AUX ETATS FINANCIERS / NOTES TO THE FINANCIAL STATEMENTS (suite) / (continued)
au / as at 30 septembre / September 2009
120
NOTE 4 - PERFORMANCE FEE For the sub-fund Pléiade Actions Internationales "Valeur Intrinsèque"», a performance fee is calculated since the 7th March 2003 per share equal to 20% corresponding to the positive difference between the Net Asset Value per share of the concerned fiscal year end and the highest Net Asset Value per share calculated on the last transaction day of the precedent fiscal exercises. For the sub-fund Pléiade Actions Amérique du Nord, a performance fees is calculated since the 3rd July 2006 infavour of the fund manager, per share equal to 20% corresponding to the positive difference between the Net Asset Value per share of the concerned fiscal year end that exceeds LIBOR 3 months USD rate for the same period and the highest Net Asset Value per share calculated on the last transaction day of the precedent fiscal exercises. The performance fee is payable annually and is accrued and calculated on the basis of the average number of the outstanding shares during the relevant fiscal year. No performance fees were paid for the year ended 30th September 2009. NOTE 5 - FORWARD FOREIGN EXCHANGE CONTRACT As at 30th September 2009, the SICAV is engaged in the following forward foreign exchange contracts :
Pléiade Actions Internationales "Valeur Intrinsèque" Currency Purchases Currency Sales Maturity Unrealised
result (in CHF)
CHF 530.000,00 USD 503.084,95 08.01.2010 8.403,28 CHF 260.000,00 JPY 22.531.600,00 08.04.2010 -1.012,25 CHF 310.000,00 USD 275.849,80 08.04.2010 24.288,67 CHF 550.000,00 EUR 368.509,21 21.05.2010 -7.385,98 CHF 100.000,00 MXN 1.270.500,00 21.05.2010 5.967,51 CHF 420.000,00 USD 381.957,08 21.05.2010 24.674,28 CHF 220.000,00 EUR 146.568,95 11.06.2010 -1.611,43 CHF 100.000,00 HKD 729.100,00 11.06.2010 2.502,67 CHF 400.000,00 JPY 35.870.000,00 11.06.2010 -15.517,31 CHF 80.000,00 MXN 1.057.720,00 11.06.2010 1.888,46 CHF 130.000,00 SGD 177.232,45 11.06.2010 36,56 CHF 240.000,00 USD 226.244,34 11.06.2010 5.919,82 SGD 25.000,00 CHF 18.063,58 11.06.2010 269,85 SGD 35.000,00 CHF 25.560,51 11.06.2010 105,21 CHF 170.000,00 EUR 112.189,01 13.08.2010 570,94 CHF 100.000,00 GBP 56.293,63 13.08.2010 7.053,38 CHF 230.000,00 JPY 20.697.700,00 13.08.2010 -9.806,23 CHF 80.000,00 NOK 464.648,00 13.08.2010 -1.702,63 CHF 70.000,00 SGD 95.445,00 13.08.2010 105,59 CHF 2.000.000,00 EUR 1.328.021,25 27.08.2010 -5.045,46 CHF 180.000,00 EUR 119.244,78 03.09.2010 -11,13 CHF 130.000,00 USD 122.792,10 03.09.2010 3.169,78 CHF 680.000,00 EUR 451.018,11 08.09.2010 -787,66 CHF 490.000,00 GBP 287.002,87 08.09.2010 16.423,01 CHF 270.000,00 JPY 23.730.300,00 08.09.2010 -4.975,13 CHF 310.000,00 MXN 4.149.288,00 08.09.2010 8.271,10
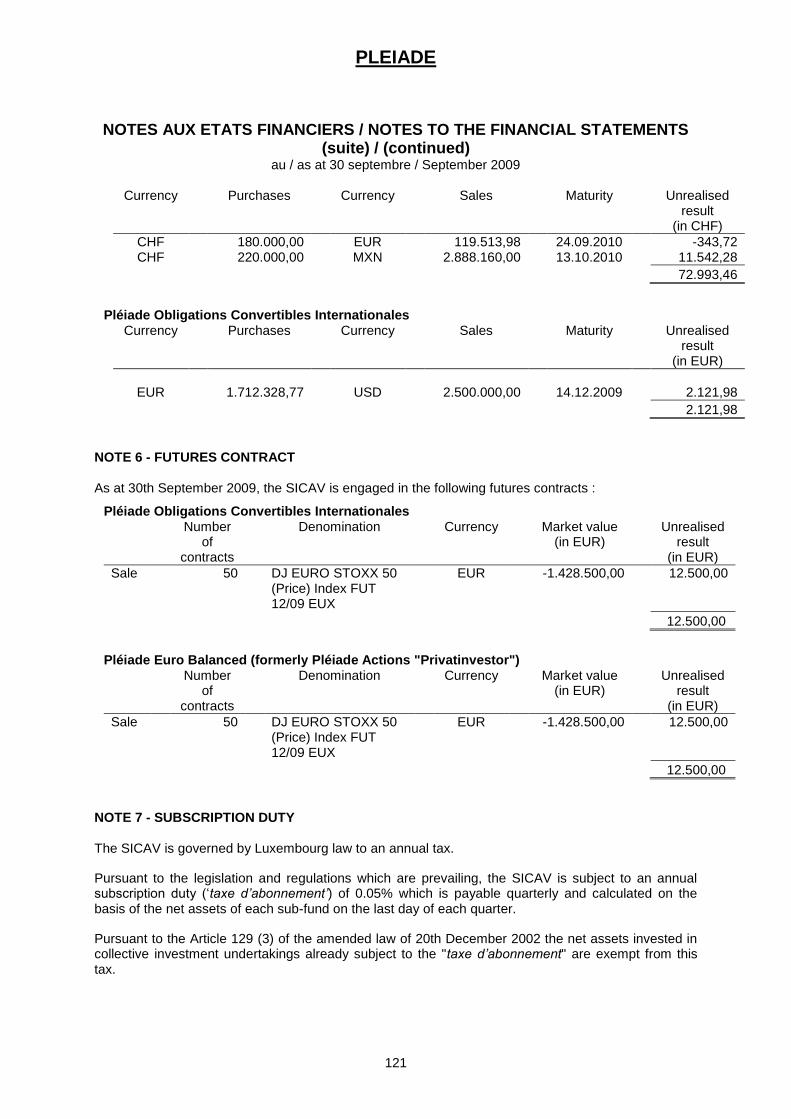
PLEIADE
NOTES AUX ETATS FINANCIERS / NOTES TO THE FINANCIAL STATEMENTS (suite) / (continued)
au / as at 30 septembre / September 2009
121
Currency Purchases Currency Sales Maturity Unrealised result
(in CHF)
CHF 180.000,00 EUR 119.513,98 24.09.2010 -343,72 CHF 220.000,00 MXN 2.888.160,00 13.10.2010 11.542,28
72.993,46
Pléiade Obligations Convertibles Internationales Currency Purchases Currency Sales Maturity Unrealised
result (in EUR)
EUR 1.712.328,77 USD 2.500.000,00 14.12.2009 2.121,98
2.121,98
NOTE 6 - FUTURES CONTRACT As at 30th September 2009, the SICAV is engaged in the following futures contracts :
Pléiade Obligations Convertibles Internationales Number
of contracts
Denomination Currency Market value (in EUR)
Unrealised result
(in EUR)
Sale 50 DJ EURO STOXX 50 (Price) Index FUT 12/09 EUX
EUR -1.428.500,00 12.500,00
12.500,00
Pléiade Euro Balanced (formerly Pléiade Actions "Privatinvestor") Number
of contracts
Denomination Currency Market value (in EUR)
Unrealised result
(in EUR)
Sale 50 DJ EURO STOXX 50 (Price) Index FUT 12/09 EUX
EUR -1.428.500,00 12.500,00
12.500,00
NOTE 7 - SUBSCRIPTION DUTY The SICAV is governed by Luxembourg law to an annual tax. Pursuant to the legislation and regulations which are prevailing, the SICAV is subject to an annual subscription duty („taxe d’abonnement’) of 0.05% which is payable quarterly and calculated on the basis of the net assets of each sub-fund on the last day of each quarter. Pursuant to the Article 129 (3) of the amended law of 20th December 2002 the net assets invested in collective investment undertakings already subject to the "taxe d’abonnement" are exempt from this tax.
PLEIADE
NOTES AUX ETATS FINANCIERS / NOTES TO THE FINANCIAL STATEMENTS (suite) / (continued)
au / as at 30 septembre / September 2009
122
NOTE 8 - SECURITIES LENDING At 30th September 2009 the sub-funds of the SICAV were not engaged in securities lending operations. NOTE 9 - TOTAL EXPENSE RATIO ("TER") AND PORTFOLIO TURNOVER RATE ("PTR") The TER and the PTR disclosed under "STATISTICAL INFORMATION" of this report are calculated in accordance with the "Guidelines on the calculation and disclosure of the TER and PTR" issued by the Swiss Funds Association "SFA" on 16th May 2008. The TER and the PTR are calculated for the last 12 months preceding the date of this report. Transaction fees are not taken into account in the calculation of the TER. If a performance fee is foreseen and was calculated, the TER displayed includes that commission. Moreover, the performance fee ratio is calculated as a percentage of the average of the net assets for the 12 months preceding the date of the report. The PTR has been calculated according to the following formula (Total 1 - Total 2)/M * 100 with Total 1 = Total securities transactions = X + Y
X = Securities purchases Y = Securities sales
Total 2 = Total subscriptions and redemptions = S + T S = subscriptions T = redemptions S + T: subscriptions and redemptions are netted per NAV calculation day. M = average net assets
NOTE 10 - CHANGES OF THE INVESTMENT PORTFOLIO The statement of changes in the investments portfolio for the period in reference to this report are available free of charge
from the registered office of the SICAV
from the representative and distribution agents in the following countries : o for Switzerland: CBH Compagnie Bancaire Helvétique (anciennement Banque SCS
Alliance S.A.), 6B, Route de Chancy, CH-1213 Petit-Lancy -Geneva; o for France: C.I.C. Securities, 6, Avenue de Provence, FR-75009 Paris;
NOTE 11 - EVENTS a) On 6 December 2008, the Board of Directors decided to change the name of the Pléiade Actions "Privatinvestor" to Pléiade "Euro Balanced" and to change its investment policy as follows: The Euro Balanced sub-fund may invest variable proportions of its assets in shares (maximum 60% of net assets), bonds (maximum 60% of net assets) and money market instruments and deposits (maximum 60% of net assets) and may invest in real estate, raw materials, hedge funds, funds of hedge funds, and currencies by investing in transferable securities in derivative financial instruments
PLEIADE
NOTES AUX ETATS FINANCIERS / NOTES TO THE FINANCIAL STATEMENTS (suite) / (continued)
au / as at 30 septembre / September 2009
123
on index and in UCIs that invest in these type of assets. Authorised risk hedging techniques will be used, if necessary. The currency of the sub-fund account is the euro. There will be no increase in fees as a result of this change in investment policy. Management fees will remain fixed at 1.50% per year. The other fees for the sub-fund remain unchanged. b) On 18th December 2008, the Board decided to adjust the NAV of the Pleiade Actions Amérique du Nord sub-fund. These adjustments, linked to the Lehman Brothers bankruptcy are the followings: - Depreciation of the Lehman Brothers cash to 10% of its initial value. Is affected:
USD 71,891.50 evaluated at USD 7,189.15 regarding the NAV of September 30th, 2008 (depreciation of USD 64.702,35)
- Depreciation of 20% of the TRS KKR’s value, as compared to the Manager’s valuation and
taking into account the collateral deposited by the Sicav with Lehman Brothers. USD 75.313 (collateral) minus USD 65.836 (non-realised loss TRS KKR) corresponds to USD 9.477; minus 20% equals USD 7.581,60 (depreciation of USD 1.895,40).
These two adjustments are reflected in the "Statement of net assets" under "Other liquid assets" and "Other receivables"of the sub-fund. These above valuations were reviewed by the Board of Directors of the SICAV on a regular basis during the year ended 30th September 2009 and until the date of this report. The Board of Directors considers, in particular on the basis of legal opinion given by an English lawyer firm, that the date of “termination” of the TRS as notified to Lehman Brothers by the SICAV was on 18th September 2008 and that the principle of compensation between the collateral one and the value of the swap on this date applied.