Embed Size (px)
Citation preview
UNIVERSITE PARIS EST
FACULTE DES SCIENCES ET TECHNOLOGIE
Pour obtenir le grade de docteur de l‘Université Paris
Spécialité : Sciences de l‘Univers et de l‘Environnement
Effet du ver de terre Aporrectodea caliginosaleur développement et leur résistance aux pathogènes
Direction de thèse et encadrement: Co-encadrement :
Université Paris Est
Soutenue le 03 décembre 2012, devant le jury composé de :
Michael Bonkowski Pr., Université de CologneDenis Faure DR, Fabienne Cartieaux, CR, IRDStéphanie Robert CR, Umea Plant Research CenterEvelyne Garnier-Zarli Pr., Université ParisManuel Blouin MC,
UNIVERSITE PARIS EST-CRETEIL VAL DE MARNE
FACULTE DES SCIENCES ET TECHNOLOGIE
THESE
Pour obtenir le grade de docteur de l‘Université Paris-Est
Spécialité : Sciences de l‘Univers et de l‘Environnement
Présentée par :
Ruben PUGA FREITAS
Aporrectodea caliginosa sur la croissance des plantes,
leur développement et leur résistance aux pathogènes
Direction de thèse et encadrement: Evelyne Garnier-Zarli, Professeur.encadrement : Manuel Blouin, Maître de conférences
sité Paris Est-Créteil, Equipe IBIOS-BIOEMCO, UMR 7618
le 03 décembre 2012, devant le jury composé de :
Pr., Université de Cologne DR, CNRS CR, IRD CR, Umea Plant Research Center Pr., Université Paris-Est Créteil Directrice de thèseMC, Université Paris-Est Créteil Co-directeur de thèse
CRETEIL VAL DE MARNE
FACULTE DES SCIENCES ET TECHNOLOGIE
Est
Spécialité : Sciences de l‘Univers et de l‘Environnement
sur la croissance des plantes, leur développement et leur résistance aux pathogènes
, Professeur. Manuel Blouin, Maître de conférences
BIOEMCO, UMR 7618
le 03 décembre 2012, devant le jury composé de :
Rapporteur Rapporteur
Examinateur Examinateur
Directrice de thèse directeur de thèse
tel-0
0804
633,
ver
sion
1 -
26 M
ar 2
013
Effet du ver de terre Aporrectodea caliginosa sur la croissance des plantes, leur développement et leur résistance aux pathogènes
tel-0
0804
633,
ver
sion
1 -
26 M
ar 2
013
Remerciements
Ce travail achevé, je tiens à remercier tous ceux qui d’une façon ou d’une autre ont contribué
à sa réalisation :
Pour m’avoir guidé et encadré dans mon travail de recherche, je tiens à remercier
tout particulièrement Evelyne Garnier-Zarli et Manuel Blouin. Je les remercie de leur
confiance, leur patience, leurs conseils et le partage de leurs connaissances, indispensables à
ma maturation scientifique.
Je remercie Luc Abbadie pour m’avoir accueilli dans l’UMR 7618, Biogéochimie des
milieux continentaux. Je suis particulièrement reconnaissant auprès de Philippe Mora pour
son accueil dans l’équipe IBIOS. Sans cela, je n’aurai pu mener à bien mon travail de thèse.
Merci à Marie-Claire Gazeau et Denis Duhamel, directeurs de l’école doctorale SIE,
pour avoir suivi avec attention le déroulement de ma thèse et à Brigitte David pour sa
disponibilité, sa bonne humeur, sa patience et pour avoir toujours su répondre à mes
nombreuses questions.
Mes remerciements vont également aux membres de mon jury. Merci à Denis Faure et
Michael Bonkowski pour avoir accepté la lourde tâche d’être mes rapporteurs. Merci à
Fabienne Cartieaux et Stéphanie Robert qui ont accepté le rôle d’examinateurs. Qu’ils soient
assurés de ma profonde reconnaissance.
L’aboutissement de ce travail ayant impliqué plusieurs collaborations, je souhaiterais
également exprimer toute ma gratitude à Sébastien Barot pour toute l’aide et conseils qu’il
m’a fourni pendant cette thèse mais aussi à Lamia Belkacem, Jean Roger-Estrade et Michel
Bertrand sans qui je n’aurais pas eu l’opportunité de travailler sur la maladie du piétin
échaudage. Je tiens également à remercier Jean-Pierre Renou et Ludivine Taconnat, du
laboratoire de l’URGV, pour m’avoir accueilli si chaleureusement afin de m’initier aux
analyses transcriptomiques et pour leur aide dans l’analyse des résultats. Je tiens également
à remercier l’équipe du laboratoire PartnerChip, en particulier Sylvain Baulande, pour la
réalisation de l’analyse transcriptomique du blé et pour son aide dans l’analyse des résultats.
tel-0
0804
633,
ver
sion
1 -
26 M
ar 2
013
Un grand merci aux personnes d’IBIOS, pour leur aide, conseils et pour m’avoir
permis de travailler dans les meilleures conditions qu’il soit: à Yasmine Zuily-Fodil et Anne
Repellin pour m’avoir permis d’avoir accès à leur plateforme de sciences du végétal ainsi que
pour leurs précieux conseils, à Daniel Laffray pour nos longues discussions, sa passion pour
la science et pour m’avoir encadré pendant mon monitorat, à Chantal Passaquet pour son
optimisme et sa précieuse aide en biologie moléculaire, à Matthieu Bagard pour son soutien,
ses précieux conseils et sa disponibilité, à Luis Leitao pour son aide et rigueur scientifique, à
Samir Abbad pour ces précieux conseils, à Fryni Grekis pour sa bonne humeur au quotidien
et pour m’avoir orienté et aidé dans tous les processus administratifs que requièrent une
thèse. Je tiens également à remercier toutes les autres personnes d’IBIOS qui se
reconnaîtront dans ce travail.
Je remercie chaleureusement mes collègues doctorants avec qui j’ai partagé ces
années de thèse et qui m’ont montré que l’entraide et le soutien venait bien souvent à bout des
difficultés. Pour tout ce qu’ils m’ont apporté je tiens donc à remercier : Marien, pour avoir
toujours été d’un grand soutien moral, sa disponibilité, sa rigueur scientifique et de m’avoir
permis de décompresser et relativiser quand cela était nécessaire ; Biet, Rafiq, Ahmed,
Judicaëlle, Georges, Ulrike et Deborah pour leur aide et leur bonne humeur au quotidien;
Elodie, Charlène et Gaël pour nos nombreuses discussions que ce soit en colloque ou autour
d’un café à l’UPEC où à l’IRD, merci à Gaël pour ces nombreux conseils pour l’élevage de
vers de terre, son aide pour les analyses statistiques et pour sa passion pour la science.
tel-0
0804
633,
ver
sion
1 -
26 M
ar 2
013
Table des illustrations
Figures Synthèse bibliographique
Figure 1 : Schéma des composantes externes (galeries, agrégats, turricules) et internes (en
contact avec le corps du vers de terre) de la drilosphère et de leur interaction avec d’autres
domaines fonctionnels du sol ..................................................................................................... 8
Figure 2 : Représentation de l’interaction de la drilosphère avec les autres sphères de
régulation présentes dans le sol .................................................................................................. 9
Figure 3 : Schématisation de la relation tripartite entre les vers de terre, les plantes et les
microorganismes du sol. ........................................................................................................... 11
Figure 4 : Schéma de la multiplicité des interactions et rétroactions entre les cinq
composantes influençant la formation et la stabilisation des agrégats dans les sols ................ 14
Figure 5 : Mécanismes putatifs d’interaction entre la plante et les micro-organismes du sol 17
Figure 6 : Réseau des cascades signalétiques impliquées dans l'augmentation de la croissance
végétale par les rhizobactéries. Les lignes épaisses roses indique les secrétions ou composés
bioactifs émis par les rhizobactéries ......................................................................................... 20
Figure 7 : Voie de biosynthèse de l’auxine par les plantes et les bactéries............................. 21
Figure 8 : Voie de signalisation de la résistance systémique acquise (SAR) et induite (ISR) et
de leur interaction ..................................................................................................................... 24
Résultats et discussions
Chapitre 1 :
Figure 1 : Effect of earthworm casts on plant growth in in vitro experiments ....................... 36
Figure 2 : Effects of Apporectodea caliginosa on the growth of Arabidopsis thaliana cv.
Columbia and aux1-7;axr4-2 mutant ....................................................................................... 38
tel-0
0804
633,
ver
sion
1 -
26 M
ar 2
013
Table des illustrations
Figure 3 : Validation of the results obtained in transcriptomic analysis by real-time
polymerase chain reaction (qPCR) ........................................................................................... 39
Figure 4 : Functions of the 59 Arabidopsis thaliana genes differentially expressed in the
presence of earthworms ............................................................................................................ 42
Figure 5 : Comparison between genes modulated in the presence of earthworms with other
transcriptomic studies ............................................................................................................... 43
Figure 6 : Model explaining contrasting effects of the earthworm Aporrectodea caliginosa on
Arabidopsis thaliana ................................................................................................................ 44
Chapitre 2 :
Figure 1 : Average IAA concentration at 24, 48 and 72 h by cultivable soil bacteria ............ 58
Figure 2 : Relationship between IAA concentration and plant above-ground biomass .......... 60
Chapitre 3 :
Figure 1 : Ordination of the different growth parameters of A. thaliana according to the
inoculation dose of Micrococcus luteus in absence or presence of the earthworm A. caliginosa
in the plane defined by the axis 1 and 2 of the PCA ................................................................ 71
Figure 2 : Relationship between the inoculation dose of Micrococcus luteus on Arabidopsis
thaliana in absence or presence of earthworm ......................................................................... 73
Figure 3 : Effect of Aporrectodea caliginosa presence on the rosette diameter of Arabidopsis
thaliana, irrespectively of the dose of Micrococcus luteus inoculated .................................... 74
Figure 4 : Effect of the dose of Micrococcus luteus inoculated on Arabidopsis thaliana floral
stem height ............................................................................................................................... 74
Figure 5 : Relationship between the inoculation dose of Micrococcus luteus on Arabidopsis
thaliana leaf area in absence or presence of Aporrectodea caliginosa .................................... 75
tel-0
0804
633,
ver
sion
1 -
26 M
ar 2
013
Table des illustrations
Figure 6 : Effect of Aporrectodea caliginosa on the root morphology of Arabidopsis thaliana
in absence or presence of earthworms, for different doses of Micrococcus luteus .................. 78
Figure 7 : Relationship between the inoculation dose of Micrococcus luteus on IAA
production by cultivable soil micro-organisms in absence or presence of Aporrectodea
caliginosa and the effect of Aporrectodea caliginosa on IAA production by cultivable soil
micro-organisms ....................................................................................................................... 77
Chapitre 4 :
Figure 1 : Effect of Aporrectodea caliginosa and Gaeumannomyces graminis var. tritici on
the height and biomass of Triticum aestivum during the experiment (63 days)....................... 92
Figure 2 : Effect of Aporrectodea caliginosa on the severity of the symptoms caused by
Gaeumannomyces graminis var. tritici on Triticum aestivum ................................................. 92
Figure 3 : Effect of Aporrectodea caliginosa and Gaeumannomyces graminis var. tritici on
the above-ground and below-ground morphology of Triticum aestivum ................................. 93
Figure 4 : Effect of Aporrectodea caliginosa and Gaeumannomyces graminis var. tritici on
soil nitrate content and ammonium : nitrate ratio .................................................................... 94
Figure 5 : Functions of the Triticum aestivum genes differentially expressed in the presence
of Gaeumannomyces graminis var tritici ................................................................................. 97
Figure 6 : Pathway involved in the recognition of Gaeumannomyces graminis var. tritici by
Triticum aestivum ..................................................................................................................... 98
Discussion générale
Figure 9 : Synthèse des résultats de l’effet du vers de terre A. caliginosa sur la croissance et
physiologie des plantes ............................................................................................................. 31
Figure 10 : Synthèse des résultats de l’effet du vers de terre A. caliginosa sur la production
d’auxine par les bactéries cultivables du sol ............................................................................ 53
tel-0
0804
633,
ver
sion
1 -
26 M
ar 2
013
Table des illustrations
Figure 11 : Synthèse des résultats de l’effet du ver de terre A. caliginosa et de la bactérie M.
luteus sur la croissance et le développement d’A. thaliana ...................................................... 64
Figure 12 : Synthèse des résultats de l’effet du vers de terre A. caliginosa sur l’incidence de
la maladie du piétin échaudage chez le blé (Triticum aestivum) .............................................. 84
Figure 13 : Modèle représentant les modes d’action des vers de terre sur les interactions entre
la plante et les organismes de la rhizosphère ......................................................................... 105
Figure 14 : Voie de signalisation impliquée dans la reconnaissance du champignon
Gaeumannomyces graminis var tritici (Ggt) par Triticum aestivum ...................................... 115
Figure 15 : Voie de signalisations via l’acide jasmonique modulée par la présence du
champignon Gaeumannomyces graminis var tritici (Ggt) chez Triticum aestivum ............... 118
Figure 16 : Voie de signalisations des gibbérellines modulée par la présence du champignon
Gaeumannomyces graminis var tritici (Ggt) chez Triticum aestivum .................................... 119
Figure 17 : Voie de signalisations de l’auxine modulée par la présence du champignon
Gaeumannomyces graminis var tritici (Ggt) chez Triticum aestivum .................................... 119
Figure 18 : Voie de signalisations de l’acide abscissique modulée par la présence du
champignon Gaeumannomyces graminis var tritici (Ggt) chez Triticum aestivum ............... 120
tel-0
0804
633,
ver
sion
1 -
26 M
ar 2
013
Liste des tableaux
Tableaux
Résultats et discussions
Chapitre 1:
Tableau 1 : Impact of the factor “earthworm” and “genotype” on biomass and morphological
parameters of Arabidopsis thaliana, estimated in a two-ways ANOVA .................................. 39
Tableau 2 : Table 2. List of the genes of Arabidopsis thaliana differentially expressed in the
presence/absence of the earthworm Aporrectodea caliginosa in two replicated experiments . 40
Chapitre 2 :
Tableau 1 : Impact of the factors “plant”, “earthworm” and their interaction on IAA
production by cultivable microorganisms ................................................................................ 58
Chapitre 4 :
Tableau 1 : Effect of Aporrectodea caliginosa and Gaeumannomyces graminis var. tritici on
soil chemical properties ............................................................................................................ 95
Tableau 2 : Comparison of the number of differentially expressed genes between the
treatments ................................................................................................................................. 96
tel-0
0804
633,
ver
sion
1 -
26 M
ar 2
013
Table des matières
Tables des matières
Synthèse bibliographique ..................................................................................... 1
1. Contexte socio-économique ........................................................................................................ 2
2. La qualité des sols ........................................................................................................................ 3
2.1. Le rôle des invertébrés dans la qualité du sol .............................................................. 5
2.2. Les vers de terre au fil des âges ................................................................................... 5
2.3 Taxinomie des vers de terre .......................................................................................... 6
2.4. Ecologie des vers de terre ............................................................................................ 6
2.5. La drilosphère .............................................................................................................. 9
2.6. Impact des vers de terre sur les bactéries du sol .......................................................... 9
3. Effets des vers de terre sur les plantes .................................................................................... 10
3.1 Effet des vers de terre sur la croissance des plantes ................................................... 10
3.2. Mécanismes à l’origine de l’effet des vers de terre sur la croissance des plantes ..... 11
4. Effet des microorganismes sur les plantes .............................................................................. 19
4.1. Production de molécules phytostimulantes ................................................................ 19
4.2. Optimisation du prélèvement des nutriments par la plante ........................................ 23
4.3. Effet sur les mécanismes de défense de la plante ...................................................... 23
5. Problématique ............................................................................................................................. 26
Résultats et discussions ...................................................................................... 28
Chapitre 1 : Etude de la réponse morphologique et physiologique d’Arabidopsis thaliana à
la présence du ver de terre Aporrectodea caliginosa ................................................................. 29
Chapitre 2 : Impact du vers de terre Aporrectodea caliginosa et de la plante Arabidopsis
thaliana sur la production de l’hormone végétale acide indole acétique par les bactéries
cultivables ........................................................................................................................................ 51
tel-0
0804
633,
ver
sion
1 -
26 M
ar 2
013
Table des matières
Chapitre 3 : Impact du vers de terre Aporrectodea caliginosa et de la bactérie productrice
d’acide indole acétique Micrococcus luteus sur la croissance et le développement
d’Arabidopsis thaliana ................................................................................................................... 62
Chapitre 4 : Impact du vers de terre Aporrectodea caliginosa sur la pathogénicité du piétin
échaudage du blé ............................................................................................................................. 82
Discussion générale .......................................................................................... 102
1. L’interaction des plantes avec les organismes du sol : un réseau signalétique complexe
......................................................................................................................................................... 103
1.1 Les molécules signal dans la communication entre bactéries de la rhizosphère ...... 103
1.2 Les molécules signal dans la communication entre bactéries et plantes................... 105
1.3 L’impact des vers de terre sur ces échanges de signaux ........................................... 107
2. Les molécules signal dans le développement des plantes ................................................... 108
2.1 L’importance des hormones végétales dans l’effet des vers de terre ........................ 108
2.2 La balance hormonale : un mécanisme fin de régulation de la croissance des plantes
......................................................................................................................................... 109
2.3. La balance hormonale : une petite perturbation pour de grandes conséquences ..... 111
3. Impact des vers de terre sur les mécanismes de résistance des plantes : implication des
molécules signal ............................................................................................................................ 113
3.1. Les mécanismes de défense basale chez les plantes ................................................ 113
3.2. Les molécules signal dans la reconnaissance de Gaeumannomyces graminis ........ 114
3.3. La balance hormonale dans les mécanismes de résistance des plantes.................... 117
3.4. L’induction de mécanismes de défense systémique par les vers de terre ................ 121
Perspectives ....................................................................................................... 124
1. Etude des modifications de la composition des communautés microbiennes du sol. ..... 125
2. Etude des voies métaboliques impliquées dans la réponse des plantes aux organismes du
sol. ................................................................................................................................................... 128
tel-0
0804
633,
ver
sion
1 -
26 M
ar 2
013
Table des matières
3. Dosage des molécules signal dans les sols ............................................................................ 129
4. Etude du lien coévolutif entre les plantes, les vers de terre et les microorganismes de la
rhizosphère..................................................................................................................................... 130
Références ......................................................................................................... 132
Annexes ............................................................................................................. 158
Annexe 1 : Tableau supplémentaire 1 de la publication du Chapitre 4 : ............................... 159
Annexe 2 : Article publié dans Functional Plant Biology :..................................................... 174
tel-0
0804
633,
ver
sion
1 -
26 M
ar 2
013
Synthèse Bibliographique
1
Synthèse bibliographique
tel-0
0804
633,
ver
sion
1 -
26 M
ar 2
013
Synthèse Bibliographique
2
1. Contexte socio-économique
Un des défis des prochaines décennies va être de nourrir une population mondiale
estimée à 9.2 milliards d’individus d’ici 2050 (FAOSTAT, http://faostat.fao.org/). Ce défi va
nécessiter de doubler la production de nourriture dans les pays en voie de développement et
de l’augmenter de 70% à l’échelle mondiale.
Pour atteindre cet objectif il n’y a pas d’autre solution que celle d’une intensification
de l’agriculture, hormis la stabilisation voire la réduction de la population humaine. La
politique actuelle d’intensification du système agricole dans les pays en développement,
appelé révolution verte, fût initié au Mexique par la collaboration du gouvernement mexicain
et de la fondation Rockefeller après la seconde guerre mondiale. C’est dans les années 1960
que la révolution verte a atteint une dimension internationale en étant d’abord appliquée en
Inde, puis très vite étendue aux autres pays émergeants de l’Asie mais aussi au Brésil
(Perkins, 1997). Cette intensification repose sur une forte utilisation d’intrants (pesticides et
fertilisants minéraux), le développement de l’irrigation ainsi que sur le développement de
variétés de plantes à hauts rendements, notamment pour des plantes céréalières tel que le blé,
le riz ou encore le maïs.
La révolution verte a ainsi permis de nourrir une population mondiale ayant doublé au
cours des 40 dernières années. L’augmentation de la production agricole ayant accompagné la
croissance de la population a évité de ce fait une catastrophe malthusienne dans de nombreux
pays en voie de développement. La production mondiale de céréales est ainsi passée de 876
millions de tonnes à 2.45 milliards de tonnes au cours des 40 dernières années (FAOSTAT,
http://faostat.fao.org/). On estime que la révolution verte a ainsi sauvé un milliard de
personnes de la famine.
Cependant, il est désormais admis que cette révolution verte s’est accompagnée de
nombreux effets négatifs pouvant compromettre la pérennité du système de production
agricole actuel. Ces effets négatifs de l’intensification incluent la contamination des nappes
phréatiques, les rejets de gaz à effet de serre, l’eutrophisation de nombreux écosystèmes
aquatiques, la déforestation, la dégradation du sol, la salinisation de zones irriguées et
l’induction et le développement de résistances chez des organismes phytopathogènes. De plus,
il est apparu que le système de production actuel présente déjà des limites, avec une
tel-0
0804
633,
ver
sion
1 -
26 M
ar 2
013
Synthèse Bibliographique
3
population sous-alimentée estimée à 13% de la population mondiale, soit près de 910 millions
de personnes.
Un des grands défis des prochaines années va être de répondre à la future demande de
la population mondiale croissante. Cependant, les techniques actuelles d’agriculture intensive
ne peuvent répondre à ce défi, « Pour croître, l’agriculture doit apprendre à économiser »
(FAO, « Save and grow », 2011). C’est dans cette optique que la FAO a lancé une initiative
mondiale « Produire plus avec moins » rapporté sous la forme d’un ouvrage visant à proposer
un nouveau modèle d’agriculture. Les recommandations proposées reposent sur une
intensification de l’agriculture certes, mais une intensification qui soit raisonnée et durable.
Ce modèle est défini comme : « une agriculture productive qui permet de conserver et
d’améliorer les ressources naturelles. Elle utilise une approche écosystémique qui met à profit
la contribution de la nature à la croissance des plantes – matières organiques du sol, régulation
des débits d’eau, pollinisation et prédation naturelle des ravageurs – et applique des intrants
externes appropriés au bon moment et en quantité voulue ». Un des principes-clé pour
atteindre cet objectif est le maintien de la qualité et de la santé des sols.
2. La qualité des sols
Différentes tentatives pour définir un sol ainsi que sa qualité se sont succédées et sont
souvent le reflet d’une école de pensée. Elles sont adaptées à un objectif ou s’adressant à des
utilisateurs différents (Gobat et al., 2010). La définition d’un sol est préalable à la définition
de sa qualité. La complexité de l’objet qu’est le sol rend difficile la définition d’une qualité
générique. Dans notre problématique d’étude, nous allons adopter, en partie, la définition
proposée par Lavelle et Spain (2001) formulée à partir du rapport de la Société Américaine de
Science du Sol (Karlen et al., 1997). Le sol peut-être défini comme un assemblage organo-
minéral et comme tel, il est fortement dépendant et influencé par les processus biologiques. Il
est composé par un assemblage stable mais non consolidé de trois composantes : (1) de la
matière organique, (2) de la matière minérale et (3) de la matière organo-minérale et inclu un
ensemble d’organismes vivants qui lui est spécifique.
Au sein d’un sol, la matière organique est représentée par la biomasse et les produits
issus du métabolisme des organismes vivants (végétaux, animaux ainsi que des
tel-0
0804
633,
ver
sion
1 -
26 M
ar 2
013
Synthèse Bibliographique
4
microorganismes) et de la biomasse morte, issue de la décomposition de ces organismes. La
matière organique issue de la décomposition des organismes du sol, est composée de : (1) la
matière organique fraîche représentée par la litière et (2) la matière organique humifiée
représentée par des macromolécules synthétisées dans le sol à la suite de processus chimiques
et biochimiques complexes constituant l’humification (Gobat et al., 2010).
La matière minérale résulte de la dégradation physique et chimique de la roche mère.
Elle est composée de trois fractions identifiées selon leur granulométrie : les sables (50 – 2000
µm), les limons (2 – 50 µm) et les argiles (< 2 µm). La proportion de chaque fraction
déterminera la texture minérale du sol. Parmi la fraction minérale, les argiles, qui sont des
colloïdes minéraux, vont jouer un rôle central dans le sol. Ces particules colloïdales vont
influencer la structure, la porosité et la capacité d’échange ionique du sol. Ces processus sont
la résultante de trois capacités que possèdent les argiles : elles sont (1) électronégatives, (2)
hydrophiles et (3) capable de se disperser ou de floculer (Gobat et al., 2010).
La matière organo-minérale (communément appellée humus) est constituée de
complexes argilo-humiques. Ces complexes sont issus de l’assemblage via des liaisons
chimiques, généralement au travers d’un cation (calcium ou fer), entre des argiles et des
polymères organiques. Ces complexes argilo-humiques vont conférer de nombreuses
propriétés au sol et influeront sur sa qualité. Ils vont ainsi : (1) modifier l’aération du sol et le
stockage de l’eau, (2) ralentir la minéralisation de la matière organique, (3) empêcher la
dispersion des argiles, évitant le colmatage du sol et la compaction, (4) augmenter la capacité
du sol à retenir les bioéléments indispensables aux plantes (Gobat et al., 2010).
La qualité du sol quant à elle, peut-être définie comme « étant la capacité d'un sol à
maintenir la production biologique, la qualité de l’environnement et de promouvoir la santé
des plantes, des animaux et de l’homme » (Doran et al., 1996) ou encore comme étant : « La
capacité du sol à fonctionner comme un système vivant. Les sols en bonne santé maintiennent
en leur sein une diversité d’organismes qui contribuent à combattre les maladies des plantes,
les insectes et les adventices, s’associent de façon bénéfique et symbiotique aux racines,
recyclent les nutriments essentiels, améliorent la structure du sol et, partant, la rétention des
eaux et des nutriments, le tout contribuant à améliorer la production végétale » (FAO, « Save
and grow », 2011).
tel-0
0804
633,
ver
sion
1 -
26 M
ar 2
013
Synthèse Bibliographique
5
2.1. Le rôle des invertébrés dans la qualité du sol
Le sol est de moins en moins considéré comme une simple « boîte noire » dont l’utilité
se limite à l’apport de nutriments nécessaires à la croissance des plantes (Lavelle & Spain,
2001). En effet, le sol contient un des assemblages les plus complexes d’organismes vivants,
qui interagissent avec les composantes organiques et inorganiques d’un sol.
Parmi la composante biotique de ce système, les invertébrés du sol sont des acteurs
important dans ces interactions. De ce fait, ils ont un impact majeur au niveau des
caractéristiques physiques, chimiques et biologiques du sol, assurant le maintien de la
capacité du sol à délivrer des services écosystémiques (Lavelle, 2002; Lavelle et al., 2006).
Ces services écosystémiques concernent l’approvisionnement en eau, le cycle des nutriments,
la formation des sols, la régulation du climat ou encore le contrôle de l’érosion. Parmi les
invertébrés du sol, les vers de terre sont probablement les acteurs les plus importants dans la
formation des sols, dans le maintient de la structure et de la fertilité des sols. Ils représentent
la biomasse animale la plus importante des sols dans la plupart des écosystèmes terrestres.
Des ouvrages comme « The formation of vegetable mould through the action of worms » écrit
par Charles Darwin en 1881, ont très tôt rapporté l’importance des vers de terre en termes de
fragmentation de la matière végétale et animale morte, du remaniement et de la stabilisation
de la structure du sol, de l’aération, du drainage et de la fertilité.
2.2. Les vers de terre au fil des âges
Comme rapporté dans la synthèse de Minnich (1977), de tout temps les vers de terre
ont attiré l’attention des hommes. Leurs effet bénéfiques sur la fertilité des sols était déjà
connu dans l’Egypte antique allant même jusqu'à être déclarés sacrés par la reine Cléopâtre
(69 - 30 av J.-C.), rendant passible de la peine de mort toute extraction du sol. De grands
philosophes grecs tels Aristote (384 – 322 av. J.-C.) reconnurent aussi leur vertu en les
qualifiants « d’intestins de la terre ». Cependant, du 17ème siècle au 20ème siècle ils furent
considérés comme nuisibles, nécessitant d’être éradiqués des sols. Ils seront par la suite
réhabilités au travers d’ouvrages de grands naturalistes tels que Darwin (1881). Depuis le
début du 20ème siècle jusqu'à aujourd’hui, le nombre d’expériences visant à étudier l’effet des
tel-0
0804
633,
ver
sion
1 -
26 M
ar 2
013
Synthèse Bibliographique
6
vers de terre sur la structure et fertilité des sols, mais aussi sur les différents paramètres
agissant sur la croissance des plantes n’ont eu de cesse d’augmenter et ont fait à ce jour,
l’objet de nombreux travaux (Bouché, 1971; Sims et al., 1985; Edwards & Bohlen, 1995;
Lavelle & Spain, 2001; Edwards, 2004).
2.3 Taxinomie des vers de terre
Les vers de terre appartiennent au sous ordre des lombrics (Lumbricina), sous division
de la sous-classe des Oligochètes (Oligochaeta) appartenant à l’embranchement des annélides
(Annelidae). Les vers de terre représentent plus de la moitié des 6000 espèces décrites chez
les oligochètes et regroupent un ensemble de vers terrestres, arboricoles et aquatiques. Très
répandus, ils se retrouvent dans la plupart des régions du monde, à l’exception des milieux
climatiques extrêmes à l’image des déserts ou encore des régions constamment enneigées ou
recouvertes de glace. La diversité des espèces de vers de terre rend difficile les généralisations
sur leur impact sur le sol. Cependant, dans son ouvrage référençant les vers de terre en France,
Bouché (1971) a distingué 3 classes écologiques distinctes de vers de terre, suivant des
paramètres morphologiques et comportementaux (physiologiques) reflétant leurs mode de vie
et activité dans le sol: (1) les épigés, (2) les anéciques et (3) les endogés.
2.4. Ecologie des vers de terre
La classe des épigés, décrite par Bouché (1971), concerne les vers de terre vivant à la
surface du sol (Figure 1), dans la litière (en dehors de la phase minérale du sol). Ces vers de
terre, généralement de petite taille et fortement mobiles, possèdent une forte pigmentation qui
leur confèrent une coloration rouge foncé qui leur permet de se dissimuler dans la litière de
feuilles mortes et les déjections animales dans lesquelles ils vivent. Ces vers de terre, de part
leur régime alimentaire, vont être responsables de la décomposition et de la fragmentation de
la matière végétale morte (feuille, tige, tronc) et de toute autre matière organique résiduelle à
la surface du sol.
La classe des anéciques (Figure 1), regroupe les vers de terre vivant dans le sol et
créant des galeries verticales. Ces vers de terre à pigmentation brune, parfois irisée
(mimétisme crépusculaire) possèdent une taille beaucoup plus importante que les vers de terre
tel-0
0804
633,
ver
sion
1 -
26 M
ar 2
013
Synthèse Bibliographique
7
épigés. Ils sont caractérisés par une forte activité dans le sol, observable par le réseau
complexe de galeries et les nombreux turricules (déjections) qu’ils déposent à la surface du
sol. Ces vers de terre sortent généralement la nuit, afin de limiter la prédation. Ils vont
prélever la litière superficielle, qu’ils tirent dans leurs galeries. Ils réutilisent les mêmes
galeries pendant un certains temps, à la différence des endogés.
La classe des endogés (Figure 1) regroupe les vers de terre, de taille petite à
intermédiaire qui sont souvent caractérisés par un manque de pigmentation. Cette
caractéristique est répandue dans la faune édaphique de profondeur. Vivant en permanence
dans le sol, dans des galeries horizontales, ils se nourrissent de la phase organo-minérale du
sol (géophagie), de fragments de racines mortes (rhizophagie), mais aussi de la microflore et
mésofaune qui sont ingérées avec le sol. Cependant, leurs habitudes alimentaires sont
hétérogènes et dépendent fortement de leur préférence pour le type de matière organique
(Curry & Schmidt, 2007). Les turricules résultant de leur activité métabolique sont déposés
dans les galeries souterraines, qui sont donc peu réutilisées.
Dans la plupart des écosystèmes, les vers de terre sont des facteurs clé dans la
fragmentation de la matière organique (Lavelle & Spain, 2001). On estime ainsi qu’ils sont
capables de consommer la quasi-totalité de la litière annuelle (Brown et al., 2004). L’activité
conjointe de ces 3 classes écologiques de vers de terre permet la dégradation fine de la
matière organique ainsi que son enfouissement dans le sol selon la chronologie suivante : dans
un premier temps, la litière à la surface du sol va être fragmentée par les vers de terre épigés.
On estime que, cette litière fragmentée, sera à son tour consommée par les vers de terre
anéciques, la dégradant encore plus et permettant son enfouissement dans le sol. Cette matière
organique fortement dégradée va poursuivre son cycle en étant ingérée par les vers de terre
endogés et subissant un nouveau processus de dégradation et de dissolution. L’activité
conjointe des vers de terre contribue ainsi à l’entrée du carbone dans les sols et va permettre
tous les processus physiques, chimiques et biologiques qui vont être décrits ci-après.
tel-0
0804
633,
ver
sion
1 -
26 M
ar 2
013
Synthèse Bibliographique
8
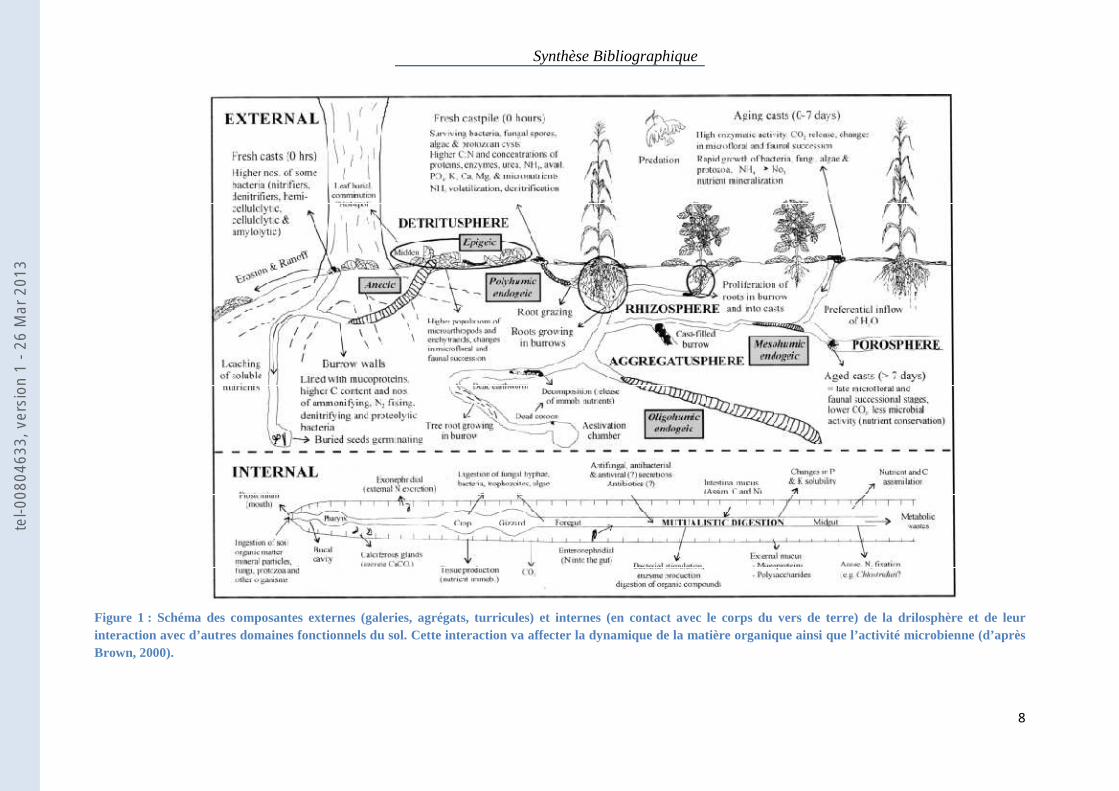
Figure 1 : Schéma des composantes externes (galeries, agrégats, turricules) et internes (en contact avec le corps du vers de terre) de la drilosphère et de leur interaction avec d’autres domaines fonctionnels du sol. Cette interaction va affecter la dynamique de la matière organique ainsi que l’activité microbienne (d’après Brown, 2000).
tel-0
0804
633,
ver
sion
1 -
26 M
ar 2
013
Synthèse Bibliographique
9
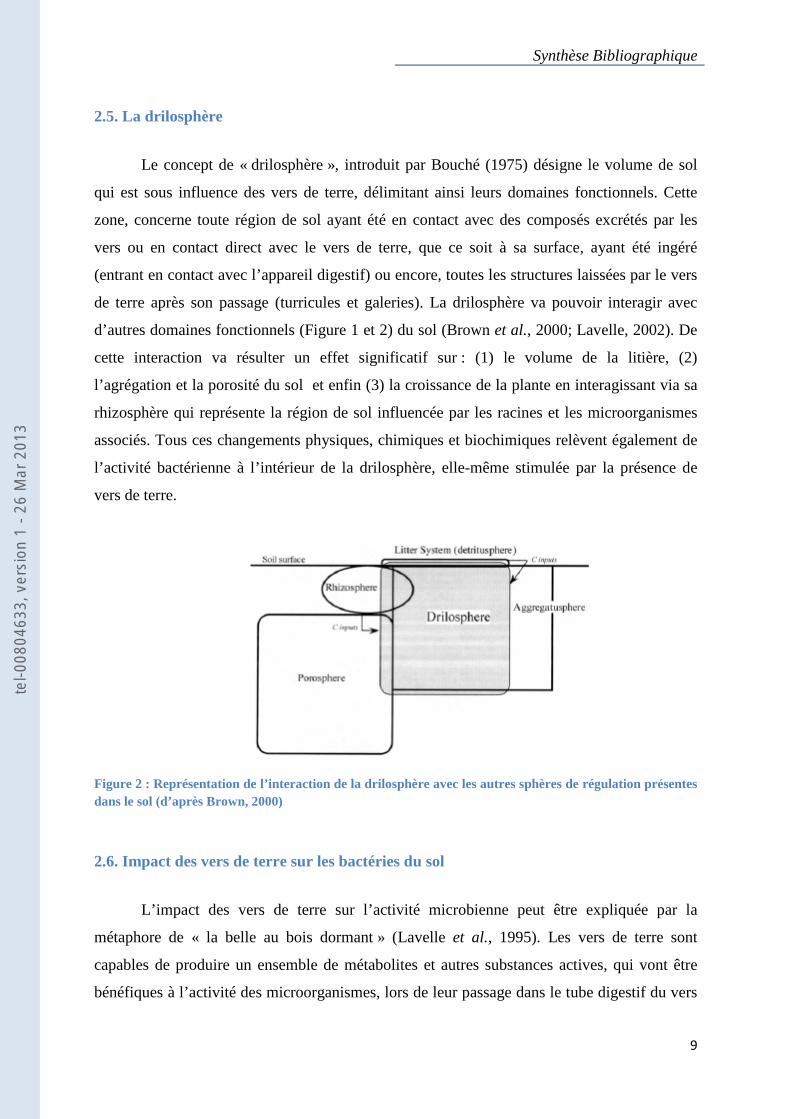
2.5. La drilosphère
Le concept de « drilosphère », introduit par Bouché (1975) désigne le volume de sol
qui est sous influence des vers de terre, délimitant ainsi leurs domaines fonctionnels. Cette
zone, concerne toute région de sol ayant été en contact avec des composés excrétés par les
vers ou en contact direct avec le vers de terre, que ce soit à sa surface, ayant été ingéré
(entrant en contact avec l’appareil digestif) ou encore, toutes les structures laissées par le vers
de terre après son passage (turricules et galeries). La drilosphère va pouvoir interagir avec
d’autres domaines fonctionnels (Figure 1 et 2) du sol (Brown et al., 2000; Lavelle, 2002). De
cette interaction va résulter un effet significatif sur : (1) le volume de la litière, (2)
l’agrégation et la porosité du sol et enfin (3) la croissance de la plante en interagissant via sa
rhizosphère qui représente la région de sol influencée par les racines et les microorganismes
associés. Tous ces changements physiques, chimiques et biochimiques relèvent également de
l’activité bactérienne à l’intérieur de la drilosphère, elle-même stimulée par la présence de
vers de terre.
Figure 2 : Représentation de l’interaction de la drilosphère avec les autres sphères de régulation présentes dans le sol (d’après Brown, 2000)
2.6. Impact des vers de terre sur les bactéries du sol
L’impact des vers de terre sur l’activité microbienne peut être expliquée par la
métaphore de « la belle au bois dormant » (Lavelle et al., 1995). Les vers de terre sont
capables de produire un ensemble de métabolites et autres substances actives, qui vont être
bénéfiques à l’activité des microorganismes, lors de leur passage dans le tube digestif du vers
tel-0
0804
633,
ver
sion
1 -
26 M
ar 2
013
Synthèse Bibliographique
10
de terre (Lavelle et al., 1995; Brown et al., 2000; Edwards, 2004). Au cours de ce processus,
du mucus intestinal chargé en eau et en carbone soluble (le baiser) est produit par le vers de
terre (le prince) et va permettre le réveil de certaines bactéries (les belles au bois dormant).
Ainsi, pendant et après le passage dans le tube digestif des vers de terre, les bactéries seront
fortement actives (Bernard et al., 2012). La forte activité des bactéries va permettre la
décomposition des formes stables de matière organique du sol pour lesquelles les vers de terre
ne possèdent pas les enzymes adéquates (Lavelle et al., 1995; Brown et al., 2000). Pendant ce
processus, la population d’autres organismes (protozoaires, nématodes, champignons) va
diminuer. Toutefois, aucun lien direct entre la digestion de ces organismes et l’alimentation
des vers de terre n’a été clairement démontré (Curry & Schmidt, 2007).
A la fin du processus de digestion, les populations bactériennes restent encore un
temps actives dans les turricules laissés par les vers de terre. Ceci va avoir comme effet
d’augmenter la minéralisation et la disponibilité des nutriments. Avec l’âge, l’activité à
l’intérieur de ces turricules va décroître jusqu'à retourner à son niveau initial, voir inférieur à
celui d’un sol non ingéré, ce qui serait responsable d’une protection de la matière organique.
3. Effets des vers de terre sur les plantes
3.1 Effet des vers de terre sur la croissance des plantes
Jusqu'à aujourd’hui, le nombre d’expériences visant à étudier l’effet des vers de terre
sur la croissance des plantes n’a eu de cesse d’augmenter et a fait à ce jour, l’objet de deux
revues de synthèse (Scheu, 2003; Brown et al., 2004), référençant respectivement 67 études
en milieu tempéré et 246 expériences en milieu tropical. Les questions récurrentes posées par
les études référencées portent sur : (1) quantifier l’effet (négatif ou positif) des vers sur la
biomasse des plantes, (2) quelles espèces de plantes sont les plus affectées et (3) quelle espèce
de vers de terre est la plus efficace dans la promotion de la croissance des plantes (Scheu,
2003; Brown et al., 2004). Ces études mettent en évidence un effet positif des vers de terre sur
la croissance des plantes avec un effet positif sur la biomasse aérienne dans 75% des cas pour
les vers de terres tropicaux et 79% des cas pour les vers de terre tempérés. Ces études ce sont
intéressées tout particulièrement à l’effet des vers de terre sur des espèces de plantes d’intérêt
agronomique.
tel-0
0804
633,
ver
sion
1 -
26 M
ar 2
013
Synthèse Bibliographique
11
Les auteurs des ces deux revues soulignent que les études référencées soulèvent
rarement la question du mécanisme via lequel les vers de terre agissent sur la croissance des
plantes et sur la fertilité des sols. Dès que le sol rentre en contact avec le tube digestif du vers
de terre, il va subir de profonds changements physico-chimiques et biologiques qui affectent
l’ensemble du profil du sol. Ces changements sont les facteurs déterminants pour expliquer
l’effet des vers de terre sur les plantes et sont fortement dépendants de la classe écologique du
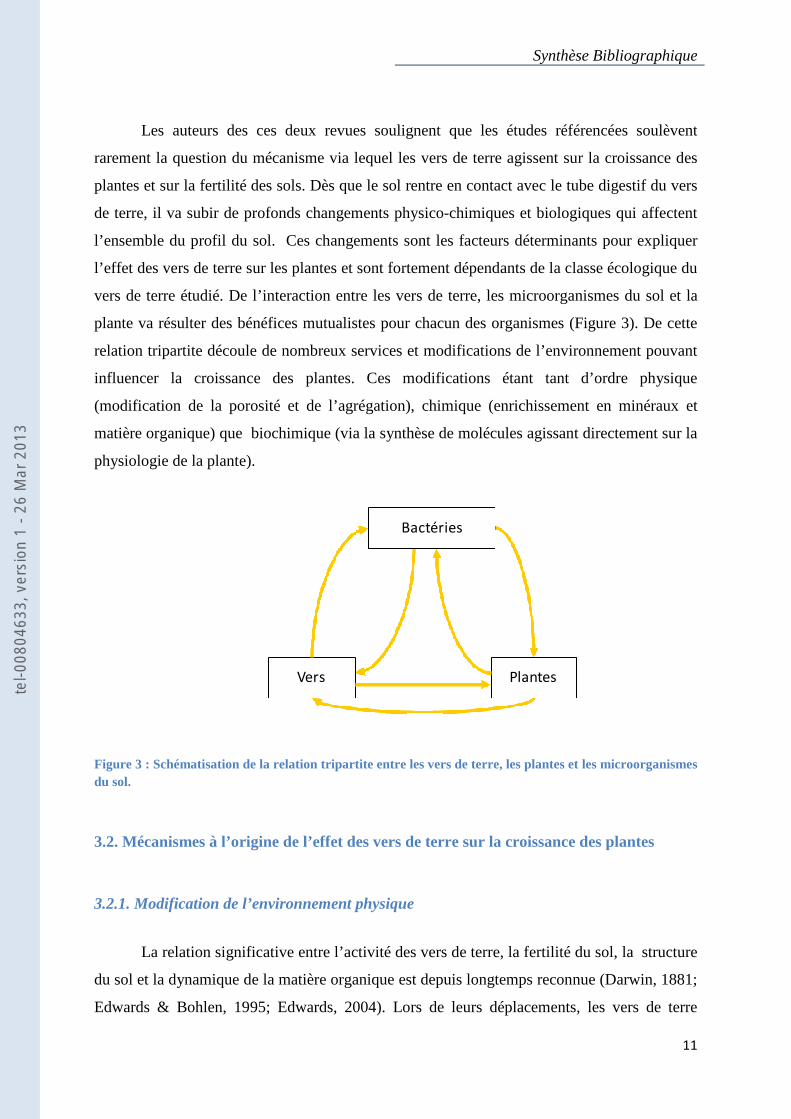
vers de terre étudié. De l’interaction entre les vers de terre, les microorganismes du sol et la
plante va résulter des bénéfices mutualistes pour chacun des organismes (Figure 3). De cette
relation tripartite découle de nombreux services et modifications de l’environnement pouvant
influencer la croissance des plantes. Ces modifications étant tant d’ordre physique
(modification de la porosité et de l’agrégation), chimique (enrichissement en minéraux et
matière organique) que biochimique (via la synthèse de molécules agissant directement sur la
physiologie de la plante).
Figure 3 : Schématisation de la relation tripartite entre les vers de terre, les plantes et les microorganismes du sol.
3.2. Mécanismes à l’origine de l’effet des vers de terre sur la croissance des plantes
3.2.1. Modification de l’environnement physique
La relation significative entre l’activité des vers de terre, la fertilité du sol, la structure
du sol et la dynamique de la matière organique est depuis longtemps reconnue (Darwin, 1881;
Edwards & Bohlen, 1995; Edwards, 2004). Lors de leurs déplacements, les vers de terre
Vers Plantes
Bactéries
tel-0
0804
633,
ver
sion
1 -
26 M
ar 2
013
Synthèse Bibliographique
12
consomment du sol et des résidus organiques qui vont être mixés pendant le passage dans leur
tube digestif, pour être finalement excrétés sous forme de turricules. Ce processus va
fortement affecter la dynamique de la matière organique, la porosité ainsi que la formation et
la stabilité des agrégats de sol par la formation de complexes argilo-humiques.
3.2.1.1. Impact sur la porosité des sols
La création de galeries dans le sol, par les vers de terre, va fortement influencer la
porosité de ce dernier. La porosité est le résultat de l’agencement entre les espaces vides et
des agrégats de sol de tailles différentes. Cette modification de la porosité va avoir une
influence au niveau de la croissance des plante en modifiant les échanges gazeux, la résistance
à la pénétration racinaire, la composition biotique de la rhizosphère mais surtout l’infiltration
et la rétention de l’eau (Shipitalo & Le Bayon, 2004). Les pores ainsi formés seront remplis
avec de l’eau ou de l’air et vont servir d’habitat à de nombreux organismes tel que des
bactéries, des protozoaires ou encore des nématodes dans la phase aqueuse et des
champignons, racines et microarthropodes dans la phase gazeuse (Brown et al., 2000). En
plus d’influencer les habitats de ces organismes, la porosité du sol va également influencer la
capacité de rétention de l’eau par le sol. La capacité de rétention de l’eau d’un sol résulte
essentiellement des forces de tension superficielles exercées sur les molécules d’eau due aux
effets de liaison autour des particules de sol et aux effets de capillarités dans les pores (Gobat
et al., 2010). En modifiant la porosité du sol, par la création de galeries, mais aussi en
compactant ou décompactant le sol (Blanchart et al., 1997; Blanchart et al., 1999), les vers de
terre vont influer sur l’espacement entre les particules de sol et donc sur la capacité de
rétention de l’eau par le sol. Enfin, la modification de la porosité va également influer sur les
processus métaboliques, en changeant notamment les concentrations en O2 favorisant plus ou
moins les processus métaboliques anaérobiques (Brown et al., 2000; Lavelle & Spain, 2001).
L’activité des vers de terre au niveau de la porosité du sol est très dépendante de la
catégorie écologique du vers de terre. Une série d’expérience, montre que les galeries créées
par des vers de terre anéciques ou endogés ont une bonne conductivité hydraulique.
Cependant, l’activité principale des vers de terre endogés ayant principalement lieu sous la
surface du sol, il en résulte la création de galeries horizontales souvent obstruées par des
turricules. Par conséquent, ils n’influencent probablement pas directement le transport de
tel-0
0804
633,
ver
sion
1 -
26 M
ar 2
013
Synthèse Bibliographique
13
l’eau dans le sol (Shipitalo & Le Bayon, 2004). C’est pour cette raison que la plus plupart des
recherches ce sont centrées autour des vers de terre anéciques tel que Lumbricus terrestris,
ayant probablement la plus grande action au niveau de la conductivité hydraulique dans le sol,
dû à la création de galeries verticales, partant de la surface et allant vers les profondeurs du
sol.
3.2.1.2 L’agrégation du sol par les vers de terre
Les vers de terre sont responsables de la majeure partie des agrégats à la surface des
sols. Certains auteurs ont établi que 50% des agrégats à la surface des sols tempérés seraient
constitués de ces turricules, représentant 40 à 50 t ha-1 an-1 en surface et d’autant plus en
profondeur (Six et al., 2004). Il existe deux mécanismes via lesquels les vers de terre vont
influencer cette agrégation : (1) la création de galeries et (2) la formation de turricules
(Brown et al., 2000).
Lors de leurs déplacements, les vers de terre vont exercer une pression sur le sol
environnant et du mucus, essentiellement constitué de polysaccharides et de macro-protéines,
va être excrété et déposé sur la paroi des galeries nouvellement formées, stabilisant ainsi leur
structure (Edwards & Bohlen, 1995).
Le processus de formation des agrégats dans les turricules est quant à lui différent et
influencé par de nombreux facteurs comme l’âge, la qualité de la matière organique ingérée,
ainsi que de l’activité des vers de terre elle même influencée par la disponibilité en nourriture
(Six et al., 2004). Une fois de plus, ce processus est fortement dépendant de la catégorie
écologique du vers de terre considéré. Toutefois, un processus général exhaustif peut-être
proposé quant à la formation de ces agrégats.
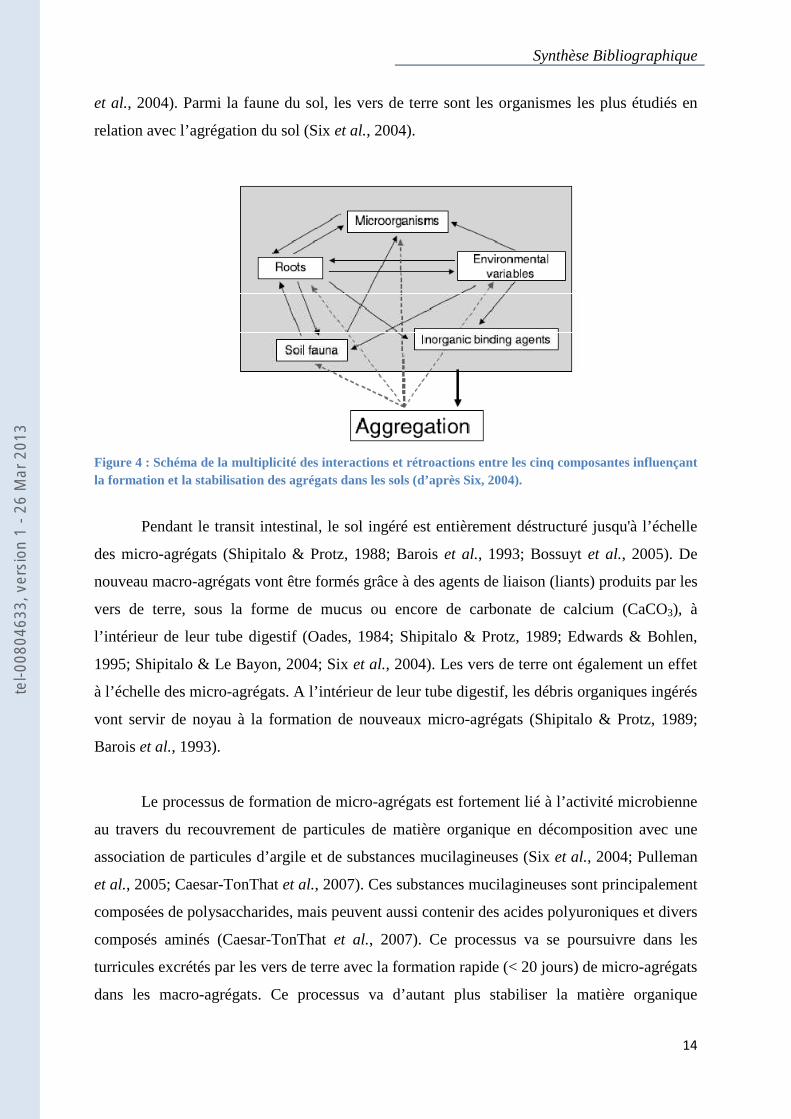
Le processus d’agrégation au sein d’un sol est soumis à plusieurs facteurs (Figure 4):
(1) la faune du sol, (2) les microorganismes du sol, (3) les systèmes racinaires des plantes, (4)
des liants inorganiques et (5) des facteurs environnementaux. Tous ces acteurs interagissent
pour conduire à la formation de (1) micro-agrégats (50 - 250 µm), (2) macro-agrégats (> 250
µm) et (3) de micro-agrégats dans les macro-agrégats. La formation de ces 3 composantes est
illustrée par la théorie de l’agrégation hiérarchique et est fortement dépendante des facteurs
biotiques du milieu (système racinaire des plantes, mycéliums et bactéries) (Oades, 1984; Six
tel-0
0804
633,
ver
sion
1 -
26 M
ar 2
013
Synthèse Bibliographique
14
et al., 2004). Parmi la faune du sol, les vers de terre sont les organismes les plus étudiés en
relation avec l’agrégation du sol (Six et al., 2004).
Figure 4 : Schéma de la multiplicité des interactions et rétroactions entre les cinq composantes influençant la formation et la stabilisation des agrégats dans les sols (d’après Six, 2004).
Pendant le transit intestinal, le sol ingéré est entièrement déstructuré jusqu'à l’échelle
des micro-agrégats (Shipitalo & Protz, 1988; Barois et al., 1993; Bossuyt et al., 2005). De
nouveau macro-agrégats vont être formés grâce à des agents de liaison (liants) produits par les
vers de terre, sous la forme de mucus ou encore de carbonate de calcium (CaCO3), à
l’intérieur de leur tube digestif (Oades, 1984; Shipitalo & Protz, 1989; Edwards & Bohlen,
1995; Shipitalo & Le Bayon, 2004; Six et al., 2004). Les vers de terre ont également un effet
à l’échelle des micro-agrégats. A l’intérieur de leur tube digestif, les débris organiques ingérés
vont servir de noyau à la formation de nouveaux micro-agrégats (Shipitalo & Protz, 1989;
Barois et al., 1993).
Le processus de formation de micro-agrégats est fortement lié à l’activité microbienne
au travers du recouvrement de particules de matière organique en décomposition avec une
association de particules d’argile et de substances mucilagineuses (Six et al., 2004; Pulleman
et al., 2005; Caesar-TonThat et al., 2007). Ces substances mucilagineuses sont principalement
composées de polysaccharides, mais peuvent aussi contenir des acides polyuroniques et divers
composés aminés (Caesar-TonThat et al., 2007). Ce processus va se poursuivre dans les
turricules excrétés par les vers de terre avec la formation rapide (< 20 jours) de micro-agrégats
dans les macro-agrégats. Ce processus va d’autant plus stabiliser la matière organique
tel-0
0804
633,
ver
sion
1 -
26 M
ar 2
013
Synthèse Bibliographique
15
contenue dans les turricules, en la protégeant physiquement des bactéries (Bossuyt et al.,
2005). L’activité des microorganismes va par la suite décliner à l’intérieur du turricule due à
une réduction de la disponibilité des ressources en carbone et azote labile (Lavelle et al.,
1989). Ces micro-agrégats ayant incorporé de la matière organique fraîche, seront par la suite
rendus disponibles au fur et à mesure de la désintégration des macro-agrégats. Ces micro-
agrégats, plus stables que les macro-agrégats vont ainsi contribuer à la protection à long terme
du carbone du sol et contribuer au cycle de l’azote et du carbone (Brown et al., 2000).
3.2.2. Modification de l’environnement chimique
La disponibilité en nutriments dans l’environnement est indispensable à la croissance
des plantes. Souvent, la limitation en nutriments concerne l’azote, le phosphore et le
potassium. La disponibilité de ces nutriments essentiels a déjà été montrée comme étant
accrue dans les structures produites par de nombreuses espèces de vers de terre. Les turricules
de ces vers de terre présentent une teneur en nutriments élevée pour NH4+, NO3
-, Mg2+, K+ et
HPO42- en comparaison avec un sol non ingéré (Syers et al., 1979; Mackay et al., 1983;
Tiwari et al., 1989; James, 1991). Les vers de terre sont des acteurs majeurs au niveau de la
circulation des nutriments dans le sol de part la consommation, la fragmentation et le mixage
de cette matière organique avec les particules minérales de sol, afin de former des agrégats.
L’action des vers de terre au niveau de la concentration des nutriments dans le sol peut être
réalisée, par un effet direct via (1) les produits issus de leur propre métabolisme (déchets
azotés et mucus), (2) l’ingestion et le brassage de résidus de matière organique avec la
microflore dans leur tractus digestif ou (3) via un effet indirect au travers de changements
dans leur environnement. Ces changements au niveau de l’environnement peuvent
correspondre à une modification de la structure des communautés microbiennes du sol ou au
déplacement de résidus de matière organique. Il a ainsi été estimé que les vers de terre au
travers d’excrétion, de la production de mucus, ainsi que du passage du sol dans leur tractus
digestif, contribuaient fortement à l’apport en nutriments dans les écosystèmes tropicaux
comme tempérés, avec un apport en azote estimé de 30 à 50 kg ha-1 an-1 (Curry & Byrne,
1992; Edwards, 2004).
tel-0
0804
633,
ver
sion
1 -
26 M
ar 2
013
Synthèse Bibliographique
16
3.2.2.1. Digestion
La digestion de la matière organique par le vers de terre est réalisée dans leur tube
digestif au travers d’un ensemble d’enzymes tel que des chitinases, des protéases, des
phosphatases ainsi que diverses glucosidases (Brown et al., 2000). Ces enzymes leur
permettent de digérer des bactéries, protozoaires, champignons et une partie des débris
végétaux. Cependant, la majorité des invertébrés ne possèdent pas les enzymes appropriés
afin de digérer la cellulose, la lignine, les tanins ou encore des complexes humiques qui
constituent une grande partie des ressources présentes dans le sol (Lavelle et al., 1995; Brown
et al., 2000). Néanmoins, il a été observé que certains vers de terre étaient tout de même
impliqués dans les processus de dégradation de ces composés (Lattaud et al., 1998a; Lattaud
et al., 1998b). Le mécanisme à la base de la digestion de ces composés repose sur une
association avec la microflore ingérée et certains microorganismes déjà présents dans le tube
digestif, activés au travers de l’effet «belle au bois dormant » (Lavelle et al., 1995; Brown et
al., 2000). Ces bactéries, par l’ensemble des enzymes qu’elles sont capables de synthétiser et
que ne possèdent pas les vers de terre, vont permettre de réaliser une digestion mutualiste de
la matière organique (Lattaud et al., 1998a; Lattaud et al., 1998b; Brown et al., 2000). Durant
le processus de digestion par les vers de terre, le ratio carbone/azote va chuter
progressivement. La majeure partie de l’azote sera convertie sous forme de nitrate ou
d’ammonium. En parallèle, le potassium et le phosphore seront eux aussi convertis en une
forme qui les rend disponibles pour la plante (Edwards, 2004).
3.2.2.2. Minéralisation dans les turricules
La digestion mutualiste initiée dans le tube digestif du vers de terre va se poursuivre à
l’intérieur des turricules (Lavelle et al., 2004). Les microorganismes du sol réalisent à eux
seuls près de 90% des transformations de la matière organique dans les sols (Lavelle et al.,
2004). L’activité des microorganismes qui sont rejetés avec les turricules va être stimulée par
priming effect et ces microorganismes vont poursuivre la digestion de la matière organique
(Lavelle et al., 1995; Brown et al., 2000). Ainsi, les produits issus de cette digestion externe
pourront être assimilés de nouveau par les vers de terre ou bien par les plantes.
tel-0
0804
633,
ver
sion
1 -
26 M
ar 2
013
Synthèse Bibliographique
17
Au niveau de l’implication des microorganismes dans le cycle de l’azote on peut bien
sûr citer les bactéries symbiotiques ou non-symbiotiques capables de fixer le diazote
atmosphérique et dont les effets ont déjà été largement étudiés (Hayat et al., 2010).
Cependant, aucune influence des vers de terre sur ces populations n’a été démontrée à ce jour.
Toutefois, d’autres bactéries, au travers d’activités de nitrification et de dénitrification, sont
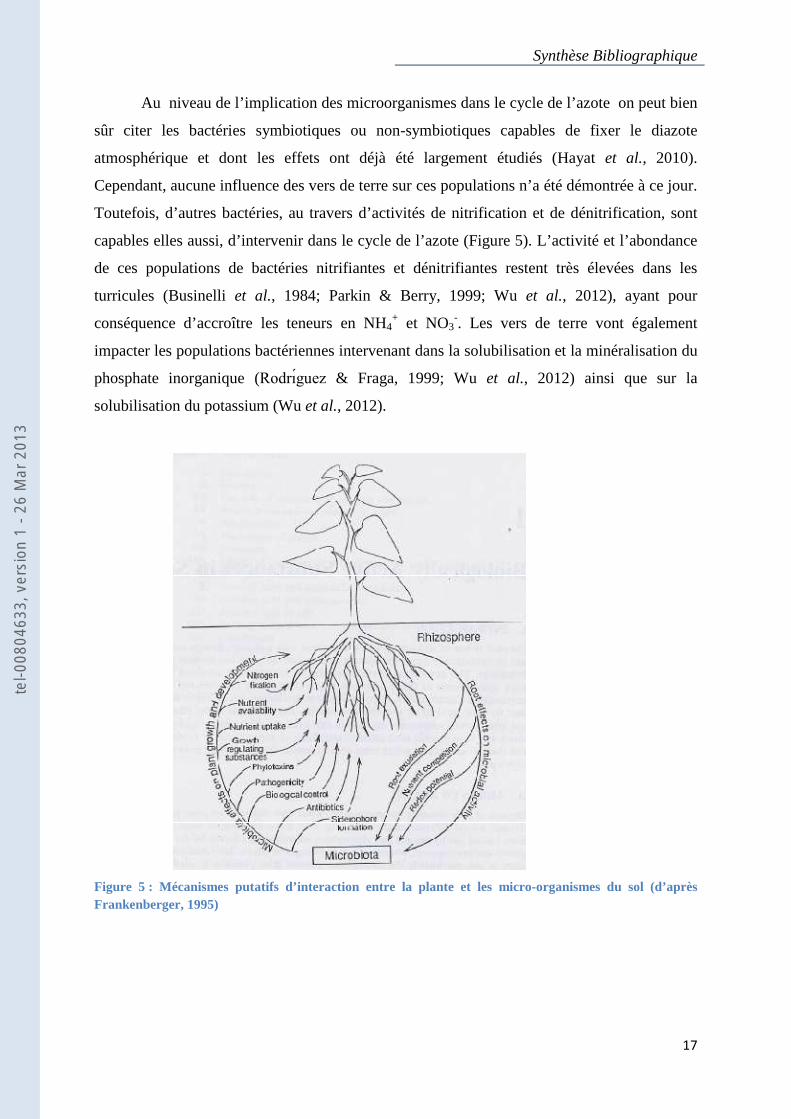
capables elles aussi, d’intervenir dans le cycle de l’azote (Figure 5). L’activité et l’abondance
de ces populations de bactéries nitrifiantes et dénitrifiantes restent très élevées dans les
turricules (Businelli et al., 1984; Parkin & Berry, 1999; Wu et al., 2012), ayant pour
conséquence d’accroître les teneurs en NH4+ et NO3
-. Les vers de terre vont également
impacter les populations bactériennes intervenant dans la solubilisation et la minéralisation du
phosphate inorganique (Rodrı�guez & Fraga, 1999; Wu et al., 2012) ainsi que sur la
solubilisation du potassium (Wu et al., 2012).
Figure 5 : Mécanismes putatifs d’interaction entre la plante et les micro-organismes du sol (d’après Frankenberger, 1995)
tel-0
0804
633,
ver
sion
1 -
26 M
ar 2
013
Synthèse Bibliographique
18
3.2.3. Modification de l’environnement biologique et biochimique
En modifiant le milieu biologique, notamment l’activité des microorganismes du sol,
les vers de terre vont fortement modifier les processus biochimiques qui leurs sont associés.
L’implication d’une modification de l’environnement biochimique par les vers de terre est un
facteur déterminant dans la compréhension de situations où des changements dans la structure
du sol ou dans la disponibilité en nutriments ne permettent pas à eux seuls d’expliquer l’effet
des vers de terre sur la physiologie et la croissance des plantes (Tomati et al., 1988; Blouin et
al., 2005; Blouin et al., 2006; Laossi et al., 2010). L’hypothèse selon laquelle l’effet des vers
de terre impliquerait des composés ayant un effet régulateur sur la croissance des plantes fût
proposée par Gravilov (1963). Cette hypothèse fût appuyée par l’isolation, dans les tissus de
vers de terre, de nombreuses molécules régulatrices de la croissance des plantes,
essentiellement des molécules issues de la famille des indoles (Nielson, 1965). Par la suite, cet
effet a été confirmé pour d’autres espèces de vers de terre (Nardi et al., 1988; Tomati et al.,
1988). Ces études ont également montré que ces substances stimulaient la rizhogenèse et la
croissance racinaire selon un processus proche de l’action de certaines phytohormones
notamment de l’auxine, une des phytohormones majeures, contrôlant de nombreux processus
de croissance chez la plante (Hooykaas et al., 1999; Taiz & Zeiger, 2010). De plus, dans
certaines de ces études, de l’Acide Indole Acétique, une des formes majoritaires de l’auxine
endogène, a été isolée (Tomati et al., 1988; Muscolo et al., 1998; Canellas et al., 2002).
Concernant l’origine de ces composés, aucune de ces expériences n’excluent que ces
composés proches des phytohormones soient produits par les microorganismes vivant dans le
tube digestif du vers de terre ou restant dans les structures biogéniques laissées par ce dernier
(Tomati et al., 1988; Brown et al., 2004). D’autant plus qu’à ce jour, rien dans la littérature
concernant les oligochètes ne suggère qu’ils soient capables de synthétiser ces composés.
La synthèse de ces composés par les microorganismes du sol a depuis longtemps été
observée (Frankenberger & Arshad, 1995; Persello-Cartieaux et al., 2003; Ping & Boland,
2004; Hayat et al., 2010). Toutefois, l’impact des vers de terre sur ces communautés de
microorganismes a été peu étudié. On peut postuler que par les changements dans la diversité
et la densité de ces communautés par les vers de terre, la production de ces composés et les
processus biochimiques associés (Figure 5) vont être fortement modifiés.
tel-0
0804
633,
ver
sion
1 -
26 M
ar 2
013
Synthèse Bibliographique
19
4. Effet des microorganismes sur les plantes
La capacité des micro-organismes du sol à produire des molécules régulatrices (Figure
5 et 6) de la croissance des plantes est depuis longtemps reconnue et référencée
(Frankenberger & Arshad, 1995; Persello-Cartieaux et al., 2003; Ping & Boland, 2004; Hayat
et al., 2010). Ces micro-organismes peuvent avoir des effets bénéfiques sur la croissance des
plantes en interférant avec la rhizosphère (Figure 1 et 2). Elles promeuvent ainsi leur
croissance, limitent l’attaque de pathogènes ou encore améliorent la qualité du sol. Ces effets
sur les plantes ont amené les microbiologistes à les regrouper sous le nom de Plant Growth
Promoting Rhizobacteria (PGPR), terme introduit par Kloepper et Schroth (1978).
Généralement, le mode d’action des PGPR suit 3 axes majeurs (Persello-Cartieaux et al.,
2003; Hayat et al., 2010) : (1) la synthèse de composés interagissant directement avec la
physiologie des plantes, (2) en facilitant le prélèvement de certains nutriments du sol et (3) en
diminuant ou en prévenant les maladies causées par des phytopathogènes.
4.1. Production de molécules phytostimulantes
Les bactéries du sol sont connues pour être capables de produire un large spectre de
molécules actives sur la physiologie des plantes (Figure 6). Ces molécules vont agir
notamment au niveau de la morphogenèse racinaire (production de poils absorbants et de
racines latérales), pouvant conduire à une optimisation du prélèvement des nutriments et de la
synthèse d’exsudats par la plante (Persello-Cartieaux et al., 2003; Spaepen et al., 2007). Ces
rhizobactéries promotrices de la croissance des plantes (PGPR) synthétisent et excrètent des
hormones végétales, qui sont des substances organiques interagissant avec la physiologie de la
plante à des doses très faibles (Frankenberger & Arshad, 1995; Persello-Cartieaux et al.,
2003; Hayat et al., 2010). La production de phytohormones par les microorganismes est très
connue notamment au niveau des mécanismes de morphogénèse pour l’établissement d’une
relation symbiotique, c'est-à-dire avec un contact physique, entre la plante et un
microorganisme (Spaepen et al., 2007). La production de phytohormones a été étudiée par la
suite chez d’autres organismes de la rhizosphère, non symbiotiques (Hayat et al., 2010).
Même si la production de certaines phytohormones, comme celles de la famille des
gibbérellines ou encore des jasmonates ne semblent que faiblement produites par les bactéries
tel-0
0804
633,
ver
sion
1 -
26 M
ar 2
013
Synthèse Bibliographique
20
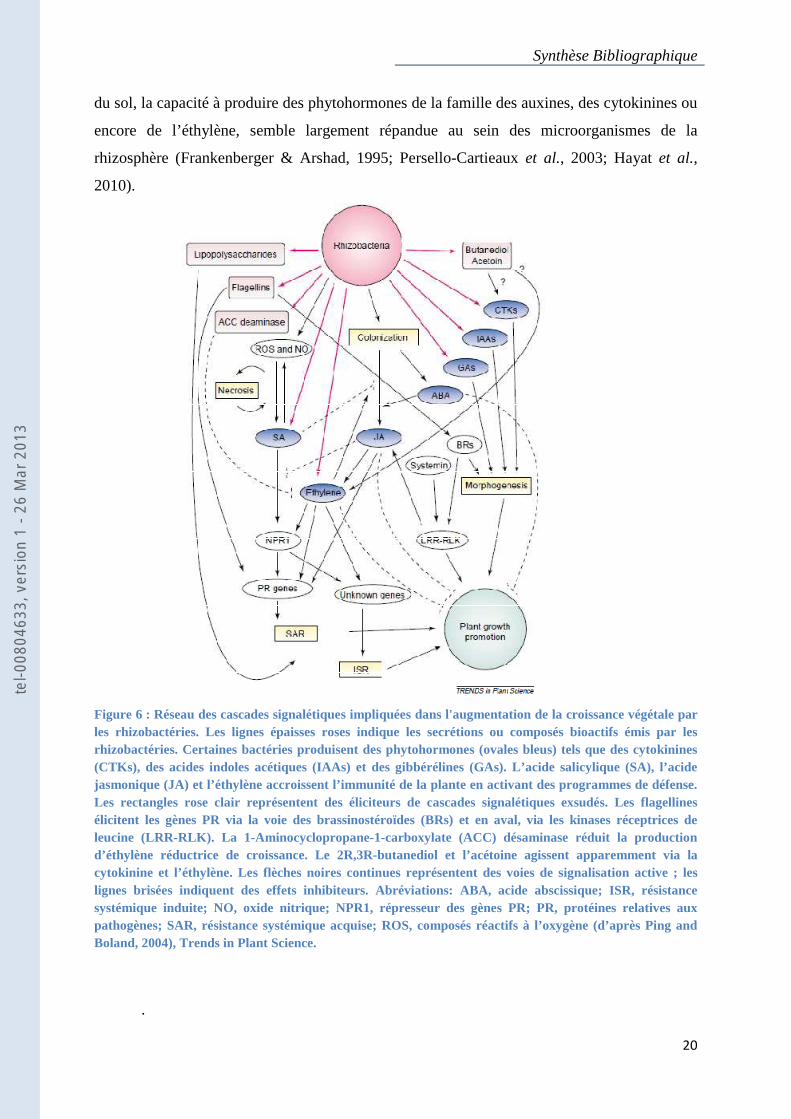
du sol, la capacité à produire des phytohormones de la famille des auxines, des cytokinines ou
encore de l’éthylène, semble largement répandue au sein des microorganismes de la
rhizosphère (Frankenberger & Arshad, 1995; Persello-Cartieaux et al., 2003; Hayat et al.,
2010).
Figure 6 : Réseau des cascades signalétiques impliquées dans l'augmentation de la croissance végétale par les rhizobactéries. Les lignes épaisses roses indique les secrétions ou composés bioactifs émis par les rhizobactéries. Certaines bactéries produisent des phytohormones (ovales bleus) tels que des cytokinines (CTKs), des acides indoles acétiques (IAAs) et des gibbérélines (GAs). L’acide salicylique (SA), l’acide jasmonique (JA) et l’éthylène accroissent l’immunité de la plante en activant des programmes de défense. Les rectangles rose clair représentent des éliciteurs de cascades signalétiques exsudés. Les flagellines élicitent les gènes PR via la voie des brassinostéroïdes (BRs) et en aval, via les kinases réceptrices de leucine (LRR-RLK). La 1-Aminocyclopropane-1-carboxylate (ACC) désaminase réduit la production d’éthylène réductrice de croissance. Le 2R,3R-butanediol et l’acétoine agissent apparemment via la cytokinine et l’éthylène. Les flèches noires continues représentent des voies de signalisation active ; les lignes brisées indiquent des effets inhibiteurs. Abréviations: ABA, acide abscissique; ISR, résistance systémique induite; NO, oxide nitrique; NPR1, répresseur des gènes PR; PR, protéines relatives aux pathogènes; SAR, résistance systémique acquise; ROS, composés réactifs à l’oxygène (d’après Ping and Boland, 2004), Trends in Plant Science.
.
tel-0
0804
633,
ver
sion
1 -
26 M
ar 2
013
Synthèse Bibliographique
21
4.1.1. L’auxine
Au sein de ces phytohormones, l’auxine a reçu une attention toute particulière,
notamment au niveau de sa forme endogène la plus active, l’acide indole acétique (IAA).
L’auxine est connue pour stimuler des processus comme l’élongation cellulaire, la division et
différenciation cellulaire ou encore des processus de défense chez la plante (Spaepen et al.,
2007). Les bactéries possèdent une voie de biosynthèse de l’auxine qui leur est propre
(Persello-Cartieaux et al., 2003). Cependant, la biosynthèse se réalise généralement à partir du
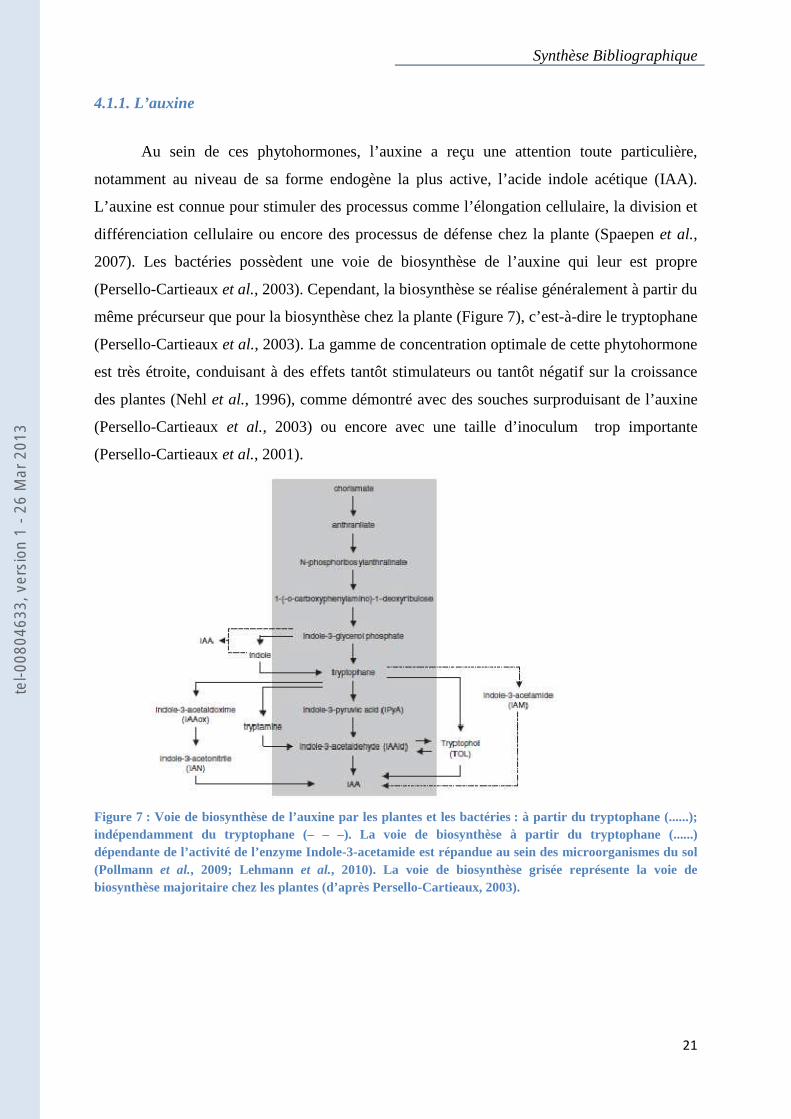
même précurseur que pour la biosynthèse chez la plante (Figure 7), c’est-à-dire le tryptophane
(Persello-Cartieaux et al., 2003). La gamme de concentration optimale de cette phytohormone
est très étroite, conduisant à des effets tantôt stimulateurs ou tantôt négatif sur la croissance
des plantes (Nehl et al., 1996), comme démontré avec des souches surproduisant de l’auxine
(Persello-Cartieaux et al., 2003) ou encore avec une taille d’inoculum trop importante
(Persello-Cartieaux et al., 2001).
Figure 7 : Voie de biosynthèse de l’auxine par les plantes et les bactéries : à partir du tryptophane (......); indépendamment du tryptophane (– – –). La voie de biosynthèse à partir du tryptophane (......) dépendante de l’activité de l’enzyme Indole-3-acetamide est répandue au sein des microorganismes du sol (Pollmann et al., 2009; Lehmann et al., 2010). La voie de biosynthèse grisée représente la voie de biosynthèse majoritaire chez les plantes (d’après Persello-Cartieaux, 2003).
tel-0
0804
633,
ver
sion
1 -
26 M
ar 2
013
Synthèse Bibliographique
22
4.1.2. L’éthylène
Une autre phytohormone ayant été largement étudiée dans les interactions plantes-
microorganismes est l’éthylène (Figure 6), plus précisément son précurseur, le 1-
aminocyclopropane-1-carboxylic acid (ACC). L’éthylène est une phytohormone qui intervient
chez la plante dans des processus de croissance et de développement mais également dans des
mécanismes de défense. L’éthylène peut-être produit directement par les bactéries du sol,
mais cette production est souvent associée à des effets délétères (Persello-Cartieaux et al.,
2003). Il semblerait que l’effet de l’éthylène sur la stimulation de la croissance des plantes
passe par une modification de la production d’auxine par les bactéries du sol. La plante
soumise à de l’auxine exogène, produite par ces bactéries, va alors synthétiser de l’ACC. Cet
ACC va être hydrolysé en ammonium et α-ketobutyrate au travers de l’activité 1-
aminocyclopropane-1-carboxylate désaminase (ACC désaminase) de certaines enzymes
bactériennes (Hontzeas et al., 2004; Arshad et al., 2008). Ceci va avoir pour conséquence une
réduction de la quantité d’ACC dans le sol. Par la réduction de la quantité d’éthylène, les
effets sur l’inhibition racinaire vont être levés.
La balance entre la biosynthèse d’auxine et d’éthylène va déterminer les effets sur la
croissance des plantes, à savoir un effet délétère ou bien un effet stimulant. Cet effet
collaboratif entre ces deux phytohormones ce retrouve également à l’intérieur de la plante, où
elles sont connues pour être synergiques dans les processus d’élongation et formation de poils
absorbants et antagonistes dans les processus de formation de racines latérales et de
l’élongation de l’hypocotyle (Muday et al., 2012).
4.1.3. Autres phytohormones
D’autres phytohormones produites par les bactéries du sol et ayant un effet sur la
morphogénèse ont été isolées. Cependant, ces composés se retrouvent en moins grande
quantité et souvent leur isolation et quantification sont plus difficiles. Parmi ces composés, la
famille des cytokinines joue avec les auxines un rôle important sur le développement de la
plante notamment au niveau de processus de division cellulaire (Hooykaas et al., 1999). Une
autre classe de composés ayant un effet sur la morphogénèse des plantes est à distinguer des
phytohormones. Ces molécules sont des composés organiques volatiles (VOC) qui ont été
décrits à de multiples reprises comme ayant un impact direct sur la morphogénèse des plantes
tel-0
0804
633,
ver
sion
1 -
26 M
ar 2
013
Synthèse Bibliographique
23
(Ryu et al., 2003; Ping & Boland, 2004; López-Bucio et al., 2007; Zhang et al., 2007a).
Cependant, leur mode d’action sur la physiologie de la plante n’a pas encore été élucidé et
selon le type de composé il pourrait interagir (Zhang et al., 2007a) ou non (López-Bucio et
al., 2007) avec la voie signalétique de l’auxine chez les plantes.
4.2. Optimisation du prélèvement des nutriments par la plante
La question de la promotion de la croissance des plantes par les vers de terre via une
augmentation de la disponibilité en nutriments a déjà été abordée. Cette augmentation de la
disponibilité en nutriments peut être réalisée par la stimulation de certaines bactéries du sol.
Ces bactéries vont minéraliser la matière organique et transformer certains nutriments afin de
les rendre plus disponibles pour la plante. Cependant, la promotion de la croissance à travers
un mécanisme trophique, peut-être aussi réalisée à travers l’optimisation du prélèvement de
ces nutriments par la plante. Certaines études ont montré que les substances humiques,
dérivées de la digestion par les vers de terre, avaient un effet proche de celui de l’auxine au
niveau de la croissance des plantes (Nardi et al., 1988; Tomati et al., 1988; Nardi et al.,
2002). Dans la continuité de ces études, il a été démontré que ces substances humiques, en
plus de leur impact direct sur la croissance des plantes, ont un impact sur l’activité des H+-
ATPase membranaires (Canellas et al., 2002; Quaggiotti et al., 2004). La stimulation de ces
H+-ATPase peut faciliter la nutrition minérale chez les plantes en augmentant le gradient de
protons qui contrôle le transport ionique à travers les membranes des cellules (Morsomme &
Boutry, 2000). De plus, l’expression du gène codant pour le transporteur membranaire de
nitrate NRT1.1 (CHL1) peut être régulé par de l’auxine exogène (Guo et al., 2002; Krouk et
al., 2010) et en présence d’acides humiques produits par les vers (Quaggiotti et al., 2004).
4.3. Effet sur les mécanismes de défense de la plante
Certaines PGPR, sont capables d’améliorer la performance des plantes en activant des
résistances systémiques chez ces dernières (Figure 6), leur conférant ainsi un large spectre de
résistance face à de nombreux pathogènes et insectes (Persello-Cartieaux et al., 2003; Ryu et
al., 2004; Bakker et al., 2007; van Wees et al., 2008; Hayat et al., 2010). On distingue deux
types de résistances systémiques : la résistance acquise et la résistance induite. La résistance
systémique acquise (SAR) repose sur la synthèse d’acide salicylique (SA) par la plante
tel-0
0804
633,
ver
sion
1 -
26 M
ar 2
013
Synthèse Bibliographique
24
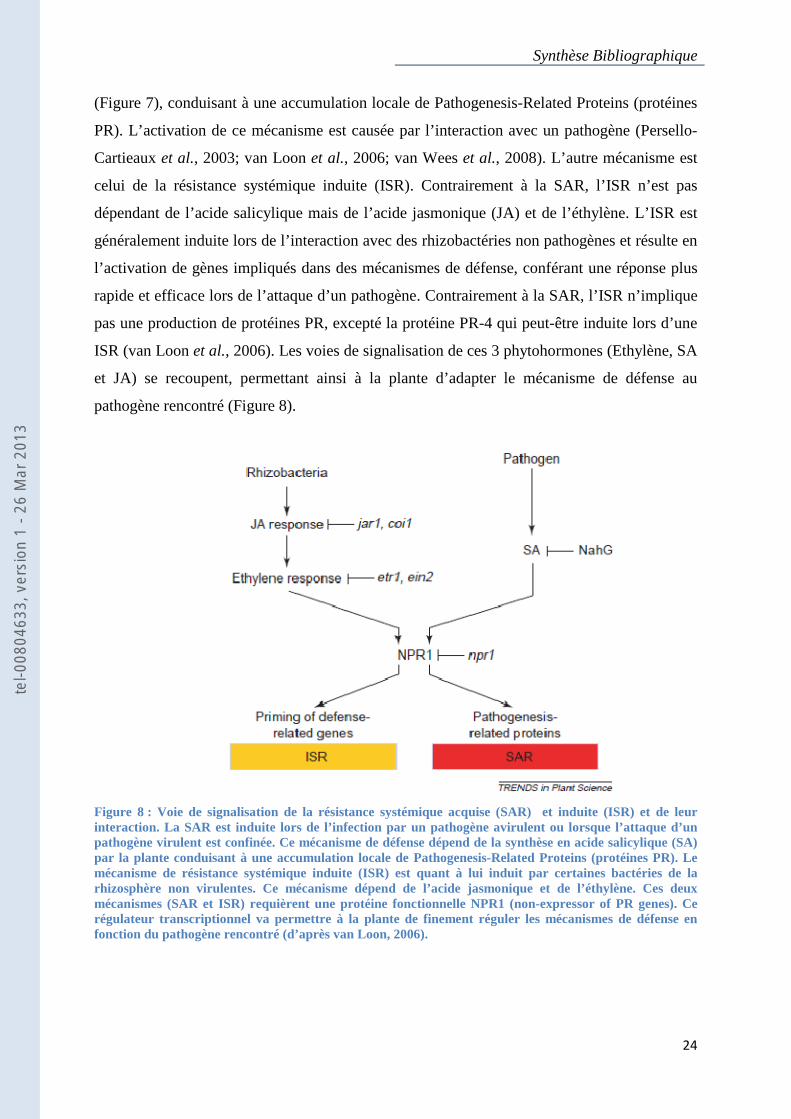
(Figure 7), conduisant à une accumulation locale de Pathogenesis-Related Proteins (protéines
PR). L’activation de ce mécanisme est causée par l’interaction avec un pathogène (Persello-
Cartieaux et al., 2003; van Loon et al., 2006; van Wees et al., 2008). L’autre mécanisme est
celui de la résistance systémique induite (ISR). Contrairement à la SAR, l’ISR n’est pas
dépendant de l’acide salicylique mais de l’acide jasmonique (JA) et de l’éthylène. L’ISR est
généralement induite lors de l’interaction avec des rhizobactéries non pathogènes et résulte en
l’activation de gènes impliqués dans des mécanismes de défense, conférant une réponse plus
rapide et efficace lors de l’attaque d’un pathogène. Contrairement à la SAR, l’ISR n’implique
pas une production de protéines PR, excepté la protéine PR-4 qui peut-être induite lors d’une
ISR (van Loon et al., 2006). Les voies de signalisation de ces 3 phytohormones (Ethylène, SA
et JA) se recoupent, permettant ainsi à la plante d’adapter le mécanisme de défense au
pathogène rencontré (Figure 8).
Figure 8 : Voie de signalisation de la résistance systémique acquise (SAR) et induite (ISR) et de leur interaction. La SAR est induite lors de l’infection par un pathogène avirulent ou lorsque l’attaque d’un pathogène virulent est confinée. Ce mécanisme de défense dépend de la synthèse en acide salicylique (SA) par la plante conduisant à une accumulation locale de Pathogenesis-Related Proteins (protéines PR). Le mécanisme de résistance systémique induite (ISR) est quant à lui induit par certaines bactéries de la rhizosphère non virulentes. Ce mécanisme dépend de l’acide jasmonique et de l’éthylène. Ces deux mécanismes (SAR et ISR) requièrent une protéine fonctionnelle NPR1 (non-expressor of PR genes). Ce régulateur transcriptionnel va permettre à la plante de finement réguler les mécanismes de défense en fonction du pathogène rencontré (d’après van Loon, 2006).
tel-0
0804
633,
ver
sion
1 -
26 M
ar 2
013
Synthèse Bibliographique
25
4.3.1. Production de composés interagissant avec les mécanismes de défense de la plante
Les microorganismes du sol peuvent interagir directement avec les mécanismes de
défense de la plante au travers de la synthèse d’acide salicylique (SA) ou d’1-
aminocyclopropane-1-carboxylic acid (ACC), induisant un mécanisme de résistance acquise
(SAR) ou induite (ISR) respectivement. La production de composés de la famille des
jasmonates par les microorganismes du sol n’a à ce jour pas encore été démontrée. Les
bactéries sont capables de produire un large spectre de molécules ayant un effet direct sur les
mécanismes d’ISR. La flagelline, une des composantes majeures du flagelle des bactéries
flagellées, est un éliciteur bactérien des mécanismes de défense chez les plantes (Bakker et
al., 2007). Ces éliciteurs sont des molécules présentes à la surface des certains
microorganismes. Ces molécules présentent un motif qui a été conservé au cours de
l’évolution et qui est spécifique à ces organismes. A travers un mécanisme de reconnaissance
de ces molécules de petite taille, l’activation de la cascade signalétique qui en résulte va ainsi
induire le mécanisme d’ISR (Persello-Cartieaux et al., 2003; Bakker et al., 2007). Les
lipopolysaccharides sont d’autres éliciteurs bactériens. Présents à la surface de bactéries
phytopathogènes mais aussi de certaines PGPR (Persello-Cartieaux et al., 2003; Bakker et al.,
2007), ils ont également un rôle au niveau de l’activation des mécanismes de défense chez la
plante. Enfin, une régulation de ce mécanisme de défense induite (ISR) a également été mis
en évidence en réponse à divers composés organiques volatiles, permettant d’avoir une
réduction des symptômes associés à l’infection par le pathogène (Ping & Boland, 2004; Ryu
et al., 2004).
4.3.2. Autres molécules
Un autre mécanisme utilisé par les PGPR, et leurs conférant un rôle d’agent de bio-
contrôle, est la synthèse de composés agissant directement sur le pathogène ou bien en leur
permettant d’entrer en compétition avec ce dernier. Parmi le spectre des molécules pouvant
être synthétisées on peut retenir les sidérophores. Ces molécules sont capables de former des
complexes avec le fer contenu dans le sol, principalement les ions Fe3+, créant une
compétition avec certains organismes phytopathogènes pour cette ressource (Bakker et al.,
2007; Hayat et al., 2010). Les synthèses de composés antibiotiques ou antifongiques ont
tel-0
0804
633,
ver
sion
1 -
26 M
ar 2
013
Synthèse Bibliographique
26
également été reportées chez de nombreuses bactéries. Ces molécules, ne vont pas interagir
avec la plante mais directement avec l’agent phytopathogène (Persello-Cartieaux et al., 2003;
Bakker et al., 2007; Hayat et al., 2010).
4.3.3. Effet des vers de terre sur les mécanismes de défense de la plante
Excepté pour une étude (Elmer, 2009), l’interaction des vers de terre avec ces
populations de PGPR, capables de promouvoir la croissance des plantes, via la synthèse de
nombreux composés proches des hormones végétales reste à démontrer. Cependant, l’effet
des vers de terre, sur la réduction de la sévérité de nombreuses maladies, a été démontré à de
nombreuses reprises (Stephens et al., 1993; Stephens et al., 1994; Stephens & Davoren, 1995;
1997; Clapperton et al., 2001; Wolfarth et al., 2011). Leurs effets sur la réduction de certaines
maladies chez les plantes sont souvent associés à une meilleure nutrition des plantes ou
encore à un effet de prédation par le vers de terre. Cependant, ces hypothèses ne suffisent pas
dans certains cas à expliquer l’effet observé des vers sur la réduction de la maladie (Blouin et
al., 2005; Elmer, 2009). L’hypothèse d’une action combinée avec certains microorganismes
du sol afin de produire des composés antibiotiques et/ ou d’induire des réponses systémiques
de défense chez la plante est une hypothèse parcimonieuse pour expliquer l’effet des vers.
5. Problématique
Les vers de terre sont responsables de profonds changements des propriétés physiques,
chimiques et biochimiques du sol. Ces modifications font pour la plupart intervenir les
bactéries du sol, dont la diversité et la densité est fortement modifiée par les vers de terre. En
plus d’un impact direct sur le sol, toutes les structures biogéniques (galeries et turricules)
laissées par les vers de terre vont continuer à être actives bien après avoir été produites
(Brown et al., 2000) et vont être source d’hétérogénéité dans les sols. L’impact des vers de
terre et des microorganismes du sol sur la modification des propriétés physiques et chimiques
du sol a été déjà largement étudié. Inversement, l’impact des vers de terre sur les propriétés
biochimiques du sol reste à ce jour faiblement documenté. Pourtant, ces molécules sont des
éléments déterminants pour la physiologie des plantes.
tel-0
0804
633,
ver
sion
1 -
26 M
ar 2
013
Synthèse Bibliographique
27
L’importance de la production de molécules signal par les microorganismes du sol et
de leur action sur les plantes a depuis longtemps été mise en évidence. Cependant, l’effet des
vers de terre sur la production de ces molécules demeure quasi inconnu malgré
l’omniprésence des vers de terre dans les sols. A ce jour, une des seules pistes suggérant une
action des vers de terre au niveau de la production de molécules signal est l’isolement d’une
hormone végétale (l’acide indole acétique, une des formes de l’auxine) dans des substances
humiques.
L’objectif de ce travail a été d’étudier l’implication dees molécules signal produites en
présence de vers de terre tout en évitant que d’autres mécanismes ne puissent être
responsables des effets observés (voir Synthèse bibliographique). Ceci va nous permettre de
déterminer si les molécules signal produites dans le sol à un certain rythme, résultant en une
concentration donnée, sont capables d’avoir un impact significatif sur la croissance des
plantes. Un autre objectif de ce travail a été de quantifier et d’étudier la façon dont la plante
s’adapte à la présence de vers de terre. Par cette approche en immersion dans les mécanismes
physiologiques de la plante, nous comptons à la fois apporter des informations sur les
mécanismes fins impliqués dans la réponse de la plante, et confirmer nos hypothèses sur la
nature des mécanismes écologiques impliqués dans l’effet des vers sur les plantes.
(Darwin, 1881), (Minnich, 1977) (Bouché, 1975) (Gavrilov, 1963) tel-0
0804
633,
ver
sion
1 -
26 M
ar 2
013

Résultats et discussions
28
Résultats et discussions
tel-0
0804
633,
ver
sion
1 -
26 M
ar 2
013
Résultats et discussions
29
Chapitre 1 : Etude de la réponse morphologique et physiologique d’Arabidopsis thaliana à la présence du ver de terre
Aporrectodea caliginosa
tel-0
0804
633,
ver
sion
1 -
26 M
ar 2
013
Résultats et discussions
30
Avant propos
L’effet des vers de terre sur la plante a souvent été attribué à un mécanisme trophique
ou encore à une modification physique de l’environnement (Brown et al., 2004). Cependant,
ces deux mécanismes ne permettent pas d’expliquer à eux seuls l’effet observé des vers de
terre lors de certaines études (Blouin et al., 2006; Blouin et al., 2007b; Laossi et al., 2010).
Une hypothèse parcimonieuse afin d’expliquer ces effets serait l’implication de molécules
signal dont la quantité dans les sols semble modulée par les vers de terre (Tomati et al., 1988;
Muscolo et al., 1998; Canellas et al., 2002; Canellas et al., 2011). Ces molécules signal, vont
interagir avec les voies de signalisation hormonales des plantes. De cette interaction va
résulter une modification profonde de la croissance et de la physiologie des plantes, même si
ces molécules sont produites à de faibles concentrations. Cependant, l’implication de ces
molécules signal comme mécanisme impliqué dans l’effet des vers de terre sur la croissance
des plantes reste à démontrer par un isolement du facteur « ver de terre », en conditions de
laboratoire. Une analyse originale permettant d’obtenir de nouvelles informations sur ce
mécanisme consiste à utiliser les outils développés en sciences du végétal afin de caractériser
l’état physiologique de la plante pour se renseigner sur les mécanismes écologiques qui
l’influence.
Dans une première étude, un turricule (déjéction de vers de terre) a été introduit dans
un dispositif de culture in vitro. Les molécules ayant diffusé du turricule vers le gel d’agar ont
eu un impact négatif sur la croissance d’Oryza sativa et positif sur la croissance de Lolium
perenne. Dans une deuxième étude, Arabidopsis thaliana col-0 ou ayant subit une mutation de
deux gènes impliqués dans le transport de l’auxine (AUX1 et AXR4) a été cultivée en présence
de vers de terre. Ce double mutant aux1-7 ; axr4-2, présentant un phénotype nain dans les
substrats de culture classiques, a été caractérisé comme retrouvant un phénotype normal dans
un milieu contenant de l’auxine (Hobbie & Estelle, 1995). Dans notre expérience, ce double
mutant présente un phénotype nain en absence de vers de terre, tandis que son phénotype est
identique à celui de la plante sauvage en présence de vers de terre. Ces résultats suggèrent une
production de molécules signal en présence des vers de terre. Ces molécules signal semblant
interagir avec la voie de signalisation des auxines.
Enfin, une étude du transcriptome d’Arabidopsis thaliana en présence de vers de terre
a été réalisée. Les résultats de cette analyse montrent que les vers de terre sont responsables
tel-0
0804
633,
ver
sion
1 -
26 M
ar 2
013
de l’induction de nombreux gènes impliqués dans les mécanismes
mécanismes de défense sont sous contrôle de deux hormones végétales, les jasmonates et
l’éthylène. Ce mécanisme implique l’induction de résistance systémique (ISR) par la
reconnaissance par la plante de certaines populations d
meilleure réactivité et résistance face à des stress d’origine biotique. De plus, cette analyse
transcriptomique présente de fortes similitudes avec d’autres analyses transcriptomiques ayant
étudié la réponse d’A. thaliana
résultats combinés apportent des arguments en faveur de l’implication d’un mécanisme
hormonal pour expliquer l’effet des vers de terre sur les plantes. Ce mécanisme hormonal
étant analogue de celui rencontré avec les PGPR semble suggérer que les vers de terre
agissent sur la plante via l’activation de PGPR.
Cette étude a fait l’objet d’un article qui a été soumis à PloS One où il a été accepté
pour publication.
Figure 9 : Synthèse des résultats de l’effet du vers de terre des plantes. Le mécanisme à l’origine de l’effet des vers de terre semble impliquer une émission de molécules signal dans la rhizosphère des plantes. Cracinaire vont interagir avec des voies de signalisation hormonale sous contrôle de l’auxine et de l’association jasmonate/éthylène afin d’influencer de manière positive (a) la croissance et (b) le mécanisme de résistance systémique ISR respectivement. Cependant, des effets négatifs sur la croissance d’A.thaliana col-0 ont été observés. Ces effets seraient dus à une trop grande concentration de ces molécules signal dans la rhizosphère conduisant àces résultats présentent une forte analogie avec les mécanismes de promotion de la croissance des plantes par les populations de bactéries PGPR (1) suggérant un impact des vers de terrebactéries.
Résultats et discussions
de l’induction de nombreux gènes impliqués dans les mécanismes de défense de la plante. Ces
mécanismes de défense sont sous contrôle de deux hormones végétales, les jasmonates et
l’éthylène. Ce mécanisme implique l’induction de résistance systémique (ISR) par la
reconnaissance par la plante de certaines populations de PGPR. Ceci confère à la plante une
meilleure réactivité et résistance face à des stress d’origine biotique. De plus, cette analyse
transcriptomique présente de fortes similitudes avec d’autres analyses transcriptomiques ayant
ana à la présence de bactéries promotrices de la croissance. Ces
résultats combinés apportent des arguments en faveur de l’implication d’un mécanisme
hormonal pour expliquer l’effet des vers de terre sur les plantes. Ce mécanisme hormonal
celui rencontré avec les PGPR semble suggérer que les vers de terre
agissent sur la plante via l’activation de PGPR.
Cette étude a fait l’objet d’un article qui a été soumis à PloS One où il a été accepté
: Synthèse des résultats de l’effet du vers de terre A. caliginosa sur la croissance et physiologie des plantes. Le mécanisme à l’origine de l’effet des vers de terre semble impliquer une émission de molécules signal dans la rhizosphère des plantes. Ces molécules pénétrant à l’intérieur du système racinaire vont interagir avec des voies de signalisation hormonale sous contrôle de l’auxine et de l’association jasmonate/éthylène afin d’influencer de manière positive (a) la croissance et (b) le mécanisme de résistance systémique ISR respectivement. Cependant, des effets négatifs sur la croissance d’
0 ont été observés. Ces effets seraient dus à une trop grande concentration de ces molécules signal dans la rhizosphère conduisant à (c) un effet inhibiteur sur la croissance de la plante. L’ensemble de ces résultats présentent une forte analogie avec les mécanismes de promotion de la croissance des plantes par les populations de bactéries PGPR (1) suggérant un impact des vers de terre
Résultats et discussions
31
de défense de la plante. Ces
mécanismes de défense sont sous contrôle de deux hormones végétales, les jasmonates et
l’éthylène. Ce mécanisme implique l’induction de résistance systémique (ISR) par la
e PGPR. Ceci confère à la plante une
meilleure réactivité et résistance face à des stress d’origine biotique. De plus, cette analyse
transcriptomique présente de fortes similitudes avec d’autres analyses transcriptomiques ayant
à la présence de bactéries promotrices de la croissance. Ces
résultats combinés apportent des arguments en faveur de l’implication d’un mécanisme
hormonal pour expliquer l’effet des vers de terre sur les plantes. Ce mécanisme hormonal
celui rencontré avec les PGPR semble suggérer que les vers de terre
Cette étude a fait l’objet d’un article qui a été soumis à PloS One où il a été accepté
sur la croissance et physiologie des plantes. Le mécanisme à l’origine de l’effet des vers de terre semble impliquer une émission de
es molécules pénétrant à l’intérieur du système racinaire vont interagir avec des voies de signalisation hormonale sous contrôle de l’auxine et de l’association jasmonate/éthylène afin d’influencer de manière positive (a) la croissance et (b) le mécanisme de résistance systémique ISR respectivement. Cependant, des effets négatifs sur la croissance d’O. sativa et
0 ont été observés. Ces effets seraient dus à une trop grande concentration de ces molécules un effet inhibiteur sur la croissance de la plante. L’ensemble de
ces résultats présentent une forte analogie avec les mécanismes de promotion de la croissance des plantes sur cette catégorie de
tel-0
0804
633,
ver
sion
1 -
26 M
ar 2
013
Résultats et discussions
32
Title
Signal molecules mediate the impact of the earthworm Aporrectodea caliginosa on growth,
development and defence of the plant Arabidopsis thaliana.
Authors
Ruben Puga-Freitas1, Sébastien Barot2, Ludivine Taconnat3, Jean-Pierre Renou3, Manuel
Blouin1*
Affiliations 1UMR Biogéochimie et Ecologie des Milieux Continentaux, Université Paris-Est Créteil,
Créteil, France 2UMR Biogéochimie et Ecologie des Milieux Continentaux, Institut de Recherche pour le
Développement, Ecole Normale Supérieure, Paris, France 3Unité de Recherche en Génomique Végétale, INRA/CNRS, Evry, France
*Corresponding author
Blouin Manuel
tel: +33 1 45 17 16 14
UMR Biogéochimie et Ecologie des Milieux Continentaux, Université Paris-Est, 61 avenue
du Général De Gaulle, 94010 Créteil cedex, France
tel-0
0804
633,
ver
sion
1 -
26 M
ar 2
013
Résultats et discussions
33
Abstract
Earthworms have generally a positive impact on plant growth, which is often
attributed to a trophic mechanism: namely, earthworm increase the release of mineral
nutrients from soil litter and organic matter. An alternative hypothesis has been proposed
since the discovery of a signal molecule (Indole Acetic Acid) in earthworm faeces. In this
study, we used methodologies developed in plant science to gain information on ecological
mechanisms involved in plant-earthowm interaction, by looking at plant response to
earthworm presence at a molecular level.
First, we looked at plant overall response to earthworm faeces in an in vitro device
where only signal molecules could have an effect on plant growth; we observed that
earthworms were inducing positive or negative effects on different plant species. Then, using
an Arabidopsis thaliana mutant with an impaired auxin transport, we demonstrated the
potential of earthworms to stimulate root growth and to revert the dwarf mutant phenotype.
Finally, we performed a comparative transcriptomic analysis of Arabidopsis thaliana in the
presence and absence of earthworms; we found that genes modulated in the presence of
earthworms are known to respond to biotic and abiotic stresses, or to the application of
exogenous hormones. A comparison of our results with other studies found in databases
revealed strong analogies with systemic resistance, induced by signal molecules emitted by
Plant Growth Promoting Rhizobacteria and/or elicitors emitted by non-virulent pathogens.
Signal molecules such as auxin and ethylene, which are considered as major in plant-
microorganisms interactions, can also be of prior importance to explain plant-
macroinvertebrates interactions. This could imply revisiting ecological theories which
generally stress on the role of trophic relationships.
tel-0
0804
633,
ver
sion
1 -
26 M
ar 2
013
Résultats et discussions
34
Introduction
Plants grow and evolve in close relation with soils and their inhabitants and have done
so for several hundred million years. Among soil organisms, earthworms constitute the most
abundant animal biomass in terrestrial ecosystems (Lavelle & Spain, 2001). Reviews of more
than 300 assays have revealed that earthworms increase plant growth in 70-80% of cases, with
a 56% increase in shoot biomass (Brown et al., 1999; Scheu, 2003). The common
interpretation of this positive effect is the increased rate of mineral nutrient release from soil
litter and organic matter in presence of earthworms. However, this does not provide any
satisfying interpretation for cases where earthworms induce a negative effect on plant growth
(Brown et al., 1999; Scheu, 2003), or when they promote an increased plant resistance to
parasites (Blouin et al., 2005; Wurst, 2010). Moreover, earthworms may still increase plant
growth even when the soil is supplied with nitrogen amounts higher than needed by the plant
(Blouin et al., 2006) and their effects do not necessarily decrease with soil fertility (Laossi et
al., 2010).
Alternative interpretations for earthworm effect on plant production have been
proposed (Scheu, 2003; Brown et al., 2004). Among other hypotheses, signal molecules that
mimic plant hormones could be responsible for earthworm impact. Numerous signal
molecules can be found in soil. The most widespread are compounds analogous to hormones
such as auxins, cytokinins, ethylene, gibberellins, jasmonic and salicylic acids (Frankenberger
& Arshad, 1995). All these molecules with a basic role in plant growth and development can
be synthesized by soil microorganisms. They can have different impact on plants. For
example, auxins and cytokinins are said to increase plant growth through the modification of
plant morphogenesis, whereas ethylene, salicilic and jasmonic acids induce a resistance to
pathogens (Ping & Boland, 2004).
These molecules can be produced in soil by microorganisms such as the Plant Growth
Promoting Rhizobacteria (PGPR) and may enter into the roots by diffusion or active
transporters; although positive effects of PGPR on plants are common, negative effects have
also been reported (Persello-Cartieaux et al., 2003). These bacteria either induce direct
changes in plant development thanks to morphogenesis modification, or indirect changes by
the biocontrol of plant pathogens or parasites (Bashan & Holguin, 1998; Persello-Cartieaux et
al., 2003). Transcriptome analyses of Arabidopsis thaliana have shown that PGPR may
tel-0
0804
633,
ver
sion
1 -
26 M
ar 2
013
Résultats et discussions
35
modify the expression of auxin-responsive genes, as well as genes involved in morphogenesis
and defence mechanisms (Cartieaux et al., 2003; Verhagen et al., 2004; Wang et al., 2005).
Changes in plant morphogenesis and a higher resistance to pathogens have also been
observed in the presence of earthworms (Blouin et al., 2005; Jana et al., 2010) or in the
presence of the compost they produce (Arancon et al., 2003; Zaller, 2007). It is acknowledged
that humic acids may display hormone-like activity on plant physiology, especially auxin-like
effects (Nardi et al., 2002). This effect was also observed with humic substances derived from
earthworm faeces (Canellas et al., 2002; Nardi et al., 2002). In addition, indole acetic acid
(IAA), which belongs to the auxin family, has already been isolated from humic substances
(Muscolo et al., 1998), as well as earthworm compost (Canellas et al., 2002). The origin of
these auxin-like compounds is still not well documented, notably due to the difficulty of
retrieving and quantifying auxin-like compounds from a natural soil. Whether signal
molecules, especially IAA, can be responsible for the positive effect of earthworms on plant
growth remains an open issue.
In this work, we used recently developed tools to investigate whether signal molecules
could be responsible for earthworm effects on plant growth and development. In this respect,
we set up in vitro experiments to investigate the potential of earthworm casts to induce
significant effects on plant growth via signal molecules. We then focussed on the involvement
of molecules related to the auxin signaling pathway by using an Arabidopsis mutant with
impaired auxin transport. We finally analyzed the transcriptome of A. thaliana to identify the
main molecular pathways modified in the presence of earthworms and to determine whether
these modifications are likely to be caused by signal molecules.
tel-0
0804
633,
ver
sion
1 -
26 M
ar 2
013
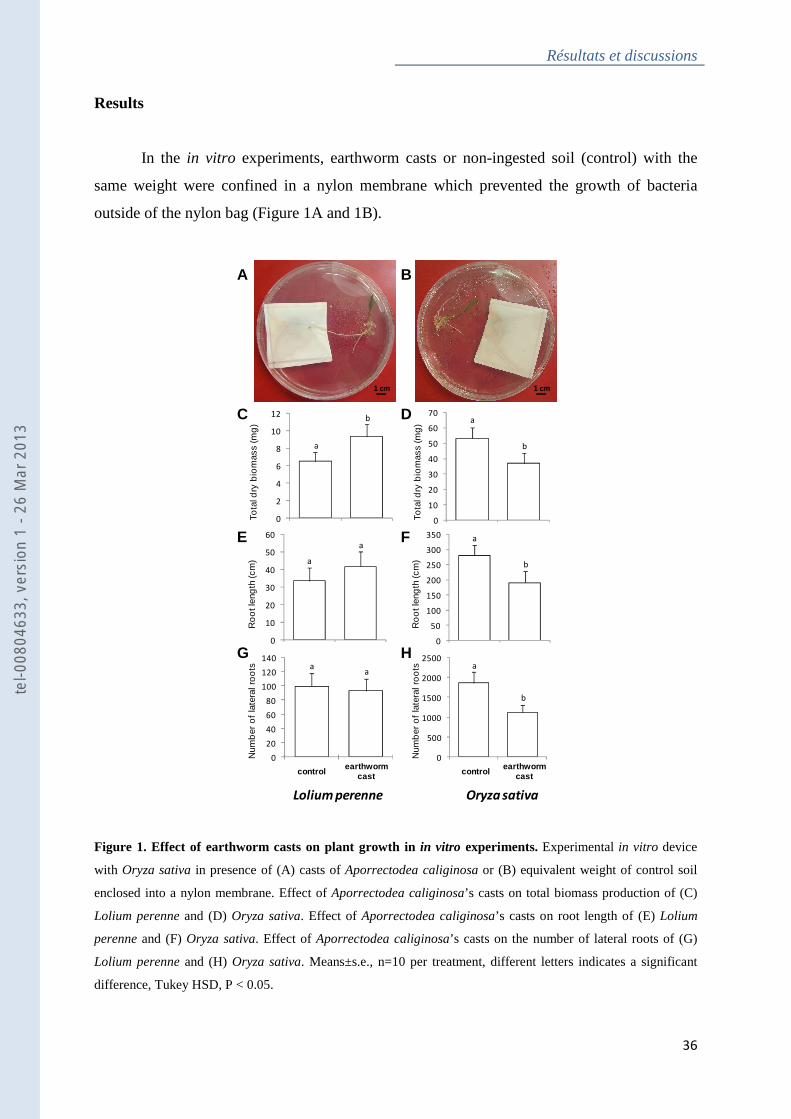
Résultats et discussions
36
Results
In the in vitro experiments, earthworm casts or non-ingested soil (control) with the
same weight were confined in a nylon membrane which prevented the growth of bacteria
outside of the nylon bag (Figure 1A and 1B).
Figure 1. Effect of earthworm casts on plant growth in in vitro experiments. Experimental in vitro device
with Oryza sativa in presence of (A) casts of Aporrectodea caliginosa or (B) equivalent weight of control soil
enclosed into a nylon membrane. Effect of Aporrectodea caliginosa’s casts on total biomass production of (C)
Lolium perenne and (D) Oryza sativa. Effect of Aporrectodea caliginosa’s casts on root length of (E) Lolium
perenne and (F) Oryza sativa. Effect of Aporrectodea caliginosa’s casts on the number of lateral roots of (G)
Lolium perenne and (H) Oryza sativa. Means±s.e., n=10 per treatment, different letters indicates a significant
difference, Tukey HSD, P < 0.05.
a
b
0
500
1000
1500
2000
2500
Num
ber
of
late
ral r
oo
ts
a
b
0
50
100
150
200
250
300
350
Ro
otl
eng
th(c
m)
a
b
0
10
20
30
40
50
60
70To
tal d
ry b
iom
ass
(mg
)
controlearthworm
cast
aa
0
20
40
60
80
100
120
140
Num
ber
of
late
ralr
oo
ts
a
a
0
10
20
30
40
50
60
Ro
otl
eng
th(c
m)
a
b
0
2
4
6
8
10
12
Tota
l dry
bio
mas
s(m
g)
controlearthworm
cast
1 cm1 cm
A B
C
E
H
F
G
D
Loliumperenne Oryza sativa
tel-0
0804
633,
ver
sion
1 -
26 M
ar 2
013
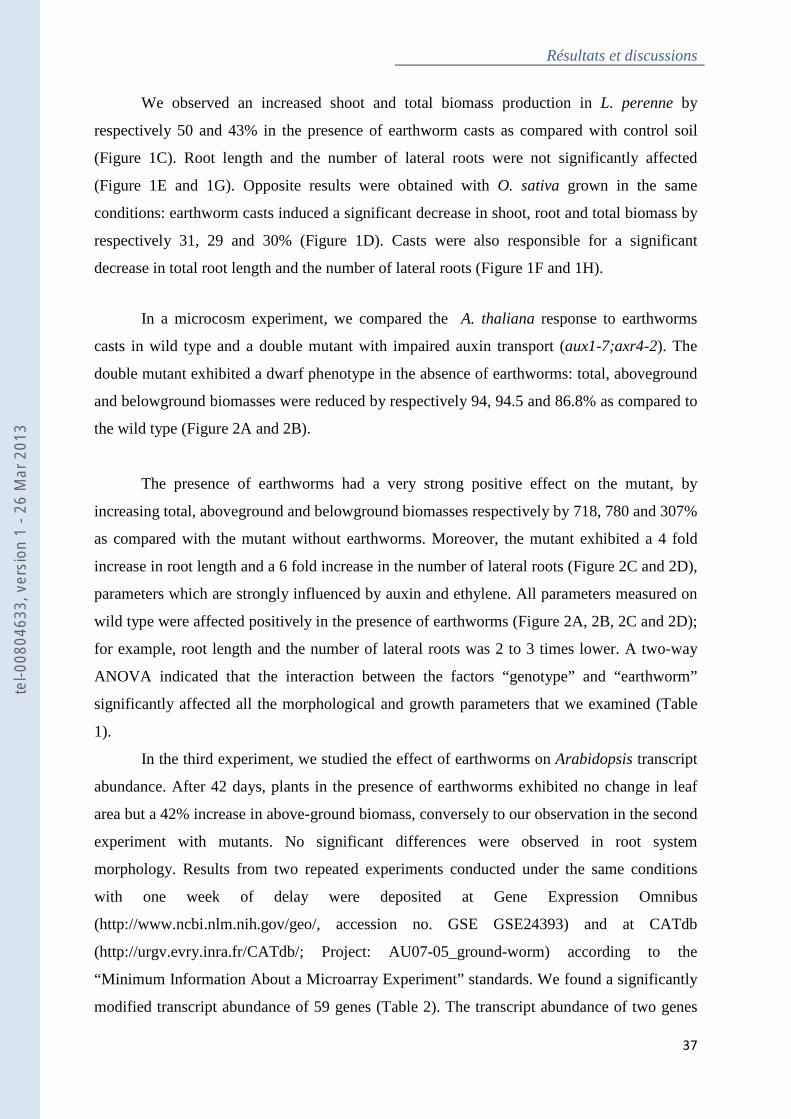
Résultats et discussions
37
We observed an increased shoot and total biomass production in L. perenne by
respectively 50 and 43% in the presence of earthworm casts as compared with control soil
(Figure 1C). Root length and the number of lateral roots were not significantly affected
(Figure 1E and 1G). Opposite results were obtained with O. sativa grown in the same
conditions: earthworm casts induced a significant decrease in shoot, root and total biomass by
respectively 31, 29 and 30% (Figure 1D). Casts were also responsible for a significant
decrease in total root length and the number of lateral roots (Figure 1F and 1H).
In a microcosm experiment, we compared the A. thaliana response to earthworms
casts in wild type and a double mutant with impaired auxin transport (aux1-7;axr4-2). The
double mutant exhibited a dwarf phenotype in the absence of earthworms: total, aboveground
and belowground biomasses were reduced by respectively 94, 94.5 and 86.8% as compared to
the wild type (Figure 2A and 2B).
The presence of earthworms had a very strong positive effect on the mutant, by
increasing total, aboveground and belowground biomasses respectively by 718, 780 and 307%
as compared with the mutant without earthworms. Moreover, the mutant exhibited a 4 fold
increase in root length and a 6 fold increase in the number of lateral roots (Figure 2C and 2D),
parameters which are strongly influenced by auxin and ethylene. All parameters measured on
wild type were affected positively in the presence of earthworms (Figure 2A, 2B, 2C and 2D);
for example, root length and the number of lateral roots was 2 to 3 times lower. A two-way
ANOVA indicated that the interaction between the factors “genotype” and “earthworm”
significantly affected all the morphological and growth parameters that we examined (Table
1).
In the third experiment, we studied the effect of earthworms on Arabidopsis transcript
abundance. After 42 days, plants in the presence of earthworms exhibited no change in leaf
area but a 42% increase in above-ground biomass, conversely to our observation in the second
experiment with mutants. No significant differences were observed in root system
morphology. Results from two repeated experiments conducted under the same conditions
with one week of delay were deposited at Gene Expression Omnibus
(http://www.ncbi.nlm.nih.gov/geo/, accession no. GSE GSE24393) and at CATdb
(http://urgv.evry.inra.fr/CATdb/; Project: AU07-05_ground-worm) according to the
“Minimum Information About a Microarray Experiment” standards. We found a significantly
modified transcript abundance of 59 genes (Table 2). The transcript abundance of two genes
tel-0
0804
633,
ver
sion
1 -
26 M
ar 2
013
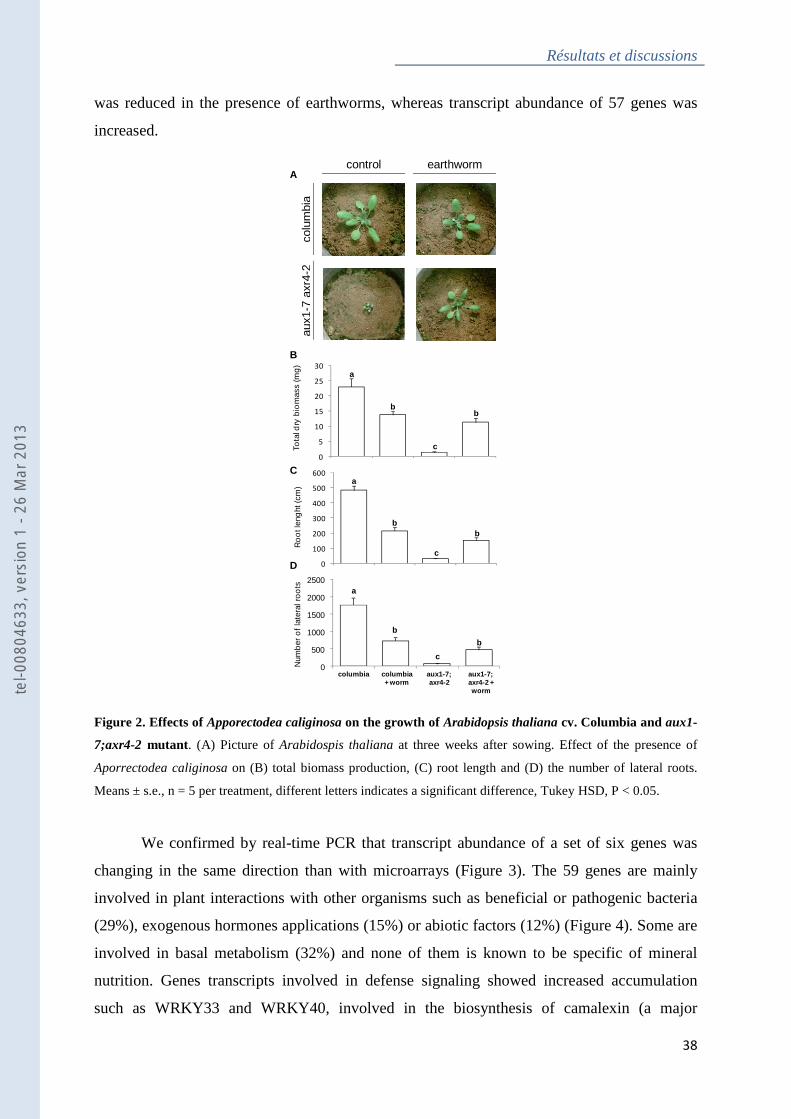
Résultats et discussions
38
was reduced in the presence of earthworms, whereas transcript abundance of 57 genes was
increased.
Figure 2. Effects of Apporectodea caliginosa on the growth of Arabidopsis thaliana cv. Columbia and aux1-
7;axr4-2 mutant. (A) Picture of Arabidospis thaliana at three weeks after sowing. Effect of the presence of
Aporrectodea caliginosa on (B) total biomass production, (C) root length and (D) the number of lateral roots.
Means ± s.e., n = 5 per treatment, different letters indicates a significant difference, Tukey HSD, P < 0.05.
We confirmed by real-time PCR that transcript abundance of a set of six genes was
changing in the same direction than with microarrays (Figure 3). The 59 genes are mainly
involved in plant interactions with other organisms such as beneficial or pathogenic bacteria
(29%), exogenous hormones applications (15%) or abiotic factors (12%) (Figure 4). Some are
involved in basal metabolism (32%) and none of them is known to be specific of mineral
nutrition. Genes transcripts involved in defense signaling showed increased accumulation
such as WRKY33 and WRKY40, involved in the biosynthesis of camalexin (a major
A
B
C
D
a
b
c
b
0
500
1000
1500
2000
2500
Num
ber
of
late
ral r
oo
ts
a
b
c
b
0
100
200
300
400
500
600
Ro
ot l
eng
ht(c
m)
a
b
c
b
0
5
10
15
20
25
30
Tota
l dry
bio
mas
s (m
g)
columbia columbia+ worm
aux1-7; axr4-2
aux1-7; axr4-2 + worm
control earthworm
colu
mbi
aau
x1-7
axr
4-2
tel-0
0804
633,
ver
sion
1 -
26 M
ar 2
013
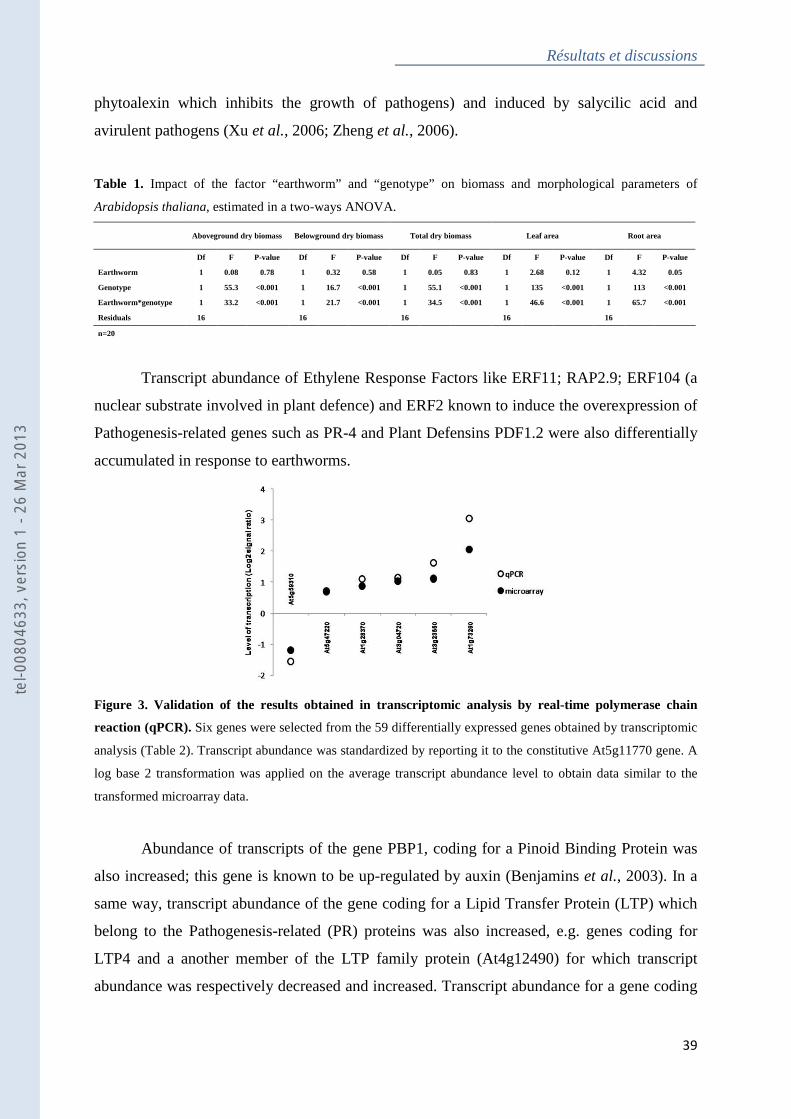
Résultats et discussions
39
phytoalexin which inhibits the growth of pathogens) and induced by salycilic acid and
avirulent pathogens (Xu et al., 2006; Zheng et al., 2006).
Table 1. Impact of the factor “earthworm” and “genotype” on biomass and morphological parameters of
Arabidopsis thaliana, estimated in a two-ways ANOVA.
Aboveground dry biomass Belowground dry biomass Total dry biomass Leaf area Root area
Df F P-value Df F P-value Df F P-value Df F P-value Df F P-value
Earthworm 1 0.08 0.78 1 0.32 0.58 1 0.05 0.83 1 2.68 0.12 1 4.32 0.05
Genotype 1 55.3 <0.001 1 16.7 <0.001 1 55.1 <0.001 1 135 <0.001 1 113 <0.001
Earthworm*genotype 1 33.2 <0.001 1 21.7 <0.001 1 34.5 <0.001 1 46.6 <0.001 1 65.7 <0.001
Residuals 16
16
16
16
16
n=20
Transcript abundance of Ethylene Response Factors like ERF11; RAP2.9; ERF104 (a
nuclear substrate involved in plant defence) and ERF2 known to induce the overexpression of
Pathogenesis-related genes such as PR-4 and Plant Defensins PDF1.2 were also differentially
accumulated in response to earthworms.
Figure 3. Validation of the results obtained in transcriptomic analysis by real-time polymerase chain
reaction (qPCR). Six genes were selected from the 59 differentially expressed genes obtained by transcriptomic
analysis (Table 2). Transcript abundance was standardized by reporting it to the constitutive At5g11770 gene. A
log base 2 transformation was applied on the average transcript abundance level to obtain data similar to the
transformed microarray data.
Abundance of transcripts of the gene PBP1, coding for a Pinoid Binding Protein was
also increased; this gene is known to be up-regulated by auxin (Benjamins et al., 2003). In a
same way, transcript abundance of the gene coding for a Lipid Transfer Protein (LTP) which
belong to the Pathogenesis-related (PR) proteins was also increased, e.g. genes coding for
LTP4 and a another member of the LTP family protein (At4g12490) for which transcript
abundance was respectively decreased and increased. Transcript abundance for a gene coding
tel-0
0804
633,
ver
sion
1 -
26 M
ar 2
013
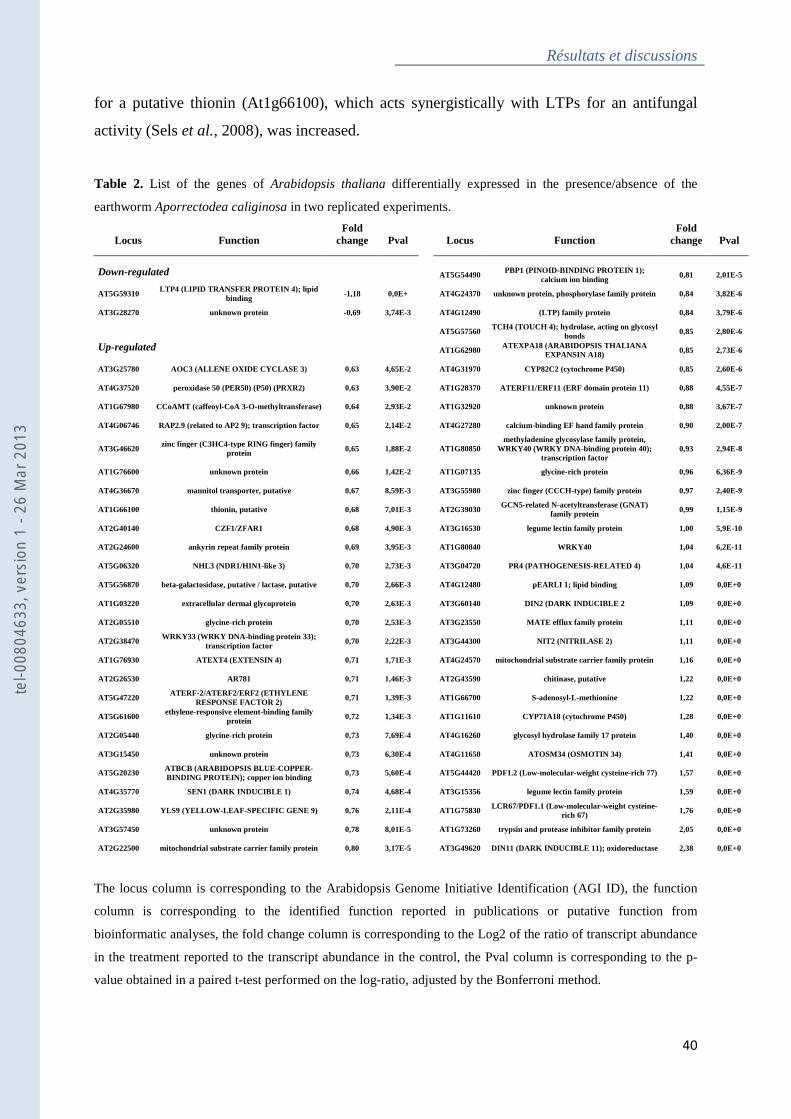
Résultats et discussions
40
for a putative thionin (At1g66100), which acts synergistically with LTPs for an antifungal
activity (Sels et al., 2008), was increased.
Table 2. List of the genes of Arabidopsis thaliana differentially expressed in the presence/absence of the
earthworm Aporrectodea caliginosa in two replicated experiments.
Locus Function Fold
change Pval
Locus Function Fold
change Pval
Down-regulated
AT5G54490 PBP1 (PINOID-BINDING PROTEIN 1);
calcium ion binding 0,81 2,01E-5
AT5G59310 LTP4 (LIPID TRANSFER PROTEIN 4); lipid
binding -1,18 0,0E+
AT4G24370 unknown protein, phosphorylase family protein 0,84 3,82E-6
AT3G28270 unknown protein -0,69 3,74E-3
AT4G12490 (LTP) family protein 0,84 3,79E-6
AT5G57560 TCH4 (TOUCH 4); hydrolase, acting on glycosyl
bonds 0,85 2,80E-6
Up-regulated
AT1G62980 ATEXPA18 (ARABIDOPSIS THALIANA
EXPANSIN A18) 0,85 2,73E-6
AT3G25780 AOC3 (ALLENE OXIDE CYCLASE 3) 0,63 4,65E-2
AT4G31970 CYP82C2 (cytochrome P450) 0,85 2,60E-6
AT4G37520 peroxidase 50 (PER50) (P50) (PRXR2) 0,63 3,90E-2
AT1G28370 ATERF11/ERF11 (ERF domain protein 11) 0,88 4,55E-7
AT1G67980 CCoAMT (caffeoyl-CoA 3-O-methyltransferase) 0,64 2,93E-2
AT1G32920 unknown protein 0,88 3,67E-7
AT4G06746 RAP2.9 (related to AP2 9); transcription factor 0,65 2,14E-2
AT4G27280 calcium-binding EF hand family protein 0,90 2,00E-7
AT3G46620 zinc finger (C3HC4-type RING finger) family
protein 0,65 1,88E-2
AT1G80850 methyladenine glycosylase family protein,
WRKY40 (WRKY DNA-binding protein 40); transcription factor
0,93 2,94E-8
AT1G76600 unknown protein 0,66 1,42E-2
AT1G07135 glycine-rich protein 0,96 6,36E-9
AT4G36670 mannitol transporter, putative 0,67 8,59E-3
AT3G55980 zinc finger (CCCH-type) family protein 0,97 2,40E-9
AT1G66100 thionin, putative 0,68 7,01E-3
AT2G39030 GCN5-related N-acetyltransferase (GNAT)
family protein 0,99 1,15E-9
AT2G40140 CZF1/ZFAR1 0,68 4,90E-3
AT3G16530 legume lectin family protein 1,00 5,9E-10
AT2G24600 ankyrin repeat family protein 0,69 3,95E-3
AT1G80840 WRKY40 1,04 6,2E-11
AT5G06320 NHL3 (NDR1/HIN1-like 3) 0,70 2,73E-3
AT3G04720 PR4 (PATHOGENESIS-RELATED 4) 1,04 4,6E-11
AT5G56870 beta-galactosidase, putative / lactase, putative 0,70 2,66E-3
AT4G12480 pEARLI 1; lipid binding 1,09 0,0E+0
AT1G03220 extracellular dermal glycoprotein 0,70 2,63E-3
AT3G60140 DIN2 (DARK INDUCIBLE 2 1,09 0,0E+0
AT2G05510 glycine-rich protein 0,70 2,53E-3
AT3G23550 MATE efflux family protein 1,11 0,0E+0
AT2G38470 WRKY33 (WRKY DNA-binding protein 33);
transcription factor 0,70 2,22E-3
AT3G44300 NIT2 (NITRILASE 2) 1,11 0,0E+0
AT1G76930 ATEXT4 (EXTENSIN 4) 0,71 1,71E-3
AT4G24570 mitochondrial substrate carrier family protein 1,16 0,0E+0
AT2G26530 AR781 0,71 1,46E-3
AT2G43590 chitinase, putative 1,22 0,0E+0
AT5G47220 ATERF-2/ATERF2/ERF2 (ETHYLENE
RESPONSE FACTOR 2) 0,71 1,39E-3
AT1G66700 S-adenosyl-L-methionine 1,22 0,0E+0
AT5G61600 ethylene-responsive element-binding family
protein 0,72 1,34E-3
AT1G11610 CYP71A18 (cytochrome P450) 1,28 0,0E+0
AT2G05440 glycine-rich protein 0,73 7,69E-4
AT4G16260 glycosyl hydrolase family 17 protein 1,40 0,0E+0
AT3G15450 unknown protein 0,73 6,30E-4
AT4G11650 ATOSM34 (OSMOTIN 34) 1,41 0,0E+0
AT5G20230 ATBCB (ARABIDOPSIS BLUE-COPPER-BINDING PROTEIN); copper ion binding
0,73 5,60E-4
AT5G44420 PDF1.2 (Low-molecular-weight cysteine-rich 77) 1,57 0,0E+0
AT4G35770 SEN1 (DARK INDUCIBLE 1) 0,74 4,68E-4
AT3G15356 legume lectin family protein 1,59 0,0E+0
AT2G35980 YLS9 (YELLOW-LEAF-SPECIFIC GENE 9) 0,76 2,11E-4
AT1G75830 LCR67/PDF1.1 (Low-molecular-weight cysteine-rich 67)
1,76 0,0E+0
AT3G57450 unknown protein 0,78 8,01E-5
AT1G73260 trypsin and protease inhibitor family protein 2,05 0,0E+0
AT2G22500 mitochondrial substrate carrier family protein 0,80 3,17E-5
AT3G49620 DIN11 (DARK INDUCIBLE 11); oxidoreductase 2,38 0,0E+0
The locus column is corresponding to the Arabidopsis Genome Initiative Identification (AGI ID), the function
column is corresponding to the identified function reported in publications or putative function from
bioinformatic analyses, the fold change column is corresponding to the Log2 of the ratio of transcript abundance
in the treatment reported to the transcript abundance in the control, the Pval column is corresponding to the p-
value obtained in a paired t-test performed on the log-ratio, adjusted by the Bonferroni method.
tel-0
0804
633,
ver
sion
1 -
26 M
ar 2
013
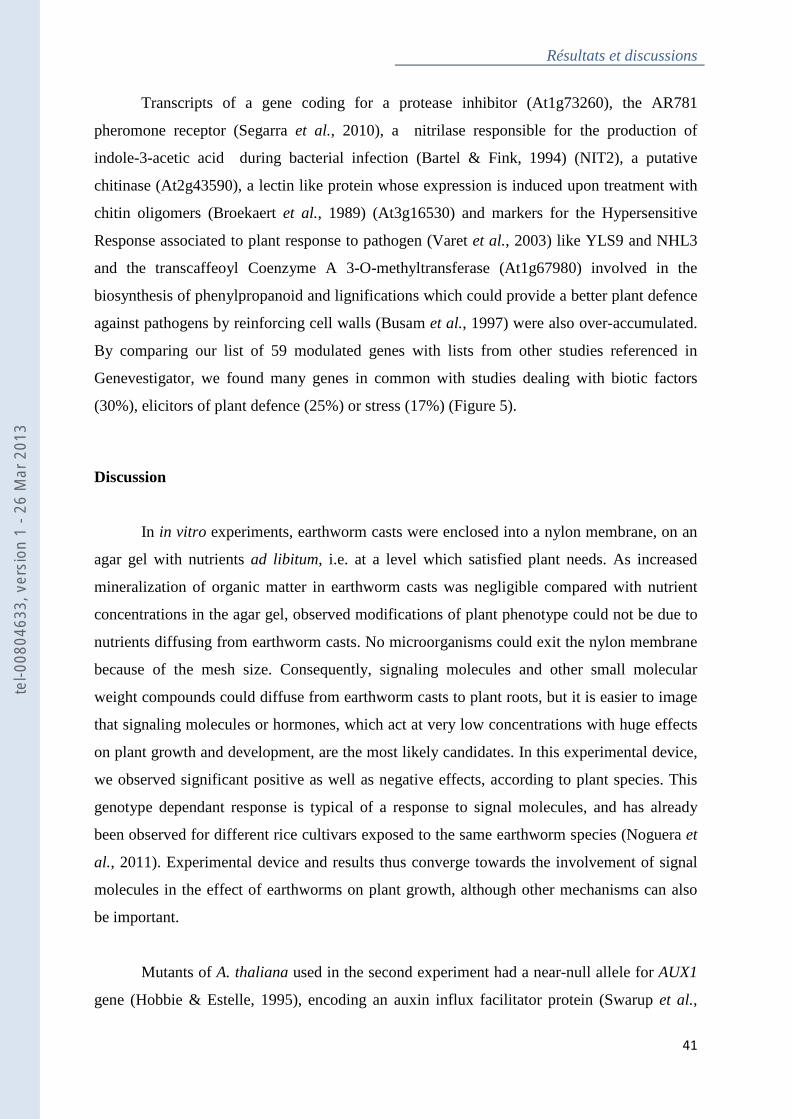
Résultats et discussions
41
Transcripts of a gene coding for a protease inhibitor (At1g73260), the AR781
pheromone receptor (Segarra et al., 2010), a nitrilase responsible for the production of
indole-3-acetic acid during bacterial infection (Bartel & Fink, 1994) (NIT2), a putative
chitinase (At2g43590), a lectin like protein whose expression is induced upon treatment with
chitin oligomers (Broekaert et al., 1989) (At3g16530) and markers for the Hypersensitive
Response associated to plant response to pathogen (Varet et al., 2003) like YLS9 and NHL3
and the transcaffeoyl Coenzyme A 3-O-methyltransferase (At1g67980) involved in the
biosynthesis of phenylpropanoid and lignifications which could provide a better plant defence
against pathogens by reinforcing cell walls (Busam et al., 1997) were also over-accumulated.
By comparing our list of 59 modulated genes with lists from other studies referenced in
Genevestigator, we found many genes in common with studies dealing with biotic factors
(30%), elicitors of plant defence (25%) or stress (17%) (Figure 5).
Discussion
In in vitro experiments, earthworm casts were enclosed into a nylon membrane, on an
agar gel with nutrients ad libitum, i.e. at a level which satisfied plant needs. As increased
mineralization of organic matter in earthworm casts was negligible compared with nutrient
concentrations in the agar gel, observed modifications of plant phenotype could not be due to
nutrients diffusing from earthworm casts. No microorganisms could exit the nylon membrane
because of the mesh size. Consequently, signaling molecules and other small molecular
weight compounds could diffuse from earthworm casts to plant roots, but it is easier to image
that signaling molecules or hormones, which act at very low concentrations with huge effects
on plant growth and development, are the most likely candidates. In this experimental device,
we observed significant positive as well as negative effects, according to plant species. This
genotype dependant response is typical of a response to signal molecules, and has already
been observed for different rice cultivars exposed to the same earthworm species (Noguera et
al., 2011). Experimental device and results thus converge towards the involvement of signal
molecules in the effect of earthworms on plant growth, although other mechanisms can also
be important.
Mutants of A. thaliana used in the second experiment had a near-null allele for AUX1
gene (Hobbie & Estelle, 1995), encoding an auxin influx facilitator protein (Swarup et al.,
tel-0
0804
633,
ver
sion
1 -
26 M
ar 2
013
2004), and a null allele for AXR4
localization of the protein encoded by
a slight auxin production in young roots and an auxin discharge from mature leaves in the
phloem (Taiz & Zeiger, 2010
root growth, decreased primary production and dwarf phenotype. The negative effect of
earthworms on the wild type and their reversion of the mutant phenotype could be due to
either auxin-like compounds, or ethylene, o
hormones. Since this dwarf mutant phenotype is known to be reverted by exogenous auxin
application (Hobbie & Estelle, 1995
humic substances (Muscolo
earthworms could be responsible for an higher exogenous auxin concentration in soil. This
auxin could enter root cells, increase intracellular concentra
of the double mutant. We speculate that in the absence of earthworms, the mutant had too low
an auxin concentration in root cells to exhibit the same growth rate as the wild type. In the
presence of earthworms, additiona
root cells, which could be responsible for a higher growth rate (Figure 6). Conversely, auxin
elevated above wild-type endogenous levels could lead to an inhibitory effect. This is
corroborated by the fact that earthworms stimulate cultivable IAA producing bacteria
Freitas et al., 2012), which could have positive or negative effects on plant growth according
to their IAA production level (
Figure 4. Functions of the 59 Arabidopsis thaliana
earthworms. Functional classification was established accordin
publications.
Résultats et discussions
AXR4 gene (Hobbie & Estelle, 1995), encoding for the polar
localization of the protein encoded by AUX1 (Dharmasiri et al., 2006; Hobbie, 2006
a slight auxin production in young roots and an auxin discharge from mature leaves in the
Taiz & Zeiger, 2010), impaired auxin transport in mutant is responsible for altered
root growth, decreased primary production and dwarf phenotype. The negative effect of
earthworms on the wild type and their reversion of the mutant phenotype could be due to
like compounds, or ethylene, or molecules related to the pathway of one of these
hormones. Since this dwarf mutant phenotype is known to be reverted by exogenous auxin
Hobbie & Estelle, 1995) and auxin-like compounds have been isolated from
et al., 1998) or earthworm compost (Canellas
earthworms could be responsible for an higher exogenous auxin concentration in soil. This
auxin could enter root cells, increase intracellular concentration, and restore altered phenotype
of the double mutant. We speculate that in the absence of earthworms, the mutant had too low
an auxin concentration in root cells to exhibit the same growth rate as the wild type. In the
presence of earthworms, additional exogenous auxin supply increased auxin concentration in
root cells, which could be responsible for a higher growth rate (Figure 6). Conversely, auxin
type endogenous levels could lead to an inhibitory effect. This is
he fact that earthworms stimulate cultivable IAA producing bacteria
, which could have positive or negative effects on plant growth according
(Nehl et al., 1996; Barazani & Friedman, 1999
Arabidopsis thaliana genes differentially expressed in the presence of
Functional classification was established according to http://www.arabidopsis.org and the related
Résultats et discussions
42
, encoding for the polar
Hobbie, 2006). Despite
a slight auxin production in young roots and an auxin discharge from mature leaves in the
t in mutant is responsible for altered
root growth, decreased primary production and dwarf phenotype. The negative effect of
earthworms on the wild type and their reversion of the mutant phenotype could be due to
r molecules related to the pathway of one of these
hormones. Since this dwarf mutant phenotype is known to be reverted by exogenous auxin
like compounds have been isolated from
Canellas et al., 2002),
earthworms could be responsible for an higher exogenous auxin concentration in soil. This
tion, and restore altered phenotype
of the double mutant. We speculate that in the absence of earthworms, the mutant had too low
an auxin concentration in root cells to exhibit the same growth rate as the wild type. In the
l exogenous auxin supply increased auxin concentration in
root cells, which could be responsible for a higher growth rate (Figure 6). Conversely, auxin
type endogenous levels could lead to an inhibitory effect. This is
he fact that earthworms stimulate cultivable IAA producing bacteria (Puga-
, which could have positive or negative effects on plant growth according
Barazani & Friedman, 1999).
genes differentially expressed in the presence of
g to http://www.arabidopsis.org and the related
tel-0
0804
633,
ver
sion
1 -
26 M
ar 2
013
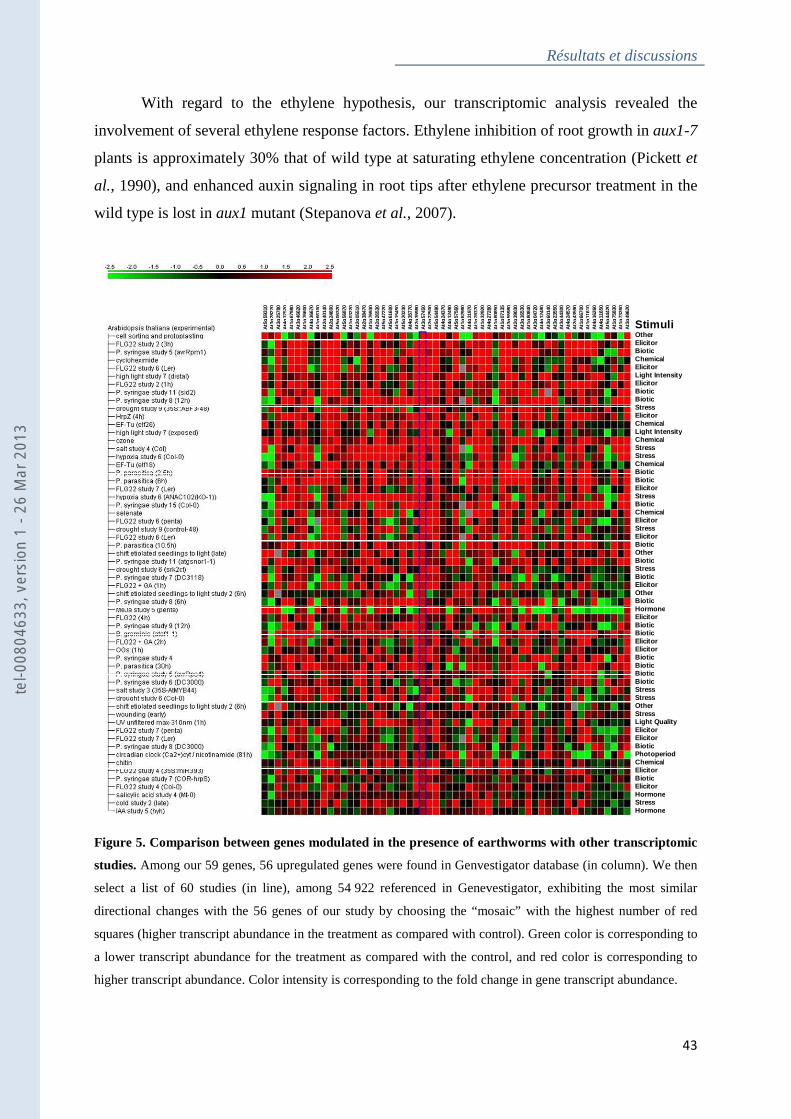
Résultats et discussions
43
With regard to the ethylene hypothesis, our transcriptomic analysis revealed the
involvement of several ethylene response factors. Ethylene inhibition of root growth in aux1-7
plants is approximately 30% that of wild type at saturating ethylene concentration (Pickett et
al., 1990), and enhanced auxin signaling in root tips after ethylene precursor treatment in the
wild type is lost in aux1 mutant (Stepanova et al., 2007).
Figure 5. Comparison between genes modulated in the presence of earthworms with other transcriptomic
studies. Among our 59 genes, 56 upregulated genes were found in Genvestigator database (in column). We then
select a list of 60 studies (in line), among 54 922 referenced in Genevestigator, exhibiting the most similar
directional changes with the 56 genes of our study by choosing the “mosaic” with the highest number of red
squares (higher transcript abundance in the treatment as compared with control). Green color is corresponding to
a lower transcript abundance for the treatment as compared with the control, and red color is corresponding to
higher transcript abundance. Color intensity is corresponding to the fold change in gene transcript abundance.
At5
g59
310
At3
g28
270
At3
g25
780
At4
g37
520
At1
g67
980
At3
g46
620
At1
g76
600
At4
g36
670
At1
g66
100
At2
g40
140
At2
g24
600
At5
g06
320
At5
g56
870
At1
g03
220
At2
g05
510
At2
g38
470
At1
g76
930
At2
g26
530
At5
g47
220
At5
g61
600
At3
g15
450
At5
g20
230
At4
g35
770
At2
g35
980
At3
g57
450
At2
g22
500
At5
g54
490
At4
g24
370
At4
g12
490
At5
g57
560
At1
g62
980
At4
g31
970
At1
g28
370
At1
g32
920
At4
g27
280
At1
g80
850
At1
g07
135
At3
g55
980
At2
g39
030
At3
g16
530
At1
g80
840
At3
g04
720
At4
g12
480
At3
g60
140
At3
g23
550
At3
g44
300
At4
g24
570
At2
g43
590
At1
g66
700
At1
g11
610
At4
g16
260
At4
g11
650
At5
g44
420
At1
g75
830
At1
g73
260
At3
g49
620
StimuliOtherElicitorBioticChemicalElicitorLight IntensityElicitorBioticBioticStressElicitorChemicalLight IntensityChemicalStressStressChemicalBioticBioticElicitorStressBioticChemicalElicitorStressElicitorBioticOtherBioticStressBioticElicitorOtherBioticHormoneElicitorBioticBioticElicitorElicitorBioticBioticBioticBioticStressStressOtherStressLight QualityElicitorElicitorBioticPhotoperiodChemicalElicitorBioticElicitorHormoneStressHormone
tel-0
0804
633,
ver
sion
1 -
26 M
ar 2
013
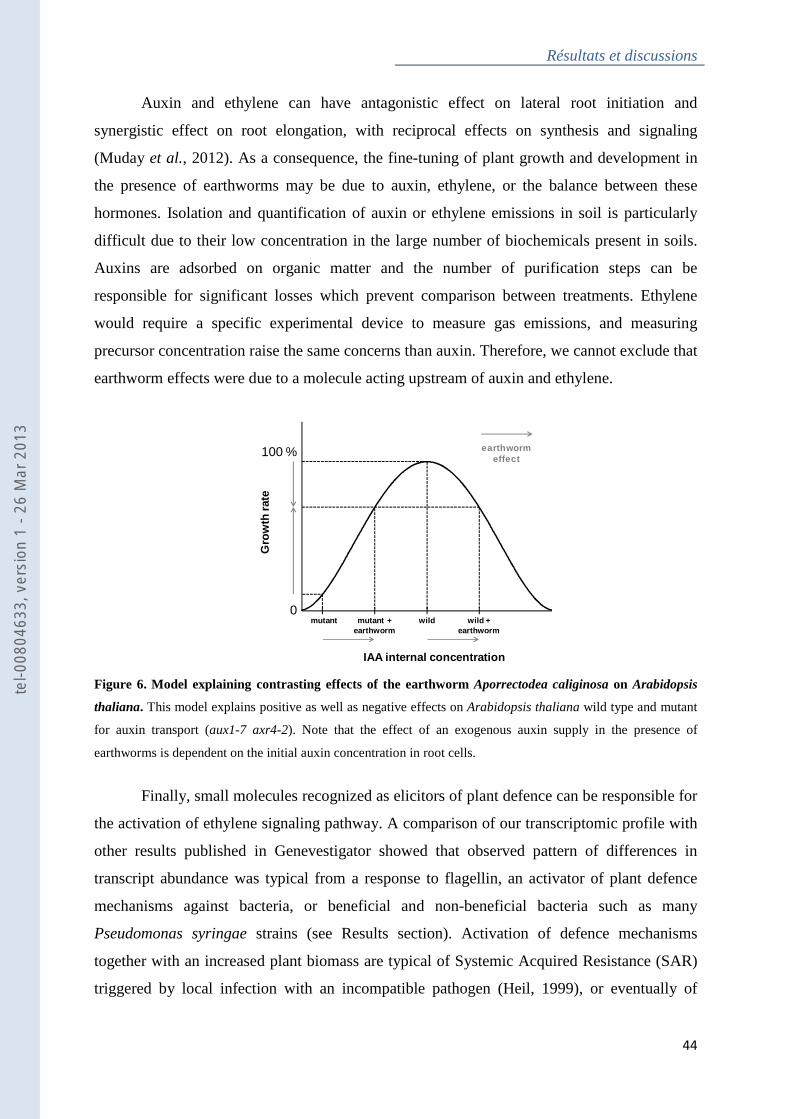
Résultats et discussions
44
Auxin and ethylene can have antagonistic effect on lateral root initiation and
synergistic effect on root elongation, with reciprocal effects on synthesis and signaling
(Muday et al., 2012). As a consequence, the fine-tuning of plant growth and development in
the presence of earthworms may be due to auxin, ethylene, or the balance between these
hormones. Isolation and quantification of auxin or ethylene emissions in soil is particularly
difficult due to their low concentration in the large number of biochemicals present in soils.
Auxins are adsorbed on organic matter and the number of purification steps can be
responsible for significant losses which prevent comparison between treatments. Ethylene
would require a specific experimental device to measure gas emissions, and measuring
precursor concentration raise the same concerns than auxin. Therefore, we cannot exclude that
earthworm effects were due to a molecule acting upstream of auxin and ethylene.
Figure 6. Model explaining contrasting effects of the earthworm Aporrectodea caliginosa on Arabidopsis
thaliana. This model explains positive as well as negative effects on Arabidopsis thaliana wild type and mutant
for auxin transport (aux1-7 axr4-2). Note that the effect of an exogenous auxin supply in the presence of
earthworms is dependent on the initial auxin concentration in root cells.
Finally, small molecules recognized as elicitors of plant defence can be responsible for
the activation of ethylene signaling pathway. A comparison of our transcriptomic profile with
other results published in Genevestigator showed that observed pattern of differences in
transcript abundance was typical from a response to flagellin, an activator of plant defence
mechanisms against bacteria, or beneficial and non-beneficial bacteria such as many
Pseudomonas syringae strains (see Results section). Activation of defence mechanisms
together with an increased plant biomass are typical of Systemic Acquired Resistance (SAR)
triggered by local infection with an incompatible pathogen (Heil, 1999), or eventually of
100 %
0
Gro
wth
rate
IAA internal concentration
mutant mutant + earthworm
wild wild + earthworm
earthwormeffect
tel-0
0804
633,
ver
sion
1 -
26 M
ar 2
013
Résultats et discussions
45
Induced Systemic Resistance (ISR) triggered by many Plant Growth Promoting Rhizobacteria
(Persello-Cartieaux et al., 2003). These mechanisms are known to be under the control of
hormones such as ethylene, salicylic acid and jasmonic acid (Ping & Boland, 2004).
We observe contrasted effects of the earthworm Aporrectodea caliginosa on the growth of
Arabidopsis thaliana depending on the considered experiment: a negative one on 23 days old
plants in the experiment with mutants, but a positive one on 42 days old plants used in
transcriptomic analysis.
These differences are typical from experiments with earthworms in natural soils:
despite numerous precautions to take up the soil at the same place and despite careful
homogenization of large soil volumes, there are still residual differences in the physical,
chemical or biological properties, especially in bacterial communities, due to initial
heterogeneity. Despite this variability, results from our three experiments converge towards
the involvement of signal molecules in the effect of earthworms on plants. These molecules
could be auxin-like compounds, ethylene, elicitors of plant defence, or a cocktail of these
molecules. Novel insights in the signaling networks that regulate synergistic and antagonistic
activities of ethylene and auxin (Muday et al., 2012) and the role of auxin-like compounds or
ethylene in SAR (Truman et al., 2010) would help to choose between different proposed
hypotheses.
An ecological perspective to this work could be to explore the parallel between
earthworms and PGPR, since both change plant morphogenesis and induce plant resistance to
pathogens (Cartieaux et al., 2003; Persello-Cartieaux et al., 2003; Verhagen et al., 2004;
Wang et al., 2005). This implies to determine whether earthworms (i) are themselves
producing signal molecules, (ii) desorb old signal molecules from soil clays and organic
matter, (iii) consume and break down bacteria, releasing signal molecules into the soil or (iv)
stimulate PGPR or other bacteria producing signal molecules. Recently, it has been shown
that the reduction of disease caused by soilborne pathogens by earthworms was associated
with the stimulation of Pseudomonas fluorescens population, a bacteria recognized as a PGPR
(Elmer, 2009). In the same way, protozoa are able to select bacteria producing signal
molecules probably by differential grazing (Bonkowski, 2004) and collembola, other soil
decomposers, can induce the differential expression of defence and auxin-responsive genes in
A. thaliana (Endlweber et al., 2011). Despite their long evolutive divergence, earthworms,
PGPR, protozoa and collembola seem to modify plant growth through a similar mechanism,
tel-0
0804
633,
ver
sion
1 -
26 M
ar 2
013
Résultats et discussions
46
i.e. the emission of signal molecules. This strongly encourages research to unravel the
potentially common signaling pathway involved in the interaction between plants and soil
organisms.
Materials and methods
Soil
Soil was collected at the CEREEP research station (Saint-Pierre-Lès-Nemours,
France) in a natural meadow, with the permission of Beatriz Decencière, project coordinator
of the CEREEP - Ecotron IDF / UMS CNRS/ENS 3194. It was dried at 25°C for a week and
sieved at 2 mm mesh size. This soil has the following properties: total organic carbon content,
14.7 g kg-1; total nitrogen content, 1.19 g kg-1; pH, 5.22; CEC, 4.08 cmol kg-1; texture: 6.9%
clay, 19.0% silt, 74.1% sand.
Earthworms
Adults of Aporrectodea caliginosa Savigny (Annelida, Oligochaeta) were retrieved
with permission at the CEREEP - Ecotron IDF. It is an endogeic earthworm which makes
horizontal or randomly oriented burrows, considered to be temporary structures because they
are rarely reused. For the in vitro experiment, two breeding boxes were prepared using the
same weight of soil maintained at 80% of the field capacity. Earthworms were added in one of
these boxes, the other one being used as control soil. After 14 days of incubation, earthworm
feces, also called casts, and control soil were retrieved from their respective breeding boxes.
In the experiments dedicated to transcriptome analysis or to the study of the double mutant,
living earthworms were added to the devoted microcosms at a density close to the one
observed in the field in France (Lavelle & Spain, 2001).
In vitro experiment
Plants were grown in sterile Petri dishes (14 cm diameter, 20.6 mm height, Fisher
Scientific, France) in the presence of a non-sterile earthworm casts or same weight of control
soil enclosed in a nylon membrane (Figure 1A). Culture medium was made of 7 g l-1 gelrite
(Duchefa Biochemie, U.S.A.). Nutrients were supplied at 4.3 g l-1 of basal salt mixture
(Duchefa Biochemie, U.S.A.), according to the well known Murashige and Skoog plant
culture media (Murashige & Skoog, 1962). Macronutrients were supplied as follow: CaCl2 :
332 mg l-1 ; KH2PO 170 mg l-1 ; KNO3 : 969.5 mg l-1 ; MgSO4 : 180.5 mg l-1 and NH4NO3 :
tel-0
0804
633,
ver
sion
1 -
26 M
ar 2
013
Résultats et discussions
47
1650 mg l-1, and micronutrients: CoCl2.6H2O : 0.025 mg l-1 ; CuSO4.5H2O : 0.025 mg l-1 ;
FeNaEDTA 36.7 mg l-1 ; H3BO3 : 6.2 mg l-1 ; KI 0.83 mg l-1 ; MnSO4.H2O : 16.9 mg l-1 ;
Na2MoO4.2H2O : 0.25 mg l-1 ; ZnSO4.7H2O : 8.6 mg l-1 and KNO3 : 930.47 mg l-1. As signal
molecules are unstable at high temperature and cannot bear sterilization, axenic conditions
were ensured by enclosing non sterile casts from earthworm husbandry and control soil into a
0.22 µm mesh size nylon membrane (MAGNA, Nylon, Transfer membrane, GE Water &
Process Technologies, U.S) which let small molecules to diffuse into the gel while keeping
bacteria inside. Seeds of Oryza sativa L. cv Morobekan were provided by the Laboratoire de
Semences et des Ressources Biologiques of the Centre de Ressources Biologiques Tropicales
de Montpellier CIRAD (France) and seeds of Lolium perenne L. bought in garden center.
They were sterilized for 5 minutes in Teepol HB7 (Sigma Aldricht, Germany) and 10 minutes
in ethanol 70°. O. sativa and L. perenne were grown respectively for 18 and 9 days in an in
vitro culture chamber under controlled conditions at respectively 30°C and 19°C, with a 12-
hours photoperiod (light intensity: 200 µmol photons s-1). There were two independent
experiments and ten biological replicates per treatment (either with control soil or earthworm
casts).
Microcosm experiment with mutants
All Arabidopsis thaliana seeds were provided by the Arabidopsis Biological Resource
Center (ABRC) at The Ohio State University (U.S.A.). As auxin-like compounds were the
best candidates for the signal molecules involved in the earthworm effect (Muscolo et al.,
1999; Canellas et al., 2002; Nardi et al., 2002), we set up a microcosm experiment, to
compare the response of A. thaliana cv Colombia wild type and double mutant aux1-7;axr4-2
(NASC ID: N8040, http://www.arabidopsis.org) in the presence or absence of earthworms.
The AUX1 gene is coding for an auxin influx facilitator protein (Swarup et al., 2004). The
AXR4 gene is involved in the polar localisation of the protein encoded by AUX1, and is thus
responsible for the polarised auxin transport from shoot apex to root tips (Dharmasiri et al.,
2006; Hobbie, 2006). As a consequence, auxin concentration in the root cells of the mutant is
lower than in the wild type, which is responsible for an altered root growth and a decreased
primary production, observed with the dwarf phenotype (Hobbie & Estelle, 1995). If
earthworms are producing auxin-like compounds in the soil, these molecules could enter root
cells, increase intracellular auxin concentration, and restore the altered phenotype of the
double mutant.
tel-0
0804
633,
ver
sion
1 -
26 M
ar 2
013
Résultats et discussions
48
A. thaliana cv Columbia wild type and the double mutant aux1-7;axr4-2 were grown in
experimental units of PVC (10 cm diameter, 15 cm height, n=5 per treatment) filled with 1kg
of dry soil, which was then maintained at 80% of the field capacity. One week after soil
humectation, five earthworms (1.88 g ± 0.09) were introduced. Two weeks after earthworm
introduction, one seed of wild type or mutant was sown in each experimental unit. Plant
growth was carried on for 23 days in growth chamber under controlled conditions (Conviron,
Canada): 20±1°C and 15±1°C day and night temperatures, 55% ± 5% relative humidity, 200
µmol m-2 s-1 PPFD for 10 h per day.
Transcriptome analysis
Experimental protocol
Two experiments were made at one week of delay to ensure robust and repeatable
results. Plants were grown in experimental PVC units (20 cm diameter, 16 cm height), filled
with 6kg DW soil and maintained at 75% of the field capacity. Seven earthworms (for a total
of 3 g on average) were introduced. After one week, five seeds of A. thaliana cv Columbia
were sown per microcosm and grown in growth chamber under controlled conditions
(Conviron, Canada): 20±1°C and 18±1°C day and night temperatures, 70% ± 5% relative
humidity, 200 µmol m-2 s-1 PPFD for 10 h per day. Plants were harvested 42 days after
sowing, when their rosette is 80% of their final size, corresponding to the 3.80 growth-stage
as defined by (Boyes et al., 2001).
RNA extraction and microarray analysis
Plants were pooled according to the treatment (Peng et al., 2003). RNA was extracted
from rosettes and roots using RNeasy Plant Mini Kit (Qiagen, France) with an on-column
DNase digestion using DNase I (Qiagen, France). The quality of the RNAs was assessed with
the Agilent Bioanalyser (Agilent, Santa Clara, U.S.A.) and the quantity determined with
Ribogreen (Invitrogen, Carlslab, U.S.A.). cRNAs were produced with the “Message Amp
aRNA” kit (Ambion, Austin, U.S.A). Five µg of cRNAs were reverse transcribed in the
presence of 200 U Superscript II (Invitrogen, Carlslab, U.S.A.), cy3-dCTP and cy5-dCTP
(NEN, Boston, U.S.A.) and hybridized on Complete Arabidopsis Transcriptome MicroArrays
(CATMA), each with 24576 Gene Specific Tags from A. thaliana (Crowe et al., 2003), with a
dye swap to avoid dye bias (Cartieaux et al., 2003). After an array-by-array normalization, a
global intensity-dependent normalization and a correction of a print-tip effect on each
metablock, paired t-tests were performed on the logarithm base 2 of the ratio of transcript
tel-0
0804
633,
ver
sion
1 -
26 M
ar 2
013
Résultats et discussions
49
abundance. The raw P-values were adjusted by the Bonferroni method. Transcript abundance
of 104 genes was increased in the first experiment and 103 in the second one, with 59 genes in
common (Table 2). We looked for these 59 genes in Genevestigator database and we found 56
of them for which we have observed an increase in transcript abundance in the presence of
earthworms (in column). As it is not possible to export rough data from Genevestigator, we
selected the 60 studies among the 54 922 referenced (in line) exhibiting the most similar
directional changes with the 56 genes of our study by choosing the “mosaic” with the highest
number of red squares (higher transcript abundance in the treatment as compared with
control).
Real-time PCR validation
First strand cDNA from leaves and roots of A. thaliana were synthesized by the
reverse transcription of 2 µg of total RNA using an oligo-dT(15) primer, Protector RNase
Inhibitor (Roche, France) and Omniscript Reverse Transcriptase kit (Qiagen, France). Real-
time PCR was performed in a LightCycler 2.0 system (Roche Diagnostics, France) with the
qPCR mastermix LightCycler® FastStart DNA MasterPLUS SYBR Green I (Roche
Diagnostics, France). Primers of three constitutive genes (At5g11770, At3g18780 and
At5g46290) as well as underexpressed and overexpressed genes (At5g59310, At5g47220,
At1g28370, At3g04720, At3g23550, and At1g73260) were designed. The amplification
program was made of an initial denaturation at 95°C for 10 min, 35 cycles of amplification at
95°C for 20 s, followed by 56°C for 20 s and 72°C for 20 s. The transcript abundance was
standardized with At5g11770 taken as reference with the geNorm v3.5 software. A logarithm
base 2 normalization of transcript abundance was performed and results (Figure 3) show
similar direction in the relative transcript abundance for real-time PCR and micro-arrays.
Root system analysis
Root length, average diameter, root surface, number of forks and tips were analyzed
with a digital scanner (EPSON Expression 10000 XL, Epson America Inc., U.S.A.) coupled
with the WinRHIZO software (WinRHIZO, version 2007 pro, Regent Instrument, Canada),
following recommendations found in literature (Himmelbauer et al., 2004): a resolution of 16
p mm–1 (400 dpi), with the automatic transformation threshold and a double light system.
Acknowledgements
tel-0
0804
633,
ver
sion
1 -
26 M
ar 2
013
Résultats et discussions
50
We thank Fabien Lopes and Chantal Passaquet for their technical help and the
Arabidopsis Biological Resource Center for mutant seeds provision.
tel-0
0804
633,
ver
sion
1 -
26 M
ar 2
013
Résultats et discussions
51
Chapitre 2 : Impact du vers de terre Aporrectodea caliginosa et de la plante Arabidopsis thaliana sur la production de l’hormone
végétale acide indole acétique par les bactéries cultivables
tel-0
0804
633,
ver
sion
1 -
26 M
ar 2
013
Résultats et discussions
52
Avant propos
Les vers de terre semblent agir au niveau de la croissance des plantes via un
mécanisme similaire à celui utilisé par certaines PGPR capables de synthétiser des molécules
signal comme les hormones végétales. Parmi ces hormones, la production d’auxine est un
mécanisme largement répandu au sein des bactéries de la rhizosphère (Persello-Cartieaux et
al., 2003; Hayat et al., 2010). De plus, certains résultats de notre précédente étude ainsi que
ceux d’autres auteurs (Nardi et al., 1988; Tomati et al., 1988; Muscolo et al., 1998; Canellas
et al., 2002; Canellas et al., 2011) suggèrent que les vers de terre agissent via un mécanisme
interagissant avec la signalisation de l’auxine. Afin d’étudier l’influence des vers de terre sur
ces bactéries capables de produire des auxines, la production d’acide indole acétique (IAA)
par les bactéries cultivables a été étudiée en présence et absence de vers de terre.
Dans cette étude préliminaire, les bactéries cultivables ont été isolées à partir du sol de
microcosmes (i) ne contenant aucun macro-organisme, (ii) en présence du ver de terre A.
caliginosa, (iii) en présence de la plante A.thaliana ou (iv) en présence des deux macro-
organismes. Une fois extraites, ces communautés bactériennes ont été cultivées en présence
du précurseur pour la biosynthèse de l’acide indole acétique, le L-tryptophane. Cette
technique est couramment utilisée afin de discriminer les bactéries productrices des non
productrices d’IAA (Frankenberger & Arshad, 1995; Tsavkelova et al., 2007; Dimkpa et al.,
2008). Nos résultats montrent que les vers de terre ont un impact positif sur la production
d’IAA par les bactéries. La plante a un impact négatif sur cette production d’IAA. Lorsque
plante et vers de terre sont présents simultanément, le niveau de production d’IAA est le
même que lorsque la plante est seule présente. Ces résultats indiquent que même si les vers de
terre peuvent stimuler la production d’IAA par les bactéries du sol cultivables, l’effet des vers
de terre sur ces communautés n’est pas significatif lorsque la plante est présente. L’effet des
plantes au niveau des ces communautés de bactéries productrices d’IAA est prévalent sur
celui des vers de terre. Ceci suggère la mise en place par la plante d’un mécanisme de
contrôle des bactériennes productrices d’IAA. On peut émettre l’hypothèse évolutive selon
laquelle ce mécanisme permettrait de prévenir un accroissement trop grand de la population
de ces bactéries, qui pourrait conduire à une trop grande production d’IAA dans le sol, ce qui
aboutirait à un effet inhibiteur sur la croissance de la plante.
tel-0
0804
633,
ver
sion
1 -
26 M
ar 2
013
Cette étude a fait l’objet d’un article publié dans Applied and Env
Science.
Figure 10 : Synthèse des résultats de l’effet du vers de terre les bactéries cultivables du sol. Les vers de terre ont un impact positif sur (1) les communautébactériennes du sol capables de produire de l’auxine. Cependant, lorsque la plante est aussi présente, la production d’auxine par les bactéries cultivables est réduite suggérant un effet prépondérant de la plante sur celui des vers de terre. L’auxine ayacontrôle de ces communautés productrices d’auxine a probablement été mis en place au cours de l’histoire évolutive de la plante afin de prévenir une trop grande abondance en auxine dansen (b) une inhibition de la croissance de la plante.
Résultats et discussions
Cette étude a fait l’objet d’un article publié dans Applied and Env
: Synthèse des résultats de l’effet du vers de terre A. caliginosa sur la production d’auxine par les bactéries cultivables du sol. Les vers de terre ont un impact positif sur (1) les communautébactériennes du sol capables de produire de l’auxine. Cependant, lorsque la plante est aussi présente, la production d’auxine par les bactéries cultivables est réduite suggérant un effet prépondérant de la plante sur celui des vers de terre. L’auxine ayant généralement (a) un effet positif sur la croissance des plantes, le contrôle de ces communautés productrices d’auxine a probablement été mis en place au cours de l’histoire évolutive de la plante afin de prévenir une trop grande abondance en auxine dans le milieu qui résulterait en (b) une inhibition de la croissance de la plante.
Résultats et discussions
53
Cette étude a fait l’objet d’un article publié dans Applied and Environmental Soil
sur la production d’auxine par les bactéries cultivables du sol. Les vers de terre ont un impact positif sur (1) les communautés bactériennes du sol capables de produire de l’auxine. Cependant, lorsque la plante est aussi présente, la production d’auxine par les bactéries cultivables est réduite suggérant un effet prépondérant de la plante
nt généralement (a) un effet positif sur la croissance des plantes, le contrôle de ces communautés productrices d’auxine a probablement été mis en place au cours de l’histoire
le milieu qui résulterait
tel-0
0804
633,
ver
sion
1 -
26 M
ar 2
013
Résultats et discussions
54
Title
Control of cultivable IAA-producing bacteria by the plant Arabidopsis thaliana and the
earthworm Aporrectodea caliginosa
Authors
Ruben Puga-Freitas, Samir Abbad, Agnès Gigon, Evelyne Garnier-Zarli, Manuel Blouin
Affiliations
UMR Biogéochimie et Ecologie des Milieux Continentaux, Université Paris-Est Créteil, 61
avenue du Général De Gaulle, 94010 Créteil cedex, France
Corresponding author
Puga-Freitas Ruben
tel: +33 1 45 17 16 14
UMR Biogéochimie et Ecologie des Milieux Continentaux, Université Paris-Est,
61 avenue du Général De Gaulle, 94010 Créteil cedex, France
tel-0
0804
633,
ver
sion
1 -
26 M
ar 2
013
Résultats et discussions
55
Abstract
Some soil microorganisms are involved in the complex interactions with plants and
earthworms, through the production of indole acetic acid (IAA) which modifies plant growth
and development. In a factorial experiment testing the impact of the presence/absence of
plants and earthworms on IAA production by cultivable bacteria, we observed that plants
were decreasing IAA production of 43%, whereas earthworms were increasing it of 46%. In
the presence of both plant and earthworms, IAA production was as low as in the presence of
plant control, showing that plants influence on IAA production by microorganisms prevails on
earthworm influence. We discuss functional reasons which could explain this result.
Keywords : Cultivable microorganisms; Earthworms; IAA; Macro-organisms; Plants
tel-0
0804
633,
ver
sion
1 -
26 M
ar 2
013
Résultats et discussions
56
1. Introduction
Soil microorganisms can be closely associated with soil animals such as earthworms
for the delivery of ecosystem functions such as organic matter mineralization (Brown et al.,
2000; Lavelle & Spain, 2001; Lavelle, 2002). The release of nutrients due to this dual
interaction has consequences on plant growth (Ingham et al., 1985; Blouin et al., 2006; Jana
et al., 2010). In addition to nutrients, interdependence between microorganisms, plants and
earthworms has led to the selection of diversified signal molecules, from low-molecular
weight compounds such as auxin (e.g. IAA), amino acids and secondary metabolites, to high-
molecular weight compounds such as proteins and polysaccharides (for review see (Bais et
al., 2006)). Emission of signal molecules by microorganisms can be deleterious for plants in
the case of pathogenic bacteria and invertebrate herbivores, or positive with mycorrhizas,
nitrogen-fixing symbiotic bacteria or free living bacteria such as Plant Growth Promoting
Rhizobacteria (PGPR) (Persello-Cartieaux et al., 2003; Bais et al., 2006; Badri & Vivanco,
2009). Auxin-like compounds have also been detected in earthworm dejections (Muscolo et
al., 1998; Canellas et al., 2002), and could be responsible for the positive effect of
earthworms (Brown et al., 2004) and vermicompost (Canellas et al., 2002) on plant growth.
The same molecule can have positive or negative effects according to its concentration and
plant sensitivity (Barazani & Friedman, 1999).
There are very few studies which consider simultaneously the impact of plants and
earthworms on microbial activities. However, it is of prior importance to establish a hierarchy
in biotic factors influencing soil microorganisms. The purpose of our study was to determine
the hierarchy of biotic factors on IAA-producing bacteria: do microorganisms obey to plants
or earthworms?
2. Materials and methods
To answer this question, we set up an experiment with 4 treatments: soil without
macro-organisms (S), with the plant Arabidopsis thaliana (P), with the earthworm
Aporrectodea caliginosa (E), with both plant and earthworms (PE). Nine cm diameter-10 cm
high PVC experimental units (n=5 per treatment) were filled with 1 kg of dry sandy soil from
the CEREEP research station (Saint-Pierre-Lès-Nemours, France).
tel-0
0804
633,
ver
sion
1 -
26 M
ar 2
013
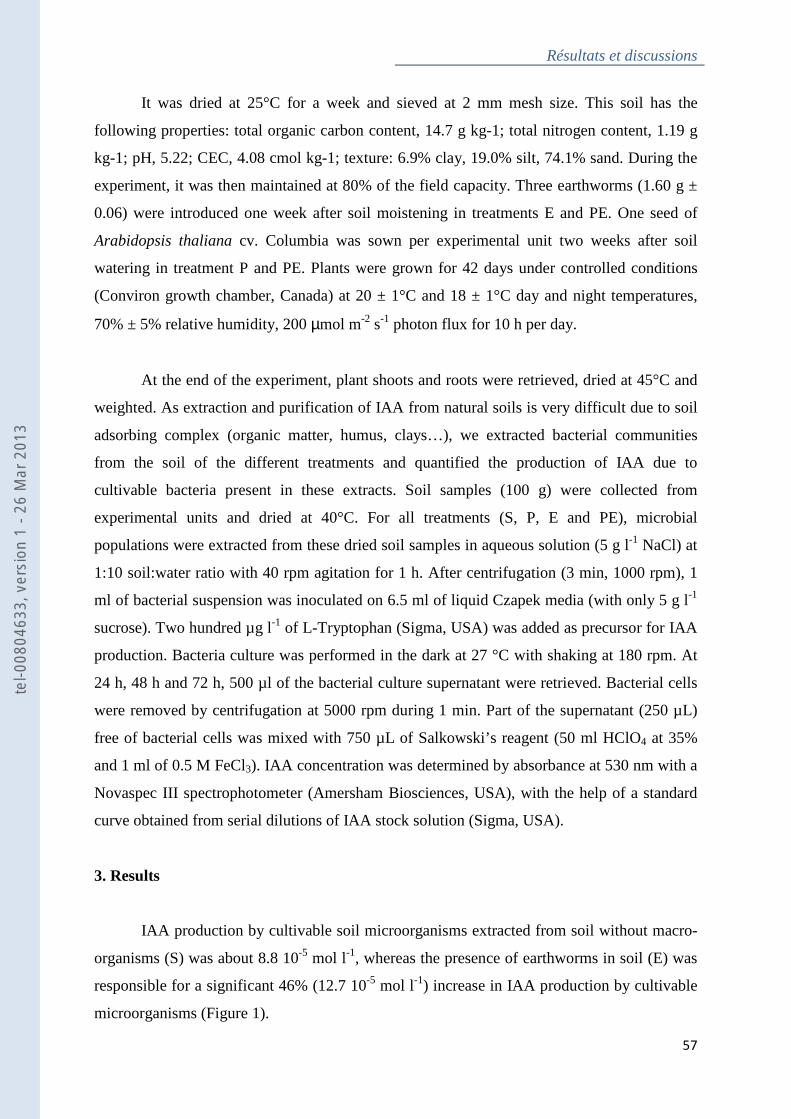
Résultats et discussions
57
It was dried at 25°C for a week and sieved at 2 mm mesh size. This soil has the
following properties: total organic carbon content, 14.7 g kg-1; total nitrogen content, 1.19 g
kg-1; pH, 5.22; CEC, 4.08 cmol kg-1; texture: 6.9% clay, 19.0% silt, 74.1% sand. During the
experiment, it was then maintained at 80% of the field capacity. Three earthworms (1.60 g ±
0.06) were introduced one week after soil moistening in treatments E and PE. One seed of
Arabidopsis thaliana cv. Columbia was sown per experimental unit two weeks after soil
watering in treatment P and PE. Plants were grown for 42 days under controlled conditions
(Conviron growth chamber, Canada) at 20 ± 1°C and 18 ± 1°C day and night temperatures,
70% ± 5% relative humidity, 200 µmol m-2 s-1 photon flux for 10 h per day.
At the end of the experiment, plant shoots and roots were retrieved, dried at 45°C and
weighted. As extraction and purification of IAA from natural soils is very difficult due to soil
adsorbing complex (organic matter, humus, clays…), we extracted bacterial communities
from the soil of the different treatments and quantified the production of IAA due to
cultivable bacteria present in these extracts. Soil samples (100 g) were collected from
experimental units and dried at 40°C. For all treatments (S, P, E and PE), microbial
populations were extracted from these dried soil samples in aqueous solution (5 g l-1 NaCl) at
1:10 soil:water ratio with 40 rpm agitation for 1 h. After centrifugation (3 min, 1000 rpm), 1
ml of bacterial suspension was inoculated on 6.5 ml of liquid Czapek media (with only 5 g l-1
sucrose). Two hundred µg l-1 of L-Tryptophan (Sigma, USA) was added as precursor for IAA
production. Bacteria culture was performed in the dark at 27 °C with shaking at 180 rpm. At
24 h, 48 h and 72 h, 500 µl of the bacterial culture supernatant were retrieved. Bacterial cells
were removed by centrifugation at 5000 rpm during 1 min. Part of the supernatant (250 µL)
free of bacterial cells was mixed with 750 µL of Salkowski’s reagent (50 ml HClO4 at 35%
and 1 ml of 0.5 M FeCl3). IAA concentration was determined by absorbance at 530 nm with a
Novaspec III spectrophotometer (Amersham Biosciences, USA), with the help of a standard
curve obtained from serial dilutions of IAA stock solution (Sigma, USA).
3. Results
IAA production by cultivable soil microorganisms extracted from soil without macro-
organisms (S) was about 8.8 10-5 mol l-1, whereas the presence of earthworms in soil (E) was
responsible for a significant 46% (12.7 10-5 mol l-1) increase in IAA production by cultivable
microorganisms (Figure 1).
tel-0
0804
633,
ver
sion
1 -
26 M
ar 2
013
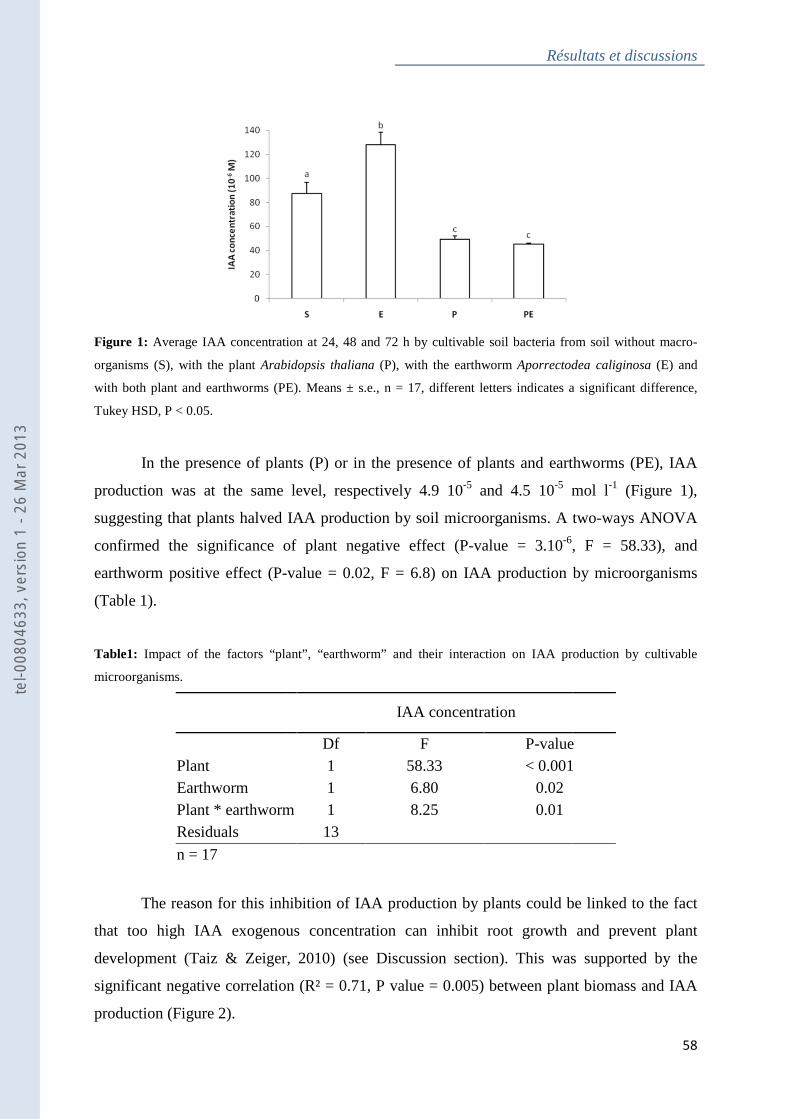
Figure 1: Average IAA concentration at 24, 48 and 72 h by cultivable soil bacteria from soil
organisms (S), with the plant Arabidopsis thaliana
with both plant and earthworms (PE).
Tukey HSD, P < 0.05.
In the presence of plants (P) or in the presence of plants and earthworms (PE), IAA
production was at the same level, respectively 4.9 10
suggesting that plants halved IAA production by soil microorganisms. A two
confirmed the significance of plant negative effect (P
earthworm positive effect (P-
(Table 1).
Table1: Impact of the factors “plant”, “earthworm” and their interaction on IAA production by cultivable
microorganisms.
Plant Earthworm Plant * earthwormResiduals
n = 17
The reason for this inhibition of IAA production by plants could be linked to the fact
that too high IAA exogenous concentration can inhibit root growth and prevent plant
development (Taiz & Zeiger, 2010
significant negative correlation (R² = 0.71, P value = 0.005) between plant biomass and IAA
production (Figure 2).
Résultats et discussions
A concentration at 24, 48 and 72 h by cultivable soil bacteria from soil
Arabidopsis thaliana (P), with the earthworm Aporrectodea caliginosa
with both plant and earthworms (PE). Means ± s.e., n = 17, different letters indicates a significant difference,
In the presence of plants (P) or in the presence of plants and earthworms (PE), IAA
production was at the same level, respectively 4.9 10-5 and 4.5 10-5 mol l
g that plants halved IAA production by soil microorganisms. A two
confirmed the significance of plant negative effect (P-value = 3.10-6, F = 58.33), and
-value = 0.02, F = 6.8) on IAA production by microorganisms
Impact of the factors “plant”, “earthworm” and their interaction on IAA production by cultivable
IAA concentration
Df F P-value1 58.33 < 0.0011 6.80 0.02
Plant * earthworm 1 8.25 0.01 13
The reason for this inhibition of IAA production by plants could be linked to the fact
that too high IAA exogenous concentration can inhibit root growth and prevent plant
Taiz & Zeiger, 2010) (see Discussion section). This was supported by the
egative correlation (R² = 0.71, P value = 0.005) between plant biomass and IAA
Résultats et discussions
58
A concentration at 24, 48 and 72 h by cultivable soil bacteria from soil without macro-
Aporrectodea caliginosa (E) and
ferent letters indicates a significant difference,
In the presence of plants (P) or in the presence of plants and earthworms (PE), IAA
mol l-1 (Figure 1),
g that plants halved IAA production by soil microorganisms. A two-ways ANOVA
, F = 58.33), and
value = 0.02, F = 6.8) on IAA production by microorganisms
Impact of the factors “plant”, “earthworm” and their interaction on IAA production by cultivable
value < 0.001
The reason for this inhibition of IAA production by plants could be linked to the fact
that too high IAA exogenous concentration can inhibit root growth and prevent plant
(see Discussion section). This was supported by the
egative correlation (R² = 0.71, P value = 0.005) between plant biomass and IAA
tel-0
0804
633,
ver
sion
1 -
26 M
ar 2
013
Résultats et discussions
59
As far as the interaction between plants and earthworms is concerned, we observed
that the positive effect of earthworms on IAA production observed in treatment E disappeared
in treatment PE (Figure 1).
A two-ways ANOVA showed that the statistical interaction between the factors plants
and earthworms was significant (P-value = 0.01, F = 8.25), which means that earthworm
effect on IAA production was dependant on the presence of plants. Note that the discussed
IAA concentration was due to the production of IAA by cultivable microorganisms, which
represent only a small fraction of microorganisms living in a soil, despite the large spectrum
of microorganisms growing on the Czapek medium. An alternative approach would be to
extract all the IAA from the soil, but a given extraction protocol would not have the same
extraction efficiency for soils deeply modified by plants or earthworms. Moreover, protocols
developed to detect IAA in complex soils (Muscolo et al., 1998; Canellas et al., 2002;
Quaggiotti et al., 2004) do not provide reliable methods to quantify absolute amount of IAA
in soil samples.
4. Discussion
Interactions between organisms in soil are mainly based on trophic relationships and
exchange of signals. Among signal molecules, auxins have been showed to play a major role
in plant-microorganism interactions; for example, rhizobacteria producing high amounts of
IAA are generally responsible for a negative effect on plant growth and have been called
“Deleterious Rhizo Bacteria” (Suslow & Schroth, 1982; Schippers et al., 1987; Nehl et al.,
1996).
Rhizobacteria producing low amounts of IAA are generally responsible for a positive
effect on plant growth and have been called “Plant Growth Promoting Rhizobacteria”
(Kloepper & Schroth, 1978; Bashan & Holguin, 1998; Persello-Cartieaux et al., 2003). This
important effect of IAA can be related to its role in cell division and elongation: it is
demonstrated that the auxin dose – response curve is bell shaped, with a maximal elongation
rate reached for medium exogenous auxin concentration (Taiz & Zeiger, 2010).
tel-0
0804
633,
ver
sion
1 -
26 M
ar 2
013
Figure 2: Relationship between IAA c
0.75, P = 0.005).
Many soil bacteria use signals to direct plant carbon for the build
structures (Hirsch et al., 1997
effect on root exudates and bacteria popul
microorganisms, the increase in IAA production observed in the presence of earthworms
could be explained as a way to increase root exudates, bacterial biomass and thus earthworm
resources. This is supported by previous observations of higher IAA content in earthworms
worked soils as compared with soil without earthworms
2002) as well as the hormone
et al., 2000; Chaoui et al., 2002
However, initiation of additional root structures or increased exudation is probably not
always beneficial to plants. Plants have
production by microorganisms. There are very few evidences of a direct control of IAA
producing bacterial communities by plants. Nevertheless, it has been showed that
transcription of ipdC, an Erwinia IAA biosyn
tobacco compounds (Brandl & Lindow, 1997
of the repression of IAA producing bacteria in the presence of plants observed in our study.
Résultats et discussions
Relationship between IAA concentration and plant above-ground biomass (y =
Many soil bacteria use signals to direct plant carbon for the build-up of additional root
, 1997; Jameson, 2000; Bonkowski, 2004), with a subsequent positive
effect on root exudates and bacteria populations. As earthworms are supposed to consum soil
microorganisms, the increase in IAA production observed in the presence of earthworms
could be explained as a way to increase root exudates, bacterial biomass and thus earthworm
by previous observations of higher IAA content in earthworms
worked soils as compared with soil without earthworms (Muscolo et al., 1998
as well as the hormone-like effects observed in compost made by earthworms
, 2002; Arancon et al., 2006).
However, initiation of additional root structures or increased exudation is probably not
always beneficial to plants. Plants have indeed developed mechanisms to regulate IAA
production by microorganisms. There are very few evidences of a direct control of IAA
producing bacterial communities by plants. Nevertheless, it has been showed that
transcription of ipdC, an Erwinia IAA biosynthetic gene, is induced in response to bean and
Brandl & Lindow, 1997). This kind of mechanism could be at the origin
of the repression of IAA producing bacteria in the presence of plants observed in our study.
Résultats et discussions
60
ground biomass (y = -24.35x + 54.53, R² =
up of additional root
, with a subsequent positive
ations. As earthworms are supposed to consum soil
microorganisms, the increase in IAA production observed in the presence of earthworms
could be explained as a way to increase root exudates, bacterial biomass and thus earthworm
by previous observations of higher IAA content in earthworms-
, 1998; Canellas et al.,
like effects observed in compost made by earthworms (Atiyeh
However, initiation of additional root structures or increased exudation is probably not
indeed developed mechanisms to regulate IAA
production by microorganisms. There are very few evidences of a direct control of IAA
producing bacterial communities by plants. Nevertheless, it has been showed that
thetic gene, is induced in response to bean and
. This kind of mechanism could be at the origin
of the repression of IAA producing bacteria in the presence of plants observed in our study.
tel-0
0804
633,
ver
sion
1 -
26 M
ar 2
013
Résultats et discussions
61
5. Conclusion
In this study, we confirmed that earthworms can be responsible for an increase in IAA
production by microorganisms. We also observed a repression of IAA production in the
presence of plants. In the presence of both earthworms and plants, we found that plants took
the advantage on earthworms in the control of cultivable IAA-producing bacteria, by
maintaining a weak level of IAA production by cultivable microorganisms.
Plants are responsible for energy inputs in terrestrial ecosystems (about 90% of soil
organic matter). They are major providers of substrates to microorganisms through root
exudates and dead roots, which could represent 20 to 50% of the total assimilated carbon
(Lynch & Whipps, 1990; Kuzyakov & Domanski, 2000), or to earthworms through dead
leaves and roots (Brussaard, 1999). This could explain the fact that they control many soil
processes such as the production of IAA, but also free-living bacteria nitrogenase activity
(Zarea et al., 2009), amoebae community structure (Alphei et al., 1996) and hydro-structural
stability of soil (Milleret et al., 2009).
tel-0
0804
633,
ver
sion
1 -
26 M
ar 2
013
Résultats et discussions
62
Chapitre 3 : Impact du vers de terre Aporrectodea caliginosa et de la bactérie productrice d’acide indole acétique Micrococcus luteus
sur la croissance et le développement d’Arabidopsis thaliana
tel-0
0804
633,
ver
sion
1 -
26 M
ar 2
013
Résultats et discussions
63
Avant propos
Les vers de terre stimulent la production de molécules signal par les bactéries
cultivables du sol. Ces molécules qui agissent sur les voies de signalisation de nombreuses
hormones végétales ont un effet sur la croissance et le développement des plantes. Alors que
les bactéries productrices d’auxine ont été analysées à la fin de l’expérience du chapitre
précédent, nous proposons dans l’étude suivante une manipulation de la population d’une
bactérie isolée sur sa capacité à produire de forte dose d’IAA. L’objectif est ici d’étudier
l’impact de la dose de bactérie inoculée et la présence de vers de terre.
Nous avons étudié l’impact du ver de terre A. caliginosa et de la souche bactérienne
productrice d’auxine Micrococcus luteus sur la croissance et le développement d’A. thaliana.
La bactérie a été isolée à partir de la rhizosphère de plants de pomme de terre (Solanum
tuberosum) à partir de sa capacité à produire de l’auxine. Cette bactérie a été inoculée dans le
sol à trois concentrations. Les résultats montrent un impact négatif de ces bactéries sur la
croissance des plantes, d’autant plus grand que l’inoculum est important. Cet effet délétère
suggère que cette bactérie productrice d’auxine peut être classée comme bactérie délétère de
la croissance des plantes (DRB). L’issue de l’action sur les plantes des bactéries de la
rhizosphère productrices de molécules signal est fortement dépendante de la taille de la
population (Persello-Cartieaux et al., 2001; Persello-Cartieaux et al., 2003) mais aussi du
génotype de la plante (Kremer, 2006). Concernant l’effet des vers de terre, nous avons
observé un impact positif sur la croissance de la plante en absence de M. luteus. Cependant,
cet effet positif diminue quand la taille de l’inoculum augmente, jusqu’à disparaître
complètement pour la dose de bactérie la plus forte. Il existe donc une action antagoniste de
M. luteus sur le mécanisme d’action du vers de terre. Ces résultats soulignent l’importance de
l’action des molécules signal produites dans la rhizosphère. La bactérie M. luteus en
produisant de fortes teneur en IAA perturbe probablement chez la plante la voie de
signalisation sous contrôle de l’auxine. Ces changements pourraient perturber tous les
mécanismes d’interaction les autres organismes du sol dont les vers de terre et leurs
conséquences sur la plante via les microorganismes de la rhizosphère.
Cette étude fait l’objet d’un article prêt à soumettre à Applied Soil Ecology.
tel-0
0804
633,
ver
sion
1 -
26 M
ar 2
013
Figure 11 : Synthèse des résultats de l’effet du ver de terre croissance et le développement d’croissance d’A. thaliana suggérant une action de type (1) DRB. Les vers de terre ont (b) un effet positif sur la croissance d’A. thaliana en absence de taille de l’inoculum de M. luteus esvers de terre, qui pourrait passer par un effet sur
Résultats et discussions
: Synthèse des résultats de l’effet du ver de terre A. caliginosa et de la bactérie croissance et le développement d’A. thaliana. L’inoculation de cette bactérie a (a) un effet négatif sur
suggérant une action de type (1) DRB. Les vers de terre ont (b) un effet positif sur en absence de M. luteus. Cependant, cet effet est d’autant plus faible que la
est grande suggérant (c) un effet antagoniste de cette bactérie à celui du vers de terre, qui pourrait passer par un effet sur (2) les PGPR.
Résultats et discussions
64
et de la bactérie M. luteus sur la . L’inoculation de cette bactérie a (a) un effet négatif sur la
suggérant une action de type (1) DRB. Les vers de terre ont (b) un effet positif sur . Cependant, cet effet est d’autant plus faible que la
t grande suggérant (c) un effet antagoniste de cette bactérie à celui du
tel-0
0804
633,
ver
sion
1 -
26 M
ar 2
013
Résultats et discussions
65
Title
Combined effects of the earthworm Aporrectodea caliginosa and the IAA-producing
Rhizobacteria Micrococcus luteus on the growth and development of the plant Arabidopsis
thaliana.
Authors
Diana Edith CASTELLANOS SUAREZ1, Agnès GIGON2, Ruben PUGA-FREITAS2, Patrick
LAVELLE 3, Elena VELASQUEZ4, Manuel BLOUIN2
Affiliations
1 Facultad de Agronomía, Universidad Nacional de Colombia, Bogotá D.C., Colombia
2 UMR Biogeochimie et Ecologie des Milieux Continentaux, équipe Ibios, Institut de
Recherche pour le Développement et Université Paris-Est Créteil, 61 avenue du Général De
Gaulle, 94010 CRETEIL cedex, FRANCE
3 Centro Internacional de Agricultura Tropical, AA 6713, Cali, Colombia
4 Universidad Nacional de Colombia, Palmira, Colombia
tel-0
0804
633,
ver
sion
1 -
26 M
ar 2
013
Résultats et discussions
66
Abstract
Micrococcus luteus bacteria has been isolated from rhizospheric soil of potato and is
considered as a deleterious rhizo-bacteria (DRB) or as a plant growth promoter bacteria
depending on the plant species. In this study, we tested the use of earthworms (Aporrectodea
caliginosa) as a biocontrol or synergistic agent of M. luteus. We expected that earthworms
would modify microbial communities in a way that would stimulate plant growth, as
demonstrated in a large number of experiments. M. luteus actually had a negative effect on
plant growth, with respective decreases of 31.2% for belowground biomass (P = 0.96) and
23.6% for aboveground biomass (P = 0.16) (23.3% for total biomass, P = 0.21) with the
maximal dose applied (107 CFU ml-1). In the absence of bacteria, earthworm activities
allowed an 85% increase in belowground biomass (P = 0.09) and 1.4% increase in
aboveground biomass (P = 0.99) (14% increase in total biomass, P = 0.75). Nevertheless, this
positive effect of earthworms progressively decreased while increasing the dose of M. luteus,
to finally disappear at the maximal dose, showing that earthworms cannot be used as a
biocontrol agent for this DRB. Effects of earthworms and M. luteus on plant development
strongly differed: while the first had a significant effect on the development of vegetative
organs (e.g. rosette diameter and fine root proportion), the latter significantly affected floral
organs (e.g. floral stem height). Some parameters such as leaf area were finally only
influenced by the interaction between the two factors.
Significant interactions observed between earthworms and M. luteus suggest that
signal molecules involved in their effects are probably different in nature, or delivered at
different periods during the plant cycle.
tel-0
0804
633,
ver
sion
1 -
26 M
ar 2
013
Résultats et discussions
67
1. Introduction
Some free living bacteria of the plant rhizosphere, called Plant Growth Promoting
Rhizobacteria or PGPR (Bashan & Holguin, 1998), have potential to increase plant growth.
Among several proposed mechanisms, PGPB could release signal molecules close to
phytohormones, fix atmospheric nitrogen in the rhizosphere, solubilize nutrients, promote
mycorrhizas, or regulate ethylene production in roots; they can also act indirectly on plant
growth through the suppression of major plant pathogens (Nehl et al., 1996; Persello-
Cartieaux et al., 2003).
On the opposite, other free living rhizobacteria described as deleterious rhizo-bacteria
(DRB) (Suslow & Schroth, 1982) can inhibit root and shoot growth. Since the symptoms
caused by these bacteria are scarce and non specific (foliar symptoms similar to nutrient
deficiencies, discrete root symptoms such as browning and discoloration, few recorded cases
of mortality), and that there is no obligate physical contact between these bacteria and plant
root, they have attracted much less scientific attention than the plant growth promoting
rhizobacteria (PGPR).
Nehl et al. (1996) argue that the distinction between PGPR and DRB is probably
artificial, since bacteria are classified in one group on the basis of bioassays, in which their
net effect on plant growth is determined. Positive effects of PGPR and negative effects of
DRB are actually host specific, at the species and cultivar levels, and there is little apparent
relationship between taxonomic characteristics of rhizobacteria and their function as DRB or
PGPR (Suslow & Schroth, 1982; Campbell et al., 1986). For example, the individual effects
of 43 strains of Pseudomonas isolated from roots of rough lemon in the field varied from a
52% reduction to a 116% increase in root growth (Gardner et al., 1984).
It is therefore likely that a single organism may function alternatively as a DRB or
PGPR according to circumstances, i.e. plant genotype, soil conditions or the presence of
myccorhizae (Nehl et al., 1996).
The effect of these microorganisms on plants can actually be mediated by several
kinds of molecules such as nutrients, antibiotics, siderophores or signal molecules mimicking
plant hormones. Among these hormone-like compounds, auxins, cytokinins and ethylene are
the most widespread, although other compounds such as gibberellin and jasmonate-like
substances have been reported to be synthesized by soil and rhizosphere microorganisms
tel-0
0804
633,
ver
sion
1 -
26 M
ar 2
013
Résultats et discussions
68
(Persello-Cartieaux et al., 2003). Generally, auxins and cytokinins are reported to increase
plant growth through the modification of plant morphogenesis, whereas ethylene, salicilic
acid and jasmonic acid are beneficial due to their role in the activation of resistance to
pathogens (van Loon et al., 1998; Ping & Boland, 2004). The concentration of the signal
molecule is crucial. For example, the dose response curve of plant to exogenous auxin
application is bell shaped (Taiz & Zeiger, 2010), and rhizobacteria can induce positive or
negative effect according to their level of auxin production (Barazani & Friedman, 1999).
Promoting microbial communities with dominance of PGPR on DRB is certainly a
promising way to ecologically increase plant growth through an improved plant development.
Our hypothesis is that earthworms might have such an effect for several reasons. First,
earthworms are ecosystem engineers that influence activities of other organisms at modifying
the physical environment (Jones et al., 1994; Lavelle et al., 1997). Earthworms galleries,
allow better water infiltration (Le Bayon et al., 2002; Shuster et al., 2002) and drainage
(Blouin et al., 2007b), and thus avoid DRB proliferation which occurs in waterlogged
situations (Mandryck, 1969; Chan et al., 1989). Earthworms actually have a positive effect on
plant growth in 80% of reported cases (Brown et al., 1999; Scheu, 2003). Several results show
that this effect is mostly due to signal molecules emitted in the soil (Puga-Freitas et al.,
accepted), probably due to the activation of PGPR (Brown et al., 2004). Other indirect effects
of earthworms on plant growth are mediated through stimulation of plant defense (Blouin et
al., 2005), or control of plant pathogens, which can be associated with an increase in PGPR
population (Elmer, 2009).
In this work, we tested the effects in isolation and combination of a DRB
(Micrococcus luteus) and of an earthworm (Aporrectodea caliginosa) on plant growth
(Arabidopsis thaliana). The bacteria used in this experiment is Micrococcus luteus, a Gram
positive coccus. It exhibited positive effects on growth of tomato and radish and was
therefore ascribed to the PGPR group (Arguello et al., 2011). However, in another study, this
bacteria was responsible for negative effects on young lettuce seedlings (Lactuca sativa) and
thus considered as a DRB (Barazani & Friedman, 1999). Our study aims to answer several
questions: (i) what is the effect of M. luteus on the growth and development of A. thaliana?
(ii) If there is a positive effect, is there a synergy with earthworms? (iii) If negative, is there a
control due to the presence of earthworms? (iv) what can we learn on the mechanisms of
action of M. luteus and earthworms from such a factorial experiment?
tel-0
0804
633,
ver
sion
1 -
26 M
ar 2
013
Résultats et discussions
69
2. Materials and Methods
The experiment was carried out in the laboratory using the model plant Arabidopsis
thaliana cv. Columbia, grown in the presence/absence of the endogeic earthworm
Aporrectodea caliginosa and with three different concentrations of viable cells of the bacteria
M. luteus selected for its ability to produce large amounts of auxin (Indole Acetic Acid or
IAA).
2.1. Microcosms
Soils were collected from the top layer (0-20 cm), at the Centre de Recherche en
Ecologie Expérimentale et Prédictive - CEREEP (Saint-Pierre-Lès-Nemours, France). It is a
poor cambisol supporting a natural meadow (total organic carbon content: 14.7 g kg-1; total
nitrogen content: 1.19 g kg-1; pH, 5.22; CEC: 4.08 cmol kg-1) with a sandy texture (6.9% clay,
19.0% silt, 74.1% sand). Soil was dried at 25°C for several weeks, and sieved with a 2 mm
mesh sieve. PVC pots 13 cm in diameter and 12 cm heigh were filled with 1.2 kg of soil. Soil
was maintained at 80% of the field capacity with deionised H2O (240 g of water per 1200 g
dry soil). The amount of water in soil was checked twice a week by weighting pots. No
nutrient addition was made.
2.2. Bacterial inoculums
Bacteria were isolated from the rhizosphere of healthy potato plants (Solanum
tuberosum) in an organic cultivation in the savanna of Bogotá (Colombia) (León, 2003).
Taxonomic characterization performed by 16S rRNA gene sequences ascribed the bacteria
used in this experiment to the M. luteus species. M. luteus is a Gram positive coccus, that
produced 52 µg ml-1 of IAA after 6 days of fermentation (Arguello et al., 2011). Colonies of
bacteria were isolated on agar LB and grown in 100 ml of BT broth in 250 ml flask, up to a
cell concentration of 1.0 x10⁶ cells ml-1 (Castellanos et al., 2009). Bottles were placed in
continuous shaking in an orbital shaker at 170 rpm, temperature 27°C for 48 hours (Celis
Bautista & Gallardo, 2008), for a final concentration of 1.9 x10⁸ CFU ml-1. From this culture,
we obtained dilutions of 105, 106 and 107 CFU ml-1 by adding sterile deionized water. Three
applications of bacterial inoculum were carried out: at time zero (addition of seeds), 7 and 14
days later. These applications of 10 ml inoculum were performed at four points on the
microcosm surface (for a total of 40 ml), located on a 5cm diameter circle from the centre of
the microcosm, around the plants.
tel-0
0804
633,
ver
sion
1 -
26 M
ar 2
013
Résultats et discussions
70
2.3. Earthworms
Earthworms (Aporrectodea caliginosa) were collected at the IRD site of Bondy (Seine
Saint Denis, France) and maintained in a breeding room for several weeks. Two weeks after
microcosms set up and soil watering, two earthworms with a 0.46 g average weight were
inoculated in each unit, corresponding to a biomass of 520 kg ha-1 in the field.
2.4. Plant growth conditions
Ten seeds of Arabidopsis thaliana cv. Columbia were placed in the center of each
microcosm 10 days before earthworm introduction. Fifty days after sowing, only one seedling
was left in each microcosm. Plants were grown for 60 days under controlled conditions in a
culture chamber (Adaptis A1000, Conviron, Canada) with a 22/20°C day/night temperature, a
70/75% day/night humidity, and a 12h photoperiod with a 150 µmol photon m-2 s-1 intensity.
2.5. Experimental design
There were 8 different treatments: 4 with (E0, E1, E2, E3), and four without
earthworms (C0, C1, C2, C3). C0 and E0 were control treatment without inoculated bacteria.
C1-E1, C2-E2 and C3-E3 treatments were inoculated respectively with 105, 106 and 107 CFU
ml-1. Each treatment was replicated 6 times, for a total of 48 microcosms. Microcosms were
randomly distributed in the culture chamber, and their position changed two times a week,
after weighing and watering.
2.6. Plant measurements
At the end of the experiment, floral stem length and rosette diameter were measured.
Foliar and root systems of each plant was analyzed with a digital scanner (Epson Expression
10000 XL, Epson America Inc., San Jose, CA, USA) coupled with the WinRHIZO software
(WinRHIZO, V. 2007 pro, Regent Instruments, Quebec, Canada), at a 16 p mm–1 (400 dpi)
resolution and using the automatic transformation threshold, following the standard procedure
(Bouma et al., 2000; Himmelbauer et al., 2004). Eleven diameter classes were defined: from
0–100 to 800–900 and >900 mm. After root system analysis, above- and belowground organs
were dried for 2 days at 45°C and weighed.
tel-0
0804
633,
ver
sion
1 -
26 M
ar 2
013
Résultats et discussions
71
2.7. Determination of Indole Acetic Acid production by cultivable bacteria
Twenty grams soil samples were retrieved from each microcosm 30 days after sowing,
at the four inoculation points. Subsamples were homogenized and one gram was used for
measurements. Bacteria were extracted in 9 ml of a solution of NaCl 0.9% (w/v) under
circular agitation at 40 rpm for 30 minutes. The solution was then centrifuged at 1000 rpm for
3 minutes. One ml of supernatant was mixed to 6.5 ml of Czapeck culture medium and
incubated under constant agitation (150 rpm at 26 °C). After 24 hours, 800 µl of a stock
solution of L-tryptophan (2 µg µl-1) was added as IAA precursor. Colorimetric quantification
of IAA production was made at 24, 48 and 72 hours. Five hundred µl were centrifuged for 75
seconds at 14000 rpm. Two hundred and fifty µl of supernatant were mixed to 750 µl of
Salkowsky reagent and incubated for 30 minutes in the dark. Absorbance was measured at
535 nm with the Novaspec III spectrophotometer (Amersham Biosciences, USA). IAA
concentration was obtained from absorbance according to a standard curve equation (y =
16.636 x ; R² = 0.99).
2.8. Statistical analyses
All analyses were performed using the R software (Team, 2008). To get an overview
of plant response in our data set, we performed a multivariate analysis (Principal Component
Analysis) of all treatments based on dependant variables (biomasses and root and shoot
morphology). The significance of treatment effect was tested in a Monte Carlo test. We also
performed two-ways ANOVA, with earthworm presence and M. luteus inoculum as factors,
on all dependent variables. Non-linear regressions for all dependent variables then allowed
determining the equation of a regression curve for a given dependent variable as a function of
the dose of M. luteus inoculated, either in the presence or absence of earthworms (two distinct
regressions). Because the dose response curve of the plant to M. luteus dose could be bell-
shaped as in the case of exogenous auxin application, we first tested a second degree
polynomial function (dependant variable = f(inoculum) = ax2 + bx + c). If the second degree
parameter was not significantly different from zero, we used a first degree polynomial
function (f(x) = ax + b). As a consequence, the shape of the regression curve was not always
the same according to the treatment (with or without earthworms) or to the dependant
variable.
tel-0
0804
633,
ver
sion
1 -
26 M
ar 2
013
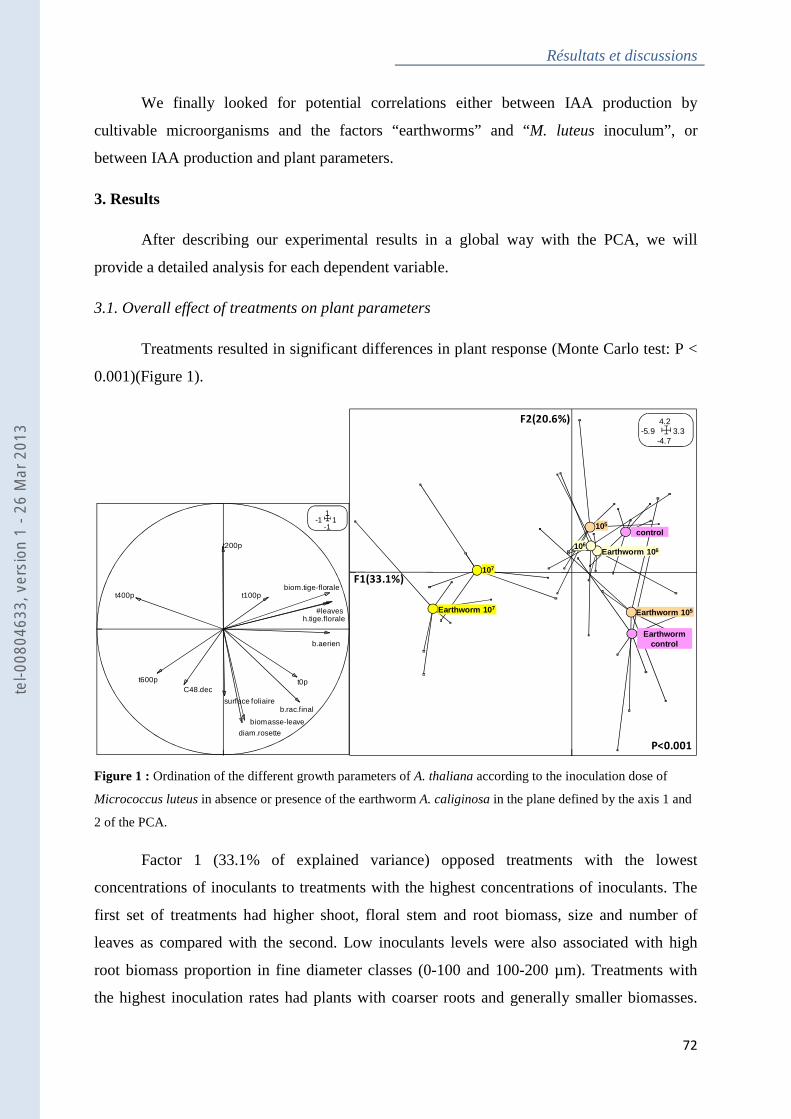
Résultats et discussions
72
We finally looked for potential correlations either between IAA production by
cultivable microorganisms and the factors “earthworms” and “M. luteus inoculum”, or
between IAA production and plant parameters.
3. Results
After describing our experimental results in a global way with the PCA, we will
provide a detailed analysis for each dependent variable.
3.1. Overall effect of treatments on plant parameters
Treatments resulted in significant differences in plant response (Monte Carlo test: P <
0.001)(Figure 1).
Figure 1 : Ordination of the different growth parameters of A. thaliana according to the inoculation dose of
Micrococcus luteus in absence or presence of the earthworm A. caliginosa in the plane defined by the axis 1 and
2 of the PCA.
Factor 1 (33.1% of explained variance) opposed treatments with the lowest
concentrations of inoculants to treatments with the highest concentrations of inoculants. The
first set of treatments had higher shoot, floral stem and root biomass, size and number of
leaves as compared with the second. Low inoculants levels were also associated with high
root biomass proportion in fine diameter classes (0-100 and 100-200 µm). Treatments with
the highest inoculation rates had plants with coarser roots and generally smaller biomasses.
#leaves
diam.rosette
h.tige.florale
surface foliaire
biom.tige-florale
biomasse-leave
b.aerien
b.rac.final
t600p
t400p
t200p
t100p
t0pC48.dec
-1
1-1 1
-4.7
4.2-5.9 3.3
Earthworm 107
Earthworm 106
Earthworm 105
105
107
Earthwormcontrol
106
control
F1(33.1%)
F2(20.6%)
P<0.001
tel-0
0804
633,
ver
sion
1 -
26 M
ar 2
013
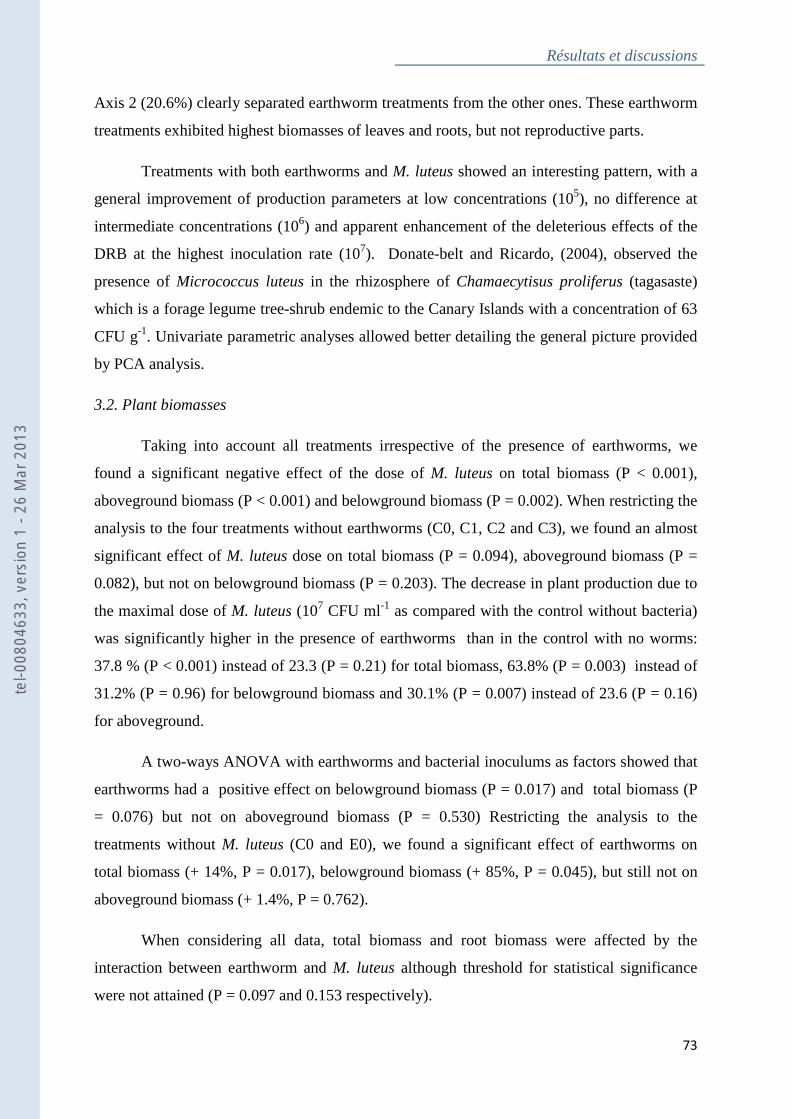
Résultats et discussions
73
Axis 2 (20.6%) clearly separated earthworm treatments from the other ones. These earthworm
treatments exhibited highest biomasses of leaves and roots, but not reproductive parts.
Treatments with both earthworms and M. luteus showed an interesting pattern, with a
general improvement of production parameters at low concentrations (105), no difference at
intermediate concentrations (106) and apparent enhancement of the deleterious effects of the
DRB at the highest inoculation rate (107). Donate-belt and Ricardo, (2004), observed the
presence of Micrococcus luteus in the rhizosphere of Chamaecytisus proliferus (tagasaste)
which is a forage legume tree-shrub endemic to the Canary Islands with a concentration of 63
CFU g-1. Univariate parametric analyses allowed better detailing the general picture provided
by PCA analysis.
3.2. Plant biomasses
Taking into account all treatments irrespective of the presence of earthworms, we
found a significant negative effect of the dose of M. luteus on total biomass (P < 0.001),
aboveground biomass (P < 0.001) and belowground biomass (P = 0.002). When restricting the
analysis to the four treatments without earthworms (C0, C1, C2 and C3), we found an almost
significant effect of M. luteus dose on total biomass (P = 0.094), aboveground biomass (P =
0.082), but not on belowground biomass (P = 0.203). The decrease in plant production due to
the maximal dose of M. luteus (107 CFU ml-1 as compared with the control without bacteria)
was significantly higher in the presence of earthworms than in the control with no worms:
37.8 % (P < 0.001) instead of 23.3 (P = 0.21) for total biomass, 63.8% (P = 0.003) instead of
31.2% (P = 0.96) for belowground biomass and 30.1% (P = 0.007) instead of 23.6 (P = 0.16)
for aboveground.
A two-ways ANOVA with earthworms and bacterial inoculums as factors showed that
earthworms had a positive effect on belowground biomass (P = 0.017) and total biomass (P
= 0.076) but not on aboveground biomass (P = 0.530) Restricting the analysis to the
treatments without M. luteus (C0 and E0), we found a significant effect of earthworms on
total biomass (+ 14%, P = 0.017), belowground biomass (+ 85%, P = 0.045), but still not on
aboveground biomass (+ 1.4%, P = 0.762).
When considering all data, total biomass and root biomass were affected by the
interaction between earthworm and M. luteus although threshold for statistical significance
were not attained (P = 0.097 and 0.153 respectively).
tel-0
0804
633,
ver
sion
1 -
26 M
ar 2
013
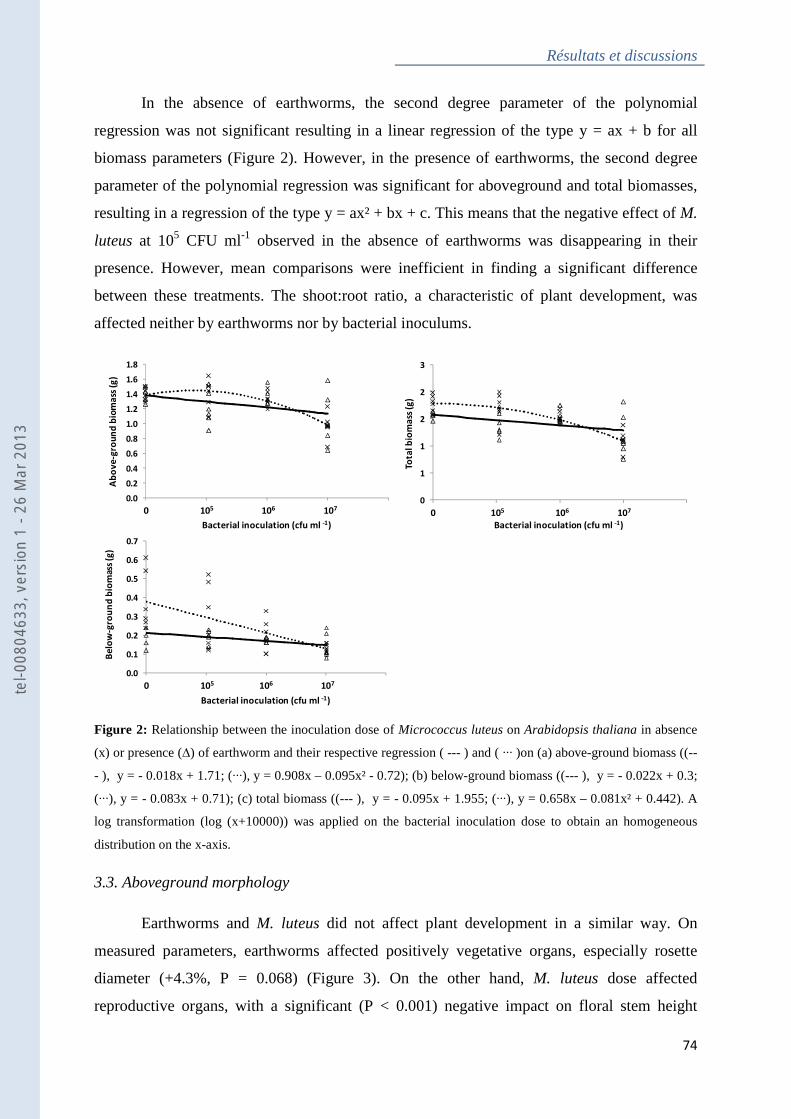
Résultats et discussions
74
In the absence of earthworms, the second degree parameter of the polynomial
regression was not significant resulting in a linear regression of the type y = ax + b for all
biomass parameters (Figure 2). However, in the presence of earthworms, the second degree
parameter of the polynomial regression was significant for aboveground and total biomasses,
resulting in a regression of the type y = ax² + bx + c. This means that the negative effect of M.
luteus at 105 CFU ml-1 observed in the absence of earthworms was disappearing in their
presence. However, mean comparisons were inefficient in finding a significant difference
between these treatments. The shoot:root ratio, a characteristic of plant development, was
affected neither by earthworms nor by bacterial inoculums.
Figure 2: Relationship between the inoculation dose of Micrococcus luteus on Arabidopsis thaliana in absence
(x) or presence (∆) of earthworm and their respective regression ( --- ) and ( ··· )on (a) above-ground biomass ((--
- ), y = - 0.018x + 1.71; (···), y = 0.908x – 0.095x² - 0.72); (b) below-ground biomass ((--- ), y = - 0.022x + 0.3;
(···), y = - 0.083x + 0.71); (c) total biomass ((--- ), y = - 0.095x + 1.955; (···), y = 0.658x – 0.081x² + 0.442). A
log transformation (log (x+10000)) was applied on the bacterial inoculation dose to obtain an homogeneous
distribution on the x-axis.
3.3. Aboveground morphology
Earthworms and M. luteus did not affect plant development in a similar way. On
measured parameters, earthworms affected positively vegetative organs, especially rosette
diameter (+4.3%, P = 0.068) (Figure 3). On the other hand, M. luteus dose affected
reproductive organs, with a significant (P < 0.001) negative impact on floral stem height
0
1
1
2
2
3
Tota
l bio
ma
ss (
g)
Bacterial inoculation (cfu ml -1)
0 105 106 107
0.0
0.2
0.4
0.6
0.8
1.0
1.2
1.4
1.6
1.8
Ab
ov
e-g
rou
nd
bio
ma
ss (
g)
Bacterial inoculation (cfu ml -1)
0 105 106 107
0.0
0.1
0.2
0.3
0.4
0.5
0.6
0.7
Be
low
-gro
un
d b
iom
ass
(g)
Bacterial inoculation (cfu ml -1)
0 105 106 107tel-0
0804
633,
ver
sion
1 -
26 M
ar 2
013
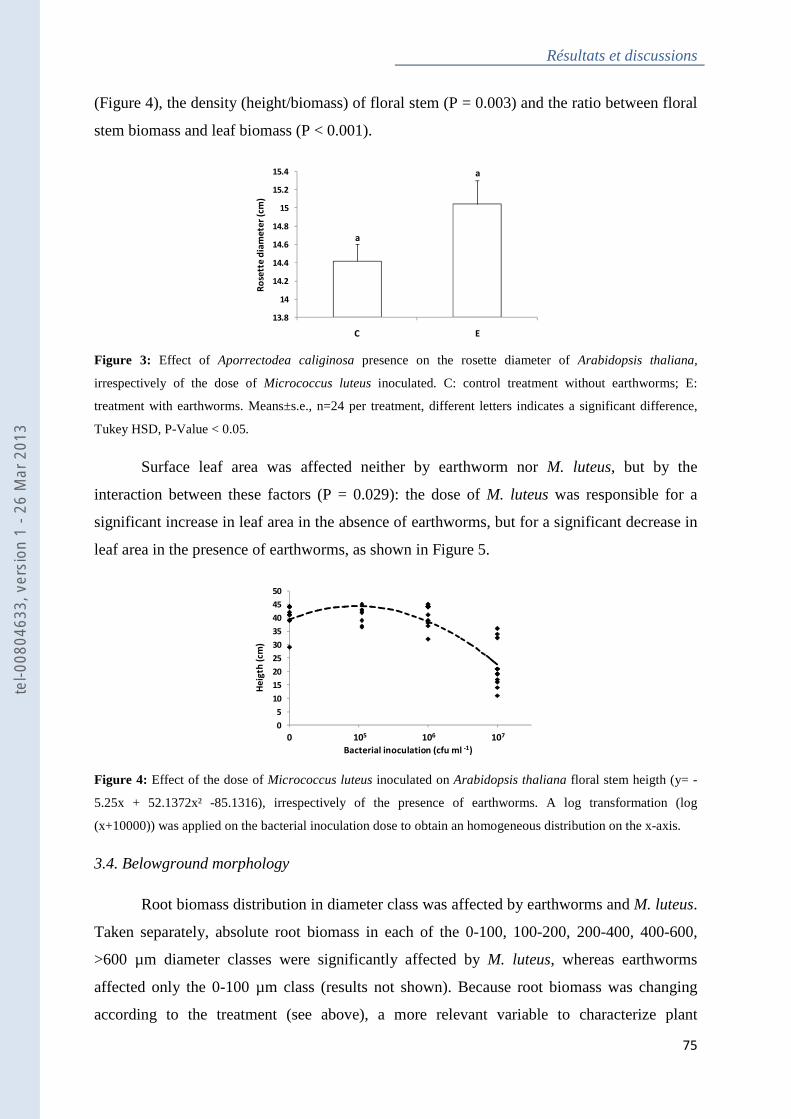
Résultats et discussions
75
(Figure 4), the density (height/biomass) of floral stem (P = 0.003) and the ratio between floral
stem biomass and leaf biomass (P < 0.001).
Figure 3: Effect of Aporrectodea caliginosa presence on the rosette diameter of Arabidopsis thaliana,
irrespectively of the dose of Micrococcus luteus inoculated. C: control treatment without earthworms; E:
treatment with earthworms. Means±s.e., n=24 per treatment, different letters indicates a significant difference,
Tukey HSD, P-Value < 0.05.
Surface leaf area was affected neither by earthworm nor M. luteus, but by the
interaction between these factors (P = 0.029): the dose of M. luteus was responsible for a
significant increase in leaf area in the absence of earthworms, but for a significant decrease in
leaf area in the presence of earthworms, as shown in Figure 5.
Figure 4: Effect of the dose of Micrococcus luteus inoculated on Arabidopsis thaliana floral stem heigth (y= -
5.25x + 52.1372x² -85.1316), irrespectively of the presence of earthworms. A log transformation (log
(x+10000)) was applied on the bacterial inoculation dose to obtain an homogeneous distribution on the x-axis.
3.4. Belowground morphology
Root biomass distribution in diameter class was affected by earthworms and M. luteus.
Taken separately, absolute root biomass in each of the 0-100, 100-200, 200-400, 400-600,
>600 µm diameter classes were significantly affected by M. luteus, whereas earthworms
affected only the 0-100 µm class (results not shown). Because root biomass was changing
according to the treatment (see above), a more relevant variable to characterize plant
a
a
13.8
14
14.2
14.4
14.6
14.8
15
15.2
15.4
C E
Ro
sett
e d
iam
ete
r (c
m)
0
5
10
15
20
25
30
35
40
45
50
He
igth
(cm
)
Bacterial inoculation (cfu ml -1)
0 105 106 107
tel-0
0804
633,
ver
sion
1 -
26 M
ar 2
013
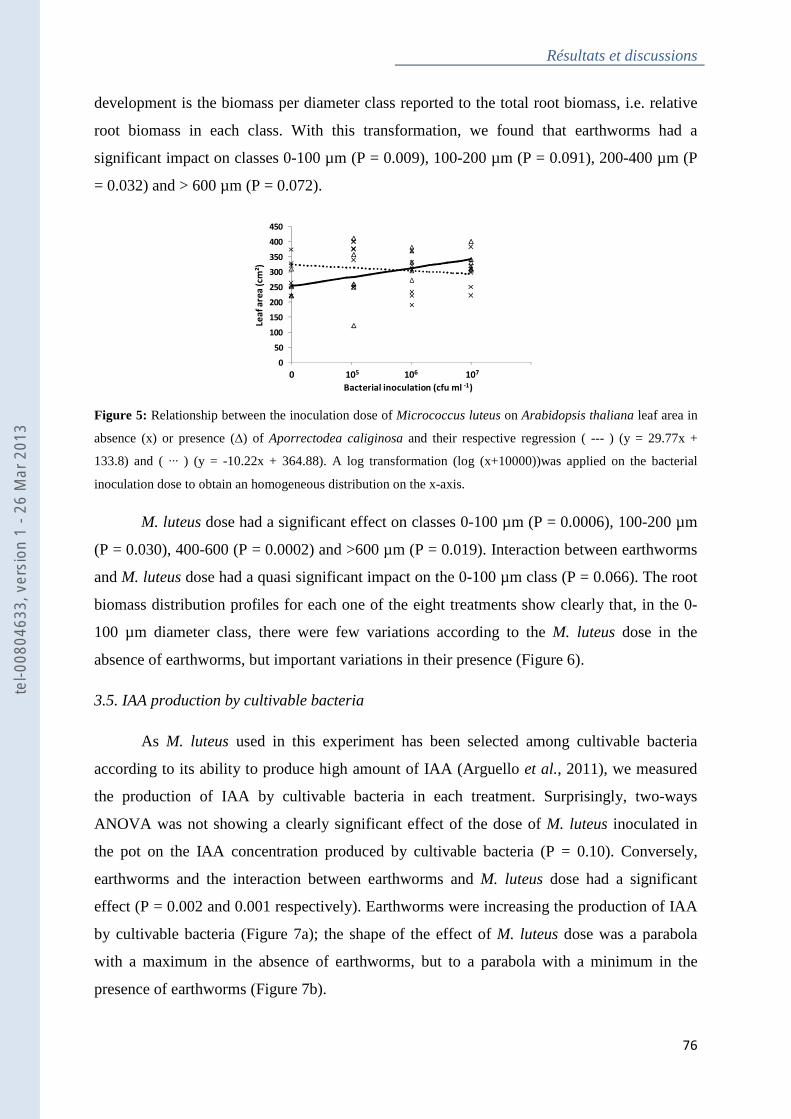
Résultats et discussions
76
development is the biomass per diameter class reported to the total root biomass, i.e. relative
root biomass in each class. With this transformation, we found that earthworms had a
significant impact on classes 0-100 µm (P = 0.009), 100-200 µm (P = 0.091), 200-400 µm (P
= 0.032) and > 600 µm (P = 0.072).
Figure 5: Relationship between the inoculation dose of Micrococcus luteus on Arabidopsis thaliana leaf area in
absence (x) or presence (∆) of Aporrectodea caliginosa and their respective regression ( --- ) (y = 29.77x +
133.8) and ( ··· ) (y = -10.22x + 364.88). A log transformation (log (x+10000))was applied on the bacterial
inoculation dose to obtain an homogeneous distribution on the x-axis.
M. luteus dose had a significant effect on classes 0-100 µm (P = 0.0006), 100-200 µm
(P = 0.030), 400-600 (P = 0.0002) and >600 µm (P = 0.019). Interaction between earthworms
and M. luteus dose had a quasi significant impact on the 0-100 µm class (P = 0.066). The root
biomass distribution profiles for each one of the eight treatments show clearly that, in the 0-
100 µm diameter class, there were few variations according to the M. luteus dose in the
absence of earthworms, but important variations in their presence (Figure 6).
3.5. IAA production by cultivable bacteria
As M. luteus used in this experiment has been selected among cultivable bacteria
according to its ability to produce high amount of IAA (Arguello et al., 2011), we measured
the production of IAA by cultivable bacteria in each treatment. Surprisingly, two-ways
ANOVA was not showing a clearly significant effect of the dose of M. luteus inoculated in
the pot on the IAA concentration produced by cultivable bacteria (P = 0.10). Conversely,
earthworms and the interaction between earthworms and M. luteus dose had a significant
effect (P = 0.002 and 0.001 respectively). Earthworms were increasing the production of IAA
by cultivable bacteria (Figure 7a); the shape of the effect of M. luteus dose was a parabola
with a maximum in the absence of earthworms, but to a parabola with a minimum in the
presence of earthworms (Figure 7b).
0
50
100
150
200
250
300
350
400
450
Lea
f a
rea
(cm
²)
Bacterial inoculation (cfu ml -1)
0 105 106 107
tel-0
0804
633,
ver
sion
1 -
26 M
ar 2
013
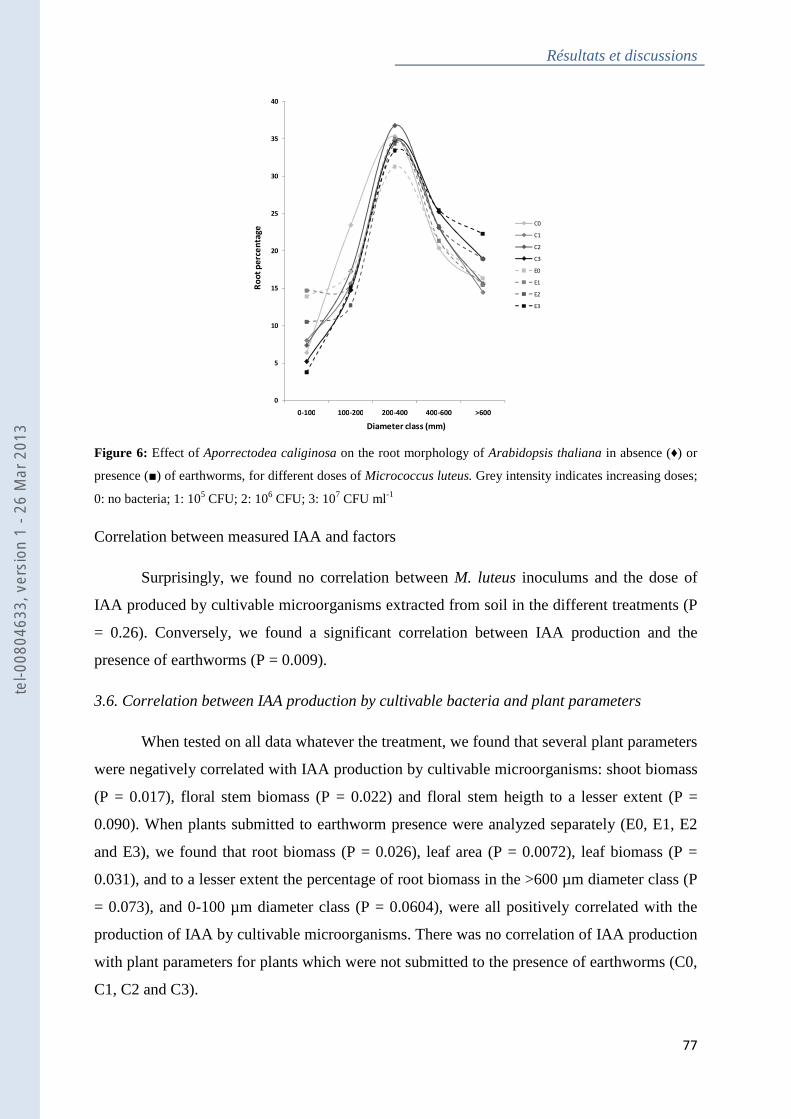
Résultats et discussions
77
Figure 6: Effect of Aporrectodea caliginosa on the root morphology of Arabidopsis thaliana in absence (♦) or
presence (■) of earthworms, for different doses of Micrococcus luteus. Grey intensity indicates increasing doses;
0: no bacteria; 1: 105 CFU; 2: 106 CFU; 3: 107 CFU ml-1
Correlation between measured IAA and factors
Surprisingly, we found no correlation between M. luteus inoculums and the dose of
IAA produced by cultivable microorganisms extracted from soil in the different treatments (P
= 0.26). Conversely, we found a significant correlation between IAA production and the
presence of earthworms (P = 0.009).
3.6. Correlation between IAA production by cultivable bacteria and plant parameters
When tested on all data whatever the treatment, we found that several plant parameters
were negatively correlated with IAA production by cultivable microorganisms: shoot biomass
(P = 0.017), floral stem biomass (P = 0.022) and floral stem heigth to a lesser extent (P =
0.090). When plants submitted to earthworm presence were analyzed separately (E0, E1, E2
and E3), we found that root biomass (P = 0.026), leaf area (P = 0.0072), leaf biomass (P =
0.031), and to a lesser extent the percentage of root biomass in the >600 µm diameter class (P
= 0.073), and 0-100 µm diameter class (P = 0.0604), were all positively correlated with the
production of IAA by cultivable microorganisms. There was no correlation of IAA production
with plant parameters for plants which were not submitted to the presence of earthworms (C0,
C1, C2 and C3).
0
5
10
15
20
25
30
35
40
0-100 100-200 200-400 400-600 >600
Ro
ot
pe
rce
nta
ge
Diameter class (mm)
C0
C1
C2
C3
E0
E1
E2
E3
tel-0
0804
633,
ver
sion
1 -
26 M
ar 2
013
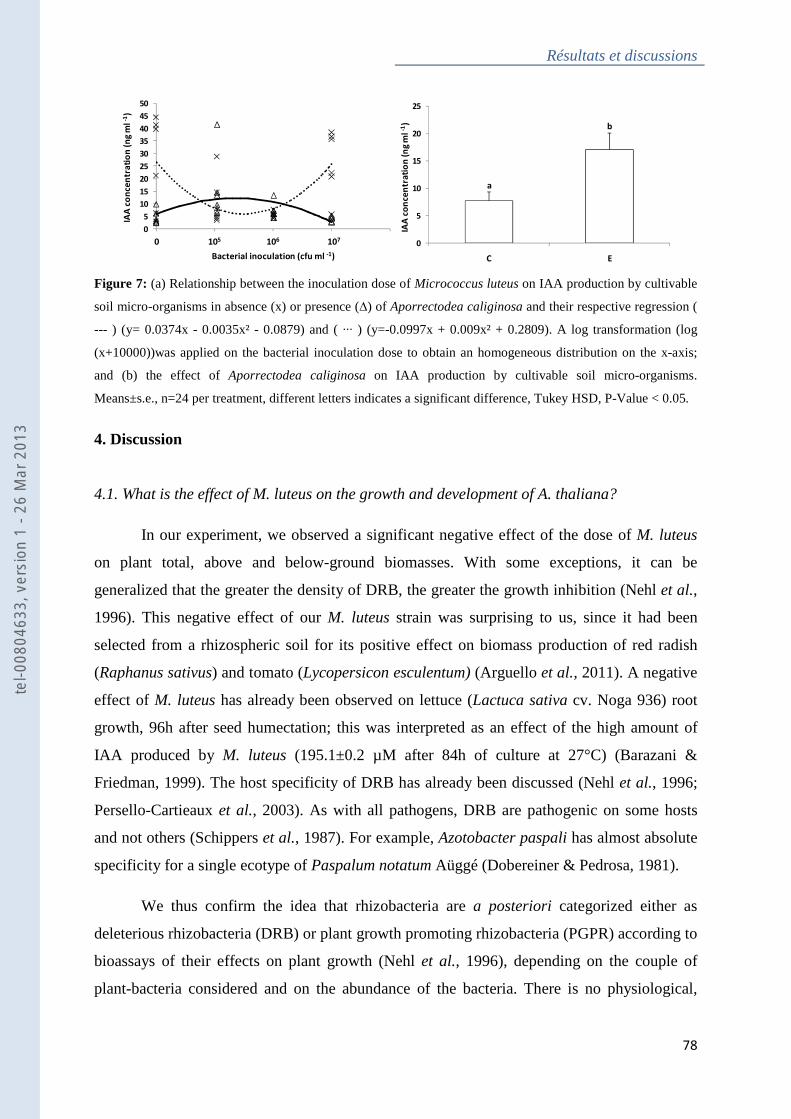
Résultats et discussions
78
Figure 7: (a) Relationship between the inoculation dose of Micrococcus luteus on IAA production by cultivable
soil micro-organisms in absence (x) or presence (∆) of Aporrectodea caliginosa and their respective regression (
--- ) (y= 0.0374x - 0.0035x² - 0.0879) and ( ··· ) (y=-0.0997x + 0.009x² + 0.2809). A log transformation (log
(x+10000))was applied on the bacterial inoculation dose to obtain an homogeneous distribution on the x-axis;
and (b) the effect of Aporrectodea caliginosa on IAA production by cultivable soil micro-organisms.
Means±s.e., n=24 per treatment, different letters indicates a significant difference, Tukey HSD, P-Value < 0.05.
4. Discussion
4.1. What is the effect of M. luteus on the growth and development of A. thaliana?
In our experiment, we observed a significant negative effect of the dose of M. luteus
on plant total, above and below-ground biomasses. With some exceptions, it can be
generalized that the greater the density of DRB, the greater the growth inhibition (Nehl et al.,
1996). This negative effect of our M. luteus strain was surprising to us, since it had been
selected from a rhizospheric soil for its positive effect on biomass production of red radish
(Raphanus sativus) and tomato (Lycopersicon esculentum) (Arguello et al., 2011). A negative
effect of M. luteus has already been observed on lettuce (Lactuca sativa cv. Noga 936) root
growth, 96h after seed humectation; this was interpreted as an effect of the high amount of
IAA produced by M. luteus (195.1±0.2 µM after 84h of culture at 27°C) (Barazani &
Friedman, 1999). The host specificity of DRB has already been discussed (Nehl et al., 1996;
Persello-Cartieaux et al., 2003). As with all pathogens, DRB are pathogenic on some hosts
and not others (Schippers et al., 1987). For example, Azotobacter paspali has almost absolute
specificity for a single ecotype of Paspalum notatum Aüggé (Dobereiner & Pedrosa, 1981).
We thus confirm the idea that rhizobacteria are a posteriori categorized either as
deleterious rhizobacteria (DRB) or plant growth promoting rhizobacteria (PGPR) according to
bioassays of their effects on plant growth (Nehl et al., 1996), depending on the couple of
plant-bacteria considered and on the abundance of the bacteria. There is no physiological,
0
5
10
15
20
25
30
35
40
45
50
IAA
co
nce
ntr
ati
on
(n
g m
l -1)
Bacterial inoculation (cfu ml -1)
0 105 106 107
a
b
0
5
10
15
20
25
C E
IAA
co
nce
ntr
ati
on
(n
g m
l -1)
tel-0
0804
633,
ver
sion
1 -
26 M
ar 2
013
Résultats et discussions
79
morphological or other characteristic identified so far as an indicator of the effect of
rhizobacteria on plants (Schroth & Hancock, 1982).
4.2. Is there a control due to the presence of earthworms?
In our experiment, earthworms had a positive effect on plant growth (especially roots)
when no bacteria were inoculated. This positive earthworm effect however decreased with the
dose of M. luteus, and finally disappeared at 107 CFU ml-1 (Figure 2). The slope of the
regression line for root biomass was more negative in the presence than in the absence of
earthworms (Figure 2b). This reveals that instead of a control of M. luteus effect by
earthworms, we observed a disappearance of earthworm positive effect when the inoculum of
M. luteus was increasing. The earthworm Aporrectodea caliginosa is thus not relevant to be
used as a biocontrol agent against M. luteus for Arabidopsis thaliana in edaphic and climatic
conditions set in this experiment.
4.3. What can we learn about the mechanism of action of M. luteus and earthworms?
Several mechanisms have been proposed to explain the negative effect of DRB on
plant growth (see (Nehl et al., 1996) for a detailed review). An interesting mechanism which
could explain both negative and positive effects on plant growth could be that inhibitory or
promoting effects of DRB and PGPR respectively are due to the production of IAA by
bacteria. Up to 80% of rhizobacteria can synthesize indole-3-acetic acid (IAA) (Loper &
Schroth, 1986). Root growth promotion by free living PGPR, e.g., Alcaligenes faecalis,
Enterobacter cloacae, Acetobacter diazotrophicus, species of Azospirillum, Pseudomonas,
and Xanthomonas, as well as by symbionts, such as Bradyrhizobium japonicum and
Rhizobium spp., has been related to low levels of IAA secretion (Patten & Click, 1996). In
contrast, the inhibitory effect of some deleterious rhizobacteria (DRB) has been related to
high amounts of IAA excretion, e.g., Enterobacter taylorae (Sarwar & Kremer, 1995) and
Pseudomonas putida (Xie et al., 1996). In a convincing study, bacteria responsible for the
suppression of root growth (M. luteus, Streptoverticillium sp., Pseudomonas putida, and
Gluconobacter sp.) were shown to produce high levels of IAA (76.6 MM), whereas four
isolates responsible for a positive effect on plant growth (Agrobacterium sp., Alcaligenes
piechaudii, and two different strains of Comamonas acidovorans) secreted lower levels of
IAA (16.4 MM) (Barazani & Friedman, 1999). A similar conclusion could be drawn from the
effect of several concentrations of Pseudomonas thivervalensis (an IAA-producing strain) on
Arabidopsis root length and branching (Persello-Cartieaux et al., 2001): an inoculum of 105
tel-0
0804
633,
ver
sion
1 -
26 M
ar 2
013
Résultats et discussions
80
CFU ml-1 gave reproducible developmental and morphological changes on colonized plantlets
whereas above 106 CFU ml-1 the bacterization caused irreversible damage to plants. An
important consideration in predicting whether IAA-producing bacteria stimulate or inhibit
root growth is therefore the concentration of IAA that would actually be disposable for plants
(Persello-Cartieaux et al., 2003).
The level of IAA produced by M. luteus is one of the highest observed among a high
number of cultivable bacteria retrieved from plant rhizosphere, i.e. 195.1 µM (Barazani &
Friedman, 1999). In our study, the decrease in plant biomass as the bacterial inoculum
increased could thus be explained in a first attempt by the fact that IAA production per
bacteria or bacterial population are too high to induce positive effect on plant, even at 105
CFU ml-1. However, we did not observe correlation between M. luteus dose and the
production of IAA by cultivable bacteria extracted from the soil at the end of the experiment
(see Results section). As M. luteus has been isolated in the same way than we cultivated
bacteria for IAA production assessment, this is probably not due to the extraction procedure.
There was probably a factor responsible for the decorrelation between M. luteus dose and the
production of IAA by cultivable bacteria. Above a given threshold at which the dose of
bacteria and/or IAA becomes harmful, the plant itself could have exerted a control on IAA
producing bacteria, by maintaining them at low density in the soil, or at a physiological state
which is not associated with a high IAA production. Indeed, it has been demonstrated that
plant can take an active part in the regulation of microbial IAA biosynthesis. For example,
transcription of ipdC, an Erwinia IAA biosynthetic gene, is induced in response to bean and
tobacco compounds (Brandl & Lindow, 1997). As the capability to produce auxins from
tryptophan is common among soil micro-organisms, it is tempting to assume that bacterial
auxin synthesis is dependent upon plant-exuded tryptophan (Persello-Cartieaux et al., 2003).
By reducing tryptophan exudation, plant could thus limit the production of IAA by
microorganisms.
The story complicated again when integrating the effect of earthworms: statistical
analyses showed that earthworm presence was associated with a higher level of IAA
production, and that the interaction between M. luteus dose and earthworms also had a
significant effect on IAA production (Figure 7b). We could imagine that earthworms have
stimulated M. luteus population growth or its production of IAA at 105 CFU ml-1, plant was
responsible for an inhibition of IAA production at 106 CFU ml-1, but was no more able to
control bacteria population when 107 CFU ml-1 were inoculated in the presence of
tel-0
0804
633,
ver
sion
1 -
26 M
ar 2
013
Résultats et discussions
81
earthworms, explaining the increase in IAA production and the decrease in plant biomass
(Figure 2).
Finally, we only measured IAA production by microorganisms extracted at one single
time, not the kinetic of IAA production. However, it is likely that both earthworms and
bacteria have not produced signal molecule exactly at the same rate along the experiment. In
fact, earthworms affected vegetative stages (Figure 3), whereas M. luteus affected floral
stages (Figure 4). A survey of IAA production all along the experiment will probably greatly
improve our understanding of biotic interactions through signal molecules. In addition, other
parameters such as leaf area (Figure 5) or root biomass distribution in diameter class (Figure
6) were affected only by the interaction between M. luteus and A. caliginosa, suggesting that
synergistic effects of both the organisms could be determinant for specific parameters of plant
development. This could be explained by the diversity of signal molecules in general, or the
diversity of auxines (e.g. IAA, IALD, ILA…), which could potentially be involved in plant
growth promotion or inhibition (Sarwar & Kremer, 1995). More investigations are needed to
understand the consequence of this molecule cocktail and its kinetic.
4.4. Conclusion
In this study, we observe that M. luteus, a bacteria selected for its high IAA production
and a positive effect on red radish (Raphanus sativus) and tomato (Lycopersicon esculentum),
was responsible for a density dependant negative effect on Arabidopsis thaliana biomass
production, whereas the earthworm Aporrectodea caliginosa was responsible for a positive
effect. When testing the possibility to use this earthworm as a biocontrol agent of the
Deleterious Rhizo-Bacteria, we found the opposite result from what we expected: the negative
effect of the bacteria observed at the highest density was the same in the presence or absence
of earthworms, i.e. the positive effect of earthworms disappeared. The exact mechanisms
involved in earthworms and M. luteus effects are still to unravel. If both have been proposed
to be due to signal molecules such as IAA, our experiment stresses on the need for a temporal
analysis of IAA production, and the development of screening methods to identify the
diversity of signal molecules produced in the presence of micro and macro-organisms. Such a
better understanding of signal molecules could be of major help in developing alternative
agricultural practices through soil ecological engineering.
Acknowledgements
This work has been supported by the University Paris-Est Créteil.
tel-0
0804
633,
ver
sion
1 -
26 M
ar 2
013
Résultats et discussions
82
Chapitre 4 : Impact du vers de terre Aporrectodea caliginosa sur la pathogénicité du piétin échaudage du blé
tel-0
0804
633,
ver
sion
1 -
26 M
ar 2
013
Résultats et discussions
83
Avant propos
Les vers de terre semblent capables d’induire des mécanismes de résistance
systémique induite (ISR) chez A. thaliana (Puga-Freitas et al., accepted). Ce mécanisme passe
par la stimulation de certaines populations de PGPR. Cette induction d’une ISR par les vers
de terre pourrait être à l’origine de l’impact significatif qu’ont les vers de terre sur la
réduction de certaines maladies des plantes (Stephens et al., 1994; Blouin et al., 2005; Elmer,
2009). Cependant, l’induction d’un mécanisme d’ISR chez les plantes par les PGPR est
fortement dépendante du génotype de la plante. Afin de conforter les résultats obtenus avec A.
thaliana il serait donc intéressant d’étudier l’impact du vers de terre sur une maladie affectant
une autre espèce de plante, notamment d’intérêt agronomique.
Dans cette étude, nous avons étudié l’impact des vers de terre A. caliginosa sur la
maladie du piétin échaudage affectant le blé (Triticum aestivum). Dans une expérimentation
en serre, la sévérité de cette maladie appelée piétin échaudage, et causée par le champignon
pathogène Gaeumannomyces graminis var tritici , est réduite en présence de vers de terre. Ces
résultats viennent confirmer le rôle du vers de terre comme agent de contrôle biologique
efficace dans la suppression de cette maladie (Stephens et al., 1994; Stephens & Davoren,
1995). L’étude du transcriptome du blé en réponse à A. caliginosa ne présente pas de
modifications similaires à celles induites sur le transcriptome d’A. thaliana. Ceci souligne que
l’issue de l’action des vers de terre sur les plantes, mécanisme qui semble dépendant des
bactéries de la rhizopshère, est difficilement prédictible. Concernant la maladie, la sévérité
semble due à une manipulation par le champignon des mécanismes de défense basale de la
plante ainsi que d’une dérégulation des voies de biosynthèse et de la signalisation de
nombreuses hormones végétales. Cette dérégulation est un mécanisme connu, qui est induit
lors de l’infection par de nombreux champignons tels que Botrytis cinerea, afin de faciliter
l’infection. Sur les plantes infectées, la présence de vers de terre n’a qu’une faible incidence
sur la dérégulation de ces gènes. Ceci suggère que la réduction de la sévérité de la maladie par
les vers de terre passe probablement par un autre mécanisme que l’induction de résistance
systémique chez la plante. Les vers de terre ne changeant pas les propriétés chimiques du sol
dans un sens qui pourrait être néfaste pour la maladie, l’hypothèse la plus parcimonieuse au
regard de la littérature serait un changement au niveau de la composition microbienne de la
rhizosphère. Certains sols ont été identifiés comme n’étant pas compatibles avec le
développement de cette maladie. Cette incompatibilité a été corrélée avec la structure des
tel-0
0804
633,
ver
sion
1 -
26 M
ar 2
013
communautés microbiennes de ces sols. Les vers de terre stimulent des commu
microbiennes, en particulier des bactéries, ce qui pourrait augmenter la compétition pour les
ressources et défavoriser le piétin qui est sensible à la compétition
bactéries pourraient également émettre des composés antibiotiques nuisibles pour le
champignon. Même si le transcriptome du blé reste fortement dérégulé, l’antagonisme des
bactéries du sol avec le piétin
conséquence la sévérité de la maladie.
Cette étude fait l’objet d’un article
soumission à Molecular Plant-
Le tableau supplémentaire (
Figure 12 : Synthèse des résultats de l’effet du vers de terre piétin échaudage chez le blé (Triticum aestivuchampignon tellurique Gaeumannomyces graminiscroissance du blé. L’analyse du transcriptome du blé en réponse à l’attaque de ce champignon révèforte modulation de l’expression de gènes impliqués dans la réponse hypersensible et dans la voie de signalisation de nombreuses hormones végétales. Ces hormones végétales sont impliquées dans (a) des processus de croissance et (b) des mécanismes deimpliqués dans des mécanismes de résistance par le champignon va probablement faciliter la progression de la maladie. En présence de vers de terre, l’incidence de la maladie est fortement réduite. Cependant,ver de terre ne semble pas modifier la réponse de la plante comme suggéré par l’absence de différence au niveau du transcriptome. Le mode d’action des vers de terre semble passer par pathogène (prédation ou modification de l’envpopulations de PGPR. Ces populations de PGPR pourraient avoir (c) une action antagoniste sur le piétin à travers la synthèse de composés antibiotiques ou encore via une compétition pour les nutriments.
Résultats et discussions
communautés microbiennes de ces sols. Les vers de terre stimulent des commu
microbiennes, en particulier des bactéries, ce qui pourrait augmenter la compétition pour les
ressources et défavoriser le piétin qui est sensible à la compétition (
bactéries pourraient également émettre des composés antibiotiques nuisibles pour le
champignon. Même si le transcriptome du blé reste fortement dérégulé, l’antagonisme des
u sol avec le piétin pourrait ralentir la progression du mycélium
conséquence la sévérité de la maladie.
Cette étude fait l’objet d’un article qui est en cours de rédaction, en vue d’une
-Microbe Interaction.
tableau supplémentaire (Supplementary Table 1) est fourni en Annexe 1
: Synthèse des résultats de l’effet du vers de terre A. caliginosa sur l’incidence de la maladie du Triticum aestivum). La maladie du piétin échaudage, causée par (1) le
Gaeumannomyces graminis var tritici est responsable (a) d’un impact négatif sur la croissance du blé. L’analyse du transcriptome du blé en réponse à l’attaque de ce champignon révèforte modulation de l’expression de gènes impliqués dans la réponse hypersensible et dans la voie de signalisation de nombreuses hormones végétales. Ces hormones végétales sont impliquées dans (a) des processus de croissance et (b) des mécanismes de défense. La modulation de l’expression de gènes impliqués dans des mécanismes de résistance par le champignon va probablement faciliter la progression de la maladie. En présence de vers de terre, l’incidence de la maladie est fortement réduite. Cependant,ver de terre ne semble pas modifier la réponse de la plante comme suggéré par l’absence de différence au niveau du transcriptome. Le mode d’action des vers de terre semble passer par un effet pathogène (prédation ou modification de l’environnement) ou via la simulation de (2) certaines populations de PGPR. Ces populations de PGPR pourraient avoir (c) une action antagoniste sur le piétin à travers la synthèse de composés antibiotiques ou encore via une compétition pour les nutriments.
Résultats et discussions
84
communautés microbiennes de ces sols. Les vers de terre stimulent des communautés
microbiennes, en particulier des bactéries, ce qui pourrait augmenter la compétition pour les
(Cook, 2003). Ces
bactéries pourraient également émettre des composés antibiotiques nuisibles pour le
champignon. Même si le transcriptome du blé reste fortement dérégulé, l’antagonisme des
ralentir la progression du mycélium, réduisant en
en cours de rédaction, en vue d’une
en Annexe 1.
sur l’incidence de la maladie du ). La maladie du piétin échaudage, causée par (1) le
est responsable (a) d’un impact négatif sur la croissance du blé. L’analyse du transcriptome du blé en réponse à l’attaque de ce champignon révèle une forte modulation de l’expression de gènes impliqués dans la réponse hypersensible et dans la voie de signalisation de nombreuses hormones végétales. Ces hormones végétales sont impliquées dans (a) des
défense. La modulation de l’expression de gènes impliqués dans des mécanismes de résistance par le champignon va probablement faciliter la progression de la maladie. En présence de vers de terre, l’incidence de la maladie est fortement réduite. Cependant, le ver de terre ne semble pas modifier la réponse de la plante comme suggéré par l’absence de différence au
un effet direct sur le la simulation de (2) certaines
populations de PGPR. Ces populations de PGPR pourraient avoir (c) une action antagoniste sur le piétin à travers la synthèse de composés antibiotiques ou encore via une compétition pour les nutriments.
tel-0
0804
633,
ver
sion
1 -
26 M
ar 2
013
Résultats et discussions
85
Title
Take-all disease involves hypersensitive response and hormonal control of wheat by the
pathogenic fungus Gaeumannomyces graminis var tritici , which can be depleted in the
presence of the earthworm Aporrectodea caliginosa.
Authors
Ruben Puga-Freitas1, Lamia Belkacem2, Sébastien Barot3, Jean Roger-Estrade2, Michel
Bertrand2, Manuel Blouin1
Affiliations
1UMR Biogéochimie et Ecologie des Milieux Continentaux, Université Paris-Est, 61 avenue
du Général De Gaulle, 94010 Créteil cedex, France
2UMR 211 INRA/AgroParisTech. Thiverval-Grignon, 78850, France
3UMR Biogéochimie et Ecologie des Milieux Continentaux, IRD, Ecole Normale Supérieure,
46 rue d’Ulm, 75230 Paris cedex 5, France
Corresponding author
Puga-Freitas Ruben
tel: +33 1 45 17 16 14
UMR Biogéochimie et Ecologie des Milieux Continentaux, Université Paris-Est,
61 avenue du Général De Gaulle, 94010 Créteil cedex, France
tel-0
0804
633,
ver
sion
1 -
26 M
ar 2
013
Résultats et discussions
86
Abstract
The take-all disease caused by the soilborne fungus Gaeumannomyces graminis var
tritici (Ggt) is one of the most-studied and widespread root diseases worldwide. Through the
deterioration of roots, this fungus disrupts the water flow to the shoots, causing the death of
plants. The actual absence of plant genetic resistance and efficient fungicide against this
disease stimulate the development of alternative management strategies such as crop-rotation
or the use of biological control agent such as earthworms. Here, we investigated the ability of
the earthworm Aporrectodea caliginosa to induce take-all disease tolerance in wheat. In a
greenhouse experiment, we compared the effect of earthworms, G. graminis and the presence
of both the organisms on wheat growth, development and resistance to take-all. Gene
expression was studied by transcriptome analysis to get some insights in the mechanisms
involved in earthworm and G. graminis effects on plants. Our results showed that G. graminis
was responsible for a lower growth of plant shoots, whereas earthworms were responsible for
an increase in plant height as compared with the control plants during a first phase, which
then disappeared. At the end of the experiment, G. graminis had a strong negative impact with
an 81% and 83% decrease in wheat root and shoot biomass respectively. However, when
earthworms were present in association with G. graminis, the density of necrosis was
significantly reduced by 63%, and no significant reduction in plant growth was observed in
comparison with control plants. Earthworms were thus responsible to take-all disease
suppression. As far as mechanisms are concerned, 212, 1461 and 1717 genes were
differentially expressed as compared with the control in the presence of earthworms, G.
graminis and both the organisms respectively. Genes involved in the hypersensitive response
and in many hormones signaling pathways were modulated during the disease induced by G.
graminis. This manipulation of plant metabolism by these mechanisms is known to be
induced by several pathogens in a way that facilitates their infection. Mechanisms involved in
the reduction of take-all severity by earthworms did not seem to modify hypersensitive
response and hormonal pathways, as suggested in literature. Rather, earthworms were likely
to act directly on the pathogen or by stimulating soil microorganisms which have an
antagonistic effect on G. graminis. Our study provides new insights on molecular mechanisms
involved in take-all disease and shows the high potential of earthworms in the control of take-
all disease of wheat.
tel-0
0804
633,
ver
sion
1 -
26 M
ar 2
013
Résultats et discussions
87
Introduction
Take-all disease caused by the soilborne fungus Gaemmanomyces graminis var. tritici
(Ggt) is the most widespread and studied root disease of winter wheat. Besides the infection
of wheat, it also affects barley and rye in a lesser extent and occurs particularly in areas of
intensive and continuous cultivation of cereals. This fungus, growth as superficial mycelium
on roots and produce feeder hyphae that penetrate root tissues and colonize the cortex leading
to the destruction of the root system (Cook, 2003; Freeman & Ward, 2004; Agrios, 2005).
Then the pathogen remains into the soil and survives saprophytically in the dead roots and
stem bases used as food source to infect the next host crop. Nevertheless, molecular
mechanisms involved in G. graminis infection are still unknown.
Neither the absence of host plant resistance nor effective fungicides are efficient
(Cook, 2003; Freeman & Ward, 2004). This has led to develop alternative control
management (for Review see Cook, 2003). Chemical control which principally consists in the
use of soil fumigants appears to be not affordable for an agronomic crop such as wheat (Cook,
2003). At this time, take-all decline depends primarily on cultural practices, in particular crop
rotation with non host plants to beak the infestation cycle. Another cultural control use
fertilization such as ammonium rather than nitrate to make the wheat rhizosphere more acidic
and detrimental to G. graminis (Cook, 2003). A great deal of last decades research has been to
try to discover and develop biological controls of take-all. Some soils were shown to be
suppressive to take-all, whereas others were conductive to the disease (Freeman & Ward,
2004). Efforts to isolate the cause of this suppression focused primarily on isolating
microorganisms antagonist to these pathogen (Freeman & Ward, 2004) from soil where take-
all decline was observed.
It has been shown that take-all decline (soil suppressiveness) was brought about by
root-colonizing bacteria that are antagonistic to G. graminis and inhibit its growth on the root
surface. Bacterial strains have been found that inhibit the fungus effectively in laboratory
tests. Among these bacterial strains, Pseudomonas fluorescens has a high potential as an
efficient biological control agent (Chapon et al., 2002; Cook, 2003; Freeman & Ward, 2004;
Daval et al., 2011). But in vitro screening or pot experiments are not necessarily effective in
the field (Freeman & Ward, 2004).
Among other biological control agents, earthworms have already be showed to be
effective against G. graminis (Stephens et al., 1994; Stephens & Davoren, 1995; Clapperton
tel-0
0804
633,
ver
sion
1 -
26 M
ar 2
013
Résultats et discussions
88
et al., 2001) and several others plant pathogens such as Plasmodiophora brassicae, Fusarium
oxysporum, Heterodera sacchari or Venturia inaequalis (Brown et al., 2004; Elmer, 2009;
Wurst, 2010). Further their reduction of the severity of several plant diseases, mechanisms
through which earthworms act on plant disease are still not understood. Moreover,
earthworms are known to have strong impacts on the N cycle. An additional flux of 63 kg N
ha–1 year–1 through earthworms could count for 38% of the total N uptake by the sorghum
crop (Parmelee & Crossley, 1988); this additional N could help the plant in facing fungal
infection. Earthworms are also an important driver of nitrification, denitrification and
ammonification (Parkin & Berry, 1999). This change in N form between NO3- and NH4
+ can
be associated with a change in soil pH, which could lead to soil alcalinization or acidification,
respectively favorable and harmful for G. graminis.
Here we investigated the potential control of take-all disease by earthworm on wheat
plants. Through a microarray analysis we investigated plant response to G. graminis to
identify the mechanisms involved in the disease and to understand and determine how
earthworms eventually alleviate this disease.
Materials and methods
Soil
Soil was collected at the INRA research center (Thiverval-Grignon, France) in a field
free from wheat, conducted in monoculture of maize, then shorgo. It was dried at 25°C for a
week and sieved at 2 mm mesh size. This soil has the following properties: total organic
carbon content, 27.1 g kg-1; total nitrogen content, 1.28 g kg-1; pH, 8.31; CEC, 14.5 cmol kg-1;
texture: 28.7% clay, 55.1% silt, 16.2% sand.
Earthworms
Aporrectodea caliginosa Savigny (Annelida, Oligochaeta) is an endogeic earthworm
which makes horizontal or randomly oriented burrows, considered to be temporary structures
because they are rarely reused (Sims et al., 1985). In the experiments, living earthworms were
added to the devoted microcosms at a density of 1.8 mg cm-3, close to the one observed in the
field in France (Lavelle & Spain, 2001), 2 weeks after G. graminis inoculation.
tel-0
0804
633,
ver
sion
1 -
26 M
ar 2
013
Résultats et discussions
89
Pathogen inoculation
Soil infestation was made by adding barley infested seeds by G. graminis provided by
the INRA Bio3P (Rennes, France). In devoted experimental units, 1000 propagules
corresponding to 1.60 g of seeds were mixed to the soil. In treatments without pathogen, the
same amount of non-infested barley seeds were mixed to the soil. At the end of the
experiment, for each treatment and experimental unit, the number roots with necrosis lesion
was counted and reported to their respective root biomass. A necrosis index (called necrosis)
was then calculated, corresponding to the amount of necrosis per root biomass.
Experimental protocol
Seeds of Triticum aestivum cv Soisson were purchased from the breeder Florimond-
Desprez (Cappelle-en-Pévèle, France). Seeds were germinated for 48 h and vernalized during
two weeks at 5°C. One week after the introduction of the earthworms, three seeds of wheat
were sown per microcosm and grown in experimental PVC units (10 cm diameter, 15 cm
height, n=10), filled with 900 g DW soil and maintained at 75% of the field capacity by
weighing pots two times a week. Three earthworms (for a total of 1.5 g on average) were
introduced. After one week, three seeds were sown per microcosm and grown in greenhouse
at a density of 24 experimental units per square meter following these conditions: 13 °C and
11 °C day and night temperatures during the first5 days, 19 °C and 13 °C day and night
temperatures from 5 days to the end of the experiment and 75% ± 5% relative humidity.
Root system analysis
Dry root biomass distribution between diameter classes was established according to
the method of Blouin et al. (2007) inspired from granulometry methodology. Briefly,
shredded dry roots were passed through a column of sieves with decreasing mesh sizes;
biomass distribution according to root diameter was assessed by weighing the biomass
recovered in each sieve (Blouin et al., 2007a).
Soil chemical analyses
Total carbon and nitrogen were analyzed by elemental analysis after dry combustion
(NF ISO 10694 and NF ISO 13878). Soil nitrate and ammonium contents were determined by
KCL extraction and quantified by spectrocolorimetry. Phosphorus was determined by
spectrometry (NF ISO 11263). All these analysis were made at the INRA “Laboratoire
tel-0
0804
633,
ver
sion
1 -
26 M
ar 2
013
Résultats et discussions
90
d'Analyse des Sols” (Arras, France). For each treatment, approximately 50 g of soil were
taken from three separate microcosms and used for analysis.
Transcriptome analysis
RNA extraction and microarray analysis
Plant leaves of three replicates of each treatment were sampled after 52 days. RNA
was extracted using the RNeasy Plant Mini Kit (Qiagen, France) with an on-column DNase
digestion using DNase I (Qiagen, France). The quality of the RNAs was assessed by capillary
electrophoresis using the Agilent Bioanalyser (Agilent, Santa Clara, U.S.A.) and its
concentration was measured by its absorbance at 260 nm on a NanoDrop 1000
spectrophotometer (Thermo Fisher Scientific, U.S.A ).
For microarray analysis, total RNA was processed by PartnerChip. This analysis was
performed on Affymetrix GeneChip Wheat Genome arrays containing 61 127 probes sets
corresponding to more than 55 052 Unigene clusters, according to the two-cycle amplification
protocol from the manufacturer (Affymetrix, U.S.A). In brief, 200 ng of total RNA was
reverse transcribed in presence of T7 oligo(dT) primer and Superscript II Reverse
Transcriptase to generate first-strand cDNA. Second-strand was synthesized using DNA
polymerase I and RNaseH. After second-strand synthesis, in vitro transcription was carried
out using T7 RNA polymerase and biotinylated nucleotides analog/ribonucleotide mix for
cRNA labeling (GeneChip IVT Labeling Kit, U.S.A) then cleaned up using the GeneChip
Sample Cleanup Module and quantified by absorbance measurement at 260 nm. The resulting
biotinylated cRNA was fragmented by incubation in a fragmentation buffer at 94°C for 35
min to reduce the fragment size to approximately 100-120 nucleotides. Fragmented cRNA
was hybridized on Affymetrix GeneChip Wheat Genome array for 16 h at 45°C along with
internal hybridization controls. Washing and staining procedures were performed in an
Affymetrix Fluidics Station 450. Probe arrays were exposed to ten washes in non-stringent
wash buffer A (6x SSPE, 0.01% Tween20) at 30°C, followed by six washes in stringent
buffer B (100mM MES, 0.1M [Na+], and 0.01% Tween20) at 50°C. Biotinylated cRNA were
stained with a streptavidin–phycoerythrin conjugate (SAPE, 10 µg ml-1) and washed again 10
times with non-stringent buffer A. Finally, arrays were scanned in an Affymetrix GeneChip
Scanner 3000.
tel-0
0804
633,
ver
sion
1 -
26 M
ar 2
013
Résultats et discussions
91
Probe-level expression data (CEL files) were produced using GeneChip® Operation
Software (GCOS) version 1.4 and data were normalized using the MAS5 algorithm. Quality-
control and statistical analyses (background adjustment, normalization, and probe-level
summarization of data) used the GC-Robust Multi-Array average algorithm (GC-RMA) from
the GeneSpring GX11 Software.
Annotation and database analysis
Since wheat genome was poorly annotated, we completed the annotation given by
Affymetrix (http://www.affymetrix.com/analysis/index.affx) by a transcript characterization
following the recommendations (http://jcvi.org/wheat/annotate_methods.shtml) of the Wheat
Genome Database. For all the genes, an annotation on the Arabidopsis thaliana genome was
made by comparison with RefSeq proteins of the cluster transcripts of the UnigeneID. A Gene
Onthology function was attributed to each genes according to the functional genomics tool
DAVID (Huang et al., 2008; 2009) (http://david.abcc.ncifcrf.gov/summary.jsp). Finally, a
pathway analysis for all genes with modified transcript abundance was performed thanks to
KEGG pathway mapping tool (http://www.genome.jp/kegg/pathway.html).
Results
During the first 38 days of the experiment, A.caliginosa significantly promoted T.
aestivum height (Fig. 1a) by 36%, 31% and 28% respectively for 13, 28 and 38 after sowing,
whereas they had a small effect on plants exposed to G. graminis (Ggt + E). After day 38 to
the end of the experiment, earthworms (E) had no longer significant effect. Conversely to
what happened in the treatment without G. graminis, earthworms had a positive impact on the
height of plants infested by G. graminis (Ggt + E) after day 38. Earthworms increased the
height of plants exposed to G. graminis by 47% and 39% as compared with plant with only G.
graminis, at 50 and 63 days respectively. After 63 days, at the end of the experiment, no
significant differences subsisted in the height of plants between the treatments with
earthworms and control plants (Ggt+E, E and C) whereas G. graminis without earthworms
significantly reduced it by 37% as compared to control plants. This negative impact of G.
graminis was also found on above-ground, below-ground and total plant biomass (Fig. 1b)
with a reduction by 83%, 81% and 82% respectively, as compared to control plants (C). In the
presence of earthworms (Ggt + E) this negative impact of G. graminis was less important with
tel-0
0804
633,
ver
sion
1 -
26 M
ar 2
013
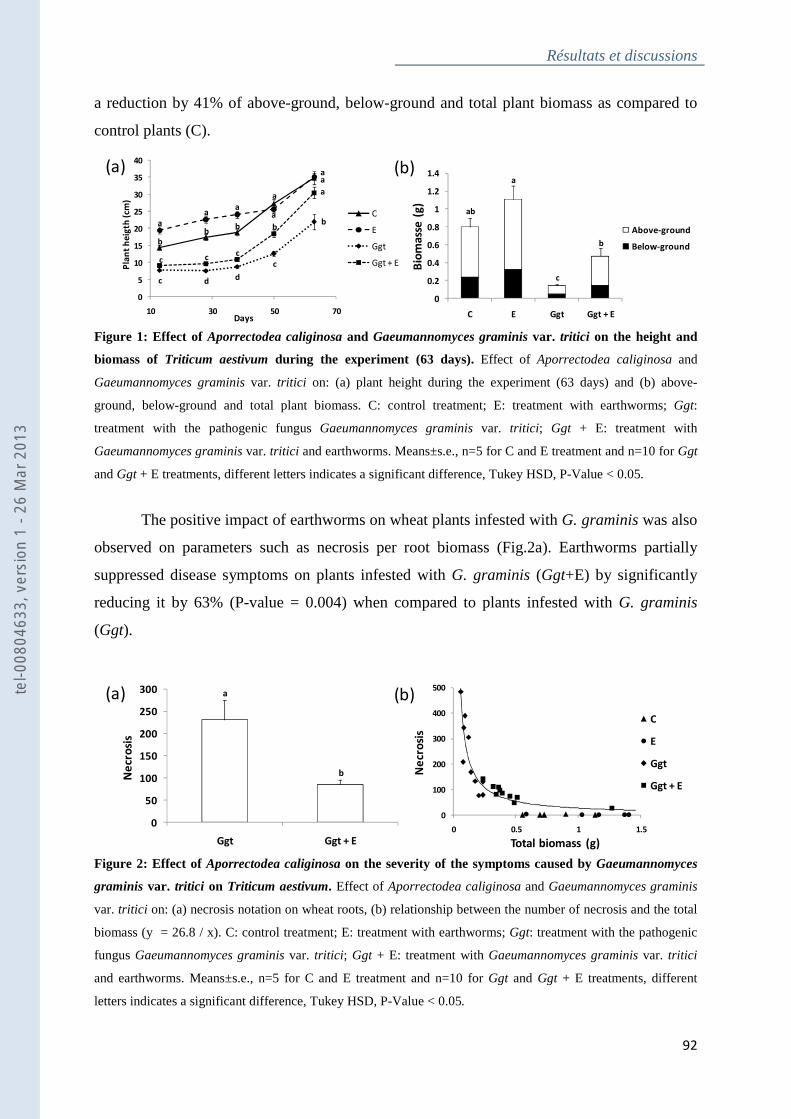
Résultats et discussions
92
a reduction by 41% of above-ground, below-ground and total plant biomass as compared to
control plants (C).
Figure 1: Effect of Aporrectodea caliginosa and Gaeumannomyces graminis var. tritici on the height and
biomass of Triticum aestivum during the experiment (63 days). Effect of Aporrectodea caliginosa and
Gaeumannomyces graminis var. tritici on: (a) plant height during the experiment (63 days) and (b) above-
ground, below-ground and total plant biomass. C: control treatment; E: treatment with earthworms; Ggt:
treatment with the pathogenic fungus Gaeumannomyces graminis var. tritici ; Ggt + E: treatment with
Gaeumannomyces graminis var. tritici and earthworms. Means±s.e., n=5 for C and E treatment and n=10 for Ggt
and Ggt + E treatments, different letters indicates a significant difference, Tukey HSD, P-Value < 0.05.
The positive impact of earthworms on wheat plants infested with G. graminis was also
observed on parameters such as necrosis per root biomass (Fig.2a). Earthworms partially
suppressed disease symptoms on plants infested with G. graminis (Ggt+E) by significantly
reducing it by 63% (P-value = 0.004) when compared to plants infested with G. graminis
(Ggt).
Figure 2: Effect of Aporrectodea caliginosa on the severity of the symptoms caused by Gaeumannomyces
graminis var. tritici on Triticum aestivum. Effect of Aporrectodea caliginosa and Gaeumannomyces graminis
var. tritici on: (a) necrosis notation on wheat roots, (b) relationship between the number of necrosis and the total
biomass (y = 26.8 / x). C: control treatment; E: treatment with earthworms; Ggt: treatment with the pathogenic
fungus Gaeumannomyces graminis var. tritici ; Ggt + E: treatment with Gaeumannomyces graminis var. tritici
and earthworms. Means±s.e., n=5 for C and E treatment and n=10 for Ggt and Ggt + E treatments, different
letters indicates a significant difference, Tukey HSD, P-Value < 0.05.
b
bb
a
a
a
aa
a
a
c d d
c
b
c cc
b
a
0
5
10
15
20
25
30
35
40
10 30 50 70
Pla
nt
he
igth
(cm
)
Days
C
E
Ggt
Ggt + E
ab
a
c
b
0
0.2
0.4
0.6
0.8
1
1.2
1.4
C E Ggt Ggt + E
Bio
ma
sse
(g
)
Above-ground
Below-ground
(b)(a)
0
100
200
300
400
500
0 0.5 1 1.5
Ne
cro
sis
Total biomass (g)
C
E
Ggt
Ggt + E
a
b
0
50
100
150
200
250
300
Ggt Ggt + E
Ne
cro
sis
(a) (b)tel-0
0804
633,
ver
sion
1 -
26 M
ar 2
013
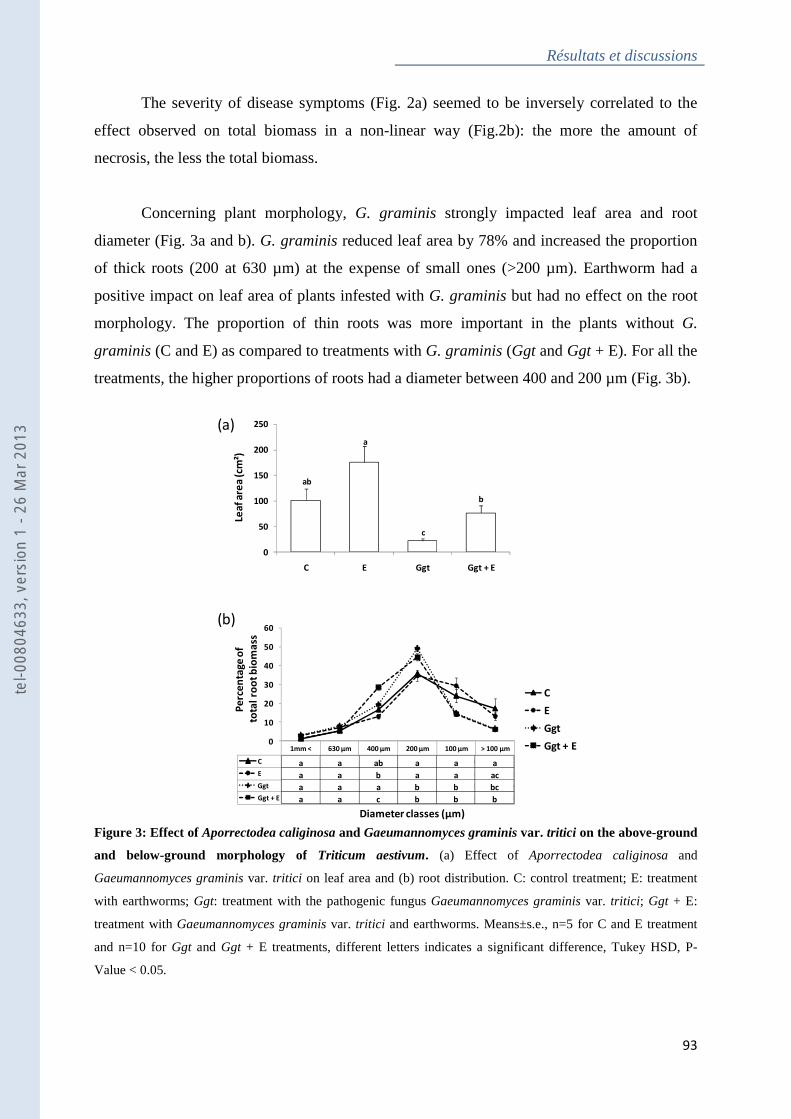
Résultats et discussions
93
The severity of disease symptoms (Fig. 2a) seemed to be inversely correlated to the
effect observed on total biomass in a non-linear way (Fig.2b): the more the amount of
necrosis, the less the total biomass.
Concerning plant morphology, G. graminis strongly impacted leaf area and root
diameter (Fig. 3a and b). G. graminis reduced leaf area by 78% and increased the proportion
of thick roots (200 at 630 µm) at the expense of small ones (>200 µm). Earthworm had a
positive impact on leaf area of plants infested with G. graminis but had no effect on the root
morphology. The proportion of thin roots was more important in the plants without G.
graminis (C and E) as compared to treatments with G. graminis (Ggt and Ggt + E). For all the
treatments, the higher proportions of roots had a diameter between 400 and 200 µm (Fig. 3b).
Figure 3: Effect of Aporrectodea caliginosa and Gaeumannomyces graminis var. tritici on the above-ground
and below-ground morphology of Triticum aestivum. (a) Effect of Aporrectodea caliginosa and
Gaeumannomyces graminis var. tritici on leaf area and (b) root distribution. C: control treatment; E: treatment
with earthworms; Ggt: treatment with the pathogenic fungus Gaeumannomyces graminis var. tritici ; Ggt + E:
treatment with Gaeumannomyces graminis var. tritici and earthworms. Means±s.e., n=5 for C and E treatment
and n=10 for Ggt and Ggt + E treatments, different letters indicates a significant difference, Tukey HSD, P-
Value < 0.05.
ab
a
c
b
0
50
100
150
200
250
C E Ggt Ggt + E
Lea
f a
rea
(cm
²)
(a)
(b)
1mm < 630 µm 400 µm 200 µm 100 µm > 100 µm
C 1.14617599 5.40635745 16.5813996 35.7516437 23.9154810 17.198942
E 2.76872171 7.03373291 12.9806905 34.6078211 29.3781544 13.2308792
Ggt 3.04955972 7.83719387 19.1289013 48.9773002 14.5729458 6.43409890
Ggt + E 1.3407599 5.43383526 28.4423063 44.5345231 14.1521295 6.09644583
0
10
20
30
40
50
60
Pe
rce
nta
ge
of
tota
l ro
ot
bio
ma
ss
Diameter classes (µm)
C
E
Ggt
Ggt + E
a a ab a a a
a a b a a ac
a a a b b bc
a a c b b b
tel-0
0804
633,
ver
sion
1 -
26 M
ar 2
013
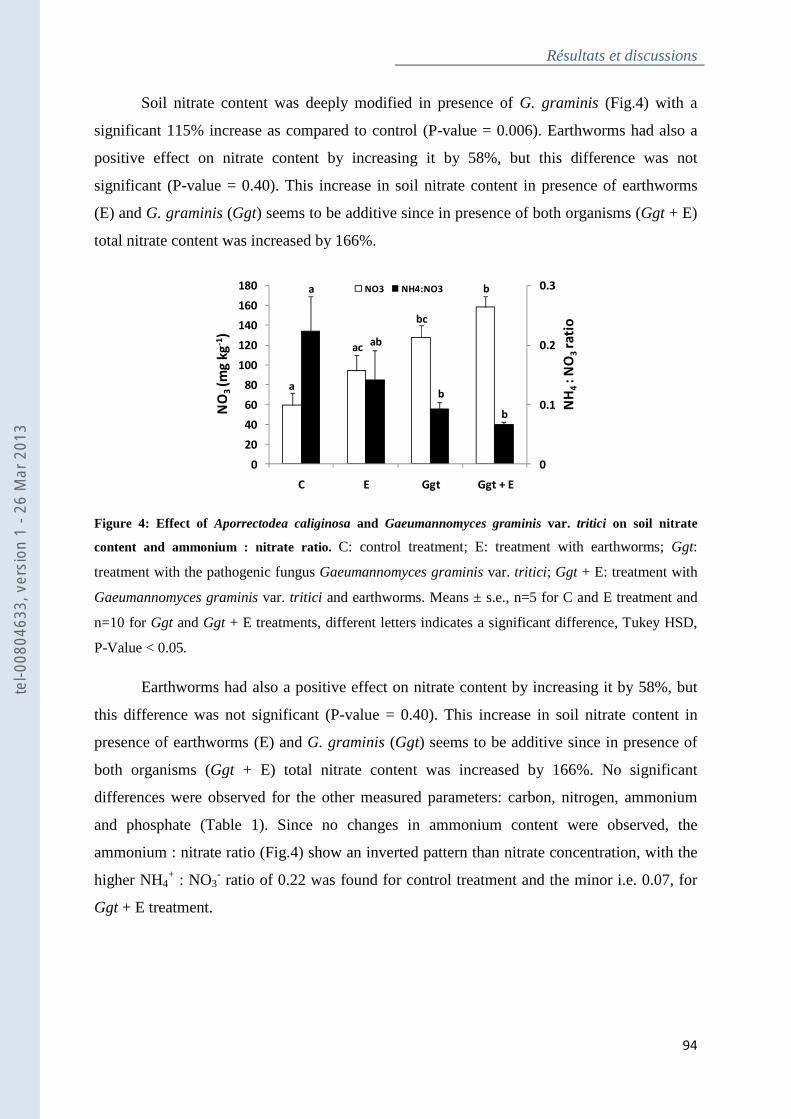
Résultats et discussions
94
Soil nitrate content was deeply modified in presence of G. graminis (Fig.4) with a
significant 115% increase as compared to control (P-value = 0.006). Earthworms had also a
positive effect on nitrate content by increasing it by 58%, but this difference was not
significant (P-value = 0.40). This increase in soil nitrate content in presence of earthworms
(E) and G. graminis (Ggt) seems to be additive since in presence of both organisms (Ggt + E)
total nitrate content was increased by 166%.
Figure 4: Effect of Aporrectodea caliginosa and Gaeumannomyces graminis var. tritici on soil nitrate
content and ammonium : nitrate ratio. C: control treatment; E: treatment with earthworms; Ggt:
treatment with the pathogenic fungus Gaeumannomyces graminis var. tritici ; Ggt + E: treatment with
Gaeumannomyces graminis var. tritici and earthworms. Means ± s.e., n=5 for C and E treatment and
n=10 for Ggt and Ggt + E treatments, different letters indicates a significant difference, Tukey HSD,
P-Value < 0.05.
Earthworms had also a positive effect on nitrate content by increasing it by 58%, but
this difference was not significant (P-value = 0.40). This increase in soil nitrate content in
presence of earthworms (E) and G. graminis (Ggt) seems to be additive since in presence of
both organisms (Ggt + E) total nitrate content was increased by 166%. No significant
differences were observed for the other measured parameters: carbon, nitrogen, ammonium
and phosphate (Table 1). Since no changes in ammonium content were observed, the
ammonium : nitrate ratio (Fig.4) show an inverted pattern than nitrate concentration, with the
higher NH4+ : NO3
- ratio of 0.22 was found for control treatment and the minor i.e. 0.07, for
Ggt + E treatment.
a
ac
bc
ba
ab
b
b
0
0.1
0.2
0.3
0
20
40
60
80
100
120
140
160
180
C E Ggt Ggt + E
NH
4:
NO
3ra
tio
NO
3(m
g k
g-1
)
NO3 NH4:NO3
tel-0
0804
633,
ver
sion
1 -
26 M
ar 2
013
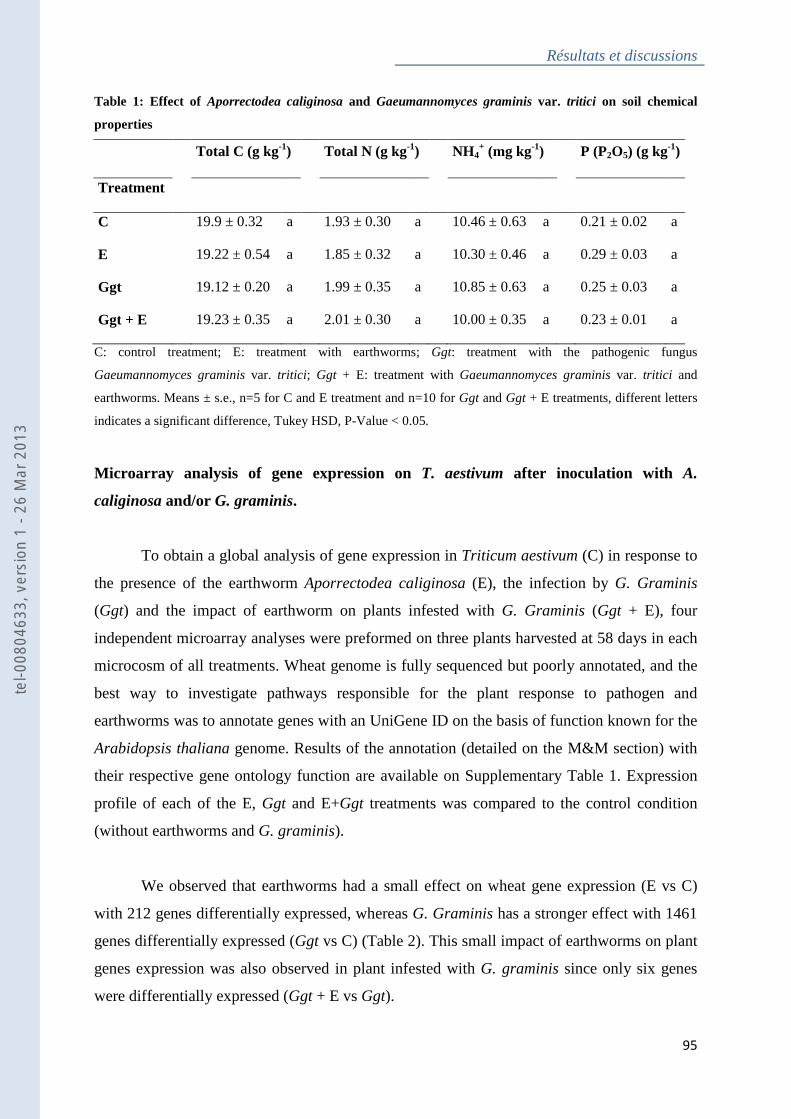
Résultats et discussions
95
Table 1: Effect of Aporrectodea caliginosa and Gaeumannomyces graminis var. tritici on soil chemical
properties
Total C (g kg-1)
Total N (g kg-1)
NH4
+ (mg kg-1)
P (P2O5) (g kg-1)
Treatment
C
19.9 ± 0.32 a
1.93 ± 0.30 a
10.46 ± 0.63 a
0.21 ± 0.02 a
E
19.22 ± 0.54 a
1.85 ± 0.32 a
10.30 ± 0.46 a
0.29 ± 0.03 a
Ggt
19.12 ± 0.20 a
1.99 ± 0.35 a
10.85 ± 0.63 a
0.25 ± 0.03 a
Ggt + E
19.23 ± 0.35 a
2.01 ± 0.30 a
10.00 ± 0.35 a
0.23 ± 0.01 a
C: control treatment; E: treatment with earthworms; Ggt: treatment with the pathogenic fungus
Gaeumannomyces graminis var. tritici ; Ggt + E: treatment with Gaeumannomyces graminis var. tritici and
earthworms. Means ± s.e., n=5 for C and E treatment and n=10 for Ggt and Ggt + E treatments, different letters
indicates a significant difference, Tukey HSD, P-Value < 0.05.
Microarray analysis of gene expression on T. aestivum after inoculation with A.
caliginosa and/or G. graminis.
To obtain a global analysis of gene expression in Triticum aestivum (C) in response to
the presence of the earthworm Aporrectodea caliginosa (E), the infection by G. Graminis
(Ggt) and the impact of earthworm on plants infested with G. Graminis (Ggt + E), four
independent microarray analyses were preformed on three plants harvested at 58 days in each
microcosm of all treatments. Wheat genome is fully sequenced but poorly annotated, and the
best way to investigate pathways responsible for the plant response to pathogen and
earthworms was to annotate genes with an UniGene ID on the basis of function known for the
Arabidopsis thaliana genome. Results of the annotation (detailed on the M&M section) with
their respective gene ontology function are available on Supplementary Table 1. Expression
profile of each of the E, Ggt and E+Ggt treatments was compared to the control condition
(without earthworms and G. graminis).
We observed that earthworms had a small effect on wheat gene expression (E vs C)
with 212 genes differentially expressed, whereas G. Graminis has a stronger effect with 1461
genes differentially expressed (Ggt vs C) (Table 2). This small impact of earthworms on plant
genes expression was also observed in plant infested with G. graminis since only six genes
were differentially expressed (Ggt + E vs Ggt).
tel-0
0804
633,
ver
sion
1 -
26 M
ar 2
013
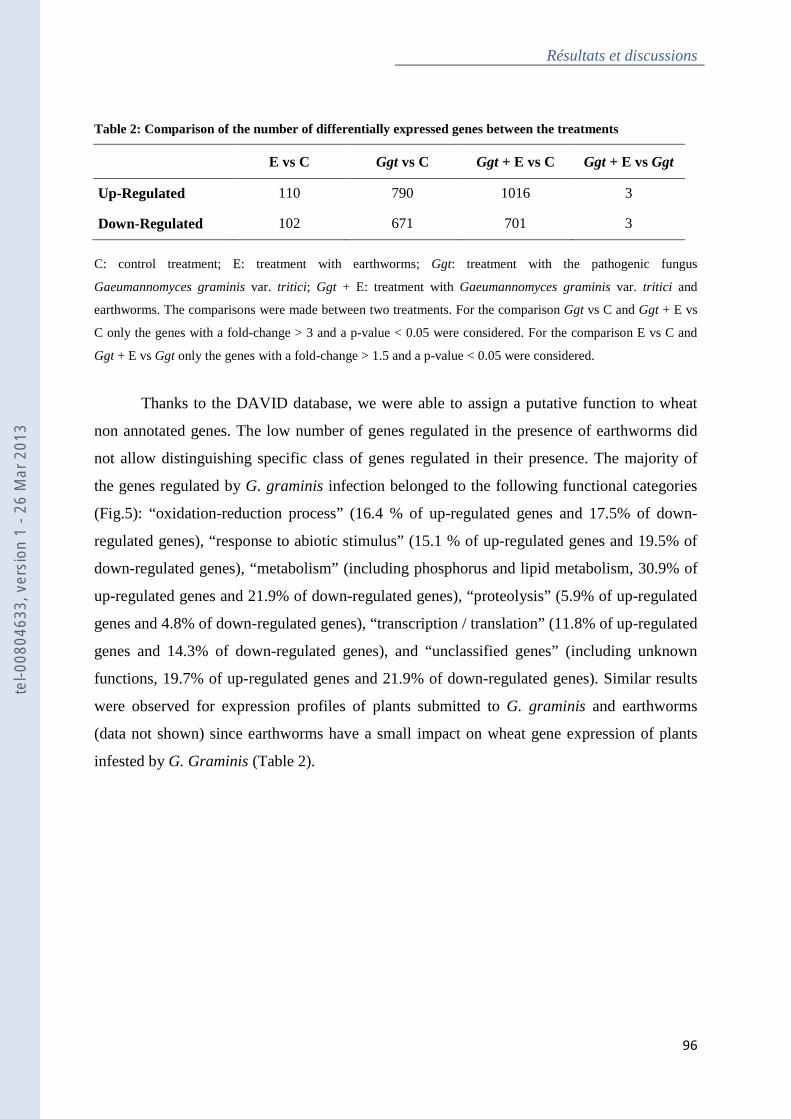
Résultats et discussions
96
Table 2: Comparison of the number of differentially expressed genes between the treatments
E vs C Ggt vs C Ggt + E vs C Ggt + E vs Ggt
Up-Regulated 110 790 1016 3
Down-Regulated 102 671 701 3
C: control treatment; E: treatment with earthworms; Ggt: treatment with the pathogenic fungus
Gaeumannomyces graminis var. tritici ; Ggt + E: treatment with Gaeumannomyces graminis var. tritici and
earthworms. The comparisons were made between two treatments. For the comparison Ggt vs C and Ggt + E vs
C only the genes with a fold-change > 3 and a p-value < 0.05 were considered. For the comparison E vs C and
Ggt + E vs Ggt only the genes with a fold-change > 1.5 and a p-value < 0.05 were considered.
Thanks to the DAVID database, we were able to assign a putative function to wheat
non annotated genes. The low number of genes regulated in the presence of earthworms did
not allow distinguishing specific class of genes regulated in their presence. The majority of
the genes regulated by G. graminis infection belonged to the following functional categories
(Fig.5): “oxidation-reduction process” (16.4 % of up-regulated genes and 17.5% of down-
regulated genes), “response to abiotic stimulus” (15.1 % of up-regulated genes and 19.5% of
down-regulated genes), “metabolism” (including phosphorus and lipid metabolism, 30.9% of
up-regulated genes and 21.9% of down-regulated genes), “proteolysis” (5.9% of up-regulated
genes and 4.8% of down-regulated genes), “transcription / translation” (11.8% of up-regulated
genes and 14.3% of down-regulated genes), and “unclassified genes” (including unknown
functions, 19.7% of up-regulated genes and 21.9% of down-regulated genes). Similar results
were observed for expression profiles of plants submitted to G. graminis and earthworms
(data not shown) since earthworms have a small impact on wheat gene expression of plants
infested by G. Graminis (Table 2).
tel-0
0804
633,
ver
sion
1 -
26 M
ar 2
013
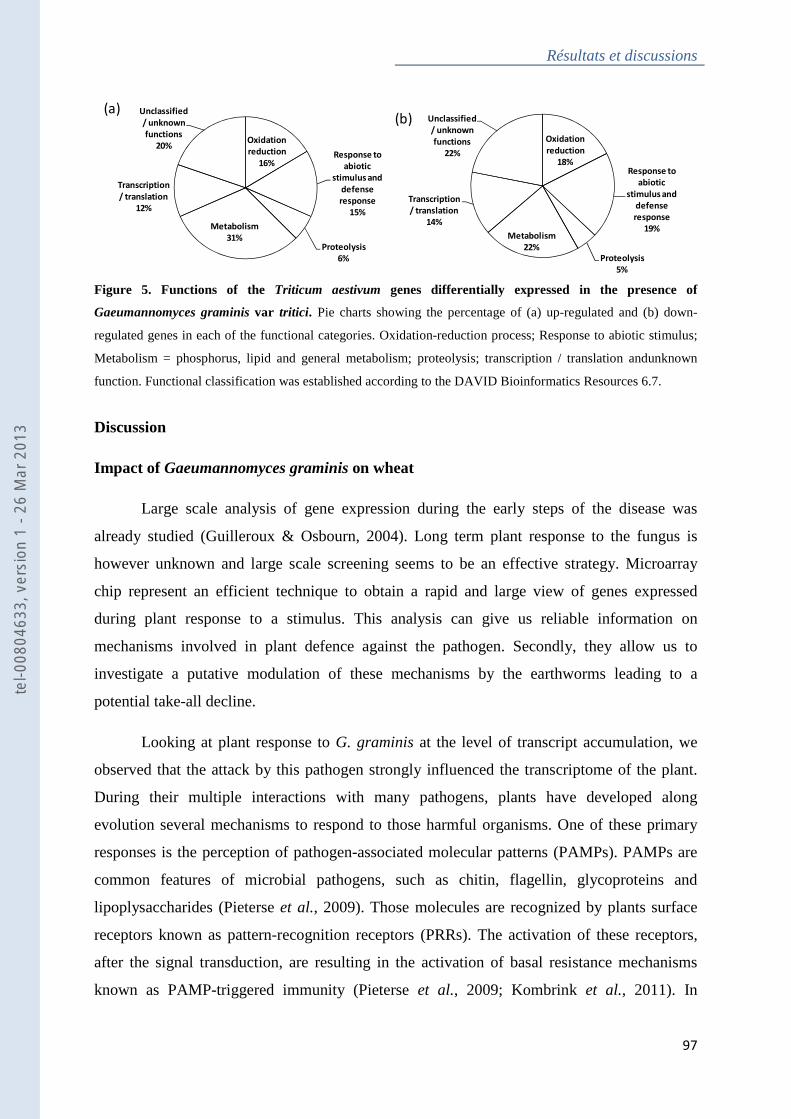
Résultats et discussions
97
Figure 5. Functions of the Triticum aestivum genes differentially expressed in the presence of
Gaeumannomyces graminis var tritici . Pie charts showing the percentage of (a) up-regulated and (b) down-
regulated genes in each of the functional categories. Oxidation-reduction process; Response to abiotic stimulus;
Metabolism = phosphorus, lipid and general metabolism; proteolysis; transcription / translation andunknown
function. Functional classification was established according to the DAVID Bioinformatics Resources 6.7.
Discussion
Impact of Gaeumannomyces graminis on wheat
Large scale analysis of gene expression during the early steps of the disease was
already studied (Guilleroux & Osbourn, 2004). Long term plant response to the fungus is
however unknown and large scale screening seems to be an effective strategy. Microarray
chip represent an efficient technique to obtain a rapid and large view of genes expressed
during plant response to a stimulus. This analysis can give us reliable information on
mechanisms involved in plant defence against the pathogen. Secondly, they allow us to
investigate a putative modulation of these mechanisms by the earthworms leading to a
potential take-all decline.
Looking at plant response to G. graminis at the level of transcript accumulation, we
observed that the attack by this pathogen strongly influenced the transcriptome of the plant.
During their multiple interactions with many pathogens, plants have developed along
evolution several mechanisms to respond to those harmful organisms. One of these primary
responses is the perception of pathogen-associated molecular patterns (PAMPs). PAMPs are
common features of microbial pathogens, such as chitin, flagellin, glycoproteins and
lipoplysaccharides (Pieterse et al., 2009). Those molecules are recognized by plants surface
receptors known as pattern-recognition receptors (PRRs). The activation of these receptors,
after the signal transduction, are resulting in the activation of basal resistance mechanisms
known as PAMP-triggered immunity (Pieterse et al., 2009; Kombrink et al., 2011). In
Oxidation
reduction
18%Response to
abiotic
stimulus and
defense
response
19%
Proteolysis
5%
Metabolism
22%
Transcription
/ translation
14%
Unclassified
/ unknown
functions
22%
Oxidation
reduction
16%Response to
abiotic
stimulus and
defense
response
15%
Proteolysis
6%
Metabolism
31%
Transcription
/ translation
12%
Unclassified
/ unknown
functions
20%
(a)(b)
tel-0
0804
633,
ver
sion
1 -
26 M
ar 2
013
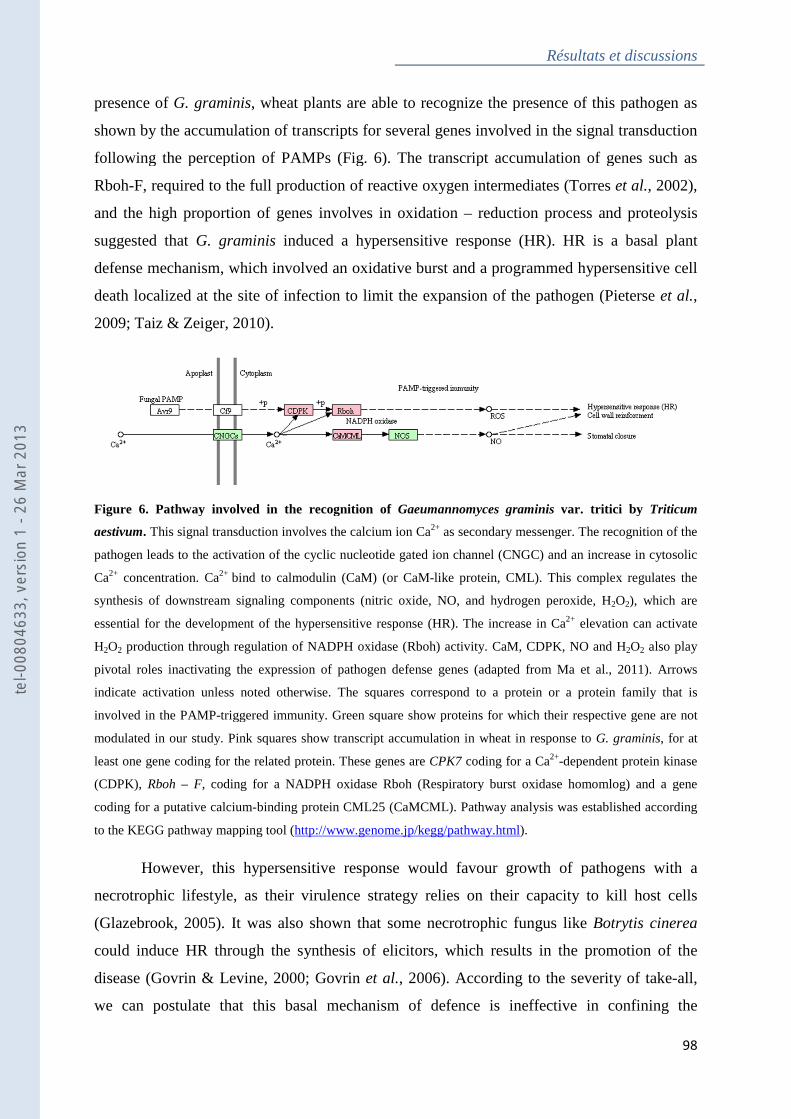
presence of G. graminis, wheat plants are able to recognize the presence of this pathogen as
shown by the accumulation of tr
following the perception of PAMPs (Fig. 6). The transcript accumulation of genes such as
Rboh-F, required to the full production of reactive oxygen intermediates
and the high proportion of genes involves in oxidation
suggested that G. graminis induced a hyper
defense mechanism, which involved an oxidative burst and a programmed hypersensitive cell
death localized at the site of infection to limit the expansion of the pathogen
2009; Taiz & Zeiger, 2010).
Figure 6. Pathway involved in the recognition of
aestivum. This signal transduction involves the calcium ion Ca
pathogen leads to the activation of the cyclic nucleotide gated ion channel (CNGC) and an increase in cytosolic
Ca2+ concentration. Ca2+ bind to calmodulin (CaM) (or CaM
synthesis of downstream signaling components (nitric oxide, NO, and hydrogen peroxide, H
essential for the development of the hypersensitive response (HR). The increase in Ca
H2O2 production through regulation
pivotal roles inactivating the expression of pathogen defense genes
indicate activation unless noted otherwise. The squares correspond to a protein o
involved in the PAMP-triggered immunity. Green square show proteins for which their respective gene are not
modulated in our study. Pink squares show transcript accumulation in wheat in response to
least one gene coding for the related protein. These genes are
(CDPK), Rboh – F, coding for a NADPH oxidase Rboh (Respiratory burst oxidase homomlog) and a gene
coding for a putative calcium-binding protein CML25 (CaMCM
to the KEGG pathway mapping tool (
However, this hypersensitive response would favour growth of pathogens with a
necrotrophic lifestyle, as their virulence strategy relies on their capacity to kill host cells
(Glazebrook, 2005). It was also shown that some necrotrophic fungus like
could induce HR through the synthesis of elicitors, which results in the promotion of the
disease (Govrin & Levine, 2000
we can postulate that this basal mechanism of defence is ineffective in confining the
Résultats et discussions
, wheat plants are able to recognize the presence of this pathogen as
shown by the accumulation of transcripts for several genes involved in the signal transduction
following the perception of PAMPs (Fig. 6). The transcript accumulation of genes such as
F, required to the full production of reactive oxygen intermediates (Torres
and the high proportion of genes involves in oxidation – reduction process and proteolysis
induced a hypersensitive response (HR). HR is a basal plant
defense mechanism, which involved an oxidative burst and a programmed hypersensitive cell
death localized at the site of infection to limit the expansion of the pathogen
Pathway involved in the recognition of Gaeumannomyces graminis var. tritici by
This signal transduction involves the calcium ion Ca2+ as secondary messenger. The recognition of the
pathogen leads to the activation of the cyclic nucleotide gated ion channel (CNGC) and an increase in cytosolic
bind to calmodulin (CaM) (or CaM-like protein, CML). This complex regulat
synthesis of downstream signaling components (nitric oxide, NO, and hydrogen peroxide, H
essential for the development of the hypersensitive response (HR). The increase in Ca2+
production through regulation of NADPH oxidase (Rboh) activity. CaM, CDPK, NO and H
pivotal roles inactivating the expression of pathogen defense genes (adapted from Ma et al., 2011)
indicate activation unless noted otherwise. The squares correspond to a protein or a protein family that is
triggered immunity. Green square show proteins for which their respective gene are not
modulated in our study. Pink squares show transcript accumulation in wheat in response to
ene coding for the related protein. These genes are CPK7 coding for a Ca2+-dependent protein kinase
, coding for a NADPH oxidase Rboh (Respiratory burst oxidase homomlog) and a gene
binding protein CML25 (CaMCML). Pathway analysis was established according
to the KEGG pathway mapping tool (http://www.genome.jp/kegg/pathway.html).
However, this hypersensitive response would favour growth of pathogens with a
crotrophic lifestyle, as their virulence strategy relies on their capacity to kill host cells
. It was also shown that some necrotrophic fungus like
d induce HR through the synthesis of elicitors, which results in the promotion of the
Govrin & Levine, 2000; Govrin et al., 2006). According to the severity of take
we can postulate that this basal mechanism of defence is ineffective in confining the
Résultats et discussions
98
, wheat plants are able to recognize the presence of this pathogen as
anscripts for several genes involved in the signal transduction
following the perception of PAMPs (Fig. 6). The transcript accumulation of genes such as
Torres et al., 2002),
reduction process and proteolysis
sensitive response (HR). HR is a basal plant
defense mechanism, which involved an oxidative burst and a programmed hypersensitive cell
death localized at the site of infection to limit the expansion of the pathogen (Pieterse et al.,
var. tritici by Triticum
s secondary messenger. The recognition of the
pathogen leads to the activation of the cyclic nucleotide gated ion channel (CNGC) and an increase in cytosolic
like protein, CML). This complex regulates the
synthesis of downstream signaling components (nitric oxide, NO, and hydrogen peroxide, H2O2), which are 2+ elevation can activate
of NADPH oxidase (Rboh) activity. CaM, CDPK, NO and H2O2 also play
(adapted from Ma et al., 2011). Arrows
r a protein family that is
triggered immunity. Green square show proteins for which their respective gene are not
modulated in our study. Pink squares show transcript accumulation in wheat in response to G. graminis, for at
dependent protein kinase
, coding for a NADPH oxidase Rboh (Respiratory burst oxidase homomlog) and a gene
Pathway analysis was established according
However, this hypersensitive response would favour growth of pathogens with a
crotrophic lifestyle, as their virulence strategy relies on their capacity to kill host cells
. It was also shown that some necrotrophic fungus like Botrytis cinerea
d induce HR through the synthesis of elicitors, which results in the promotion of the
. According to the severity of take-all,
we can postulate that this basal mechanism of defence is ineffective in confining the
tel-0
0804
633,
ver
sion
1 -
26 M
ar 2
013
Résultats et discussions
99
pathogen, and could conversely promote the disease. As G. graminis could survive
saprofitically on dead roots, we can argue that the stimulation of the HR response could
facilitate the spread of the fungus.
Aporrectodea caliginosa reduce the severity of take-all
In our study, earthworms induce take-all decline on plants exposed to G. graminis.
Take-all decline was already observed in presence of the earthworms species Aporrectodea
rosea and Aporrectodea trapezoides (Stephens et al., 1994; Stephens & Davoren, 1995).
Several mechanisms could explain the decline of take-all disease. One of them was a change
in nutrient availability, especially nitrogen, since take-all disease was more important in
restrained concentration of nutrients in the soils.
It has already been observed that the more severe the infection, the less important the
N uptake by the crop (Macdonald & Gutteridge, 2012). This resulted in more mineral N
(mostly nitrate) remaining in the soil as compared to plant less infected. This reduction of
nitrate uptake was probably correlated to the fact that the root system in presence of G.
graminis was reduced and has a lower proportion of thin roots as compared to control or
earthworms treatments. Since thin roots are more efficient than the thicker ones on soil
nutrient uptake, their inhibition by G. graminis could reduce N uptake. It has been shown that,
in earthworms burrows, the amount of nitrifying bacteria is more important than in the
surronding soil (Businelli et al., 1984; Parkin & Berry, 1999; Wu et al., 2012). Ammonium
content was weakly influenced by earthworms. Such effect on nutrient content was already
observed in presence of the earthworm A. caliginosa (Jana et al., 2010), with a strong
influence of the earthworm on nitrate but not ammonium content. The high amount of nitrate
in soils in the presence of both earthworms and G. graminis was probably the result of a
decreased N uptake by the plant due to the infection by G. graminis coupled to the
enhancement of the microbial nitrifying activity by the earthworms. All the others parameters
(total N, total C and total P) were not significantly affected.
Take-all disease could be managed by providing the crop with ammonium rather than
nitrate, with a concomitant acidification of the soil (Cook, 2003). Soil ratio of NH4+:NO3
-
close to 3 results in a soil acidification by an higher concentration of ammonium as compared
to nitrate (Cook, 2003). But, in our study, this ratio doesn’t seem to be a sufficient mechanism
to explain positive effect of earthworms on take-all disease reduction since the NH4+:NO3
-
ratio was around 0.1 for Ggt and Ggt+E treatments.
tel-0
0804
633,
ver
sion
1 -
26 M
ar 2
013
Résultats et discussions
100
Since a change in nutrient distribution are not sufficient to explain take-all reduction,
others mechanisms might be investigated. As G. graminis growth superficially and do not
expand in soil, we can postulate that earthworms do not feed on this fungus. Moreover,
earthworms do not seem to interact physically with wheat root system since no changes on
root morphology (Fig. 3b) or growth (Fig. 1b) was observed. The stimulation of plants
defence mechanisms by soil organisms such as Plant Growth Promoting Rhizobacteria
(PGPR) (van Wees et al., 1999; Persello-Cartieaux et al., 2003; van Wees et al., 2008),
collembolas (Endlweber et al., 2011) and earthworms (Puga-Freitas et al., accepted) has
already been demonstrated. But, the induction of these defence mechanisms such as the
induced systemic resistance (ISR) is not effective in all plant species and in all kind of soils
(Bakker et al., 2007). In the presence of earthworms only a small proportion of genes are
modulated in wheat plants infested (Ggt + E) or not (E) with G. Graminis (Table 1) and these
genes doesn’t seems to be related to defence mechanisms such as ISR. We can argue that
take-all decline mediated by earthworms was not mediated by an enhancement of wheat
defence mechanisms, which would have been observed in wheat gene expression.
The last hypothesis was the stimulation by the earthworm of microbial antagonist
populations. It was already observed that earthworms were able to reduce several soil borne
diseases (Elmer, 2009). On asparagus plants, the amount of root lesions caused by Fusarium
oxysporum was halved in the presence of earthworms, without significant changes in
Fusarium density. The fact that earthworms did not act directly on pathogen density to reduce
disease severity was supported by another studies interested in investigating the impact of two
earthworms on Fusarium population (Wolfarth et al., 2011) and the earthworm Millsonia
anomala on the density of the nematological population of Heterodera sacchari (Blouin et al.,
2005). On their study, Elmer (2009) found that the reduction of the diseases might have been
mediated through change in microbiological activity. The density of the population of the
PGPR Pseudomonas fluorescens was increased in presence of earthworms. P. fluorescens is
known to inhibit G. graminis by the production of several antibiotics compounds (Cook,
2003; Freeman & Ward, 2004). It was also showed that earthworms cast (dejection) and plant
rhizosphere were survival hot spots for the soil-inoculated biological control agents
Pseudomonas protegens (previously Pseudomonas fluorescens) CHA0 (Troxler et al., 2012).
Moreover, our results are strongly similar to those studying the reduction of the take-all
disease by the Pseudomonas fluorescens strain Pf29A (Chapon et al., 2002). Earthworm
reduction of several soil borne disease seem to be microbially-mediated (Clapperton et al.,
tel-0
0804
633,
ver
sion
1 -
26 M
ar 2
013
Résultats et discussions
101
2001; Elmer, 2009). Our results did not allow us to conclude on the mechanism involved on
take-all suppression by earthworm but biochemical modifications through the activation of
antifungal producing PGPR seemed to be the more likely hypothesis.
tel-0
0804
633,
ver
sion
1 -
26 M
ar 2
013

Discussion générale
102
Discussion générale
tel-0
0804
633,
ver
sion
1 -
26 M
ar 2
013
Discussion générale
103
1. L’interaction des plantes avec les organismes du sol : un réseau signalétique complexe
Les plantes, comme tout organisme vivant, se développent et évoluent en interaction
avec les organismes présents dans leur milieu. Par exemple, les êtres humains maintiennent
une association symbiotique avec leur microflore intestinale indispensable à leur nutrition, à
leur développement et à leur système immunitaire. Bien avant les animaux, les plantes se sont
associées avec d’autres plantes, mais aussi avec les microorganismes du sol (Figure 13) afin
de réaliser des processus similaires. Ces associations sont facilitées à travers l’échange de
molécules signal dans la rhizosphère entre la plante et les organismes du sol.
1.1 Les molécules signal dans la communication entre bactéries de la rhizosphère
Au niveau des bactéries du sol, la coordination de l’activité entre plusieurs bactéries
est un mécanisme largement répandu. Ce mécanisme repose sur une communication de cellule
à cellule, appelé « quorum sensing (QS) » ou détection du quorum en français. Ce mécanisme
est réalisé à travers la diffusion de signaux chimiques. Même si les signaux et les mécanismes
impliqués dans le quorum sensing varient, les plus répandus sont les N-acyle homosérine
lactones (AHLs) (Badri et al., 2009). Cette détection du quorum va coordonner l’expression
de certains gènes bactériens lorsque la population aura atteint une densité suffisante. Les
molécules signal (AHLs) impliquées sont produites à une concentration constante par chaque
bactérie. En conséquence, la concentration de ces molécules dans le milieu extérieur va
augmenter au fur et à mesure que la densité de la population bactérienne augmente. Une fois
la concentration seuil atteinte, certains régulateurs vont être activés, induisant l’expression de
gènes spécifiques (Williams, 2007). L’activation simultanée de ces gènes chez toutes les
bactéries d’une colonie va permettre la coordination de leurs comportements afin de s’adapter
à leur environnement. Ceci va notamment faciliter l’acquisition de nutriments ou d’une niche,
augmenter la virulence de certaines espèces pathogènes, permettre la fuite de la colonie ou
encore permettre la formation de biofilms (Williams, 2007; Badri et al., 2009). Au niveau de
l’association entre les plantes et les microorganismes du sol, ce mécanisme de détection du
quorum va permettre l’association de la plante avec des organismes symbiotiques (Badri et
al., 2009) ou pathogènes (von Bodman et al., 2003; Liu et al., 2008).
tel-0
0804
633,
ver
sion
1 -
26 M
ar 2
013
Discussion générale
104
tel-0
0804
633,
ver
sion
1 -
26 M
ar 2
013
Discussion générale
105
Figure 13 : Modèle représentant les modes d’action des vers de terre sur les interactions entre la plante et les organismes de la rhizosphère. Ces interactions vont résulter en des effets négatifs ou positifs selon le type d’organisme. L’effet des vers de terre sur ces interactions va être synergique ou antagoniste à leur effet sur la plante, avec en général une issue positive.
Les organismes bénéfiques sont (1) les mycorrhizes, (2) les bactéries fixatrices d’azote atmosphérique, (3) les bactéries promotrices de la croissance des plantes (PGPR). Les organismes délétères sont : (4) les bactéries de la rhizosphère délétère de la croissance des plantes (DRB), (5) les nématodes et (6) les champignons. Ces organismes vont agir au niveau de la résistance et croissance des plantes au travers de l’émission de molécules signal (hormones végétales ou molécules PAMP qui sont des éliciteurs des mécanismes de résistance des plantes). Ces composés vont (a) stimuler ou (b) inhiber la croissance végétale par des modifications de l’homéostasie hormonale de la plante. La perception par la plante d’un organisme pathogène au travers de la reconnaissance de molécules PAMP va conduire à la mise en place de mécanismes de défense. Cependant, certains organismes pathogènes sont (c) capables de manipuler les mécanismes de reconnaissance et de défense de la plante. En cas de réponse efficace de la plante, l’infection qui a ainsi échouée va conduire à (d) une résistance systémique acquise (SAR) conférant une meilleure résistance de la plante lors de futures attaques. Certains organismes bénéfiques sont capables d’induire des mécanismes de défense chez la plante. La perception de ces organismes à travers la reconnaissance de molécules PAMP va conduire à (e) l’induction d’une résistance systémique (ISR). Cette ISR, va permettre à la plante de (f) mieux résister lors de l’attaque de certains pathogènes, inhibant ainsi les effets négatifs de ces derniers sur la croissance et les mécanismes de résistance. Ces organismes bénéfiques peuvent également avoir (h) un effet de contrôle biologique sur les organismes (4), (5) et (6) à travers la synthèse dans la rhizosphère de molécules ayant une action antibiotique ou encore via une compétition pour les nutriments. Dans la sphère des organismes n’établissant pas de contact physique avec la plante, les (3) PGPR peuvent avoir des effets positifs via l’émission de molécules diffusant par voie aqueuse ou gazeuses, telles que des hormones végétales ou des composés organiques volatiles (COV). D’autres organismes ayant un effet délétères à distance sont appelés (4) DRB et agissent par des mécanismes proches des PGPR, mais avec des molécules produites à des concentrations différentes, généralement plus élevées que chez les PGPR (eg. Acide Indole Acétique). Les PGPR et les DRB peuvent exercer (g et h) des effets inhibiteurs réciproques. De plus, selon l’espèce de la plante et de la taille de la population de PGPR, ces dernières peuvent avoir (i) une action de DRB.
Les vers de terre au travers de leur domaine d’influence (drilosphère) vont avoir un impact positif (flèche) ou négatif (flèche arrêtée) sur l’activité et la densité de ces organismes bénéfiques ou délétères. La stimulation par les vers de terre des organismes bénéfiques va résulter en une action amplifiée de ces derniers sur la croissance et la résistance des plantes par les mécanismes (a) et (e). L’effet des vers de terre des organismes délétères va réduire l’effet négatif de ces derniers sur la croissance et la résistance des plantes par les mécanismes (b), (c) et (g). Cependant, les vers de terre peuvent sur-activer les communautés de PGPR, produisant un effet délétère sur la croissance des plantes du fait d’une (i) production de molécules signal trop importante (e.g. forte concentration d’acide indole acétique). Enfin, les vers de terre en stimulant certaines populations de PGPR vont favoriser (h) un effet de contrôle biologique direct des agents pathogènes. Les vers de terre favoriseront ainsi un effet antagoniste des PGPR sur les organismes délétères sans changer la physiologie de la plante.
1.2 Les molécules signal dans la communication entre bactéries et plantes
Les plantes sont également capables d’interagir avec les microorganismes du sol,
notamment à travers des molécules signal présentes dans leurs exsudats. Cette interaction peut
être réalisée par l’émission de molécules mimant l’effet des AHLs (Teplitski et al., 2000; Bais
tel-0
0804
633,
ver
sion
1 -
26 M
ar 2
013
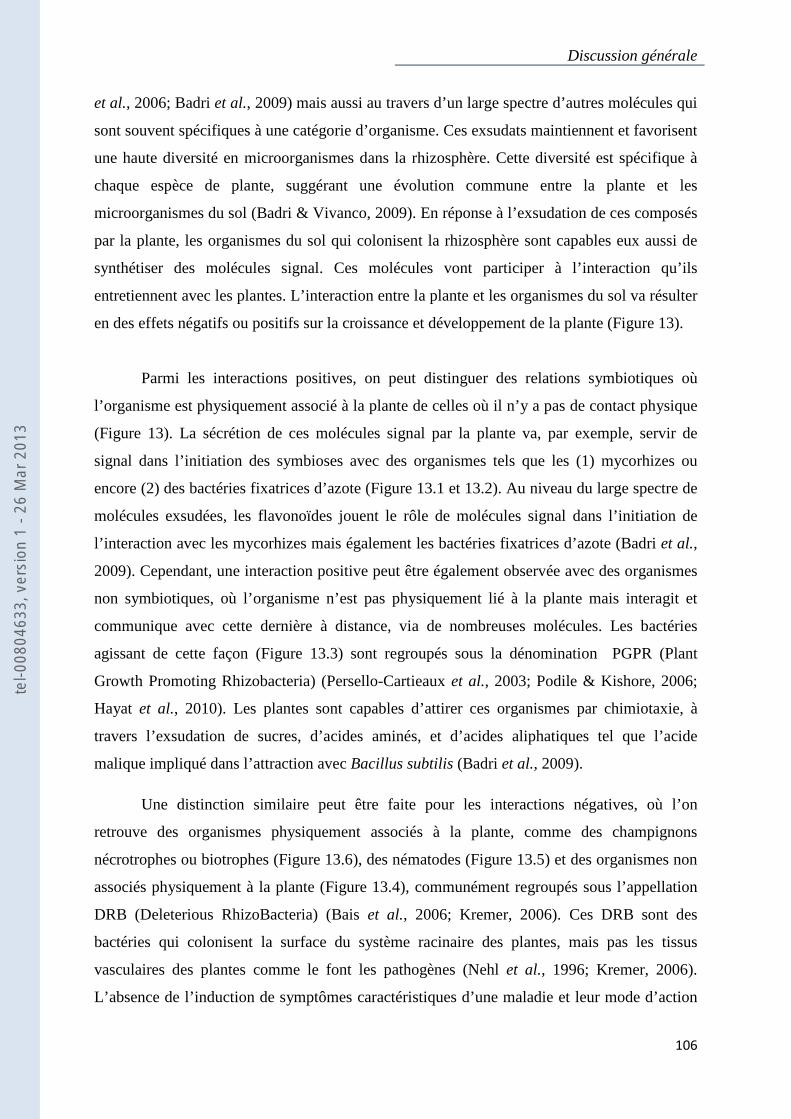
Discussion générale
106
et al., 2006; Badri et al., 2009) mais aussi au travers d’un large spectre d’autres molécules qui
sont souvent spécifiques à une catégorie d’organisme. Ces exsudats maintiennent et favorisent
une haute diversité en microorganismes dans la rhizosphère. Cette diversité est spécifique à
chaque espèce de plante, suggérant une évolution commune entre la plante et les
microorganismes du sol (Badri & Vivanco, 2009). En réponse à l’exsudation de ces composés
par la plante, les organismes du sol qui colonisent la rhizosphère sont capables eux aussi de
synthétiser des molécules signal. Ces molécules vont participer à l’interaction qu’ils
entretiennent avec les plantes. L’interaction entre la plante et les organismes du sol va résulter
en des effets négatifs ou positifs sur la croissance et développement de la plante (Figure 13).
Parmi les interactions positives, on peut distinguer des relations symbiotiques où
l’organisme est physiquement associé à la plante de celles où il n’y a pas de contact physique
(Figure 13). La sécrétion de ces molécules signal par la plante va, par exemple, servir de
signal dans l’initiation des symbioses avec des organismes tels que les (1) mycorhizes ou
encore (2) des bactéries fixatrices d’azote (Figure 13.1 et 13.2). Au niveau du large spectre de
molécules exsudées, les flavonoïdes jouent le rôle de molécules signal dans l’initiation de
l’interaction avec les mycorhizes mais également les bactéries fixatrices d’azote (Badri et al.,
2009). Cependant, une interaction positive peut être également observée avec des organismes
non symbiotiques, où l’organisme n’est pas physiquement lié à la plante mais interagit et
communique avec cette dernière à distance, via de nombreuses molécules. Les bactéries
agissant de cette façon (Figure 13.3) sont regroupés sous la dénomination PGPR (Plant
Growth Promoting Rhizobacteria) (Persello-Cartieaux et al., 2003; Podile & Kishore, 2006;
Hayat et al., 2010). Les plantes sont capables d’attirer ces organismes par chimiotaxie, à
travers l’exsudation de sucres, d’acides aminés, et d’acides aliphatiques tel que l’acide
malique impliqué dans l’attraction avec Bacillus subtilis (Badri et al., 2009).
Une distinction similaire peut être faite pour les interactions négatives, où l’on
retrouve des organismes physiquement associés à la plante, comme des champignons
nécrotrophes ou biotrophes (Figure 13.6), des nématodes (Figure 13.5) et des organismes non
associés physiquement à la plante (Figure 13.4), communément regroupés sous l’appellation
DRB (Deleterious RhizoBacteria) (Bais et al., 2006; Kremer, 2006). Ces DRB sont des
bactéries qui colonisent la surface du système racinaire des plantes, mais pas les tissus
vasculaires des plantes comme le font les pathogènes (Nehl et al., 1996; Kremer, 2006).
L’absence de l’induction de symptômes caractéristiques d’une maladie et leur mode d’action
tel-0
0804
633,
ver
sion
1 -
26 M
ar 2
013
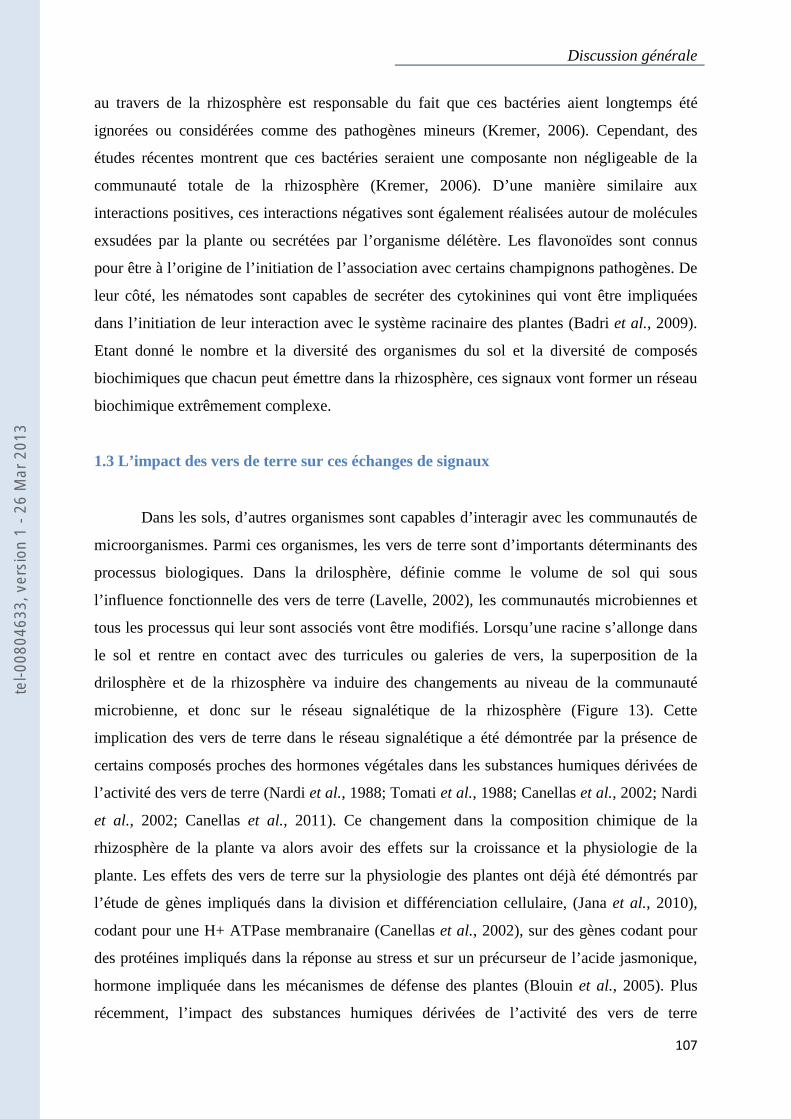
Discussion générale
107
au travers de la rhizosphère est responsable du fait que ces bactéries aient longtemps été
ignorées ou considérées comme des pathogènes mineurs (Kremer, 2006). Cependant, des
études récentes montrent que ces bactéries seraient une composante non négligeable de la
communauté totale de la rhizosphère (Kremer, 2006). D’une manière similaire aux
interactions positives, ces interactions négatives sont également réalisées autour de molécules
exsudées par la plante ou secrétées par l’organisme délétère. Les flavonoïdes sont connus
pour être à l’origine de l’initiation de l’association avec certains champignons pathogènes. De
leur côté, les nématodes sont capables de secréter des cytokinines qui vont être impliquées
dans l’initiation de leur interaction avec le système racinaire des plantes (Badri et al., 2009).
Etant donné le nombre et la diversité des organismes du sol et la diversité de composés
biochimiques que chacun peut émettre dans la rhizosphère, ces signaux vont former un réseau
biochimique extrêmement complexe.
1.3 L’impact des vers de terre sur ces échanges de signaux
Dans les sols, d’autres organismes sont capables d’interagir avec les communautés de
microorganismes. Parmi ces organismes, les vers de terre sont d’importants déterminants des
processus biologiques. Dans la drilosphère, définie comme le volume de sol qui sous
l’influence fonctionnelle des vers de terre (Lavelle, 2002), les communautés microbiennes et
tous les processus qui leur sont associés vont être modifiés. Lorsqu’une racine s’allonge dans
le sol et rentre en contact avec des turricules ou galeries de vers, la superposition de la
drilosphère et de la rhizosphère va induire des changements au niveau de la communauté
microbienne, et donc sur le réseau signalétique de la rhizosphère (Figure 13). Cette
implication des vers de terre dans le réseau signalétique a été démontrée par la présence de
certains composés proches des hormones végétales dans les substances humiques dérivées de
l’activité des vers de terre (Nardi et al., 1988; Tomati et al., 1988; Canellas et al., 2002; Nardi
et al., 2002; Canellas et al., 2011). Ce changement dans la composition chimique de la
rhizosphère de la plante va alors avoir des effets sur la croissance et la physiologie de la
plante. Les effets des vers de terre sur la physiologie des plantes ont déjà été démontrés par
l’étude de gènes impliqués dans la division et différenciation cellulaire, (Jana et al., 2010),
codant pour une H+ ATPase membranaire (Canellas et al., 2002), sur des gènes codant pour
des protéines impliqués dans la réponse au stress et sur un précurseur de l’acide jasmonique,
hormone impliquée dans les mécanismes de défense des plantes (Blouin et al., 2005). Plus
récemment, l’impact des substances humiques dérivées de l’activité des vers de terre
tel-0
0804
633,
ver
sion
1 -
26 M
ar 2
013
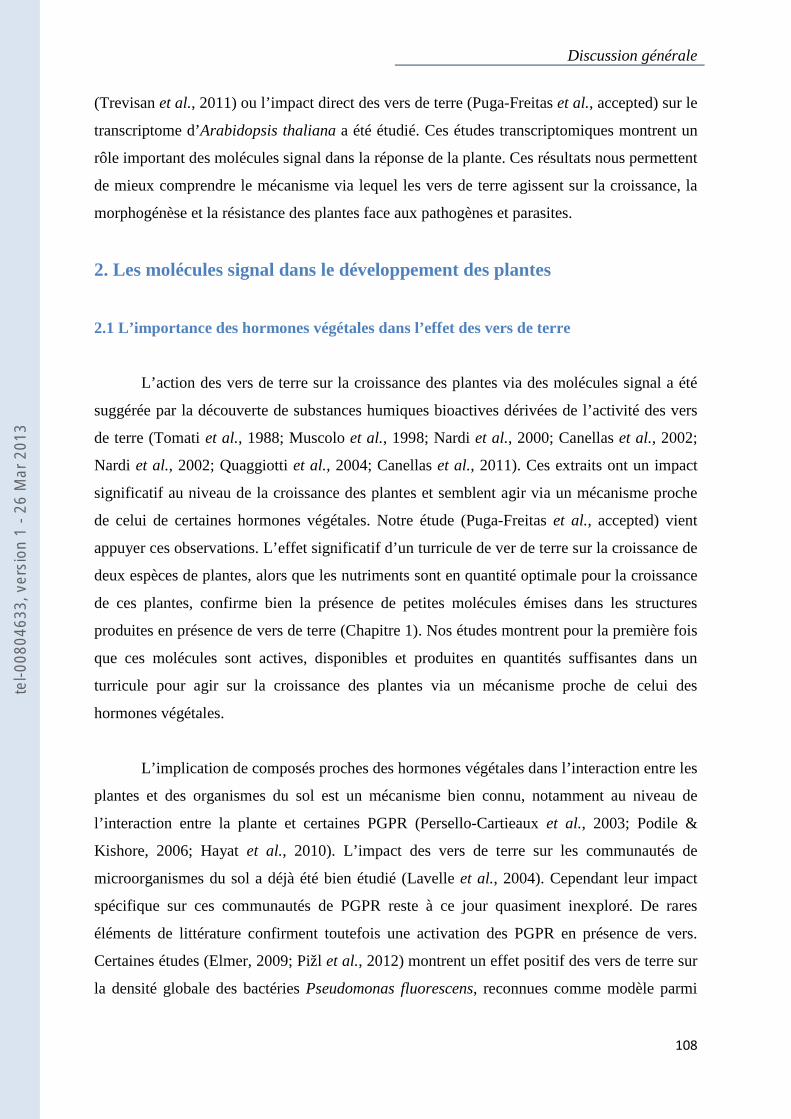
Discussion générale
108
(Trevisan et al., 2011) ou l’impact direct des vers de terre (Puga-Freitas et al., accepted) sur le
transcriptome d’Arabidopsis thaliana a été étudié. Ces études transcriptomiques montrent un
rôle important des molécules signal dans la réponse de la plante. Ces résultats nous permettent
de mieux comprendre le mécanisme via lequel les vers de terre agissent sur la croissance, la
morphogénèse et la résistance des plantes face aux pathogènes et parasites.
2. Les molécules signal dans le développement des plantes
2.1 L’importance des hormones végétales dans l’effet des vers de terre
L’action des vers de terre sur la croissance des plantes via des molécules signal a été
suggérée par la découverte de substances humiques bioactives dérivées de l’activité des vers
de terre (Tomati et al., 1988; Muscolo et al., 1998; Nardi et al., 2000; Canellas et al., 2002;
Nardi et al., 2002; Quaggiotti et al., 2004; Canellas et al., 2011). Ces extraits ont un impact
significatif au niveau de la croissance des plantes et semblent agir via un mécanisme proche
de celui de certaines hormones végétales. Notre étude (Puga-Freitas et al., accepted) vient
appuyer ces observations. L’effet significatif d’un turricule de ver de terre sur la croissance de
deux espèces de plantes, alors que les nutriments sont en quantité optimale pour la croissance
de ces plantes, confirme bien la présence de petites molécules émises dans les structures
produites en présence de vers de terre (Chapitre 1). Nos études montrent pour la première fois
que ces molécules sont actives, disponibles et produites en quantités suffisantes dans un
turricule pour agir sur la croissance des plantes via un mécanisme proche de celui des
hormones végétales.
L’implication de composés proches des hormones végétales dans l’interaction entre les
plantes et des organismes du sol est un mécanisme bien connu, notamment au niveau de
l’interaction entre la plante et certaines PGPR (Persello-Cartieaux et al., 2003; Podile &
Kishore, 2006; Hayat et al., 2010). L’impact des vers de terre sur les communautés de
microorganismes du sol a déjà été bien étudié (Lavelle et al., 2004). Cependant leur impact
spécifique sur ces communautés de PGPR reste à ce jour quasiment inexploré. De rares
éléments de littérature confirment toutefois une activation des PGPR en présence de vers.
Certaines études (Elmer, 2009; Pižl et al., 2012) montrent un effet positif des vers de terre sur
la densité globale des bactéries Pseudomonas fluorescens, reconnues comme modèle parmi
tel-0
0804
633,
ver
sion
1 -
26 M
ar 2
013
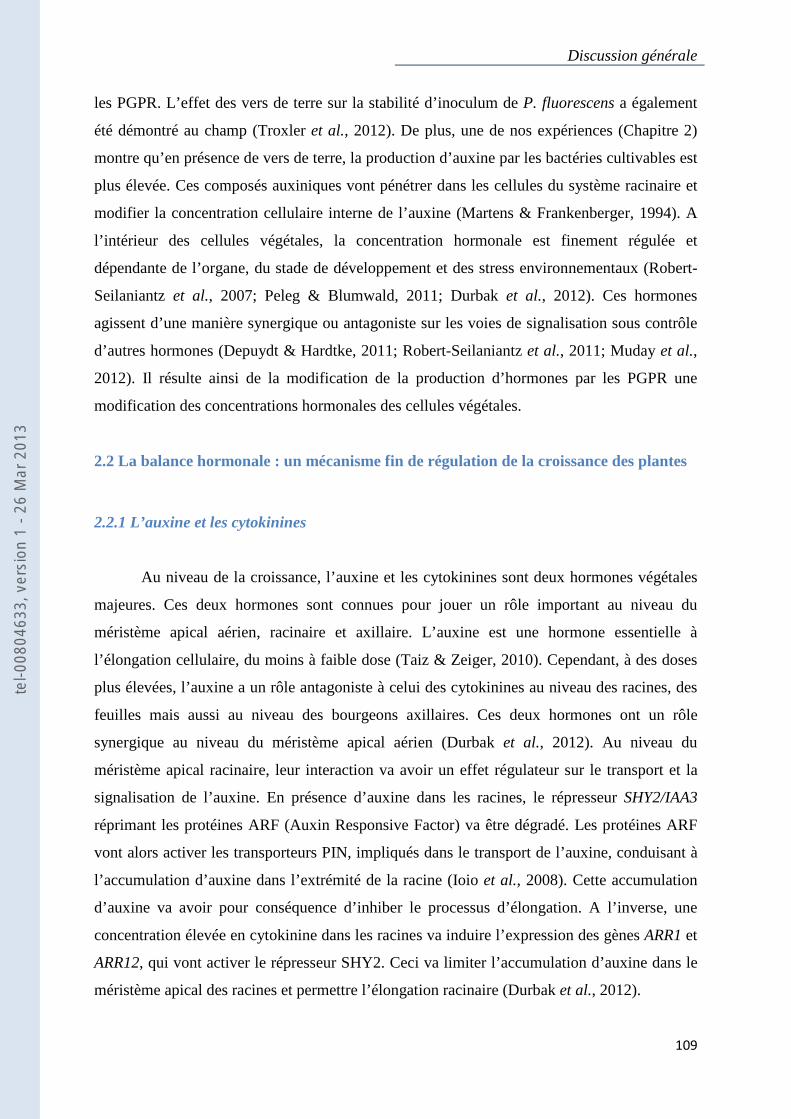
Discussion générale
109
les PGPR. L’effet des vers de terre sur la stabilité d’inoculum de P. fluorescens a également
été démontré au champ (Troxler et al., 2012). De plus, une de nos expériences (Chapitre 2)
montre qu’en présence de vers de terre, la production d’auxine par les bactéries cultivables est
plus élevée. Ces composés auxiniques vont pénétrer dans les cellules du système racinaire et
modifier la concentration cellulaire interne de l’auxine (Martens & Frankenberger, 1994). A
l’intérieur des cellules végétales, la concentration hormonale est finement régulée et
dépendante de l’organe, du stade de développement et des stress environnementaux (Robert-
Seilaniantz et al., 2007; Peleg & Blumwald, 2011; Durbak et al., 2012). Ces hormones
agissent d’une manière synergique ou antagoniste sur les voies de signalisation sous contrôle
d’autres hormones (Depuydt & Hardtke, 2011; Robert-Seilaniantz et al., 2011; Muday et al.,
2012). Il résulte ainsi de la modification de la production d’hormones par les PGPR une
modification des concentrations hormonales des cellules végétales.
2.2 La balance hormonale : un mécanisme fin de régulation de la croissance des plantes
2.2.1 L’auxine et les cytokinines
Au niveau de la croissance, l’auxine et les cytokinines sont deux hormones végétales
majeures. Ces deux hormones sont connues pour jouer un rôle important au niveau du
méristème apical aérien, racinaire et axillaire. L’auxine est une hormone essentielle à
l’élongation cellulaire, du moins à faible dose (Taiz & Zeiger, 2010). Cependant, à des doses
plus élevées, l’auxine a un rôle antagoniste à celui des cytokinines au niveau des racines, des
feuilles mais aussi au niveau des bourgeons axillaires. Ces deux hormones ont un rôle
synergique au niveau du méristème apical aérien (Durbak et al., 2012). Au niveau du
méristème apical racinaire, leur interaction va avoir un effet régulateur sur le transport et la
signalisation de l’auxine. En présence d’auxine dans les racines, le répresseur SHY2/IAA3
réprimant les protéines ARF (Auxin Responsive Factor) va être dégradé. Les protéines ARF
vont alors activer les transporteurs PIN, impliqués dans le transport de l’auxine, conduisant à
l’accumulation d’auxine dans l’extrémité de la racine (Ioio et al., 2008). Cette accumulation
d’auxine va avoir pour conséquence d’inhiber le processus d’élongation. A l’inverse, une
concentration élevée en cytokinine dans les racines va induire l’expression des gènes ARR1 et
ARR12, qui vont activer le répresseur SHY2. Ceci va limiter l’accumulation d’auxine dans le
méristème apical des racines et permettre l’élongation racinaire (Durbak et al., 2012).
tel-0
0804
633,
ver
sion
1 -
26 M
ar 2
013
Discussion générale
110
En présence de vers de terre (Chapitre 1 et 4), rien ne semble indiquer qu’une
production de cytokinine soit impliquée dans la réponse des plantes. Cependant, l’implication
des cytokinines dans l’action des PGPR à déjà été démontrée (Persello-Cartieaux et al., 2003;
Hayat et al., 2010; Wilkinson et al., 2012) même si elle a fait l’objet de moins d’études que
l’éthylène ou l’auxine. Ainsi, la bactérie Bacillus subtilis est capable de synthétiser différents
composés de la famille des cytokinines tel que la zéatine riboside. Quinze jours après
inoculation de plants de laitue (Lactuca sativa L.) avec cette bactérie, une augmentation dans
la concentration en auxine dans les racines est observée. Parallèlement, une augmentation
dans la concentration en acide abscissique et cytokinine au niveau des feuilles est également
observée comparativement à des plantes non inoculés. Ces changements au niveau de la
concentration interne de hormones sont accompagnés par des effets positifs au niveau de la
croissance racinaire et aérienne (Arkhipova et al., 2005).
Dans une étude récente, les effets de l’amibe bactérivore Acanthamoeba castellanii sur
la croissance de deux lignées transgéniques d’Arabidopsis thaliana ont été étudiés. L’étude de
l’activité d’un gène rapporteur pour l’auxine (DR5 :GUS) et pour les cytokinines
(ARR5 :GUS) a montré que ces protozoaires modulaient la morphogène d’A. thaliana via des
changements du rapport de concentration de ces deux hormones (Krome et al., 2010). Sur des
plantes âgées de six semaines, les auteurs ont observé, en présence du protozoaire, une légère
diminution de l’intensité de la coloration GUS chez le mutant DR5:GUS et une forte
augmentation chez le mutant ARR5 :GUS démontrant un équilibre entre auxine et cytokinine
différent. Ces changements au niveau de la concentration de ces deux hormones seraient
fortement liés à la prédation sélective exercée sur les communautés bactériennes du sol par
l’amibe A. castellanii. Cette prédation sélective des bactéries du sol par des protozoaires, qui
favorise les bactéries productrices de molécules signal a été observée à plusieurs reprises
(Bonkowski & Brandt, 2002), et pourrait être une hypothèse alternative à la boucle
microbienne, qui explique l’effet positif des protozoaires sur les plantes par un recyclage plus
rapide des nutriments (Bonkowski, 2004). Ces résultats montrent l’importance que peut avoir
un changement au niveau de la structure de la communauté bactérienne sur la plante. On peut
penser que les changements provoqués par les vers de terre au niveau des communautés de
bactéries peuvent avoir des effets similaires sur la croissance des plantes.
tel-0
0804
633,
ver
sion
1 -
26 M
ar 2
013
Discussion générale
111
2.2.2 L’auxine et l’éthylène
L’auxine est également connue pour interagir avec d’autres hormones au niveau des
processus de croissance des plantes. Dans son interaction avec l’éthylène, l’auxine influence
de nombreux processus de morphogénèse au niveau du système racinaire (Muday et al.,
2012). Ces deux hormones agissent de manière synergique au niveau de l’élongation et de
l’émission de poils absorbants et de manière antagoniste au niveau de la formation de racines
latérales et de l’élongation de l’hypocotyle (Muday et al., 2012). Dans notre étude (Chapitre
1), nous avons observé que les vers de terre semblent agir via la voie de signalisation des
auxines. En effet, le ver de terre A. caliginosa, a un effet positif sur la croissance du double
mutant d’A. thaliana aux1-7;axr4-2 et un effet négatif sur la croissance d’A. thaliana col-0.
L’auxine étant produite majoritairement dans le méristème apical, le double mutant va être
fortement perturbé dans le transport de l’auxine. Ceci va affecter la croissance de la plante,
provoquant le nanisme de la plante. Ce double mutant est connu pour avoir un phénotype
normal lors d’un apport exogène d’auxine (Hobbie & Estelle, 1995). L’auxine sous sa forme
d’IAA est majoritairement transportée de cellule à cellule, cependant, d’autres molécules de la
famille des auxines peuvent être transportées de manière passive (Delbarre et al., 1996), par
des voies indépendantes d’AUX1. L’effet du vers de terre produit le même effet qu’un apport
exogène d’auxine. La réponse transcriptomique d’A. thaliana à la présence d’organismes du
sol semble suggérer que la voie de signalisation sous contrôle de l’auxine est bien impliquée,
aussi bien en présence de vers de terre (Chapitre 1) que de collemboles (Endlweber et al.,
2011). Cependant, l’implication d’autres molécules signal interagissant avec l’auxine et
impliquées dans les mêmes processus de croissance ne peut être exclue.
L’éthylène pourrait également être responsable des effets observés car cette hormone
interagit avec la voie de signalisation de l’auxine. Cette hypothèse est cohérente avec d’autres
études qui montrent que les gènes AUX1 et AXR4 sont connus pour répondre à d’autres
hormones telles que l’éthylène (Rahman et al., 2001; Lewis et al., 2011) ou bien des
composés organiques volatiles (López-Bucio et al., 2007).
2.3. La balance hormonale : une petite perturbation pour de grandes conséquences
L’implication d’une régulation de la balance entre les hormones à l’intérieur de la
plante permet d’expliquer les effets contrastés des déjections de vers de terre sur la croissance
tel-0
0804
633,
ver
sion
1 -
26 M
ar 2
013
Discussion générale
112
de plantes. Dans notre étude (Chapitre 1), nous avons observé un effet négatif des vers de
terre sur O. sativa alors qu’il est positif sur L. perenne dans le même dispositif. De même,
cette hypothèse permet de comprendre l’effet négatif sur le cultivar columbia alors qu’il est
positif sur le double mutant aux1-7 ; axr4-2 (Chapitre 1). La signalisation des hormones est
connue pour être soumise à une fine régulation dépendante de leur concentration tout autant
que de leur nature, de leur interaction avec les autres hormones et de l’espèce végétale. De
son côté, la plante a mis en place des mécanismes pour ce prémunir de ces effet négatifs
causés par un apport exogène d’auxine. Ces mécanismes sont bien connus en ce qui concerne
l’interaction entre les plantes et les PGPR. La production d’auxine par certaines PGPR
conduit à l’émission d’1-aminocyclopropane-1-carboxylic acid (ACC) par la plante au travers
d’exsudats. Cet ACC se retrouve dans la rhizopshère et va alors réprimer l’élongation
racinaire comme le ferait un apport exogène d’éthylène (Persello-Cartieaux et al., 2003).
Cependant, certaines bactéries se sont à leur tour adaptées à ce mécanisme de défense de la
plante. Certaines PGPR possèdent un gène codant pour l’ACC désaminase qui va hydrolyser
l’ACC en ammonium et α-ketobutyrate. L’hydrolyse de cet ACC par ces bactéries va
conduire à un déséquilibre entre la concentration interne et externe de ce composé. Ceci va
conduire à une augmentation de l’émission de ce composé par la plante afin de maintenir
l’équilibre. La plante va alors présenter une augmentation de l’élongation racinaire compte
tenu de la diminution de la concentration interne en éthylène (Persello-Cartieaux et al., 2003).
Au niveau de notre étude (Chapitre 1), l’implication de l’éthylène ne peut être écartée. Les
mutants aux1-7 et axr4-2 sont connu pour être insensibles à l’éthylène. L’induction de gènes
sous contrôle de l’auxine par un apport exogène d’ACC est perdue chez le mutant aux1-7
(Stepanova et al., 2007) et chez le mutant axr4-2 (Lewis et al., 2011). Dans l’hypothèse où cet
ACC ne serait pas dégradé par les bactéries présentes dans le milieu, on devrait donc observer
un effet inhibiteur sur la croissance du cultivar sauvage d’A. thaliana, alors que le double
mutant insensible n’aurait pas sa croissance inhibée.
En plus des effets « dose dépendant » et « organe dépendant » de certaines hormones,
il existe également un effet génotype. Cet effet « génotype dépendant » est illustré par
certaines études portant sur les bactéries délétères de la croissance des plantes (DRB). Une
spécificité entre la souche DRB et la plante hôte semble être un facteur important dans l’issue
positive ou négative de l’interaction, sur la croissance de la plante. A partir de l’isolation de
bactéries de la rhizosphère d’une culture de carottes (Daucus carota), un effet négatif sur la
tel-0
0804
633,
ver
sion
1 -
26 M
ar 2
013
Discussion générale
113
croissance des plants de carotte a été observé avec 7% des bactéries isolées alors que 29% des
bactéries isolées inhibent la croissance de la pomme de terre (Surette et al., 2003).
Les PGPR sont considérées comme étant antagonistes aux DRB. Leur coexistence et
leurs adaptations réciproques ont abouties à des modes de coexistence spécifiques. Par
exemple, l’association commensale entre une souche DRB de Pseudomonas et une souche
PGPR de Bacillus (Probanza et al., 1996) témoigne de la coévolution entre DRB et PGPR. La
classification d’une souche bactérienne au sein des PGPR ou des DRB est basée sur des
« bioassays », c'est-à-dire des tests sur du matériel vivant, comme une plante spécifique.
Puisque l’effet des DRB et des PGPR est propre à chaque génotype de plante, certaines
bactéries de la rhizosphère sélectionnées comme PGPR sur une espèce végétale donnée se
sont révélées avoir des effets délétères sur la croissance d’autres espèces (Nehl et al., 1996;
Kremer, 2006). Cet effet ce retrouve également dans une de notre étude (Chapitre 3). Une
bactérie isolée dans la rhizosphère de plants de pomme de terre (Solanum tuberosum) à partir
de sa capacité à produire de l’auxine s’est révélée avoir un effet inhibiteur sur la croissance
d’A. thaliana. Cet effet délétère est d’autant plus important que la taille de la population
inoculée était grande, comme déjà observé pour d’autres PGPR et DRB (Persello-Cartieaux et
al., 2001). Un effet antagoniste de ces DRB sur les PGPR semble également suggéré par notre
étude. L’effet positif du vers de terre sur la croissance d’A. thaliana s’estompe d’autant plus
que la taille de l’inoculum est grande. La réduction de l’effet des vers de terre par ces DRB
serait donc due à un effet antagoniste de ces DRB sur les populations de PGPR stimulées par
les vers de terre.
3. Impact des vers de terre sur les mécanismes de résistance des plantes :
implication des molécules signal
3.1. Les mécanismes de défense basale chez les plantes
La plante se développe dans un environnement complexe dans lequel elle est amenée à
interagir avec divers agents pathogènes qui ont des modes de vie et des stratégies d’infection
différents (Pieterse et al., 2009). Le premier obstacle rencontré par les pathogènes lors de
l’attaque de la plante est la barrière physique (la paroi), enzymatique et chimique dressée par
la plante. Le champignon pathogène responsable du piétin échaudage, Gaeumannomyces
tel-0
0804
633,
ver
sion
1 -
26 M
ar 2
013
Discussion générale
114
graminis, est capable de synthétiser un large spectre d’enzymes impliquées dans la
dégradation de ces parois (Freeman & Ward, 2004). Cependant, même si le pathogène
possède toutes les enzymes nécessaires, la plante est capable de synthétiser et d’émettre au
travers d’exsudats de nombreuses enzymes et composés chimiques pouvant empêcher
l’infection par le pathogène. Par exemple, les racines d’avoine synthétisent une saponine,
l’avenacine, qui est un métabolite secondaire ayant un effet antimicrobien efficace face à de
nombreux champignons. Les pathogènes ont développé des réponses pour déjouer l’inhibition
de l’infection par ces molécules exsudées : G. graminis var avena possède une avenacinase
qui permet la dégradation de cette molécule alors que G. graminis var tritici ne la possède
pas. Ainsi, les composés exsudés et les enzymes impliquées dans leur dégradation permettent
d’expliquer que G. graminis var tritici ne peut pas infecter les racines de plant d’avoine alors
que G. graminis var avena en est capable (Freeman & Ward, 2004).
3.2. Les molécules signal dans la reconnaissance de Gaeumannomyces graminis
En cas de réussite de l’agent pathogène à traverser la paroi ou d’échapper à des
molécules exsudées, la plante va alors mettre en place d’autres mécanismes de défense. Les
plantes et les organismes pathogènes ayant co-évolué conjointement, des mécanismes de
reconnaissance et d’évitement ce sont mis en place du fait de la sélection naturelle. Cette
évolution conjointe est décrite comme une « course à l’armement » dans laquelle le pathogène
développe des armes qui déjouent les défenses de la plante, tandis que la plante développe un
nouveau système de défense contre les nouvelles armes du pathogène (Pieterse et al., 2009;
Kombrink et al., 2011). Les armes du pathogène peuvent être reconnues par la plante qui
interprète la présence de certaines molécules produites par le pathogène comme des indicateur
de sa présence ; ces molécules, appelées molécules élicitrices, deviennent par sélection
naturelle des molécules déclenchant les mécanismes de défense des plantes. Ce mécanisme de
reconnaissance des molécules élicitrices est un mécanisme connu et répandu dans le règne
animal et végétal. Il a déjà été bien étudié pour des mammifères (souris), insectes (drosophile)
et plantes monocotylédones (riz) et dicotylédones (Arabidopsis thaliana) (Gómez-Gómez &
Boller, 2002; Ronald & Beutler, 2010). Une de nos expériences met en évidence ce type de
mécanisme de reconnaissance (Chapitre 4) : en présence du champignon responsable du piétin
échaudage, la plante est capable de reconnaitre certaines molécules effectrices comme en
témoigne le profil d’accumulation des transcrits des gènes CPK7 et RBOH-F (Figure 14).
L’initiation des mécanismes de défense de la plante se fait au travers de la reconnaissance
tel-0
0804
633,
ver
sion
1 -
26 M
ar 2
013
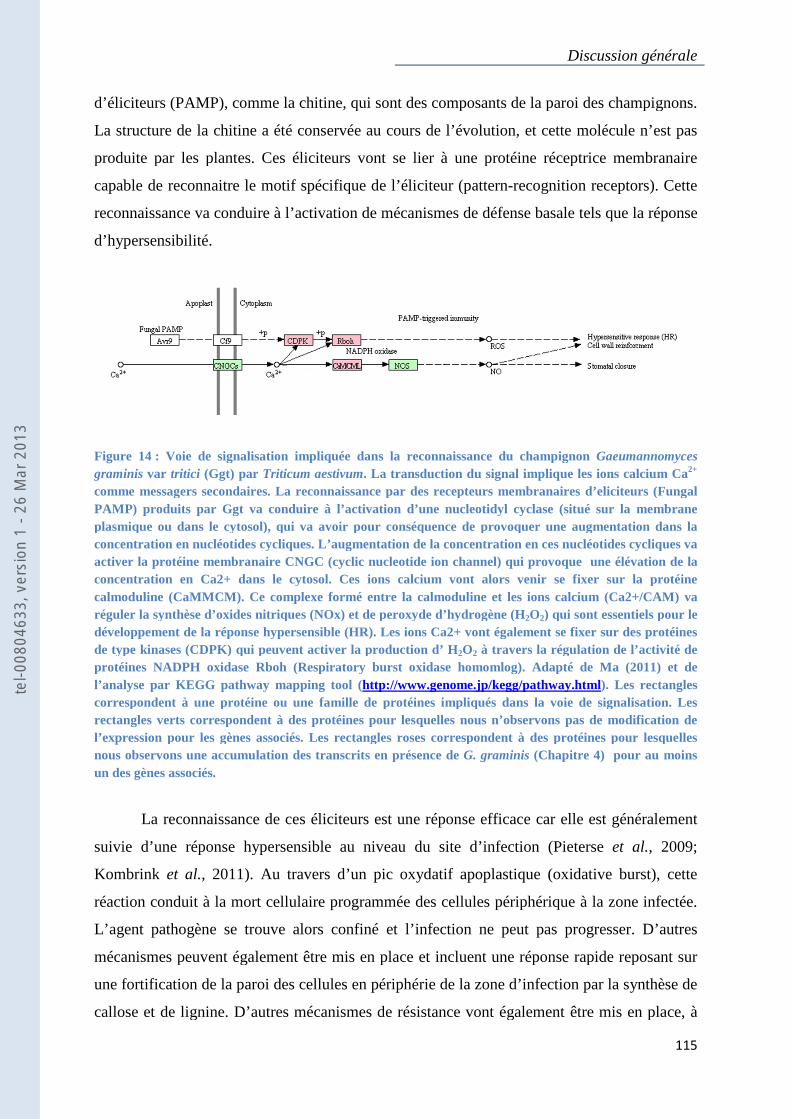
d’éliciteurs (PAMP), comme la chitine, qui sont des composants de la paroi des champignons.
La structure de la chitine a été conservée au cours de l’évo
produite par les plantes. Ces éliciteurs vont se lier à une protéine réceptrice membranaire
capable de reconnaitre le motif spécifique de l’éliciteur (
reconnaissance va conduire à l’
d’hypersensibilité.
Figure 14 : Voie de signalisation impliquée dans la reconnaissance du champignon graminis var tritici (Ggt) par Triticum aestivucomme messagers secondaires. La reconnaissance par des recepteurs membranaires d’eliciteurs (Fungal PAMP) produits par Ggt va conduire à l’activation d’une nucleotidyl cyclase (situé sur la membraplasmique ou dans le cytosol), qui va avoir pour conséquence de provoquer une augmentation dans la concentration en nucléotides cycliques. L’augmentation de la concentration en ces nucléotides cycliques va activer la protéine membranaire CNGC (cyclic nuconcentration en Ca2+ dans le cytosol. Ces ions calcium vont alors venir se fixer sur la protéine calmoduline (CaMMCM). Ce complexe formé entre la calmoduline et les ions calcium (Ca2+/CAM) va réguler la synthèse d’oxides nitriques (NOx) et de peroxyde d’hydrogène (Hdéveloppement de la réponse hypersensible (HR). Les ions Ca2+ vont également se fixer sur des protéines de type kinases (CDPK) qui peuvent activer la producprotéines NADPH oxidase Rboh (Respiratory burst oxidase homomlog). Adapté de Ma (2011) et de l’analyse par KEGG pathway mapping tool (correspondent à une protéine ou une famille de protéines impliqués dans rectangles verts correspondent à des protéines pour lesquelles nous n’observons pas de modification de l’expression pour les gènes associés. Les rectangles roses correspondent à des protéines pour lesquelles nous observons une accumulation des transcrits en présence de un des gènes associés.
La reconnaissance de ces é
suivie d’une réponse hypersensible au niveau du site d’infection
Kombrink et al., 2011). Au travers d’un pic oxydatif apoplastique (oxidative burst), cette
réaction conduit à la mort cellulaire
L’agent pathogène se trouve alors con
mécanismes peuvent également être mis en place et incluent une réponse rapide reposant
une fortification de la paroi des cellules en périphérie
callose et de lignine. D’autres mécanismes de résistance vont également être mis en place, à
Discussion générale
d’éliciteurs (PAMP), comme la chitine, qui sont des composants de la paroi des champignons.
La structure de la chitine a été conservée au cours de l’évolution, et cette molécule n’est pas
produite par les plantes. Ces éliciteurs vont se lier à une protéine réceptrice membranaire
capable de reconnaitre le motif spécifique de l’éliciteur (pattern-recognition receptors)
reconnaissance va conduire à l’activation de mécanismes de défense basale tel
Voie de signalisation impliquée dans la reconnaissance du champignon Triticum aestivum. La transduction du signal implique les ions calcium Ca
comme messagers secondaires. La reconnaissance par des recepteurs membranaires d’eliciteurs (Fungal PAMP) produits par Ggt va conduire à l’activation d’une nucleotidyl cyclase (situé sur la membraplasmique ou dans le cytosol), qui va avoir pour conséquence de provoquer une augmentation dans la concentration en nucléotides cycliques. L’augmentation de la concentration en ces nucléotides cycliques va activer la protéine membranaire CNGC (cyclic nucleotide ion channel) qui provoque une élévation de la concentration en Ca2+ dans le cytosol. Ces ions calcium vont alors venir se fixer sur la protéine calmoduline (CaMMCM). Ce complexe formé entre la calmoduline et les ions calcium (Ca2+/CAM) va
la synthèse d’oxides nitriques (NOx) et de peroxyde d’hydrogène (H2O2) qui sont essentiels pour le développement de la réponse hypersensible (HR). Les ions Ca2+ vont également se fixer sur des protéines de type kinases (CDPK) qui peuvent activer la production d’ H 2O2 à travers la régulation de l’activité de protéines NADPH oxidase Rboh (Respiratory burst oxidase homomlog). Adapté de Ma (2011) et de l’analyse par KEGG pathway mapping tool (http://www.genome.jp/kegg/pathway.htmlcorrespondent à une protéine ou une famille de protéines impliqués dans la voie de signalisationrectangles verts correspondent à des protéines pour lesquelles nous n’observons pas de modification de
on pour les gènes associés. Les rectangles roses correspondent à des protéines pour lesquelles nous observons une accumulation des transcrits en présence de G. graminis (Chapitre
La reconnaissance de ces éliciteurs est une réponse efficace car elle est généralement
suivie d’une réponse hypersensible au niveau du site d’infection (Pieterse
. Au travers d’un pic oxydatif apoplastique (oxidative burst), cette
à la mort cellulaire programmée des cellules périphérique à la zone infectée
se trouve alors confiné et l’infection ne peut pas progresser
mécanismes peuvent également être mis en place et incluent une réponse rapide reposant
de la paroi des cellules en périphérie de la zone d’infection par la syn
lignine. D’autres mécanismes de résistance vont également être mis en place, à
Discussion générale
115
d’éliciteurs (PAMP), comme la chitine, qui sont des composants de la paroi des champignons.
lution, et cette molécule n’est pas
produite par les plantes. Ces éliciteurs vont se lier à une protéine réceptrice membranaire
recognition receptors). Cette
de mécanismes de défense basale tels que la réponse
Voie de signalisation impliquée dans la reconnaissance du champignon Gaeumannomyces . La transduction du signal implique les ions calcium Ca2+
comme messagers secondaires. La reconnaissance par des recepteurs membranaires d’eliciteurs (Fungal PAMP) produits par Ggt va conduire à l’activation d’une nucleotidyl cyclase (situé sur la membrane plasmique ou dans le cytosol), qui va avoir pour conséquence de provoquer une augmentation dans la concentration en nucléotides cycliques. L’augmentation de la concentration en ces nucléotides cycliques va
cleotide ion channel) qui provoque une élévation de la concentration en Ca2+ dans le cytosol. Ces ions calcium vont alors venir se fixer sur la protéine calmoduline (CaMMCM). Ce complexe formé entre la calmoduline et les ions calcium (Ca2+/CAM) va
) qui sont essentiels pour le développement de la réponse hypersensible (HR). Les ions Ca2+ vont également se fixer sur des protéines
à travers la régulation de l’activité de protéines NADPH oxidase Rboh (Respiratory burst oxidase homomlog). Adapté de Ma (2011) et de
e.jp/kegg/pathway.html). Les rectangles la voie de signalisation. Les
rectangles verts correspondent à des protéines pour lesquelles nous n’observons pas de modification de on pour les gènes associés. Les rectangles roses correspondent à des protéines pour lesquelles
(Chapitre 4) pour au moins
est une réponse efficace car elle est généralement
Pieterse et al., 2009;
. Au travers d’un pic oxydatif apoplastique (oxidative burst), cette
périphérique à la zone infectée.
ne peut pas progresser. D’autres
mécanismes peuvent également être mis en place et incluent une réponse rapide reposant sur
de la zone d’infection par la synthèse de
lignine. D’autres mécanismes de résistance vont également être mis en place, à
tel-0
0804
633,
ver
sion
1 -
26 M
ar 2
013
Discussion générale
116
travers la production de métabolites secondaires ayant une activité antimicrobienne tel que les
phytoalexines ; une accumulation de protéines liées à la pathogénie (Pathogenesis Related
proteins ; PR protein) telles que des chitinases et des glucanases pouvant dégrader les parois
des champignons et des oomycètes.
La maladie du piétin échaudage est responsable de profondes modifications
physiologiques comme en atteste le profil d’accumulation des transcrits dans les stades
précoces (Guilleroux & Osbourn, 2004) et avancés (Partie 4) de l’infection. Nous avons
observé une augmentation de l’accumulation des transcrits pour près de 800 gènes et une
diminution pour près de 700 gènes. Ces gènes pour lesquels il semble y avoir une régulation
différente sont impliqués dans des processus biologiques tel que les processus d’oxydation, la
protéolyse, la biosynthèse et la signalisation hormonale et en particulier dans l’initiation d’une
réponse hypersensible (Figure 14). On notera en particulier l’accumulation de transcrits du
gène CPK7, qui code pour un membre de la famille des protéines kinases calcium
dépendantes (CDPK), du gène RBOHF (Respiratory burst oxidase homomlog), qui code pour
une NADPH oxidase transmembranaire impliquée dans la formation d’espèces réactives de
l’oxygène (ROS) via la génération de radicaux superoxides dans les cellules végétales en
réponse à des pathogènes (Asai et al., 2008; Wi et al., 2012). Ce gène est indispensable à
divers mécanismes de résistance (Chaouch et al., 2012). L’activation de cette cascade
signalétique conduit à une réponse hypersensible au niveau du site d’infection. Cependant,
cette réponse hypersensible n’a pas que des avantages. Elle peut influencer voir faciliter
l’infection de pathogènes nécrotrophes tel que Botrytis cinerea (Govrin & Levine, 2000;
Govrin et al., 2006). Ce pathogène va être capable de résister au stress oxydatif résultant de la
réponse hypersensible (Temme & Tudzynski, 2009). Cette réponse hypersensible va conduire
peu à peu à la mort cellulaire de tous les tissus végétaux infectés, qui serviront de ressources à
B. cinerea et permettront à la maladie de se propager. De plus, le fait de retrouver une
accumulation des transcrits, pour des gènes impliqués dans la cascade signalétique de la
réponse hypersensible, au niveau des feuilles témoigne qu’au lieu d’être adaptative et
localisée au niveau du site d’infection, la réponse de la plante est systémique et donc
probablement due à une manipulation de ce mécanisme de défense par le champignon.
Certains agents pathogènes sont en effet capables de contourner les mécanismes de
défense des plantes ou encore de les manipuler. Cependant, au cours de la coévolution entre
les plantes et leurs pathogènes et de la course à l’armement qui en a résulté, certains
tel-0
0804
633,
ver
sion
1 -
26 M
ar 2
013
Discussion générale
117
pathogènes ont acquis des molécules signal effectrices. Ces molécules sont transportées dans
les cellules de la plante hôte et vont supprimer la réponse initiale de la plante qui était dirigée
par la perception d’éliciteurs (PAMP triggered immunity, PTI). Cette suppression promeut la
virulence du pathogène par une réaction de sensibilité dirigée par des effecteurs (effector
triggered susceptibility, ETS). En réponse, certaines plantes ont acquis des protéines dites de
résistance (R protéines) qui sont capables de reconnaître ces molécules effectrices, résultant
en une seconde réponse de défense appelée immunité dirigée par des effecteurs (effector
triggered immunity, ETI). L’issue de la bataille entre la plante et l’agent pathogène va
dépendre de la balance entre la capacité du pathogène à supprimer les mécanismes de défense
de la plante et de la capacité de la plante à reconnaitre le pathogène et activer un mécanisme
de défense adéquat (Pieterse et al., 2009; Kombrink et al., 2011; Ma & Berkowitz, 2011).
A la suite de cette réponse précoce, mise en place dès le début de l’attaque, va se
mettre en place (1) une cascade signalétique sous contrôle de plusieurs hormones résultant en
(2) l’induction d’un mécanisme de résistance systémique, plus complexe et adapté au type de
pathogène rencontré.
3.3. La balance hormonale dans les mécanismes de résistance des plantes
L’importance de la régulation hormonale en réponse à des stress biotiques (Robert-
Seilaniantz et al., 2007; Robert-Seilaniantz et al., 2011) ou abiotiques (Peleg & Blumwald,
2011; Wilkinson et al., 2012) apparaît de plus en plus comme étant un mécanisme à la base de
la résistance ou bien de la susceptibilité face à ces stress. En réponse au champignon
pathogène G. graminis (Chapitre 4), nous avons observé une diminution de la quantité des
transcrits pour deux gènes impliqués dans la voie de biosynthèse de l’éthylène, le gène ACO1
et ACO4. Ces deux gènes codent pour une 1-aminocyclopropane-1-carboxylate oxidase (ACC
oxidase), impliquée dans la conversion du 1-Aminocyclopropane-1-carboxylic acid (ACC) en
éthylène (Taiz & Zeiger, 2010). Hormis la biosynthèse de certaines hormones, leur voie de
signalisation est également modulée en présence de vers de terre. La régulation de la
signalisation via le protéasome 26S est importante dans les mécanismes de défense (Dielen et
al., 2010; Robert-Seilaniantz et al., 2011). Dans notre étude (Chapitre 4), une diminution de la
quantité des transcrits est observée pour le gène COI1. La protéine codée par ce gène est
fondamentale dans la signalisation de l’acide jasmonique (Figure 15).
tel-0
0804
633,
ver
sion
1 -
26 M
ar 2
013
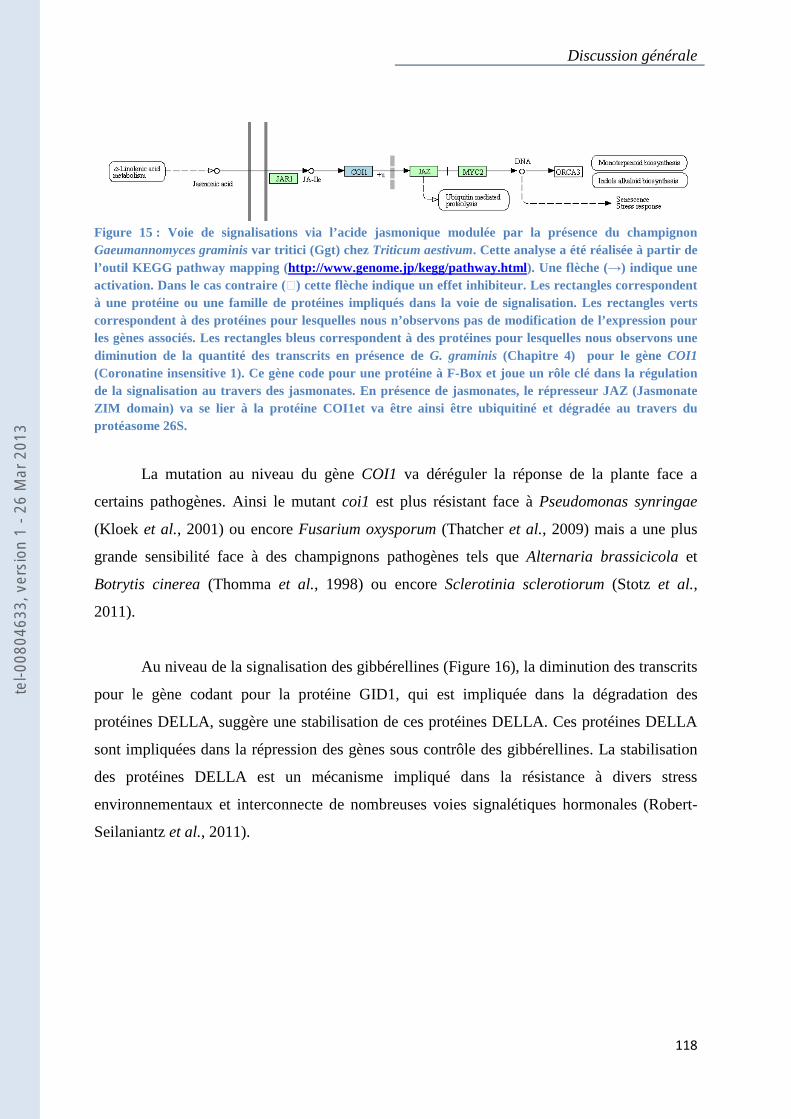
Discussion générale
118
Figure 15 : Voie de signalisations via l’acide jasmonique modulée par la présence du champignon Gaeumannomyces graminis var tritici (Ggt) chez Triticum aestivum. Cette analyse a été réalisée à partir de l’outil KEGG pathway mapping ( http://www.genome.jp/kegg/pathway.html). Une flèche (→) indique une activation. Dans le cas contraire (�) cette flèche indique un effet inhibiteur. Les rectangles correspondent à une protéine ou une famille de protéines impliqués dans la voie de signalisation. Les rectangles verts correspondent à des protéines pour lesquelles nous n’observons pas de modification de l’expression pour les gènes associés. Les rectangles bleus correspondent à des protéines pour lesquelles nous observons une diminution de la quantité des transcrits en présence de G. graminis (Chapitre 4) pour le gène COI1 (Coronatine insensitive 1). Ce gène code pour une protéine à F-Box et joue un rôle clé dans la régulation de la signalisation au travers des jasmonates. En présence de jasmonates, le répresseur JAZ (Jasmonate ZIM domain) va se lier à la protéine COI1et va être ainsi être ubiquitiné et dégradée au travers du protéasome 26S.
La mutation au niveau du gène COI1 va déréguler la réponse de la plante face a
certains pathogènes. Ainsi le mutant coi1 est plus résistant face à Pseudomonas synringae
(Kloek et al., 2001) ou encore Fusarium oxysporum (Thatcher et al., 2009) mais a une plus
grande sensibilité face à des champignons pathogènes tels que Alternaria brassicicola et
Botrytis cinerea (Thomma et al., 1998) ou encore Sclerotinia sclerotiorum (Stotz et al.,
2011).
Au niveau de la signalisation des gibbérellines (Figure 16), la diminution des transcrits
pour le gène codant pour la protéine GID1, qui est impliquée dans la dégradation des
protéines DELLA, suggère une stabilisation de ces protéines DELLA. Ces protéines DELLA
sont impliquées dans la répression des gènes sous contrôle des gibbérellines. La stabilisation
des protéines DELLA est un mécanisme impliqué dans la résistance à divers stress
environnementaux et interconnecte de nombreuses voies signalétiques hormonales (Robert-
Seilaniantz et al., 2011).
tel-0
0804
633,
ver
sion
1 -
26 M
ar 2
013
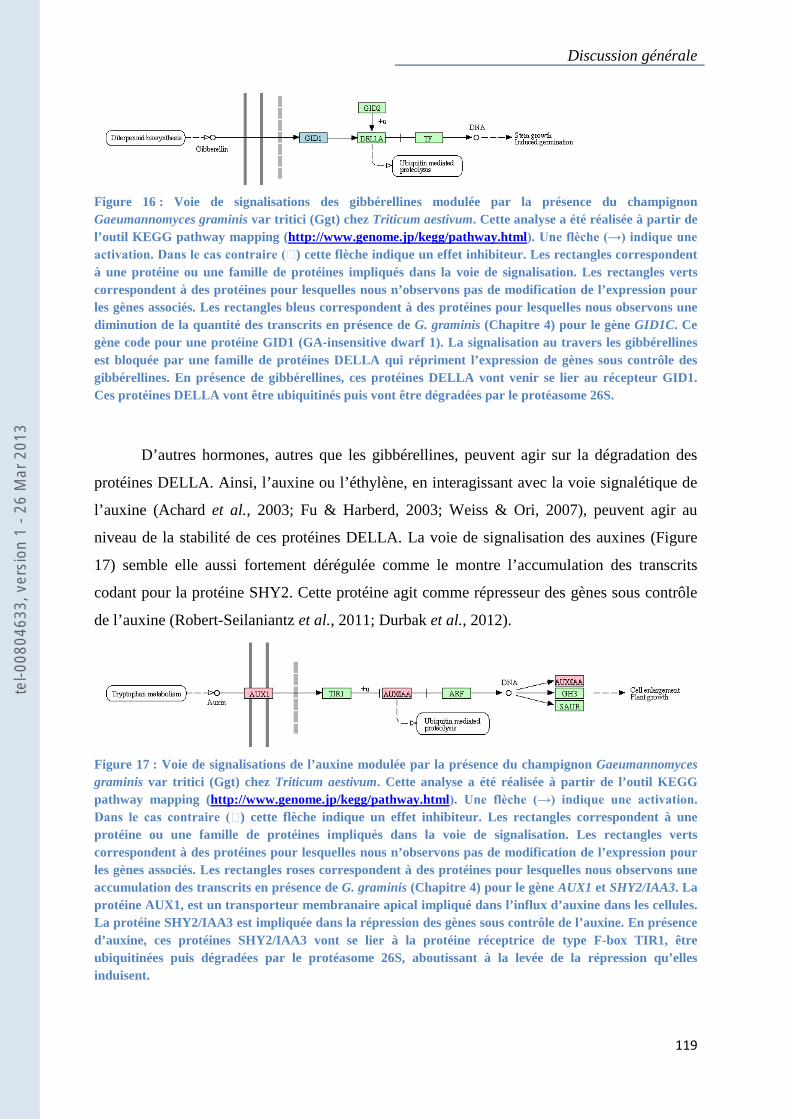
Discussion générale
119
Figure 16 : Voie de signalisations des gibbérellines modulée par la présence du champignon Gaeumannomyces graminis var tritici (Ggt) chez Triticum aestivum. Cette analyse a été réalisée à partir de l’outil KEGG pathway mapping ( http://www.genome.jp/kegg/pathway.html). Une flèche (→) indique une activation. Dans le cas contraire (�) cette flèche indique un effet inhibiteur. Les rectangles correspondent à une protéine ou une famille de protéines impliqués dans la voie de signalisation. Les rectangles verts correspondent à des protéines pour lesquelles nous n’observons pas de modification de l’expression pour les gènes associés. Les rectangles bleus correspondent à des protéines pour lesquelles nous observons une diminution de la quantité des transcrits en présence de G. graminis (Chapitre 4) pour le gène GID1C. Ce gène code pour une protéine GID1 (GA-insensitive dwarf 1). La signalisation au travers les gibbérellines est bloquée par une famille de protéines DELLA qui répriment l’expression de gènes sous contrôle des gibbérellines. En présence de gibbérellines, ces protéines DELLA vont venir se lier au récepteur GID1. Ces protéines DELLA vont être ubiquitinés puis vont être dégradées par le protéasome 26S.
D’autres hormones, autres que les gibbérellines, peuvent agir sur la dégradation des
protéines DELLA. Ainsi, l’auxine ou l’éthylène, en interagissant avec la voie signalétique de
l’auxine (Achard et al., 2003; Fu & Harberd, 2003; Weiss & Ori, 2007), peuvent agir au
niveau de la stabilité de ces protéines DELLA. La voie de signalisation des auxines (Figure
17) semble elle aussi fortement dérégulée comme le montre l’accumulation des transcrits
codant pour la protéine SHY2. Cette protéine agit comme répresseur des gènes sous contrôle
de l’auxine (Robert-Seilaniantz et al., 2011; Durbak et al., 2012).
Figure 17 : Voie de signalisations de l’auxine modulée par la présence du champignon Gaeumannomyces graminis var tritici (Ggt) chez Triticum aestivum. Cette analyse a été réalisée à partir de l’outil KEGG pathway mapping (http://www.genome.jp/kegg/pathway.html). Une flèche (→) indique une activation. Dans le cas contraire (�) cette flèche indique un effet inhibiteur. Les rectangles correspondent à une protéine ou une famille de protéines impliqués dans la voie de signalisation. Les rectangles verts correspondent à des protéines pour lesquelles nous n’observons pas de modification de l’expression pour les gènes associés. Les rectangles roses correspondent à des protéines pour lesquelles nous observons une accumulation des transcrits en présence de G. graminis (Chapitre 4) pour le gène AUX1 et SHY2/IAA3. La protéine AUX1, est un transporteur membranaire apical impliqué dans l’influx d’auxine dans les cellules. La protéine SHY2/IAA3 est impliquée dans la répression des gènes sous contrôle de l’auxine. En présence d’auxine, ces protéines SHY2/IAA3 vont se lier à la protéine réceptrice de type F-box TIR1, être ubiquitinées puis dégradées par le protéasome 26S, aboutissant à la levée de la répression qu’elles induisent.
tel-0
0804
633,
ver
sion
1 -
26 M
ar 2
013
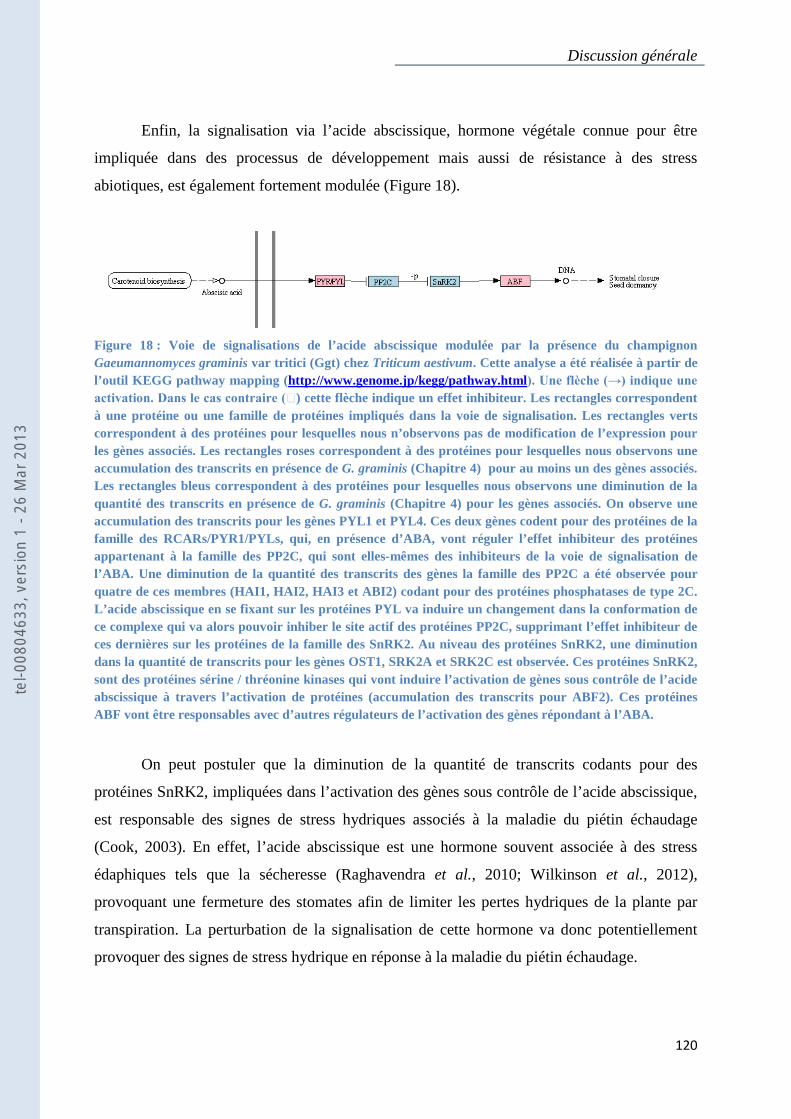
Discussion générale
120
Enfin, la signalisation via l’acide abscissique, hormone végétale connue pour être
impliquée dans des processus de développement mais aussi de résistance à des stress
abiotiques, est également fortement modulée (Figure 18).
Figure 18 : Voie de signalisations de l’acide abscissique modulée par la présence du champignon Gaeumannomyces graminis var tritici (Ggt) chez Triticum aestivum. Cette analyse a été réalisée à partir de l’outil KEGG pathway mapping ( http://www.genome.jp/kegg/pathway.html). Une flèche (→) indique une activation. Dans le cas contraire (�) cette flèche indique un effet inhibiteur. Les rectangles correspondent à une protéine ou une famille de protéines impliqués dans la voie de signalisation. Les rectangles verts correspondent à des protéines pour lesquelles nous n’observons pas de modification de l’expression pour les gènes associés. Les rectangles roses correspondent à des protéines pour lesquelles nous observons une accumulation des transcrits en présence de G. graminis (Chapitre 4) pour au moins un des gènes associés. Les rectangles bleus correspondent à des protéines pour lesquelles nous observons une diminution de la quantité des transcrits en présence de G. graminis (Chapitre 4) pour les gènes associés. On observe une accumulation des transcrits pour les gènes PYL1 et PYL4. Ces deux gènes codent pour des protéines de la famille des RCARs/PYR1/PYLs, qui, en présence d’ABA, vont réguler l’effet inhibiteur des protéines appartenant à la famille des PP2C, qui sont elles-mêmes des inhibiteurs de la voie de signalisation de l’ABA. Une diminution de la quantité des transcrits des gènes la famille des PP2C a été observée pour quatre de ces membres (HAI1, HAI2, HAI3 et ABI2) codant pour des protéines phosphatases de type 2C. L’acide abscissique en se fixant sur les protéines PYL va induire un changement dans la conformation de ce complexe qui va alors pouvoir inhiber le site actif des protéines PP2C, supprimant l’effet inhibiteur de ces dernières sur les protéines de la famille des SnRK2. Au niveau des protéines SnRK2, une diminution dans la quantité de transcrits pour les gènes OST1, SRK2A et SRK2C est observée. Ces protéines SnRK2, sont des protéines sérine / thréonine kinases qui vont induire l’activation de gènes sous contrôle de l’acide abscissique à travers l’activation de protéines (accumulation des transcrits pour ABF2). Ces protéines ABF vont être responsables avec d’autres régulateurs de l’activation des gènes répondant à l’ABA.
On peut postuler que la diminution de la quantité de transcrits codants pour des
protéines SnRK2, impliquées dans l’activation des gènes sous contrôle de l’acide abscissique,
est responsable des signes de stress hydriques associés à la maladie du piétin échaudage
(Cook, 2003). En effet, l’acide abscissique est une hormone souvent associée à des stress
édaphiques tels que la sécheresse (Raghavendra et al., 2010; Wilkinson et al., 2012),
provoquant une fermeture des stomates afin de limiter les pertes hydriques de la plante par
transpiration. La perturbation de la signalisation de cette hormone va donc potentiellement
provoquer des signes de stress hydrique en réponse à la maladie du piétin échaudage.
tel-0
0804
633,
ver
sion
1 -
26 M
ar 2
013
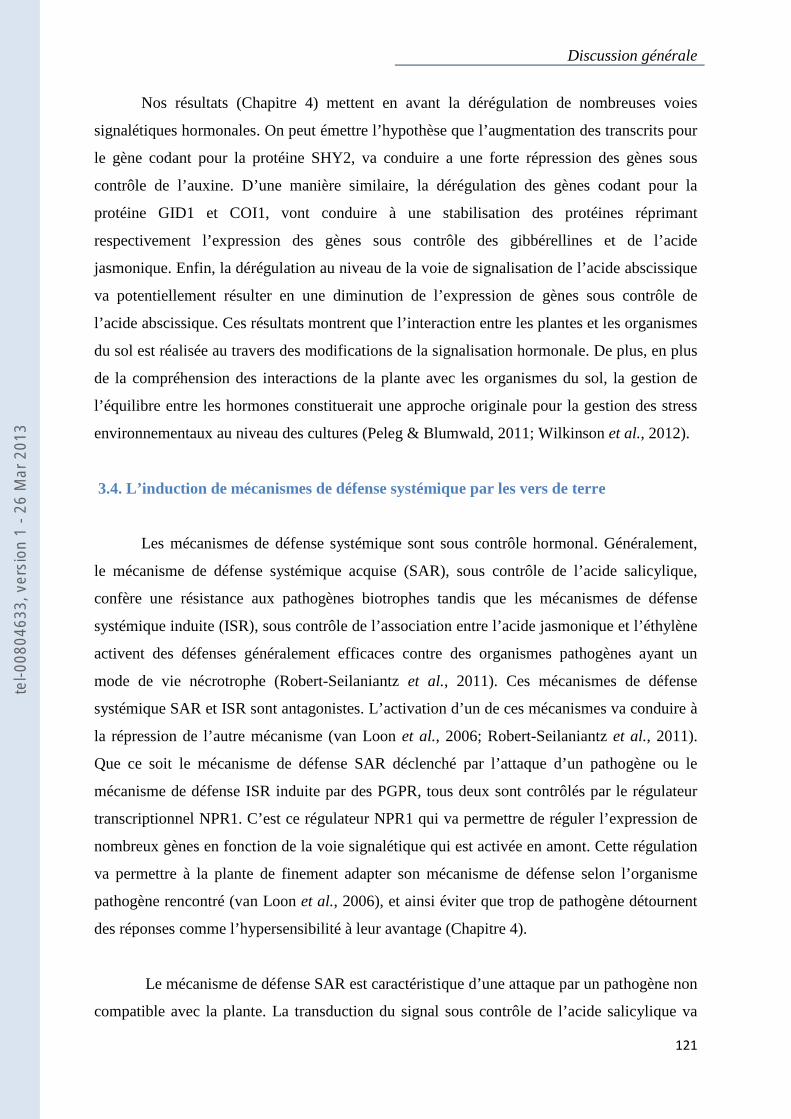
Discussion générale
121
Nos résultats (Chapitre 4) mettent en avant la dérégulation de nombreuses voies
signalétiques hormonales. On peut émettre l’hypothèse que l’augmentation des transcrits pour
le gène codant pour la protéine SHY2, va conduire a une forte répression des gènes sous
contrôle de l’auxine. D’une manière similaire, la dérégulation des gènes codant pour la
protéine GID1 et COI1, vont conduire à une stabilisation des protéines réprimant
respectivement l’expression des gènes sous contrôle des gibbérellines et de l’acide
jasmonique. Enfin, la dérégulation au niveau de la voie de signalisation de l’acide abscissique
va potentiellement résulter en une diminution de l’expression de gènes sous contrôle de
l’acide abscissique. Ces résultats montrent que l’interaction entre les plantes et les organismes
du sol est réalisée au travers des modifications de la signalisation hormonale. De plus, en plus
de la compréhension des interactions de la plante avec les organismes du sol, la gestion de
l’équilibre entre les hormones constituerait une approche originale pour la gestion des stress
environnementaux au niveau des cultures (Peleg & Blumwald, 2011; Wilkinson et al., 2012).
3.4. L’induction de mécanismes de défense systémique par les vers de terre
Les mécanismes de défense systémique sont sous contrôle hormonal. Généralement,
le mécanisme de défense systémique acquise (SAR), sous contrôle de l’acide salicylique,
confère une résistance aux pathogènes biotrophes tandis que les mécanismes de défense
systémique induite (ISR), sous contrôle de l’association entre l’acide jasmonique et l’éthylène
activent des défenses généralement efficaces contre des organismes pathogènes ayant un
mode de vie nécrotrophe (Robert-Seilaniantz et al., 2011). Ces mécanismes de défense
systémique SAR et ISR sont antagonistes. L’activation d’un de ces mécanismes va conduire à
la répression de l’autre mécanisme (van Loon et al., 2006; Robert-Seilaniantz et al., 2011).
Que ce soit le mécanisme de défense SAR déclenché par l’attaque d’un pathogène ou le
mécanisme de défense ISR induite par des PGPR, tous deux sont contrôlés par le régulateur
transcriptionnel NPR1. C’est ce régulateur NPR1 qui va permettre de réguler l’expression de
nombreux gènes en fonction de la voie signalétique qui est activée en amont. Cette régulation
va permettre à la plante de finement adapter son mécanisme de défense selon l’organisme
pathogène rencontré (van Loon et al., 2006), et ainsi éviter que trop de pathogène détournent
des réponses comme l’hypersensibilité à leur avantage (Chapitre 4).
Le mécanisme de défense SAR est caractéristique d’une attaque par un pathogène non
compatible avec la plante. La transduction du signal sous contrôle de l’acide salicylique va
tel-0
0804
633,
ver
sion
1 -
26 M
ar 2
013
Discussion générale
122
alors provoquer une synthèse et accumulation de protéines de défense. Cette accumulation va
être réalisée localement au niveau du site d’infection dans un premier temps, puis de façon
systémique, dans l’ensemble des tissus de la plante. Ce mécanisme va rester actif pendant des
semaines, voire des mois, et conférera une meilleure résistance de la plante si une nouvelle
attaque d’un organisme pathogène a lieu (Kombrink et al., 2011).
Contrairement à la SAR qui est induite par une attaque d’un organisme pathogène,
l’ISR n’est pas associée à une forte reprogrammation du transcriptome. Le changement au
niveau de l’expression des gènes étant souvent faible voir négligeable (van Wees et al., 2008).
L’ISR est caractéristique de l’interaction avec certaines PGPR. Les motifs spécifiques
(MAPM) reconnus par la plante au travers d’un système de perception (PRR) incluent une
large liste de composés : des lipoplysaccharides de bactéries Gram-négatif, des falgellines
bactériennes, des facteurs d’élongation EF-Tu, de la chitine d’origine fongique ou encore plus
récemment des peptides sulfatés nommés Ax21 isolés chez une proteobactérie
phytopathogène du riz Xanthomonas oryzae oryzae (Bakker et al., 2007). Des extraits purifiés
de flagelline, induisent chez A. thaliana une ISR au travers de leur perception par la protéine
membranaire FLS2, tandis que chez les plants d’haricot et de tomate, ce mécanisme n’est pas
induit (Gómez-Gómez & Boller, 2002; Bakker et al., 2007) soulignant la spécificité de
l’induction de ce mécanisme en fonction du génotype de la plante hôte.
En présence de vers de terre (Chapitre 4), on observe niveau des feuilles une
accumulation des transcrits pour certains gènes induits lors de stress biotiques ou abiotiques.
Certains de ces gènes sont sous contrôle de certaines hormones végétales comme les
jasmonates (JA) et l’éthylène. Ainsi, on observe une accumulation des transcrits pour les
gènes PR-4 et PDF1.2 identifiés comme étant des marqueurs de la réponse d’ISR (van Loon
et al., 2006). De plus, contrairement à la SAR, l’ISR n’est pas associée à une forte
reprogrammation du transcriptome (van Wees et al., 2008). Ceci est cohérent avec la faible
proportion de gènes qui semblent modulés par la présence du ver de terre. L’absence de
différence au niveau de l’accumulation des transcrits pour des gènes connus pour être régulés
par l’acide salicylique, comme des gènes codant pour des protéines PR (PR-1 par exemple),
semble indiquer que le vers de terre n’exercent pas un stress sur le système racinaire de la
plante comme celui que l’on pourrait rencontrer avec l’attaque de certains insectes herbivores
(Engelberth et al., 2012). En complément, la comparaison du profil transcriptomique d’A.
thaliana en présence de vers de terre avec d’autres études référencées dans la base de données
tel-0
0804
633,
ver
sion
1 -
26 M
ar 2
013
Discussion générale
123
Genevestigator montre une forte similarité entre notre profil transcriptomique et ceux d’études
portant sur l’influence d’extraits purifiés de flagellines, d’autres molécules élicitrices (ET-Fu)
ainsi que des organismes pathogènes inactivés. Ces résultats viennent appuyer l’hypothèse
d’une action synergique entre les vers de terre et les bactéries de la rhizosphère capables
d’induire une ISR.
tel-0
0804
633,
ver
sion
1 -
26 M
ar 2
013

Perspectives
124
Perspectives
tel-0
0804
633,
ver
sion
1 -
26 M
ar 2
013
Perspectives
125
La synthèse de nos résultats met en évidence l’implication de molécules signal dans l’effet
des vers de terre sur les plantes. Ce mécanisme étant probablement réalisé en étroite
collaboration avec certains microorganismes de la rhizosphère. Il serait intéressant de
mettre en place une série d’expérience afin de conforter nos résultats et d’approfondir
l’exploration des mécanismes impliqués dans la réponse des plantes à cette association des
vers de terre avec les microorganismes du sol. Dans ce but, nous proposons quatre axes de
recherche distincts, mais complémentaires : (1) caractériser les changements induis par les
vers de terre au niveau des populations microbiennes du sol ; (2) étudier plus précisément les
voies métaboliques impliquées chez la plante dans la réponse aux vers de terre ; (3)
caractériser ces molécules signal dans les sols ; (4) étudier le lien évolutif entre les
microorganismes du sol, les vers de terre et les plantes.
1. Etude des modifications de la composition des communautés
microbiennes du sol.
Dans nos expériences, le lien entre les vers de terre et certains microorganismes du sol
capable de promouvoir la croissance des plantes a été mis en évidence. Ces résultats
fournissent une première démonstration de l’implication des molécules signal dans l’effet des
vers de terre sur les plantes. Cependant, ces effets ont été observés à travers des changements
au niveau de la croissance, du développement et de la résistance des plantes (Chapitre 1 et 4).
Ces changements sont analogues et spécifiques à ceux induits par les populations de PGPR.
Nous avons démontré également une influence des vers de terre sur ces PGPR. Ces études
préliminaires constituent de nouvelles pistes de recherche qu’il est nécessaire d’approfondir.
Dans nos autres études (Chapitre 2 et 3), nous nous sommes intéressés à une fraction réduite
des bactéries du sol : les communautés cultivables ou une souche de PGPR inoculée. Ces
études ont également été centrées autour d’une fonction, la production d’acide indole acétique
par ces bactéries. Il est nécessaire de réaliser des études sur l’influence des vers sur
l’ensemble des communautés de microorganismes pour différentes fonctions comme la
production d’autres molécules signal ou des composés antibiotiques afin de dégager une
vision plus globale. Afin d’atteindre ces objectifs, l’utilisation de nouvelles techniques
émergeantes en écologie microbienne comme la métagénomique fournirait un outil adapté à
cette problématique.
tel-0
0804
633,
ver
sion
1 -
26 M
ar 2
013
Perspectives
126
Actuellement, la question de la diversité des microorganismes d’un sol est étudiée en
ciblant une séquence d’un gène codant pour la petite sous-unité 16S des ribosomes. Le choix
de cette séquence est dû à son ubiquité et à son haut degré de conservation au sein des
microorganismes. Cette technique repose sur l’extraction de l’ADN total d’un sol. La
séquence complète ou bien une séquence partielle vont être amplifiés par réaction en chaîne
de polymérisation (PCR). L’obtention des séquences complètes est utilisée afin de construire
des arbres phylogénétiques pour étudier les communautés de microorganismes.
L’amplification par PCR d’une séquence partielle, plus rapide, est quant à elle utilisée afin de
réaliser une empreinte génétique sur électrophorèse sur gel en gradient dénaturant (DGGE).
Pour l’empreinte génétique, les différents fragments obtenus après PCR vont être séparés en
fonction de leur taille et de leur composition en acides nucléiques. Cette méthode est la
technique couramment utilisée afin de caractériser de manière simple et rapide la diversité
globale des communautés microbiennes d’un sol en un temps et lieu donné.
Cette technique donnant une vision sur la diversité globale est souvent couplée à une
autre technique permettant d’étudier le fonctionnement de ces communautés. Généralement,
cette analyse est réalisée à travers le système BioLog MicroPlates. Ce système permet de
tester 95 substrats carbonés différents et repose sur la capacité d’une communauté à se
développer sur ces milieux. Les différents organismes, composant la communauté qui a été
isolés du sol, vont consommer ces différents substrats carbonés à des vitesses différentes. Ceci
va renseigner sur la structure de la communauté ainsi que sur la diversité fonctionnelle.
Ces deux techniques ont couramment été utilisées afin de caractériser des changements
au niveau de la composition et du fonctionnement des communautés bactériennes d’un sol
(Barton & Northup, 2011). Toutefois, ces deux techniques pourraient être adaptées à notre
problématique d’étude. La synthèse de molécules signal agissant sur la croissance des plantes
est largement répandue au sein des microorganismes du sol (Persello-Cartieaux et al., 2003;
Hayat et al., 2010). De plus, de nombreuses voies de biosynthèse de ces composés par les
microorganismes du sol ont déjà été identifiées (Frankenberger & Arshad, 1995; Hooykaas et
al., 1999; Persello-Cartieaux et al., 2003). En prenant comme exemple l’auxine, sa voie de
biosynthèse chez les microorganismes du sol, similaire à celle de chez les plantes, diffère
cependant sur quelques points (Figure 7). Certaines enzymes impliquées dans cette voie de
biosynthèse propre aux microorganismes ont été identifiées et la séquence des gènes codant
pour ces enzymes est connue (Lehmann et al., 2010). En amplifiant ces gènes par PCR, il
tel-0
0804
633,
ver
sion
1 -
26 M
ar 2
013
Perspectives
127
serait possible d’avoir une empreinte génétique de l’ensemble des microorganismes,
cultivables ou non, capables de participer à la voie de biosynthèse des auxines. A partir de
cette empreinte, il nous sera alors possible de déterminer l’impact des vers de terre sur la
diversité fonctionnelle des microorganismes capables de produire de l’auxine dans un sol.
Pour ce qui est du profil global, l’étude du gène codant pour la petite sous-unité du
ribosome 16S fourni des informations importantes. Cependant, ces profils ne renseignent pas
sur la composition exacte de communauté microbienne, du fait de la petite taille du fragment
amplifié. Afin d’obtenir des arbres phylogénétiques précis il faut passer à des techniques plus
lourdes comme le séquençage des séquences complètes. L’émergence de nouvelles techniques
en écologie microbienne peut permettre d’obtenir simultanément des informations sur la
diversité globale spécifique et fonctionnelle des microorganismes. Une de ces techniques est
la métagénomique. Cette technique présente l’avantage d’être basée sur un protocole ne
nécessitant pas de cultiver les organismes isolés dans un environnement. Ceci représente un
grand avantage méthodologique sur les techniques nécessitant de cultiver les bactéries. En
effet, on estime que dans la plupart des environnements, 99% des microorganismes ne
peuvent être cultivés selon les méthodes courantes (Riesenfeld et al., 2004). Un autre
avantage de la métagénomique est d’analyser le génome complet de tous les organismes
composant la communauté et non plus de cibler qu’une séquence du génome. Cette technique
va alors permettre d’étudier la nature et le potentiel fonctionnel de quasiment chaque
microorganisme présent, avec un degré de précision dépendant de la profondeur du
séquençage.
Au niveau de la technique, la métagénomique commence par l’extraction de l’ADN
total d’un échantillon prélevé dans un milieu. Cette étape va être suivie de l’insertion de ces
molécules d’ADN dans un vecteur plasmidique. Ces vecteurs vont par la suite être clonés
dans un organisme hôte tel qu’Escherichia coli afin de constituer une banque génomique. Par
la suite cette banque génomique pourra être séquencée grâce aux nouvelles techniques de
séquençage à haut débit (technologie 454 et CRT Solexa/Illumina). A partir des données de ce
séquençage, des ARN ribosomaux de la sous unité 16S, qui sont des gènes hautement
conservés et présents en grande quantité pourront être ciblés afin de constituer des arbres
phylogénétiques. Cette banque d’ADN pourra également être utilisée afin d’étudier le
potentiel fonctionnel de la communauté. Grâce à d’autres techniques telles que la
tel-0
0804
633,
ver
sion
1 -
26 M
ar 2
013
Perspectives
128
métatranscriptomique et la métaprotéomique, l’expression de ces gènes et l’analyse de
l’activité spécifique de certaines enzymes permettra de connaître le fonctionnement de ces
communautés. De cette façon, certains gènes codant pour certaines enzymes impliquées dans
la biosynthèse des molécules signal peuvent être ciblés, leur expression étudiée et leur activité
enzymatique évaluée.
2. Etude des voies métaboliques impliquées dans la réponse des plantes aux
organismes du sol.
Les vers de terre, comme d’autres organismes du sol, tel que le champignon
responsable de la maladie du piétin échaudage, sont responsables de changements au niveau
du transcriptome de la plante (Chapitre 1 et 4). Ces changements semblent réalisés en étroite
collaboration avec la voie signalétique de nombreuses hormones. L’utilisation de plantes
ayant subit une mutation sur un ou plusieurs gènes impliqués dans la signalisation de ces
hormones constitue un outil performant dans l’étude de ces mécanismes. Les plantes mutantes
ont été largement utilisées afin de comprendre le mécanisme d’action des PGPR sur les
plantes. Ces études ont par exemple permis de mettre en évidence une interaction de certaines
PGPR avec l’homéostasie hormonale des plantes ou encore la mise en évidence de
l’implication de molécules signal à l’origine de l’initiation de l’ISR (Persello-Cartieaux et al.,
2003; Bakker et al., 2007; Zhang et al., 2007a; Zhang et al., 2007b).
Ces études portant sur les PGPR se sont généralement intéressées à une souche
spécifique. Le vers de terre, par un remaniement de l’ensemble des communautés
microbiennes, va complexifier les interactions qui sont entretenues entre les microorganismes
de la rhizosphère et la plante. De cette complexification va résulter une modification de
l’abondance relative de l’ensemble des molécules signal produites. L’utilisation de plantes
mutantes soumises à une variation de l’abondance relative de ces composés pourrait permettre
d’identifier les voies signalétiques impliquées dans la réponse aux vers de terre. De plus,
grâce à l’utilisation de mutants, il serait possible de supprimer des carrefours signalétiques
(cross-talk) et ainsi d’identifier l’implication d’une molécule signal indépendamment de ses
interactions avec les autres. Il serait ainsi possible de déterminer si l’implication de l’auxine
dans l’effet du vers de terre, mise en évidence par la réponse du double mutant d’A. thaliana
tel-0
0804
633,
ver
sion
1 -
26 M
ar 2
013
Perspectives
129
aux1-7 ;axr4-2, est bien due à l’émission de cette hormone dans la rhizosphère, ou à une autre
molécule signal comme l’éthylène ou un éliciteur bactérien.
Dans la continuité de cette étude, il serait intéressant de voir l’interaction des ces voies
métaboliques avec le changement des propriétés chimiques (nutriments) et physiques
(porosité et agrégation) induit par les vers de terre au niveau des sols. Les vers de terre via
leur activité vont conduire à l’apparition de zones (patch) où les nutriments sont à des
concentrations différentes du sol adjacent. Ces différence de la distribution des nutriments
(comme le nitrate) sont connues pour influencer l’émission et élongation des racines latérales
(Zhang et al., 1999; Linkohr et al., 2002). Dans une étude annexe à ce travail (Annexe 2),
nous nous sommes déjà intéressés à l’influence de la distribution et de la disponibilité en
nitrate sur le développement d’Arabidopsis thaliana (Blouin & Puga-Freitas, 2011). Dans un
dispositif de culture in vitro, plusieurs doses (faible, optimale et forte) de teneur en nitrates on
été couplées à différents degrés d’hétérogénéité (nulle, faible et forte). Dans la continuité de
ces travaux, il serait intéressant d’étudier la réponse de plusieurs plantes mutantes affectées
dans la signalisation d’une ou plusieurs hormones dans notre dispositif expérimental. Il serait
notamment intéressant de faire le lien entre l’hétérogénéité de la distribution des nutriments,
la teneur en nutriments des zones riches et la présence de molécules signal dans ces zones, qui
pourrait modifier la croissance et le développement des racines.
3. Dosage des molécules signal dans les sols
Une autre démonstration claire de l’impact des vers de terre sur les molécules signal
serait de doser ces composés dans les sols. L’élaboration d’un protocole permettant d’extraire,
d’isoler, de doser ces composés et de caractériser leur effet sur les plantes permettrait
d’étudier la stabilité, la disponibilité et l’abondance de ces composés dans les sols et de mieux
comprendre l’effet des vers de terre. Largement maîtrisé pour les tissus végétaux (Hooykaas
et al., 1999; Birkemeyer et al., 2003; Barkawi et al., 2008), le dosage de ces composés dans
les sols est soumis à de nombreuses contraintes. Comme souligné précédemment, le dosage de
l’auxine a déjà été entrepris dans les déjections des vers de terre (Nardi et al., 1988; Tomati et
al., 1988 ; Muscolo et al., 1998; Canellas et al., 2002). Ces dosages ont été entrepris selon des
techniques immunologiques (test ELISA) ou bien par chromatographie en phase gazeuse
couplée à un spectrophotomètre de masse (GC-MS). Ces études ont montré la présence
tel-0
0804
633,
ver
sion
1 -
26 M
ar 2
013
Perspectives
130
d’auxine dans les sols soumis à l’activité des vers de terre. Dans la continuité de ces travaux il
serait intéressant de voir si ces protocoles permettent la comparaison de plusieurs sols, pour
différentes molécules signal.
Le dosage simultané de ces molécules signal dans la plante et dans le sol permettrait
de mieux comprendre l’importance de la régulation et de l’action de ces composés. Les
plantes dans leurs environnements sont soumises à de nombreux stress biotiques et abiotiques.
La production de certains composés hormonaux par les champignons pathogènes est un
élément clé dans leur virulence (Robert-Seilaniantz et al., 2007; Robert-Seilaniantz et al.,
2011). Les bactéries de la rhizosphère, en produisant ces composés, vont pouvoir influencer
l’équilibre hormonal dans la plante, ce qui pourrait accroître la capacité de défense et donc la
croissance des plantes. Cette voie de recherche pourrait déboucher sur des alternatives à
l’utilisation de pesticides ou d’organismes génétiquement modifiés (OGM) dans la lutte
contre les pathogènes et parasites des plantes.
4. Etude du lien coévolutif entre les plantes, les vers de terre et les
microorganismes de la rhizosphère.
Les effets opposés des vers de terre sur différentes espèces de plante (Scheu, 2003;
Brown et al., 2004; Puga-Freitas et al., accepted), souligne l’importance de diversifier les
espèces de plantes, de vers de terre, voire de la composition des communautés microbiennes
par une diversification des sols utilisés ou par l’inoculation de bactéries spécifiques. Cela
nous permettrait d’approfondir le lien co-évolutif qui existe entre ces différents acteurs. Les
études portant sur l’action d’organismes du sol tel que les PGPR ou les pathogènes, sur la
plante, ont souligné l’importance des mécanismes adaptatifs sur lesquels reposent ces
interactions. En réalisant différentes associations d’une plante et d’un ver de terre issus ou non
de la même aire géographique, on pourrait vérifier que l’effet positif est d’autant plus
important pour des organismes issus de la même région géographique. Le fait que des
mécanismes de communication entre la plante et le vers de terre soient responsables d’un effet
des vers plus efficace pour les organismes issus de la même région soutiendrait l’idée d’une
co-évolution mutualiste entre les plantes et les vers de terre.
tel-0
0804
633,
ver
sion
1 -
26 M
ar 2
013
Perspectives
131
Les analyses métagénomiques pourraient également déboucher sur une meilleure
compréhension des liens évolutifs qui existe entre ces organismes. Il serait intéressant de voir
l’influence d’une plante et d’un vers de terre issus ou non de la même aire géographique, sur
un sol (et donc une composition microbienne) qui leur est commun ou non. A partir de la
caractérisation des communautés microbiennes de la rhizosphère on pourrait ainsi voir si une
espèce invasive (de vers de terre ou de plante) va imposer une nouvelle composition
microbienne ou alors si l’espèce autochtone (de plante ou de vers de terre) va être capable de
conserver la composition d’origine ou bien si un brassage va avoir lieu et va résulter en une
communauté microbienne nouvelle.
tel-0
0804
633,
ver
sion
1 -
26 M
ar 2
013

Références
132
Références
tel-0
0804
633,
ver
sion
1 -
26 M
ar 2
013
Références
133
-A- Achard, P., Vriezen, W.H., Van Der Straeten, D. & Harberd, N.P. (2003) Ethylene
Regulates Arabidopsis Development via the Modulation of DELLA Protein Growth
Repressor Function. The Plant Cell Online, 15, 2816-2825.
Agrios, G.N. (2005) Plant pathology. Elsevier Academic Press.
Alphei, J., Bonkowski, M. & Scheu, S. (1996) Protozoa, Nematoda and Lumbricidae in the
rhizosphere of Hordelymus europeaus (Poaceae): faunal interactions, response of
microorganisms and effects on plant growth. Oecologia, 106, 111-126.
Arancon, N.Q., Edwards, C.A., Bierman, P., Metzger, J.D., Lee, S. & Welch, C. (2003)
Effects of vermicomposts on growth and marketable fruits of field-grown tomatoes,
peppers and strawberries. Pedobiologia, 47, 731-735.
Arancon, N.Q., Edwards, C.A., Lee, S. & Byrne, R. (2006) Effects of humic acids from
vermicomposts on plant growth. Eur J Soil Biol, 42, S65-S69.
Arguello, H., Rincón, J. & Castellanos, D. (2011) Obtención y evaluación de un
biofertilizante enriquecido que contribuya con el incremento de la productividad de
cultivos de hortalizas. Universidad Nacional de Colombia, Bogotá, pp. 209.
Arkhipova, T.N., Veselov, S.U., Melentiev, A.I., Martynenko, E.V. & Kudoyarova, G.R.
(2005) Ability of bacterium Bacillus subtilis to produce cytokinins and to influence
the growth and endogenous hormone content of lettuce plants. Plant and Soil, 272,
201-209.
Arshad, M., Shaharoona, B. & Mahmood, T. (2008) Inoculation with Pseudomonas spp.
Containing ACC-Deaminase Partially Eliminates the Effects of Drought Stress on
Growth, Yield, and Ripening of Pea (Pisum sativum L.). Pedosphere, 18, 611-620.
Asai, S., Ohta, K. & Yoshioka, H. (2008) MAPK Signaling Regulates Nitric Oxide and
NADPH Oxidase-Dependent Oxidative Bursts in Nicotiana benthamiana. The Plant
Cell Online, 20, 1390-1406.
Atiyeh, R.M., Arancon, N., Edwards, C.A. & Metzger, J.D. (2000) Influence of
earthworm-processed pig manure on the growth and yield of greenhouse tomatoes.
Bioresour. Technol., 75, 175-180.
tel-0
0804
633,
ver
sion
1 -
26 M
ar 2
013
Références
134
-B- Badri, D.V. & Vivanco, J.M. (2009) Regulation and function of root exudates. Plant, Cell &
Environment, 32, 666-681.
Badri, D.V., Weir, T.L., van der Lelie, D. & Vivanco, J.M. (2009) Rhizosphere chemical
dialogues: plant–microbe interactions. Curr. Opin. Biotechnol., 20, 642-650.
Bais, H.P., Weir, T.L., Perry, L.G., Gilroy, S. & Vivanco, J.M. (2006) The role of root
exudates in rhizosphere interations with plants and other organisms Annual Review of
Plant Biology. Annual Reviews, Palo Alto, pp. 233-266.
Bakker, P.A.H.M., Pieterse, C.M.J. & van Loon, L.C. (2007) Induced Systemic Resistance
by Fluorescent Pseudomonas spp. Phytopathology, 97, 239-243.
Barazani, O. & Friedman, J. (1999) Is IAA the Major Root Growth Factor Secreted from
Plant-Growth-Mediating Bacteria? J. Chem. Ecol., 25, 2397-2406.
Barkawi, L.S., Tam, Y.-Y., Tillman, J.A., Pederson, B., Calio, J., Al-Amier, H., Emerick,
M., Normanly, J. & Cohen, J.D. (2008) A high-throughput method for the
quantitative analysis of indole-3-acetic acid and other auxins from plant tissue. Anal.
Biochem., 372, 177-188.
Barois, I., Villemin, G., Lavelle, P. & Toutain, F. (1993) Transformation of the soil
structure through Pontoscolex corethrurus (oligochaeta) intestinal-tract. Geoderma,
56, 57-66.
Bartel, B. & Fink, G.R. (1994) Differential regulation of an auxin-producing nitrilase gene
family in Arabidopsis thaliana. Proc. Natl. Acad. Sci. U.S.A., 91, 6649-6653.
Barton, L.L. & Northup, D.E. (2011) Microbial Ecology. Wiley.
Bashan, Y. & Holguin, G. (1998) Proposal for the division of plant growth-promoting
rhizobacteria into two classifications: biocontrol-PGPB (plant-growth-promoting
bacteria) and PGPB. Soil Biol. Biochem., 30, 1225-1228.
Benjamins, R., Ampudia, C.S.G., Hooykaas, P.J.J. & Offringa, R. (2003) PINOID-
Mediated signaling involves calcium-binding proteins. Plant Physiol, 132, 1623-1630.
tel-0
0804
633,
ver
sion
1 -
26 M
ar 2
013
Références
135
Bernard, L., Chapuis-Lardy, L., Razafimbelo, T., Razafindrakoto, M., Pablo, A.-L.,
Legname, E., Poulain, J., Bruls, T., O'Donohue, M., Brauman, A., Chotte, J.-L. &
Blanchart, E. (2012) Endogeic earthworms shape bacterial functional communities
and affect organic matter mineralization in a tropical soil. ISME J, 6, 213-222.
Birkemeyer, C., Kolasa, A. & Kopka, J. (2003) Comprehensive chemical derivatization for
gas chromatography-mass spectrometry-based multi-targeted profiling of the major
phytohormones. J. Chromatogr. A, 993, 89-102.
Blanchart, E., Albrecht, A., Alegre, J., Duboisset, A., Gilot, C., Pashanasi, B., Lavelle, P.
& Brussaard, L. (1999) Effects of earthworms on soil structure and physical
properties. In Lavelle, P., Brussaard, L., Hendrix, P. (eds) Earthworm management in
tropical agroecosystems. CAB International, Wallingford, pp. 149–172.
Blanchart, E., Lavelle, P., Braudeau, E., Le Bissonnais, Y. & Valentin, C. (1997)
Regulation of soil structure by geophagous earthworm activities in humid savannas of
Côte d'Ivoire. Soil Biol. Biochem., 29, 431-439.
Blouin, M., Barot, S. & Lavelle, P. (2006) Earthworms (Millsonia anomala,
Megascolecidae) do not increase rice growth through enhanced nitrogen
mineralization. Soil Biol. Biochem., 38, 2063-2068.
Blouin, M., Barot, S. & Roumet, C. (2007a) A quick method to determine root biomass
distribution in diameter classes. Plant and Soil, 290, 371-381.
Blouin, M., Lavelle, P. & Laffray, D. (2007b) Drought stress in rice (Oryza sativa L.) is
enhanced in the presence of the compacting earthworm Millsonia anomala. Env. Exp.
Bot., 60, 352–359.
Blouin, M. & Puga-Freitas, R. (2011) Combined effects of contrast between poor and rich
patches and overall nitrate concentration on Arabidopsis thaliana root system
structure. Funct. Plant Biol., 38, 364-371.
Blouin, M., Zuily-Fodil, Y., Pham-Thi, A.T., Laffra y, D., Reversat, G., Pando, A.,
Tondoh, J. & Lavelle, P. (2005) Belowground organism activities affect plant
aboveground phenotype, inducing plant tolerance to parasites. Ecol. Lett., 8, 202-208.
tel-0
0804
633,
ver
sion
1 -
26 M
ar 2
013
Références
136
Bonkowski, M. (2004) Protozoa and plant growth: the microbial loop in soil revisited. New
Phytol., 162, 617-631.
Bonkowski, M. & Brandt, F. (2002) Do soil protozoa enhance plant growth by hormonal
effects? Soil Biol. Biochem., 34, 1709-1715.
Bossuyt, H., Six, J. & Hendrix, P.F. (2005) Protection of soil carbon by microaggregates
within earthworm casts. Soil Biol. Biochem., 37, 251-258.
Bouché, M.B. (1971) Lombriciens de France: écologie et systématique. Institut national de la
recherche agronomique.
Bouché, M.B. (1975) Action de la faune sur les états de la matière organique dans les
ecosystèmes. In Kilbertius, G., Reisinger, O., Mourey , A., Cancela da Fonseca, J.A.
(eds) Humification et biodégradation. Pierron, Sarreguemines, France, pp. 157-168.
Bouma, T.J., Nielsen, K.L. & Koutstaal, B. (2000) Sample preparation and scanning
protocol for computerised analysis of root length and diameter. Plant and Soil, 218,
185-196.
Boyes, D.C., Zayed, A.M., Ascenzi, R., McCaskill, A.J., Hoffman, N.E., Davis, K.R. &
Gorlach, J. (2001) Growth stage-based phenotypic analysis of Arabidopsis: a model
for high throughput functional genomics in plants. Plant Cell, 13, 1499-1510.
Brandl, M.T. & Lindow, S.E. (1997) Environmental Signals Modulate the Expression of an
Indole-3-Acetic Acid Biosynthetic Gene in Erwinia herbicola. Mol. Plant Microbe In.,
10, 499-505.
Broekaert, W.F., Van Parijs, J., Leyns, F., Joos, H. & Peumans, W.J. (1989) A Chitin-
Binding Lectin from Stinging Nettle Rhizomes with Antifungal Properties. Science,
245, 1100-1102.
Brown, G.G., Barois, I. & Lavelle, P. (2000) Regulation of soil organic matter dynamics
and microbial activityin the drilosphere and the role of interactionswith other edaphic
functional domains. Eur J Soil Biol, 36, 177-198.
Brown, G.G., Edwards, C.A. & Brussaard, L. (2004) How earthworms affect plant growth:
burrowing into the mechanisms. In Edwards, C.A. (ed) Earthworm ecology. CRC
Press, Boca Raton, USA, pp. 13-49.
tel-0
0804
633,
ver
sion
1 -
26 M
ar 2
013
Références
137
Brown, G.G., Pashanasi, B., Villenave, C., Patron, J.C., Senapati, B.K., Giri, S., Barois,
I., Lavelle, P., Blanchart, E., Blakemore, R.J., Spain, A.V. & Boyer, J. (1999)
Effects of earthworms on plant production in the tropics. In Lavelle, P., Brussaard, L.,
Hendrix, P. (eds) The management of earthworms in tropical agroecosystems. CAB
International, Wallingford, pp. 87-148.
Brussaard, L. (1999) On the mechanisms of interactions between earthworms and plants.
Pedobiologia, 43, 880–885.
Busam, G., Junghanns, K.T., Kneusel, R.E., Kassemeyer, H.H. & Matern, U. (1997)
Characterization and Expression of Caffeoyl-Coenzyme A 3-O-Methyltransferase
Proposed for the Induced Resistance Response of Vitis vinifera L. Plant Physiol., 115,
1039-1048.
Businelli, M., Perucci, P., Patumi, M. & Giusquiani, P. (1984) Chemical composition and
enzymic activity of some worm casts. Plant and Soil, 80, 417-422.
-C- Caesar-TonThat, T.C., Caesar, A.J., Gaskin, J.F., Sainju, U.M. & Busscher, W.J. (2007)
Taxonomic diversity of predominant culturable bacteria associated with
microaggregates from two different agroecosystems and their ability to aggregate soil
in vitro. Appl. Soil Ecol., 36, 10-21.
Campbell, J.N., Conn, K., Sorlic, L. & Cook, F.O. (1986) Inhibition of growlh in canola
seedlings caused by an opportunislic Pseudomonas sp. under taboralory and field
conditions. Can. J. Microb., 32, 201-207.
Canellas, L.P., Dantas, D.J., Aguiar, N.O., Peres, L.E.P., Zsögön, A., Olivares, F.L.,
Dobbss, L.B., Façanha, A.R., Nebbioso, A. & Piccolo, A. (2011) Probing the
hormonal activity of fractionated molecular humic components in tomato auxin
mutants. Ann. Appl. Biol., 159, 202-211.
Canellas, L.P., Olivares, F.L., Okorokova-Facanha, A.L. & Facanha, A.R. (2002) Humic
acids isolated from earthworm compost enhance root elongation, lateral root
emergence, and plasma membrane H+-ATPase activity in maize roots. Plant Physiol,
130, 1951-1957.
tel-0
0804
633,
ver
sion
1 -
26 M
ar 2
013
Références
138
Cartieaux, F., Thibaud, M.-C., Zimmerli, L., Lessard, P., Sarrobert, C., David, P.,
Gerbaud, A., Robaglia, C., Somerville, S. & Nussaume, L. (2003) Transcriptome
analysis of Arabidopsis colonized by a plant-growth promoting rhizobacterium reveals
a general effect on disease resistance. The Plant Journal, 36, 177-188.
Castellanos, D., Cubillos, R. & Argüello, H. (2009) Selección de Microorganismos
Promotores de Crecimiento Vegetal (Ácido Indol Acético) a partir de Muestras de
Suelo Rizosferico, como Primera Etapa en el Desarrollo de un Biofertilizante. Rev.
Bras. de Agroecologia, 4, 1720-1723.
Celis Bautista, L.X. & Gallardo, I.R. (2008) Estandarizacion de metodos de deteccion para
promotores de crecimiento vegetal (acido indol acetico y giberelinas) en cultivos
microbianos Facultad de Ciencias Microbiologia agricola y veterinaria. Pontificia
Universidad Javeriana, Bogota, pp. 140.
Chan, K.Y., Mead, J.A., Roberts, W.P. & Wong, P.T.W. (1989) The effect of soil
eompaction and fumigation on poor early growth of wheat under direct drilling. Austr.
J. Agr. Res., 42, 221-228.
Chaouch, S., Queval, G. & Noctor, G. (2012) AtRbohF is a crucial modulator of defence-
associated metabolism and a key actor in the interplay between intracellular oxidative
stress and pathogenesis responses in Arabidopsis. The Plant Journal, 69, 613-627.
Chaoui, H., Edwards, C.A., Brickner, M., Lee, S. & Arancon, N.Q. (2002) Suppression of
the plant deseases Pythium, Rhizoctonia, and Verticillium by vermicompost. Proc
Brighton Crop Prot Conf Pests Dis, 2, 711-715.
Chapon, A., Guillerm, A.Y., Delalande, L., Lebreton, L. & Sarniguet, A. (2002)
Dominant Colonisation of Wheat Roots by Pseudomonas fluorescens Pf29A and
Selection of the Indigenous Microflora in the Presence of the Take-all Fungus. Eur. J.
Plant Pathol., 108, 449-459.
Clapperton, M.J., Lee, N.O., Binet, F. & Conner, R.L. (2001) Earthworms indirectly
reduce the effects of take-all (Gaeumannomyces graminis var. tritici) on soft white
spring wheat (Triticum aestivum cv. Fielder). Soil Biol. Biochem., 33, 1531-1538.
Cook, R.J. (2003) Take-all of wheat. Physiol. Mol. Plant Pathol., 62, 73-86.
tel-0
0804
633,
ver
sion
1 -
26 M
ar 2
013
Références
139
Crowe, M.L., Serizet, C., Thareau, V., Aubourg, S.b., Rouzé, P., Hilson, P., Beynon, J.,
Weisbeek, P., van Hummelen, P., Reymond, P., Paz-Ares, J., Nietfeld, W. &
Trick, M. (2003) CATMA: a complete Arabidopsis GST database. Nucleic Acids
Res., 31, 156-158.
Curry, J.P. & Byrne, D. (1992) The role of earthworms in straw decomposition and nitrogen
turnover in arable land in ireland. Soil Biol. Biochem., 24, 1409-1412.
Curry, J.P. & Schmidt, O. (2007) The feeding ecology of earthworms – A review.
Pedobiologia, 50, 463-477.
-D- Darwin, C. (1881) The formation of vegetable mould, through the action of worms: with
observations on their habits. Murray, London.
Daval, S., Lebreton, L., Gazengel, K., Boutin, M., Guillerm-Erckelboudt, A.-Y. &
Sarniguet, A. (2011) The biocontrol bacterium Pseudomonas fluorescens Pf29Arp
strain affects the pathogenesis-related gene expression of the take-all fungus
Gaeumannomyces graminis var. tritici on wheat roots. Mol. Plant Pathol., 12, 839-
854.
Delbarre, A., Muller, P., Imhoff, V. & Guern, J. (1996) Comparison of mechanisms
controlling uptake and accumulation of 2,4-dichlorophenoxy acetic acid, naphthalene-
1-acetic acid, and indole-3-acetic acid in suspension-cultured tobacco cells. Planta,
198, 532-541.
Depuydt, S. & Hardtke, Christian S. (2011) Hormone Signalling Crosstalk in Plant Growth
Regulation. Curr. Biol., 21, R365-R373.
Dharmasiri, S., Swarup, R., Mockaitis, K., Dharmasiri, N., Singh, S.K., Kowalchyk, M.,
Marchant, A., Mills, S., Sandberg, G., Bennett, M.J. & Estelle, M. (2006) AXR4 is
required for localization of the auxin influx facilitator AUX1. Science, 312, 1218-
1220.
Dielen, A.S., Badaoui, S., Candresse, T. & German-Retana, S. (2010) The ubiquitin/26S
proteasome system in plant-pathogen interactions: a never-ending hide-and-seek
game. Mol. Plant Pathol., 11, 293-308.
tel-0
0804
633,
ver
sion
1 -
26 M
ar 2
013
Références
140
Dimkpa, C.O., Svatos, A., Dabrowska, P., Schmidt, A., Boland, W. & Kothe, E. (2008)
Involvement of siderophores in the reduction of metal-induced inhibition of auxin
synthesis in Streptomyces spp. Chemosphere, 74, 19-25.
Dobereiner, J. & Pedrosa, F.A. (1981) Nitrogen fixng bacteria in non-Ieguminous plants.
Science Tech, Madison, Wl, USA.
Doran, J.W., Jones, A.J. & America, S.S.S.o. (1996) Methods for assessing soil quality.
Soil Science Society of America.
Durbak, A., Yao, H. & McSteen, P. (2012) Hormone signaling in plant development. Curr.
Opin. Plant Biol., 15, 92-96.
-E- Edwards, C.A. (2004) Earthworm ecology. CRC Press.
Edwards, C.A. & Bohlen, P.J. (1995) Biology and Ecology of Earthworms. Springer.
Elmer, W.H. (2009) Influence of Earthworm Activity on Soil Microbes and Soilborne
Diseases of Vegetables. Plant Dis., 93, 175-179.
Endlweber, K., Krome, K., Welzl, G., Schäffner, A.R. & Scheu, S. (2011) Decomposer
animals induce differential expression of defence and auxin-responsive genes in
plants. Soil Biol. Biochem., 43, 1130-1138.
Engelberth, J., Contreras, C.F. & Viswanathan, S. (2012) Transcriptional Analysis of
Distant Signaling Induced by Insect Elicitors and Mechanical Wounding in Zea mays.
PLoS ONE, 7, e34855.
-F- Frankenberger, W.T. & Arshad, M. (1995) Phytohormones in soils : Microbial production
and function. Marcel Dekker, New York.
Freeman, J. & Ward, E. (2004) Gaeumannomyces graminis, the take-all fungus and its
relatives. Mol. Plant Pathol., 5, 235-252.
tel-0
0804
633,
ver
sion
1 -
26 M
ar 2
013
Références
141
Fu, X. & Harberd, N.P. (2003) Auxin promotes Arabidopsis root growth by modulating
gibberellin response. Nature, 421, 740-743.
-G- Gardner, J., Chandler, J. & Feldman, A. (1984) Growth promotion and inhibition by
antibiotic-producing fluorescent pseudomonads on citrus roots. Plant and Soil, 77,
103-113.
Gavrilov, K. (1963) Earthworms, producers of biologically active substances. Zh. Obshch.
Biol., 24, 149-154.
Glazebrook, J. (2005) Contrasting Mechanisms of Defense Against Biotrophic and
Necrotrophic Pathogens. Annu. Rev. Phytopathol., 43, 205-227.
Gobat, J.M., Aragno, M. & Matthey, W. (2010) Le sol vivant: Bases de pédologie, Biologie
des sols. Presses Polytechniques et Universitaires Romandes.
Gómez-Gómez, L. & Boller, T. (2002) Flagellin perception: a paradigm for innate immunity.
Trends Plant Sci., 7, 251-256.
Govrin, E.M. & Levine, A. (2000) The hypersensitive response facilitates plant infection by
the necrotrophic pathogen Botrytis cinerea. Curr. Biol., 10, 751-757.
Govrin, E.M., Rachmilevitch, S., Tiwari, B.S., Soloman, M. & Levine, A. (2006) An
elicitor from Botrytis cinerea induces the hypersensitive response in Arabidopsis
thaliana and other plants and promotes the gray mold disease. Phytopathology, 96,
299-307.
Guilleroux, M. & Osbourn, A. (2004) Gene expression during infection of wheat roots by
the ‘take-all’ fungus Gaeumannomyces graminis. Mol. Plant Pathol., 5, 203-216.
Guo, F.Q., Wang, R. & Crawford, N.M. (2002) The Arabidopsis dual affinity nitrate
transporter gene AtNRT1.1 (CHL1) is regulated by auxin in both shoots and roots. J.
Exp. Bot., 53, 835-844.
tel-0
0804
633,
ver
sion
1 -
26 M
ar 2
013
Références
142
-H- Hayat, R., Ali, S., Amara, U., Khalid, R. & Ahmed, I. (2010) Soil beneficial bacteria and
their role in plant growth promotion: a review. Ann. Microbiol., 60, 579-598.
Heil, M. (1999) Systemic acquired resistance: available information and open ecological
questions. J. Ecol., 87, 341-346.
Himmelbauer, M.L., Loiskandl, W. & Kastanek, F. (2004) Estimating length, average
diameter and surface area of roots using two different Image analyses systems. Plant
and Soil, 260, 111-120.
Hirsch, A.M., Fang, Y., Asad, S. & Kapulnik, Y. (1997) The role of phytohormones in
plant-microbe symbioses. Plant and Soil, 194, 171-184.
Hobbie, L. & Estelle, M. (1995) The axr4 auxin-resistant mutants of Arabidopsis thaliana
define a gene important for root gravitropism and lateral root initiation. The Plant
Journal, 7, 211-220.
Hobbie, L.J. (2006) Auxin and cell polarity: the emergence of AXR4. Trends Plant Sci., 11,
517-518.
Hontzeas, N., Zoidakis, J., Glick, B.R. & Abu-Omar, M.M. (2004) Expression and
characterization of 1-aminocyclopropane-1-carboxylate deaminase from the
rhizobacterium Pseudomonas putida UW4: a key enzyme in bacterial plant growth
promotion. Biochimica et Biophysica Acta (BBA) - Proteins & Proteomics, 1703, 11-
19.
Hooykaas, P.J.J., Hall, M.A. & Libbenga, K.R. (1999) Biochemistry and molecular biology
of plant hormones. Elsevier.
Huang, D.W., Sherman, B.T. & Lempicki, R.A. (2008) Systematic and integrative analysis
of large gene lists using DAVID bioinformatics resources. Nat. Protocols, 4, 44-57.
Huang, D.W., Sherman, B.T. & Lempicki, R.A. (2009) Bioinformatics enrichment tools:
paths toward the comprehensive functional analysis of large gene lists. Nucleic Acids
Res., 37, 1-13.
tel-0
0804
633,
ver
sion
1 -
26 M
ar 2
013
Références
143
-I- Ingham, R.E., Trofymow, J.A., Ingham, E.R. & Coleman, D.C. (1985) Interactions of
bacteria, fungi, and their nematode grazers: effects on nutrient cycling and plant
growth. Ecol. Monogr., 55, 119-140.
Ioio, R.D., Nakamura, K., Moubayidin, L., Perilli, S., Taniguchi, M., Morita, M.T.,
Aoyama, T., Costantino, P. & Sabatini, S. (2008) A Genetic Framework for the
Control of Cell Division and Differentiation in the Root Meristem. Science, 322, 1380-
1384.
-J- James, S.W. (1991) Soil, nitrogen, phosphorus, and organic-matter processing by earthworms
in tallgrass prairie. Ecology, 72, 2101-2109.
Jameson, P.E. (2000) Cytokinins and auxins in plant-pathogen interactions - An overview.
Plant Growth Regul., 32, 369-380.
Jana, U., Barot, S., Blouin, M., Lavelle, P., Laffray, D. & Repellin, A. (2010) Earthworms
influence the production of above- and belowground biomass and the expression of
genes involved in cell proliferation and stress responses in Arabidopsis thaliana. Soil
Biol. Biochem., 42, 244-252.
Jones, C.G., Lawton, J.H. & Shachak, M. (1994) Organisms as ecosystem engineers.
Oïkos, 69, 373-386.
-K- Karlen, D.L., Mausbach, M.J., Doran, J.W., Cline, R.G., Harris, R.F. & Schuman, G.E.
(1997) Soil quality: A concept, definition, and framework for evaluation. Soil Sci. Soc.
Am. J., 61, 4-10.
Kloek, A.P., Verbsky, M.L., Sharma, S.B., Schoelz, J.E., Vogel, J., Klessig, D.F. &
Kunkel, B.N. (2001) Resistance to Pseudomonas syringae conferred by an
Arabidopsis thaliana coronatine-insensitive (coi1) mutation occurs through two
distinct mechanisms. The Plant Journal, 26, 509-522.
tel-0
0804
633,
ver
sion
1 -
26 M
ar 2
013
Références
144
Kloepper, J.W. & Schroth, M.N. (1978) Plant growth-promoting rhizobacteria on radishes.
In Station de Pathologie Végétale et de Phytobactériologie, I. (ed) Proceedings of the
4th International Conference on Plant Pathogenic Bacteria, Angers, France, pp. 879–
882.
Kombrink, A., Sánchez-Vallet, A. & Thomma, B.P.H.J. (2011) The role of chitin detection
in plant–pathogen interactions. Microbes Infect., 13, 1168-1176.
Kremer, R. (2006) Deleterious Rhizobacteria - Plant-Associated Bacteria. In
Gnanamanickam, S. (ed). Springer Netherlands, pp. 335-357.
Krome, K., Rosenberg, K., Dickler, C., Kreuzer, K., Ludwig-Müller, J., Ullrich-Eberius,
C., Scheu, S. & Bonkowski, M. (2010) Soil bacteria and protozoa affect root
branching via effects on the auxin and cytokinin balance in plants. Plant and Soil, 328,
191-201.
Krouk, G., Lacombe, B., Bielach, A., Perrine-Walker, F., Malinska, K., Mounier, E.,
Hoyerova, K., Tillard, P., Leon, S., Ljung, K., Zazimalova, E., Benkova, E.,
Nacry, P. & Gojon, A. (2010) Nitrate-Regulated Auxin Transport by NRT1.1 Defines
a Mechanism for Nutrient Sensing in Plants. Dev. Cell, 18, 927-937.
Kuzyakov, Y. & Domanski, G. (2000) Carbon input by plants into the soil. Review. Journal
of Plant Nutrition and Soil Science/Zeitschrift für Pflanzenernährung und
Bodenkunde, 163, 421-431.
-L- Laossi, K.-R., Ginot, A., Noguera, D., Blouin, M. & Barot, S. (2010) Earthworm effects on
plant growth do not necessarily decrease with soil fertility. Plant and Soil, 328, 109-
118.
Lattaud, C., Locati, S., Mora, P., Rouland, C. & Lavelle, P. (1998a) The diversity of
digestive systems in tropical geophageous earthworms. Appl. Soil Ecol., 9, 189-195.
Lattaud, C., Mora, P., Garvin, M., Locati, S., Rouland, C., Diaz Cosin, D.J., Jesus, J.B.,
Trigo, D. & Garvin, M.H. (1998b) Enzymatic digestive capabilities in geophagous
earthworms - origin and activities of cellulolytic enzymes. Pedobiologia, 43, 842-850.
tel-0
0804
633,
ver
sion
1 -
26 M
ar 2
013
Références
145
Lavelle, P. (2002) Functional domains in soils. Ecol. Res., 17, 441-450.
Lavelle, P., Bignell, D., Lepage, M., Wolters, V., Roger, P., Ineson, P., Heal, O.W. &
Dhillion, S. (1997) Soil function in a changing world: the role of invertebrate
ecosystem engineers. Eur J Soil Biol, 33, 159-193.
Lavelle, P., Decaëns, T., Aubert, M., Barot, S., Blouin, M., Bureau, F., Margerie, P.,
Mora, P. & Rossi, J.P. (2006) Soil invertebrates and ecosystem services. Eur J Soil
Biol, 42, Supplement 1, S3-S15.
Lavelle, P., Lattaud, C., Trigo, D. & Barois, I. (1995) Mutualism and biodiversity in soils.
Plant and Soil, 170, 23-33.
Lavelle, P., Rouland, C., Binet, F., Diouf, M. & Kersanté, A. (2004) Regulation of
microbial activities by roots and soil invertebrates. In Buscot, F., Varma, A. (eds)
Regulation of Microbial Activities. Springer Verlag, Berlin.
Lavelle, P., Schaefer, R. & Zaidi, Z. (1989) Soil ingestion and growth in Millsonia anomala,
a tropical earthworm, as influenced by the quality of the organic-matter ingested.
Pedobiologia, 33, 379-388.
Lavelle, P. & Spain, A.V. (2001) Soil Ecology. Kluwer Academic Publishers.
Le Bayon, R.C., Moreau, S., Gascuel-Odoux, C. & Binet, F. (2002) Annual variations in
earthworm surface-casting activity and soil transport by water runoff under a
temperate maize agroecosytem. Geoderma, 106, 121-135.
Lehmann, T., Hoffmann, M., Hentrich, M. & Pollmann, S. (2010) Indole-3-acetamide-
dependent auxin biosynthesis: A widely distributed way of indole-3-acetic acid
production? Eur. J. Cell Biol., 89, 895-905.
León, S.T. (2003) Resistencia sistémica inducida con caldos microbianos de rizosfera para
control de gota (Phytophthora infestans (Mont.) de Bary) en agroecosistemas de papa.
Escuela Técnica Superior de Ingenieros Agrónomos. Universidad Politécnica de
Madrid, Madrid, pp. 256.
Lewis, D.R., Negi, S., Sukumar, P. & Muday, G.K. (2011) Ethylene inhibits lateral root
development, increases IAA transport and expression of PIN3 and PIN7 auxin efflux
carriers. Development, 138, 3485-3495.
tel-0
0804
633,
ver
sion
1 -
26 M
ar 2
013
Références
146
Linkohr, B.I., Williamson, L.C., Fitter, A.H. & Ley ser, H.M.O. (2002) Nitrate and
phosphate availability and distribution have different effects on root system
architecture of Arabidopsis. The Plant Journal, 29, 751-760.
Liu, H., Coulthurst, S.J., Pritchard, L., Hedley, P.E., Ravensdale, M., Humphris, S.,
Burr, T., Takle, G., Brurberg, M.B., Birch, P.R.J., Salmond, G.P.C. & Toth, I.K.
(2008) Quorum sensing coordinates brute force and stealth modes of infection in the
plant pathogen Pectobacterium atrosepticum. Plos Pathogens, 4.
Loper, J.E. & Schroth, M.N. (1986) Influence of bacterial sources of indole-3-acetic-acid on
root elongation of sugar beet. Phytopathology, 76, 386-389.
López-Bucio, J., Campos-Cuevas, J.C., Hernández-Calderón, E., Velásquez-Becerra, C.,
Farías-Rodríguez, R., Macías-Rodríguez, L.I. & Valencia-Cantero, E. (2007)
Bacillus megaterium Rhizobacteria Promote Growth and Alter Root-System
Architecture Through an Auxin- and Ethylene-Independent Signaling Mechanism in
Arabidopsis thaliana. Mol. Plant Microbe In., 20, 207-217.
Lynch, J.M. & Whipps, J.M. (1990) Substrate flow in the rhizosphere. Plant and Soil, 129,
1-10.
-M- Ma, W. & Berkowitz, G.A. (2011) Ca2+ conduction by plant cyclic nucleotide gated
channels and associated signaling components in pathogen defense signal transduction
cascades. New Phytol., 190, 566-572.
Macdonald, A. & Gutteridge, R. (2012) Effects of take-all (Gaeumannomyces graminis var.
tritici ) on crop N uptake and residual mineral N in soil at harvest of winter wheat.
Plant and Soil, 350, 253-260.
Mackay, A.D., Springett, J.A., Syers, J.K. & Gregg, P.E.H. (1983) Origin of the effect of
earthworms on the availability of phosphorus in a phosphate rock. Soil Biol. Biochem.,
15, 63-73.
Mandryck, M. (1969) Frenching of tobacoo in Australian soils and in soil leachates. Austr. J.
Agr. Res., 20, 709-717.
tel-0
0804
633,
ver
sion
1 -
26 M
ar 2
013
Références
147
Martens, D.A. & Frankenberger, W.T. (1994) Assimilation of exogenous 2′-14C-indole-3-
acetic acid and 3′-14C-tryptophan exposed to the roots of three wheat varieties Plant
and Soil, 166, 281-290.
Milleret, R., Le Bayon, R.C., Lamy, F., Gobat, J.M. & Boivin, P. (2009) Impact of roots,
mycorrhizas and earthworms on soil physical properties as assessed by shrinkage
analysis. J. Hydrol., 373, 499-507.
Minnich, J. (1977) The earthworm book: how to raise and use earthworms for your farm and
garden. Rodale Press.
Morsomme, P. & Boutry, M. (2000) The plant plasma membrane H+-ATPase: structure,
function and regulation. Biochimica et Biophysica Acta (BBA) - Biomembranes, 1465,
1-16.
Muday, G.K., Rahman, A. & Binder, B.M. (2012) Auxin and ethylene: collaborators or
competitors? Trends Plant Sci., 17, 181-195.
Murashige, T. & Skoog, F. (1962) A revised medium for rapid growth and bio-assays with
tobacco tissue cultures. Physiol. Plantarum, 15, 473-497.
Muscolo, A., Bovalo, F., Gionfriddo, F. & Nardi, S. (1999) Earthworm humic matter
produces auxin-like effects on Daucus carota cell growth and nitrate metabolism. Soil
Biol. Biochem., 31, 1303-1311.
Muscolo, A., Cutrupi, S. & Nardi, S. (1998) IAA detection in humic substances. Soil Biol.
Biochem., 30, 1199-1201.
-N- Nardi, S., Arnoldi, G. & Dellagnola, G. (1988) Release of the hormone-like activities from
Allolobophora rosea (sav) and Allolobophora caliginosa (sav) feces. Can. J. Soil Sci.,
68, 563-567.
Nardi, S., Pizzeghello, D., Muscolo, A. & Vianello, A. (2002) Physiological effects of
humic substances on higher plants. Soil Biol. Biochem., 34, 1527-1536.
tel-0
0804
633,
ver
sion
1 -
26 M
ar 2
013
Références
148
Nardi, S., Pizzeghello, D., Reniero, F. & Rascio, N. (2000) Chemical and Biochemical
Properties of Humic Substances Isolated from Forest Soils and Plant Growth. Soil Sci.
Soc. Am. J., 64, 639-645.
Nehl, D.B., Allen, S.J. & Brown, J.F. (1996) Deleterious rhizosphere bacteria: an integrating
perspective. Appl. Soil Ecol., 5, 1-20.
Nielson, R.L. (1965) Presence of Plant Growth Substances in Earthworms demonstrated by
Paper Chromatography and the Went Pea Test. Nature, 208, 1113-1114.
Noguera, D., Laossi, K.R., Lavelle, P., de Carvalho, M.H.C., Asakawa, N., Botero, C. &
Barot, S. (2011) Amplifying the benefits of agroecology by using the right cultivars.
Ecol. Appl., 21, 2349-2356.
-O- Oades, J. (1984) Soil organic matter and structural stability: mechanisms and implications for
management. Plant and Soil, 76, 319-337.
-P- Parkin, T.B. & Berry, E.C. (1999) Microbial nitrogen transformations in earthworm
burrows. Soil Biol. Biochem., 31, 1765-1771.
Parmelee, R.W. & Crossley, D.A.J. (1988) Earthworm production and role in the nitrogen
cycle of a no-tillage agroecosystem on the Georgia Piedmont. Pedobiologia, 32, 353–
361.
Patten, C.L. & Click, B.R. (1996) Bacterial biosynthesis of indole-3-acetic acid. Can. J.
Microb., 42, 207-220.
Peleg, Z. & Blumwald, E. (2011) Hormone balance and abiotic stress tolerance in crop
plants. Curr. Opin. Plant Biol., 14, 290-295.
Peng, X., Wood, C., Blalock, E., Chen, K., Landfield, P. & Stromberg, A. (2003)
Statistical implications of pooling RNA samples for microarray experiments. BMC
Bioinformatics, 4, 26.
tel-0
0804
633,
ver
sion
1 -
26 M
ar 2
013
Références
149
Perkins, J.H. (1997) Geopolitics and the Green Revolution: Wheat, Genes, and the Cold
War. Oxford University Press, USA.
Persello-Cartieaux, F., David, P., Sarrobert, C., Thibaud, M.C., Achouak, W., Robaglia,
C. & Nussaume, L. (2001) Utilization of mutants to analyze the interaction between
Arabidopsis thaliana and its naturally root-associated Pseudomonas. Planta, 212, 190-
198.
Persello-Cartieaux, F., Nussaume, L. & Robaglia, C. (2003) Tales from the underground:
molecular plant–rhizobacteria interactions. Plant, Cell & Environment, 26, 189-199.
Pickett, F.B., Wilson, A.K. & Estelle, M. (1990) The aux1 mutation of Arabidopsis confers
both auxin and ethylene resistance. Plant Physiol, 94, 1462-1466.
Pieterse, C.M.J., Leon-Reyes, A., Van der Ent, S. & Van Wees, S.C.M. (2009)
Networking by small-molecule hormones in plant immunity. Nat. Chem. Biol., 5, 308-
316.
Ping, L. & Boland, W. (2004) Signals from the underground: bacterial volatiles promote
growth in Arabidopsis. Trends Plant Sci., 9, 263-266.
Pižl, V., Elhottová, D., Koubová, A. & Kahounová, L. (2012) The effects of earthworms on
microbial communities: comparison of soil and cave populations of Aporrectodea
rosea XVI International Colloquium on Soil Zoology, Coimbra, Portugal.
Podile, A. & Kishore, G. (2006) Plant growth-promoting rhizobacteria - Plant-Associated
Bacteria. In Gnanamanickam, S. (ed). Springer Netherlands, pp. 195-230.
Pollmann, S., Düchting, P. & Weiler, E.W. (2009) Tryptophan-dependent indole-3-acetic
acid biosynthesis by `IAA-synthase' proceeds via indole-3-acetamide. Phytochemistry,
70, 523-531.
Probanza, A., Lucas, J.A., Acero, N. & Gutierrez Mañero, F.J. (1996) The influence of
native rhizobacteria on european alder (Alnus glutinosa (L.) Gaertn.) growth. Plant
and Soil, 182, 59-66.
Puga-Freitas, R., Abbad, S., Gigon, A., Garnier-Zarli, E. & Blouin, M. (2012) Control of
Cultivable IAA-Producing Bacteria by the Plant Arabidopsis thaliana and the
Earthworm Aporrectodea caliginosa. Appl. Env. Soil Sci., 2012, 4.
tel-0
0804
633,
ver
sion
1 -
26 M
ar 2
013
Références
150
Puga-Freitas, R., Barot, S., Taconnat, L., Renou, J.-P. & Blouin, M. (accepted) Signal
molecules mediate the impact of the earthworm Aporrectodea caliginosa on growth,
development and defence of the plant Arabidopsis thaliana. PLoS ONE, X, XXX-
XXX.
Pulleman, M.M., Six, J., Uyl, A., Marinissen, J.C.Y. & Jongmans, A.G. (2005)
Earthworms and management affect organic matter incorporation and microaggregate
formation in agricultural soils. Appl. Soil Ecol., 29, 1-15.
-Q- Quaggiotti, S., Ruperti, B., Pizzeghello, D., Francioso, O., Tugnoli, V. & Nardi, S. (2004)
Effect of low molecular size humic substances on nitrate uptake and expression of
genes involved in nitrate transport in maize (Zea mays L.). J. Exp. Bot., 55, 803-813.
-R- Raghavendra, A.S., Gonugunta, V.K., Christmann, A. & Grill, E. (2010) ABA perception
and signalling. Trends Plant Sci., 15, 395-401.
Rahman, A., Amakawa, T., Goto, N. & Tsurumi, S. (2001) Auxin is a Positive Regulator
for Ethylene-Mediated Response in the Growth of Arabidopsis Roots. Plant Cell
Physiol., 42, 301-307.
Riesenfeld, C.S., Schloss, P.D. & Handelsman, J. (2004) METAGENOMICS: Genomic
Analysis of Microbial Communities. Annu. Rev. Genet., 38, 525-552.
Robert-Seilaniantz, A., Grant, M. & Jones, J.D.G. (2011) Hormone Crosstalk in Plant
Disease and Defense: More Than Just JASMONATE-SALICYLATE Antagonism.
Annu. Rev. Phytopathol., 49, 317-343.
Robert-Seilaniantz, A., Navarro, L., Bari, R. & Jones, J.D.G. (2007) Pathological
hormone imbalances. Curr. Opin. Plant Biol., 10, 372-379.
Rodrı�guez, H. & Fraga, R. (1999) Phosphate solubilizing bacteria and their role in plant
growth promotion. Biotechnol. Adv., 17, 319-339.
tel-0
0804
633,
ver
sion
1 -
26 M
ar 2
013
Références
151
Ronald, P.C. & Beutler, B. (2010) Plant and Animal Sensors of Conserved Microbial
Signatures. Science, 330, 1061-1064.
Ryu, C.-M., Farag, M.A., Hu, C.-H., Reddy, M.S., Kloepper, J.W. & Paré, P.W. (2004)
Bacterial Volatiles Induce Systemic Resistance in Arabidopsis. Plant Physiol, 134,
1017-1026.
Ryu, C.-M., Farag, M.A., Hu, C.-H., Reddy, M.S., Wei, H.-X., Paré, P.W. & Kloepper,
J.W. (2003) Bacterial volatiles promote growth in Arabidopsis. Proceedings of the
National Academy of Sciences, 100, 4927-4932.
-S- Sarwar, M. & Kremer, R.J. (1995) Enhanced suppression of plant-growth through
production of L-tryptophan derived compounds by deleterious rhizobacteria. Plant
and Soil, 172, 261-269.
Scheu, S. (2003) Effects of earthworms on plant growth: patterns and perspectives: The 7th
international symposium on earthworm ecology · Cardiff · Wales · 2002.
Pedobiologia, 47, 846-856.
Schippers, B., Bakker, A.W. & Bakker, P. (1987) Interactions of deleterious and beneficial
rhizosphere microorganisms and the effect of cropping practices. Annu. Rev.
Phytopathol., 25, 339-358.
Schroth, M.N. & Hancock, J.G. (1982) Disease-supppressive soil and root-colonizing
bacteria. Science, 216, 1376-1381.
Segarra, S., Mir, R., Martinez, C. & Leon, J. (2010) Genome-wide analyses of the
transcriptomes of salicylic acid-deficient versus wild-type plants uncover Pathogen
and Circadian Controlled 1 (PCC1) as a regulator of flowering time in Arabidopsis.
Plant Cell Environ., 33, 11-22.
Sels, J., Mathys, J., De Coninck, B.M.A., Cammue, B.P.A. & De Bolle, M.F.C. (2008)
Plant pathogenesis-related (PR) proteins: A focus on PR peptides. Plant Physiol.
Biochem., 46, 941-950.
tel-0
0804
633,
ver
sion
1 -
26 M
ar 2
013
Références
152
Shipitalo, M.J. & Le Bayon, R.C. (2004) Quantifying the effects of earthworms on soil
aggregation and porosity. In Edwards, C.A. (ed) Earthworm ecology. CRC Press,
Boca Raton, USA, pp. 183-200.
Shipitalo, M.J. & Protz, R. (1988) Factors influencing the dispersibility of clay in worm
casts. Soil Sci. Soc. Am. J., 52, 764-769.
Shipitalo, M.J. & Protz, R. (1989) Chemistry and micromorphology of aggregation in
earthworm casts. Geoderma, 45, 357-374.
Shuster, W.D., Subler, S. & McCoy, E.L. (2002) The influence of earthworm community
structure on the distribution and movement of solutes in a chisel-tilled soil. Appl. Soil
Ecol., 21, 159-167.
Sims, R.W., Gerard, B.M., London, L.S.o., Estuarine & Association, B.-W.S. (1985)
Earthworms: Keys and Notes for the Identification and Study of the Species. Linnean
Society of London and the Estuarine and Brackish-Water Sciences Association.
Six, J., Bossuyt, H., Degryze, S. & Denef, K. (2004) A history of research on the link
between (micro)aggregates, soil biota, and soil organic matter dynamics. Soil and
Tillage Research, 79, 7-31.
Spaepen, S., Vanderleyden, J. & Remans, R. (2007) Indole-3-acetic acid in microbial and
microorganism-plant signaling. FEMS Microbiol. Rev., 31, 425-448.
Stepanova, A.N., Yun, J., Likhacheva, A.V. & Alonso, J.M. (2007) Multilevel Interactions
between Ethylene and Auxin in Arabidopsis Roots. The Plant Cell Online, 19, 2169-
2185.
Stephens, P.M. & Davoren, C.W. (1995) Effect of the lumbricid earthworm Aporrectodea
trapezoides on wheat grain yield in the field, in the presence or absence of Rhizoctonia
solani and Gaeumannomyces graminis var. tritici. Soil Biol. Biochem., 28, 561-567.
Stephens, P.M. & Davoren, C.W. (1997) Influence of the earthworms Aporrectodea
trapezoides and A. rosea on the disease severity of Rhizoctonia solani on subterranean
clover and ryegrass. Soil Biol. Biochem., 29, 511-516.
Stephens, P.M., Davoren, C.W., Doube, B.M. & Ryder, M.H. (1994) Ability of the
lumbricid earthworms Aporrectodea rosea and Aporrectodea trapezoides to reduce the
tel-0
0804
633,
ver
sion
1 -
26 M
ar 2
013
Références
153
severity of take-all under greenhouse and field conditions. Soil Biol. Biochem., 26,
1291-1297.
Stephens, P.M., Davoren, C.W., Doube, B.M., Ryder, M.H., Benger, A.M. & Neate, S.M.
(1993) Reduced severity of rhizoctonia solani disease on wheat seedlings associated
with the presence of the earthworm aporrectodea trapezoides (lumbricidae). Soil Biol.
Biochem., 25, 1477-1484.
Stotz, H.U., Jikumaru, Y., Shimada, Y., Sasaki, E., Stingl, N., Mueller, M.J. & Kamiya,
Y. (2011) Jasmonate-Dependent and COI1-Independent Defense Responses Against
Sclerotinia sclerotiorum in Arabidopsis thaliana: Auxin is Part of COI1-Independent
Defense Signaling. Plant Cell Physiol., 52, 1941-1956.
Surette, M.A., Sturz, A.V., Lada, R.R. & Nowak, J. (2003) Bacterial endophytes in
processing carrots (Daucus carota L. var. sativus): their localization, population
density, biodiversity and their effects on plant growth. Plant and Soil, 253, 381-390.
Suslow, T.V. & Schroth, M.N. (1982) Role of deleterious rhizobacteria as minor pathogens
in reducing crop growth. Phytopathology, 72, 111-115.
Swarup, R., Kargul, J., Marchant, A., Zadik, D., Rahman, A., Mills, R., Yemm, A., May,
S., Williams, L., Millner, P., Tsurumi, S., Moore, I., Napier, R., Kerr, I.D. &
Bennett, M.J. (2004) Structure-function analysis of the presumptive Arabidopsis
auxin permease AUX1. Plant Cell, 16, 3069-3083.
Syers, J.K., Sharpley, A.N. & Keeney, D.R. (1979) Cycling of nitrogen by surface-casting
earthworms in a pasture ecosystem. Soil Biol. Biochem., 11, 181-185.
-T- Taiz, L. & Zeiger, E. (2010) Plant Physiology. Sinauer Associates, Incorporated.
Team, R.D.C. (2008) R: A language and environment for statistical computing. R Foundation
for Statistical Computing, Vienna, Austria.
Temme, N. & Tudzynski, P. (2009) Does Botrytis cinerea Ignore H2O2-Induced Oxidative
Stress During Infection? Characterization of Botrytis Activator Protein 1. Mol. Plant
Microbe In., 22, 987-998.
tel-0
0804
633,
ver
sion
1 -
26 M
ar 2
013
Références
154
Teplitski, M., Robinson, J.B. & Bauer, W.D. (2000) Plants secrete substances that mimic
bacterial N-acyl homoserine lactone signal activities and affect population density-
dependent behaviour in associated bacteria. Mol Plant–Microbe Interact, 13, 637–648.
Thatcher, L.F., Manners, J.M. & Kazan, K. (2009) Fusarium oxysporum hijacks COI1-
mediated jasmonate signaling to promote disease development in Arabidopsis. The
Plant Journal, 58, 927-939.
Thomma, B.P.H.J., Eggermont, K., Penninckx, I.A.M.A., Mauch-Mani, B., Vogelsang,
R., Cammue, B.P.A. & Broekaert, W.F. (1998) Separate jasmonate-dependent and
salicylate-dependent defense-response pathways in Arabidopsis are essential for
resistance to distinct microbial pathogens. Proceedings of the National Academy of
Sciences, 95, 15107-15111.
Tiwari, S.C., Tiwari, B.K. & Mishra, R.R. (1989) Microbial populations, enzyme activities
and nitrogen-phosphorus-potassium enrichment in earthworm casts and in the
surrounding soil of a pineapple plantation. Biol. Fertil. Soils, 8, 178-182.
Tomati, U., Grappelli, A. & Galli, E. (1988) The hormone-like effect of earthworm casts on
plant growth. Biol. Fertil. Soils, 5, 288-294.
Torres, M.A., Dangl, J.L. & Jones, J.D.G. (2002) Arabidopsis gp91phox homologues
AtrbohD and AtrbohF are required for accumulation of reactive oxygen intermediates
in the plant defense response. Proceedings of the National Academy of Sciences, 99,
517-522.
Trevisan, S., Botton, A., Vaccaro, S., Vezzaro, A., Quaggiotti, S. & Nardi, S. (2011)
Humic substances affect Arabidopsis physiology by altering the expression of genes
involved in primary metabolism, growth and development. Env. Exp. Bot., 74, 45-55.
Troxler, J., Svercel, M., Natsch, A., Zala, M., Keel, C., Moënne-Loccoz, Y. & Défago, G.
(2012) Persistence of a biocontrol Pseudomonas inoculant as high populations of
culturable and non-culturable cells in 200-cm-deep soil profiles. Soil Biol. Biochem.,
44, 122-129.
Truman, W.M., Bennett, M.H., Turnbull, C.G.N. & Gra nt, M.R. (2010) Arabidopsis
auxin mutants are compromised in systemic acquired resistance and exhibit aberrant
accumulation of various indolic compounds. Plant Physiol, 152, 1562–1573.
tel-0
0804
633,
ver
sion
1 -
26 M
ar 2
013
Références
155
Tsavkelova, E.A., Cherdyntseva, T.A., Botina, S.G. & Netrusov, A.I. (2007) Bacteria
associated with orchid roots and microbial production of auxin. Microbiol. Res., 162,
69-76.
-V- van Loon, L.C., Bakker, P.A.H.M. & Pieterse, C.M.J. (1998) Systemic resistance induced
by rhizosphere bacteria. Annu. Rev. Phytopathol., 36, 453-483.
van Loon, L.C., Geraats, B.P.J. & Linthorst, H.J.M. (2006) Ethylene as a modulator of
disease resistance in plants. Trends Plant Sci., 11, 184-191.
van Wees, S.C., van der Ent, S. & Pieterse, C.M. (2008) Plant immune responses triggered
by beneficial microbes. Curr. Opin. Plant Biol., 11, 443-448.
van Wees, S.C.M., Luijendijk, M., Smoorenburg, I., van Loon, L.C. & Pieterse, C.M.J.
(1999) Rhizobacteria-mediated induced systemic resistance (ISR) in Arabidopsis is
not associated with a direct effect on expression of known defense-related genes but
stimulates the expression of the jasmonate-inducible gene Atvsp upon challenge. Plant
Mol. Biol., 41, 537-549.
Varet, A., Hause, B., Hause, G., Scheel, D. & Lee, J. (2003) The Arabidopsis NHL3 gene
encodes a plasma membrane protein and its overexpression correlates with increased
resistance to Pseudomonas syringae pv. tomato DC3000. Plant Physiol, 132, 2023-
2033.
Verhagen, B.W.M., Glazebrook, J., Zhu, T., Chang, H.-S., van Loon, L.C. & Pieterse,
C.M.J. (2004) The transcriptome of rhizobacteria-induced systemic resistance in
Arabidopsis. Mol. Plant Microbe In., 17, 895-908.
von Bodman, S.B., Bauer, W.D. & Coplin, D.L. (2003) Quorum sensing in plant-
pathogenic bacteria. Annu. Rev. Phytopathol., 41, 455-482.
-W-
tel-0
0804
633,
ver
sion
1 -
26 M
ar 2
013
Références
156
Wang, Y., Ohara, Y., Nakayashiki, H., Tosa, Y. & Mayama, S. (2005) Microarray analysis
of the gene expression profile induced by the endophytic plant growth-promoting
rhizobacteria, Pseudomonas fluorescens FPT9601-T5 in Arabidopsis. Mol. Plant
Microbe In., 18, 385-396.
Weiss, D. & Ori, N. (2007) Mechanisms of Cross Talk between Gibberellin and Other
Hormones. Plant Physiol, 144, 1240-1246.
Wi, S.J., Ji, N.R. & Park, K.Y. (2012) Synergistic Biosynthesis of Biphasic Ethylene and
Reactive Oxygen Species in Response to Hemibiotrophic Phytophthora parasitica in
Tobacco Plants. Plant Physiol, 159, 251-265.
Wilkinson, S., Kudoyarova, G.R., Veselov, D.S., Arkhipova, T.N. & Davies, W.J. (2012)
Plant hormone interactions: innovative targets for crop breeding and management. J.
Exp. Bot., 63, 3499-3509.
Williams, P. (2007) Quorum sensing, communication and cross-kingdom signalling in the
bacterial world. Microbiology, 153, 3923-3938.
Wolfarth, F., Schrader, S., Oldenburg, E., Weinert, J. & Brunotte, J. (2011) Earthworms
promote the reduction of Fusarium biomass and deoxynivalenol content in wheat
straw under field conditions. Soil Biol. Biochem., 43, 1858-1865.
Wu, F., Wan, Judy Hon C., Wu, S. & Wong, M. (2012) Effects of earthworms and plant
growth–promoting rhizobacteria (PGPR) on availability of nitrogen, phosphorus, and
potassium in soil. J. Plant Nutr. Soil Sci., 175, 423-433.
Wurst, S. (2010) Effects of earthworms on above- and belowground herbivores. Appl. Soil
Ecol., 45, 123-130.
-X- Xie, H., Pasternak, J.J. & Glick, B.R. (1996) Isolation and characterization of mutants of
the plant growth promoting rhizobacterium Pseudomonas putida GR12-2 that
overproduce indoleacetic-acid. Curr. Microbiol., 32, 67-71.
tel-0
0804
633,
ver
sion
1 -
26 M
ar 2
013
Références
157
Xu, X.P., Chen, C.H., Fan, B.F. & Chen, Z.X. (2006) Physical and functional interactions
between pathogen-induced Arabidopsis WRKY18, WRKY40, and WRKY60
transcription factors. Plant Cell, 18, 1310-1326.
-Z- Zaller, J.G. (2007) Vermicompost in seedling potting media can affect germination, biomass
allocation, yields and fruit quality of three tomato varieties. Eur J Soil Biol, 43, S332-
S336.
Zarea, M.J., Ghalavand, A., Goltapeh, E.M., Rejali, F. & Zamaniyan, M. (2009) Effects
of mixed cropping, earthworms (Pheretima sp.), and arbuscular mycorrhizal fungi
(Glomus mosseae) on plant yield, mycorrhizal colonization rate, soil microbial
biomass, and nitrogenase activity of free-living rhizosphere bacteria. Pedobiologia,
52, 223-235.
Zhang, H., Jennings, A., Barlow, P.W. & Forde, B.G. (1999) Dual pathways for regulation
of root branching by nitrate. Proceedings of the National Academy of Sciences, 96,
6529-6534.
Zhang, H., Kim, M.-S., Krishnamachari, V., Payton, P., Sun, Y., Grimson, M., Farag,
M., Ryu, C.-M., Allen, R., Melo, I. & Paré, P. (2007a) Rhizobacterial volatile
emissions regulate auxin homeostasis and cell expansion in Arabidopsis. Planta, 226,
839-851.
Zhang, Z., Li, Q., Li, Z., Staswick, P.E., Wang, M., Zhu, Y. & He, Z. (2007b) Dual
Regulation Role of GH3.5 in Salicylic Acid and Auxin Signaling during Arabidopsis-
Pseudomonas syringae Interaction. Plant Physiol., 145, 450-464.
Zheng, Z., Qamar, S.A., Chen, Z. & Mengiste, T. (2006) Arabidopsis WRKY33
transcription factor is required for resistance to necrotrophic fungal pathogens. The
Plant Journal, 48, 592-605.
tel-0
0804
633,
ver
sion
1 -
26 M
ar 2
013
Annexes
158
Annexes
tel-0
0804
633,
ver
sion
1 -
26 M
ar 2
013
Annexes
159
Annexe 1 : Tableau supplémentaire 1 de la publication du Chapitre 4 :
Take-all disease involves hypersensitive response and hormonal control of wheat by the pathogenic fungus Gaeumannomyces graminis var tritici , which can be depleted in the presence of the earthworm Aporrectodea
caliginosa
tel-0
0804
633,
ver
sion
1 -
26 M
ar 2
013
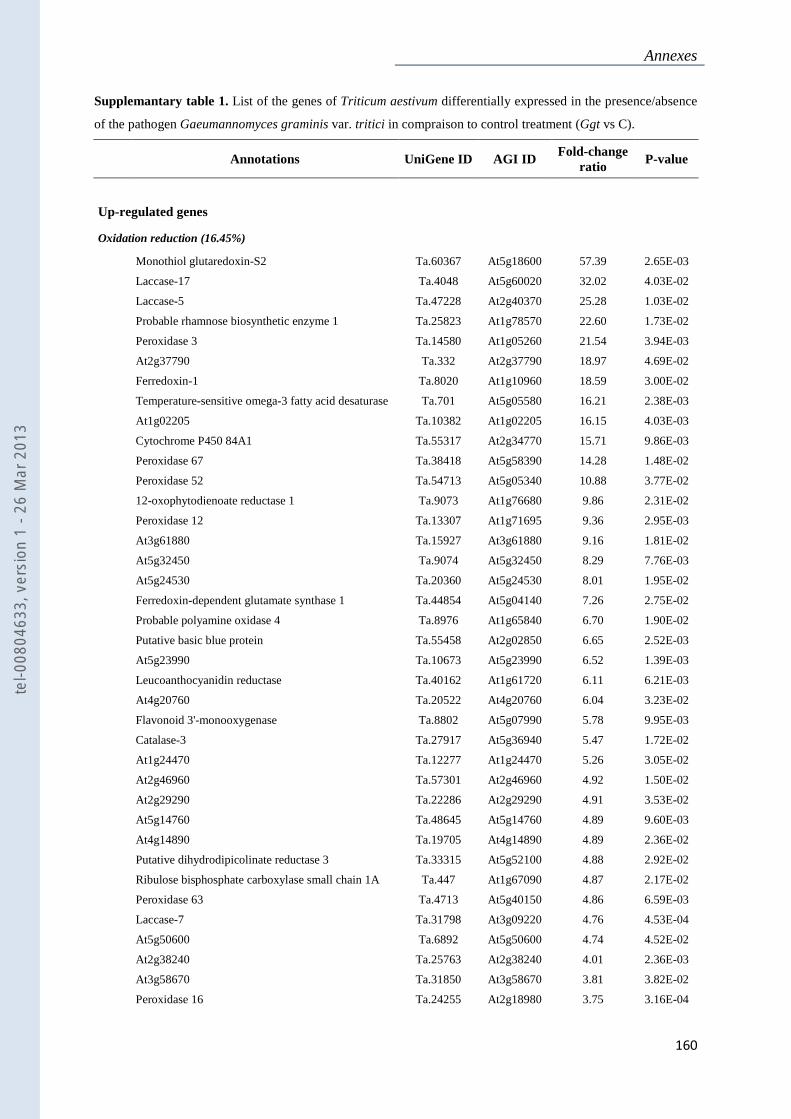
Annexes
160
Supplemantary table 1. List of the genes of Triticum aestivum differentially expressed in the presence/absence
of the pathogen Gaeumannomyces graminis var. tritici in compraison to control treatment (Ggt vs C).
Annotations UniGene ID AGI ID Fold-change
ratio P-value
Up-regulated genes
Oxidation reduction (16.45%)
Monothiol glutaredoxin-S2 Ta.60367 At5g18600 57.39 2.65E-03
Laccase-17 Ta.4048 At5g60020 32.02 4.03E-02
Laccase-5 Ta.47228 At2g40370 25.28 1.03E-02
Probable rhamnose biosynthetic enzyme 1 Ta.25823 At1g78570 22.60 1.73E-02
Peroxidase 3 Ta.14580 At1g05260 21.54 3.94E-03
At2g37790 Ta.332 At2g37790 18.97 4.69E-02
Ferredoxin-1 Ta.8020 At1g10960 18.59 3.00E-02
Temperature-sensitive omega-3 fatty acid desaturase Ta.701 At5g05580 16.21 2.38E-03
At1g02205 Ta.10382 At1g02205 16.15 4.03E-03
Cytochrome P450 84A1 Ta.55317 At2g34770 15.71 9.86E-03
Peroxidase 67 Ta.38418 At5g58390 14.28 1.48E-02
Peroxidase 52 Ta.54713 At5g05340 10.88 3.77E-02
12-oxophytodienoate reductase 1 Ta.9073 At1g76680 9.86 2.31E-02
Peroxidase 12 Ta.13307 At1g71695 9.36 2.95E-03
At3g61880 Ta.15927 At3g61880 9.16 1.81E-02
At5g32450 Ta.9074 At5g32450 8.29 7.76E-03
At5g24530 Ta.20360 At5g24530 8.01 1.95E-02
Ferredoxin-dependent glutamate synthase 1 Ta.44854 At5g04140 7.26 2.75E-02
Probable polyamine oxidase 4 Ta.8976 At1g65840 6.70 1.90E-02
Putative basic blue protein Ta.55458 At2g02850 6.65 2.52E-03
At5g23990 Ta.10673 At5g23990 6.52 1.39E-03
Leucoanthocyanidin reductase Ta.40162 At1g61720 6.11 6.21E-03
At4g20760 Ta.20522 At4g20760 6.04 3.23E-02
Flavonoid 3'-monooxygenase Ta.8802 At5g07990 5.78 9.95E-03
Catalase-3 Ta.27917 At5g36940 5.47 1.72E-02
At1g24470 Ta.12277 At1g24470 5.26 3.05E-02
At2g46960 Ta.57301 At2g46960 4.92 1.50E-02
At2g29290 Ta.22286 At2g29290 4.91 3.53E-02
At5g14760 Ta.48645 At5g14760 4.89 9.60E-03
At4g14890 Ta.19705 At4g14890 4.89 2.36E-02
Putative dihydrodipicolinate reductase 3 Ta.33315 At5g52100 4.88 2.92E-02
Ribulose bisphosphate carboxylase small chain 1A Ta.447 At1g67090 4.87 2.17E-02
Peroxidase 63 Ta.4713 At5g40150 4.86 6.59E-03
Laccase-7 Ta.31798 At3g09220 4.76 4.53E-04
At5g50600 Ta.6892 At5g50600 4.74 4.52E-02
At2g38240 Ta.25763 At2g38240 4.01 2.36E-03
At3g58670 Ta.31850 At3g58670 3.81 3.82E-02
Peroxidase 16 Ta.24255 At2g18980 3.75 3.16E-04
tel-0
0804
633,
ver
sion
1 -
26 M
ar 2
013
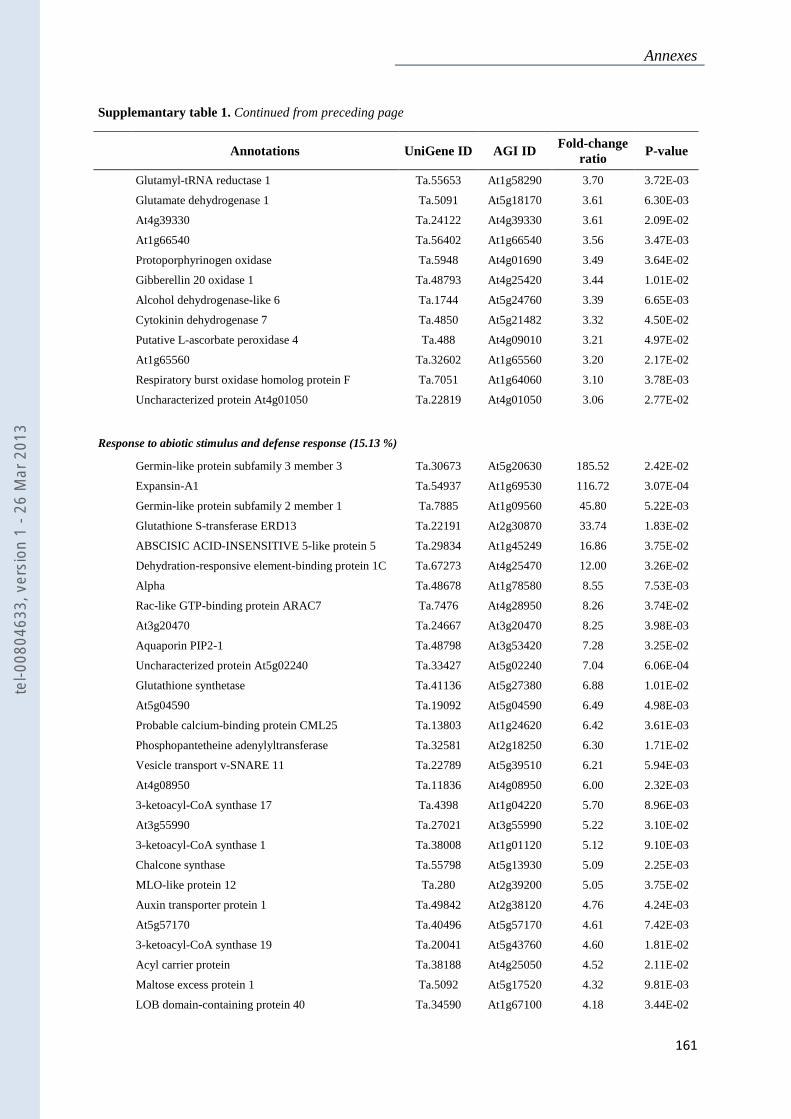
Annexes
161
Supplemantary table 1. Continued from preceding page
Annotations UniGene ID AGI ID Fold-change
ratio P-value
Glutamyl-tRNA reductase 1 Ta.55653 At1g58290 3.70 3.72E-03
Glutamate dehydrogenase 1 Ta.5091 At5g18170 3.61 6.30E-03
At4g39330 Ta.24122 At4g39330 3.61 2.09E-02
At1g66540 Ta.56402 At1g66540 3.56 3.47E-03
Protoporphyrinogen oxidase Ta.5948 At4g01690 3.49 3.64E-02
Gibberellin 20 oxidase 1 Ta.48793 At4g25420 3.44 1.01E-02
Alcohol dehydrogenase-like 6 Ta.1744 At5g24760 3.39 6.65E-03
Cytokinin dehydrogenase 7 Ta.4850 At5g21482 3.32 4.50E-02
Putative L-ascorbate peroxidase 4 Ta.488 At4g09010 3.21 4.97E-02
At1g65560 Ta.32602 At1g65560 3.20 2.17E-02
Respiratory burst oxidase homolog protein F Ta.7051 At1g64060 3.10 3.78E-03
Uncharacterized protein At4g01050 Ta.22819 At4g01050 3.06 2.77E-02
Response to abiotic stimulus and defense response (15.13 %)
Germin-like protein subfamily 3 member 3 Ta.30673 At5g20630 185.52 2.42E-02
Expansin-A1 Ta.54937 At1g69530 116.72 3.07E-04
Germin-like protein subfamily 2 member 1 Ta.7885 At1g09560 45.80 5.22E-03
Glutathione S-transferase ERD13 Ta.22191 At2g30870 33.74 1.83E-02
ABSCISIC ACID-INSENSITIVE 5-like protein 5 Ta.29834 At1g45249 16.86 3.75E-02
Dehydration-responsive element-binding protein 1C Ta.67273 At4g25470 12.00 3.26E-02
Alpha Ta.48678 At1g78580 8.55 7.53E-03
Rac-like GTP-binding protein ARAC7 Ta.7476 At4g28950 8.26 3.74E-02
At3g20470 Ta.24667 At3g20470 8.25 3.98E-03
Aquaporin PIP2-1 Ta.48798 At3g53420 7.28 3.25E-02
Uncharacterized protein At5g02240 Ta.33427 At5g02240 7.04 6.06E-04
Glutathione synthetase Ta.41136 At5g27380 6.88 1.01E-02
At5g04590 Ta.19092 At5g04590 6.49 4.98E-03
Probable calcium-binding protein CML25 Ta.13803 At1g24620 6.42 3.61E-03
Phosphopantetheine adenylyltransferase Ta.32581 At2g18250 6.30 1.71E-02
Vesicle transport v-SNARE 11 Ta.22789 At5g39510 6.21 5.94E-03
At4g08950 Ta.11836 At4g08950 6.00 2.32E-03
3-ketoacyl-CoA synthase 17 Ta.4398 At1g04220 5.70 8.96E-03
At3g55990 Ta.27021 At3g55990 5.22 3.10E-02
3-ketoacyl-CoA synthase 1 Ta.38008 At1g01120 5.12 9.10E-03
Chalcone synthase Ta.55798 At5g13930 5.09 2.25E-03
MLO-like protein 12 Ta.280 At2g39200 5.05 3.75E-02
Auxin transporter protein 1 Ta.49842 At2g38120 4.76 4.24E-03
At5g57170 Ta.40496 At5g57170 4.61 7.42E-03
3-ketoacyl-CoA synthase 19 Ta.20041 At5g43760 4.60 1.81E-02
Acyl carrier protein Ta.38188 At4g25050 4.52 2.11E-02
Maltose excess protein 1 Ta.5092 At5g17520 4.32 9.81E-03
LOB domain-containing protein 40 Ta.34590 At1g67100 4.18 3.44E-02
tel-0
0804
633,
ver
sion
1 -
26 M
ar 2
013
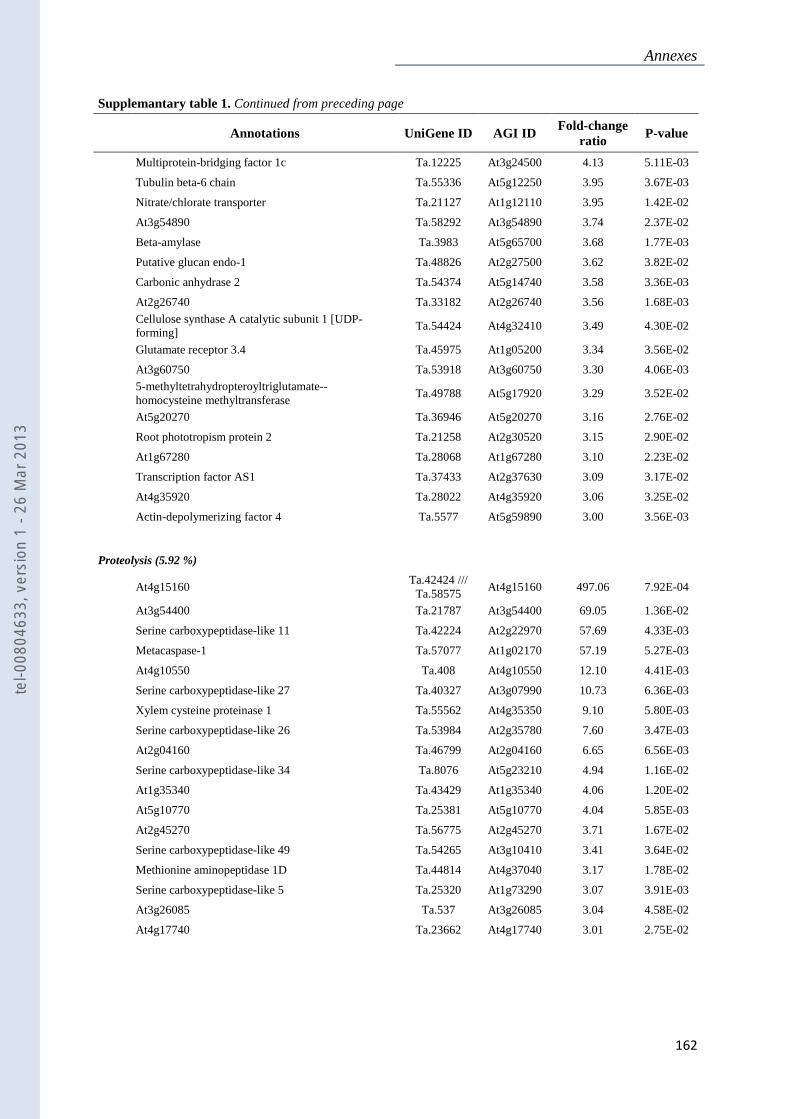
Annexes
162
Supplemantary table 1. Continued from preceding page
Annotations UniGene ID AGI ID Fold-change
ratio P-value
Multiprotein-bridging factor 1c Ta.12225 At3g24500 4.13 5.11E-03
Tubulin beta-6 chain Ta.55336 At5g12250 3.95 3.67E-03
Nitrate/chlorate transporter Ta.21127 At1g12110 3.95 1.42E-02
At3g54890 Ta.58292 At3g54890 3.74 2.37E-02
Beta-amylase Ta.3983 At5g65700 3.68 1.77E-03
Putative glucan endo-1 Ta.48826 At2g27500 3.62 3.82E-02
Carbonic anhydrase 2 Ta.54374 At5g14740 3.58 3.36E-03
At2g26740 Ta.33182 At2g26740 3.56 1.68E-03
Cellulose synthase A catalytic subunit 1 [UDP-forming]
Ta.54424 At4g32410 3.49 4.30E-02
Glutamate receptor 3.4 Ta.45975 At1g05200 3.34 3.56E-02
At3g60750 Ta.53918 At3g60750 3.30 4.06E-03
5-methyltetrahydropteroyltriglutamate--homocysteine methyltransferase
Ta.49788 At5g17920 3.29 3.52E-02
At5g20270 Ta.36946 At5g20270 3.16 2.76E-02
Root phototropism protein 2 Ta.21258 At2g30520 3.15 2.90E-02
At1g67280 Ta.28068 At1g67280 3.10 2.23E-02
Transcription factor AS1 Ta.37433 At2g37630 3.09 3.17E-02
At4g35920 Ta.28022 At4g35920 3.06 3.25E-02
Actin-depolymerizing factor 4 Ta.5577 At5g59890 3.00 3.56E-03
Proteolysis (5.92 %)
At4g15160 Ta.42424 /// Ta.58575
At4g15160 497.06 7.92E-04
At3g54400 Ta.21787 At3g54400 69.05 1.36E-02
Serine carboxypeptidase-like 11 Ta.42224 At2g22970 57.69 4.33E-03
Metacaspase-1 Ta.57077 At1g02170 57.19 5.27E-03
At4g10550 Ta.408 At4g10550 12.10 4.41E-03
Serine carboxypeptidase-like 27 Ta.40327 At3g07990 10.73 6.36E-03
Xylem cysteine proteinase 1 Ta.55562 At4g35350 9.10 5.80E-03
Serine carboxypeptidase-like 26 Ta.53984 At2g35780 7.60 3.47E-03
At2g04160 Ta.46799 At2g04160 6.65 6.56E-03
Serine carboxypeptidase-like 34 Ta.8076 At5g23210 4.94 1.16E-02
At1g35340 Ta.43429 At1g35340 4.06 1.20E-02
At5g10770 Ta.25381 At5g10770 4.04 5.85E-03
At2g45270 Ta.56775 At2g45270 3.71 1.67E-02
Serine carboxypeptidase-like 49 Ta.54265 At3g10410 3.41 3.64E-02
Methionine aminopeptidase 1D Ta.44814 At4g37040 3.17 1.78E-02
Serine carboxypeptidase-like 5 Ta.25320 At1g73290 3.07 3.91E-03
At3g26085 Ta.537 At3g26085 3.04 4.58E-02
At4g17740 Ta.23662 At4g17740 3.01 2.75E-02
tel-0
0804
633,
ver
sion
1 -
26 M
ar 2
013
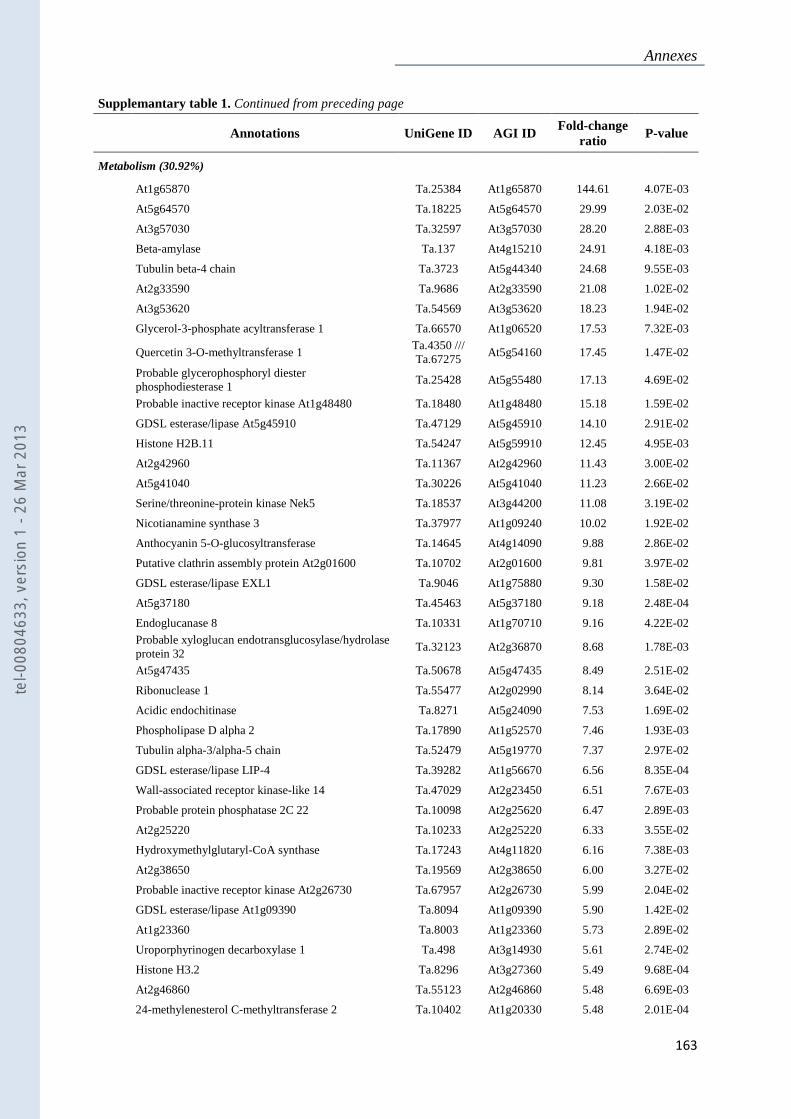
Annexes
163
Supplemantary table 1. Continued from preceding page
Annotations UniGene ID AGI ID Fold-change
ratio P-value
Metabolism (30.92%)
At1g65870 Ta.25384 At1g65870 144.61 4.07E-03
At5g64570 Ta.18225 At5g64570 29.99 2.03E-02
At3g57030 Ta.32597 At3g57030 28.20 2.88E-03
Beta-amylase Ta.137 At4g15210 24.91 4.18E-03
Tubulin beta-4 chain Ta.3723 At5g44340 24.68 9.55E-03
At2g33590 Ta.9686 At2g33590 21.08 1.02E-02
At3g53620 Ta.54569 At3g53620 18.23 1.94E-02
Glycerol-3-phosphate acyltransferase 1 Ta.66570 At1g06520 17.53 7.32E-03
Quercetin 3-O-methyltransferase 1 Ta.4350 /// Ta.67275
At5g54160 17.45 1.47E-02
Probable glycerophosphoryl diester phosphodiesterase 1
Ta.25428 At5g55480 17.13 4.69E-02
Probable inactive receptor kinase At1g48480 Ta.18480 At1g48480 15.18 1.59E-02
GDSL esterase/lipase At5g45910 Ta.47129 At5g45910 14.10 2.91E-02
Histone H2B.11 Ta.54247 At5g59910 12.45 4.95E-03
At2g42960 Ta.11367 At2g42960 11.43 3.00E-02
At5g41040 Ta.30226 At5g41040 11.23 2.66E-02
Serine/threonine-protein kinase Nek5 Ta.18537 At3g44200 11.08 3.19E-02
Nicotianamine synthase 3 Ta.37977 At1g09240 10.02 1.92E-02
Anthocyanin 5-O-glucosyltransferase Ta.14645 At4g14090 9.88 2.86E-02
Putative clathrin assembly protein At2g01600 Ta.10702 At2g01600 9.81 3.97E-02
GDSL esterase/lipase EXL1 Ta.9046 At1g75880 9.30 1.58E-02
At5g37180 Ta.45463 At5g37180 9.18 2.48E-04
Endoglucanase 8 Ta.10331 At1g70710 9.16 4.22E-02
Probable xyloglucan endotransglucosylase/hydrolase protein 32
Ta.32123 At2g36870 8.68 1.78E-03
At5g47435 Ta.50678 At5g47435 8.49 2.51E-02
Ribonuclease 1 Ta.55477 At2g02990 8.14 3.64E-02
Acidic endochitinase Ta.8271 At5g24090 7.53 1.69E-02
Phospholipase D alpha 2 Ta.17890 At1g52570 7.46 1.93E-03
Tubulin alpha-3/alpha-5 chain Ta.52479 At5g19770 7.37 2.97E-02
GDSL esterase/lipase LIP-4 Ta.39282 At1g56670 6.56 8.35E-04
Wall-associated receptor kinase-like 14 Ta.47029 At2g23450 6.51 7.67E-03
Probable protein phosphatase 2C 22 Ta.10098 At2g25620 6.47 2.89E-03
At2g25220 Ta.10233 At2g25220 6.33 3.55E-02
Hydroxymethylglutaryl-CoA synthase Ta.17243 At4g11820 6.16 7.38E-03
At2g38650 Ta.19569 At2g38650 6.00 3.27E-02
Probable inactive receptor kinase At2g26730 Ta.67957 At2g26730 5.99 2.04E-02
GDSL esterase/lipase At1g09390 Ta.8094 At1g09390 5.90 1.42E-02
At1g23360 Ta.8003 At1g23360 5.73 2.89E-02
Uroporphyrinogen decarboxylase 1 Ta.498 At3g14930 5.61 2.74E-02
Histone H3.2 Ta.8296 At3g27360 5.49 9.68E-04
At2g46860 Ta.55123 At2g46860 5.48 6.69E-03
24-methylenesterol C-methyltransferase 2 Ta.10402 At1g20330 5.48 2.01E-04
tel-0
0804
633,
ver
sion
1 -
26 M
ar 2
013
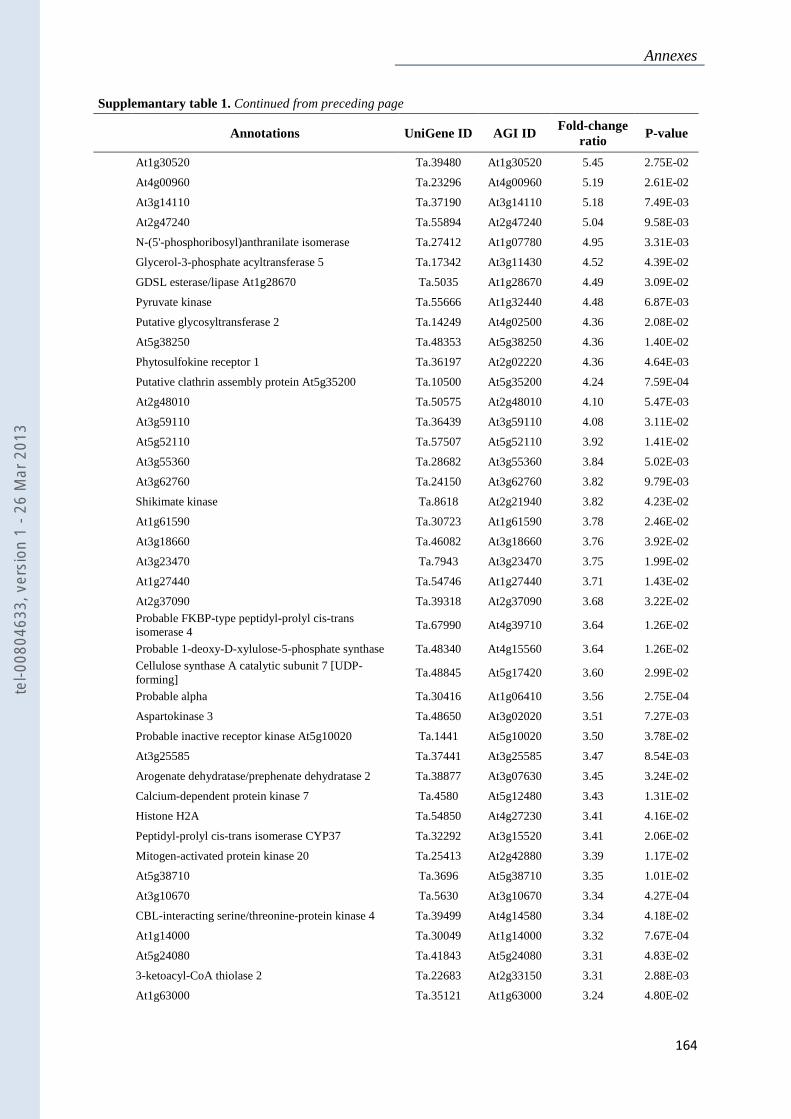
Annexes
164
Supplemantary table 1. Continued from preceding page
Annotations UniGene ID AGI ID Fold-change
ratio P-value
At1g30520 Ta.39480 At1g30520 5.45 2.75E-02
At4g00960 Ta.23296 At4g00960 5.19 2.61E-02
At3g14110 Ta.37190 At3g14110 5.18 7.49E-03
At2g47240 Ta.55894 At2g47240 5.04 9.58E-03
N-(5'-phosphoribosyl)anthranilate isomerase Ta.27412 At1g07780 4.95 3.31E-03
Glycerol-3-phosphate acyltransferase 5 Ta.17342 At3g11430 4.52 4.39E-02
GDSL esterase/lipase At1g28670 Ta.5035 At1g28670 4.49 3.09E-02
Pyruvate kinase Ta.55666 At1g32440 4.48 6.87E-03
Putative glycosyltransferase 2 Ta.14249 At4g02500 4.36 2.08E-02
At5g38250 Ta.48353 At5g38250 4.36 1.40E-02
Phytosulfokine receptor 1 Ta.36197 At2g02220 4.36 4.64E-03
Putative clathrin assembly protein At5g35200 Ta.10500 At5g35200 4.24 7.59E-04
At2g48010 Ta.50575 At2g48010 4.10 5.47E-03
At3g59110 Ta.36439 At3g59110 4.08 3.11E-02
At5g52110 Ta.57507 At5g52110 3.92 1.41E-02
At3g55360 Ta.28682 At3g55360 3.84 5.02E-03
At3g62760 Ta.24150 At3g62760 3.82 9.79E-03
Shikimate kinase Ta.8618 At2g21940 3.82 4.23E-02
At1g61590 Ta.30723 At1g61590 3.78 2.46E-02
At3g18660 Ta.46082 At3g18660 3.76 3.92E-02
At3g23470 Ta.7943 At3g23470 3.75 1.99E-02
At1g27440 Ta.54746 At1g27440 3.71 1.43E-02
At2g37090 Ta.39318 At2g37090 3.68 3.22E-02
Probable FKBP-type peptidyl-prolyl cis-trans isomerase 4
Ta.67990 At4g39710 3.64 1.26E-02
Probable 1-deoxy-D-xylulose-5-phosphate synthase Ta.48340 At4g15560 3.64 1.26E-02
Cellulose synthase A catalytic subunit 7 [UDP-forming]
Ta.48845 At5g17420 3.60 2.99E-02
Probable alpha Ta.30416 At1g06410 3.56 2.75E-04
Aspartokinase 3 Ta.48650 At3g02020 3.51 7.27E-03
Probable inactive receptor kinase At5g10020 Ta.1441 At5g10020 3.50 3.78E-02
At3g25585 Ta.37441 At3g25585 3.47 8.54E-03
Arogenate dehydratase/prephenate dehydratase 2 Ta.38877 At3g07630 3.45 3.24E-02
Calcium-dependent protein kinase 7 Ta.4580 At5g12480 3.43 1.31E-02
Histone H2A Ta.54850 At4g27230 3.41 4.16E-02
Peptidyl-prolyl cis-trans isomerase CYP37 Ta.32292 At3g15520 3.41 2.06E-02
Mitogen-activated protein kinase 20 Ta.25413 At2g42880 3.39 1.17E-02
At5g38710 Ta.3696 At5g38710 3.35 1.01E-02
At3g10670 Ta.5630 At3g10670 3.34 4.27E-04
CBL-interacting serine/threonine-protein kinase 4 Ta.39499 At4g14580 3.34 4.18E-02
At1g14000 Ta.30049 At1g14000 3.32 7.67E-04
At5g24080 Ta.41843 At5g24080 3.31 4.83E-02
3-ketoacyl-CoA thiolase 2 Ta.22683 At2g33150 3.31 2.88E-03
At1g63000 Ta.35121 At1g63000 3.24 4.80E-02
tel-0
0804
633,
ver
sion
1 -
26 M
ar 2
013
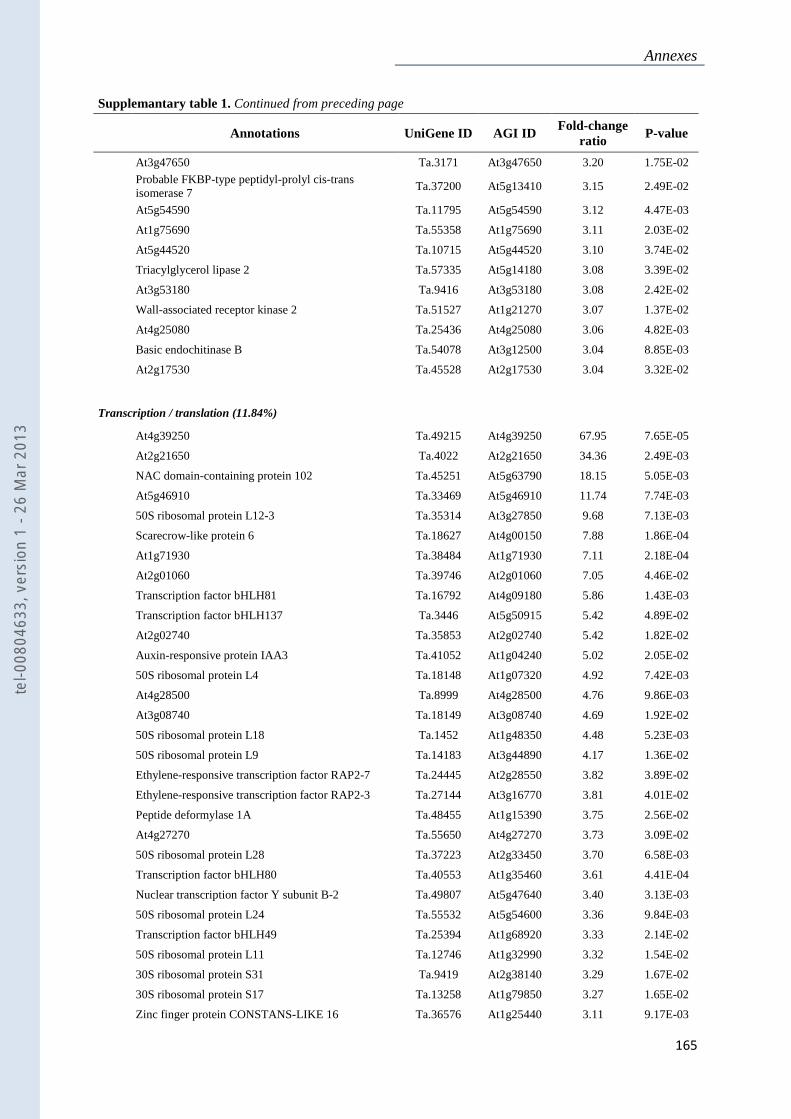
Annexes
165
Supplemantary table 1. Continued from preceding page
Annotations UniGene ID AGI ID Fold-change
ratio P-value
At3g47650 Ta.3171 At3g47650 3.20 1.75E-02
Probable FKBP-type peptidyl-prolyl cis-trans isomerase 7
Ta.37200 At5g13410 3.15 2.49E-02
At5g54590 Ta.11795 At5g54590 3.12 4.47E-03
At1g75690 Ta.55358 At1g75690 3.11 2.03E-02
At5g44520 Ta.10715 At5g44520 3.10 3.74E-02
Triacylglycerol lipase 2 Ta.57335 At5g14180 3.08 3.39E-02
At3g53180 Ta.9416 At3g53180 3.08 2.42E-02
Wall-associated receptor kinase 2 Ta.51527 At1g21270 3.07 1.37E-02
At4g25080 Ta.25436 At4g25080 3.06 4.82E-03
Basic endochitinase B Ta.54078 At3g12500 3.04 8.85E-03
At2g17530 Ta.45528 At2g17530 3.04 3.32E-02
Transcription / translation (11.84%)
At4g39250 Ta.49215 At4g39250 67.95 7.65E-05
At2g21650 Ta.4022 At2g21650 34.36 2.49E-03
NAC domain-containing protein 102 Ta.45251 At5g63790 18.15 5.05E-03
At5g46910 Ta.33469 At5g46910 11.74 7.74E-03
50S ribosomal protein L12-3 Ta.35314 At3g27850 9.68 7.13E-03
Scarecrow-like protein 6 Ta.18627 At4g00150 7.88 1.86E-04
At1g71930 Ta.38484 At1g71930 7.11 2.18E-04
At2g01060 Ta.39746 At2g01060 7.05 4.46E-02
Transcription factor bHLH81 Ta.16792 At4g09180 5.86 1.43E-03
Transcription factor bHLH137 Ta.3446 At5g50915 5.42 4.89E-02
At2g02740 Ta.35853 At2g02740 5.42 1.82E-02
Auxin-responsive protein IAA3 Ta.41052 At1g04240 5.02 2.05E-02
50S ribosomal protein L4 Ta.18148 At1g07320 4.92 7.42E-03
At4g28500 Ta.8999 At4g28500 4.76 9.86E-03
At3g08740 Ta.18149 At3g08740 4.69 1.92E-02
50S ribosomal protein L18 Ta.1452 At1g48350 4.48 5.23E-03
50S ribosomal protein L9 Ta.14183 At3g44890 4.17 1.36E-02
Ethylene-responsive transcription factor RAP2-7 Ta.24445 At2g28550 3.82 3.89E-02
Ethylene-responsive transcription factor RAP2-3 Ta.27144 At3g16770 3.81 4.01E-02
Peptide deformylase 1A Ta.48455 At1g15390 3.75 2.56E-02
At4g27270 Ta.55650 At4g27270 3.73 3.09E-02
50S ribosomal protein L28 Ta.37223 At2g33450 3.70 6.58E-03
Transcription factor bHLH80 Ta.40553 At1g35460 3.61 4.41E-04
Nuclear transcription factor Y subunit B-2 Ta.49807 At5g47640 3.40 3.13E-03
50S ribosomal protein L24 Ta.55532 At5g54600 3.36 9.84E-03
Transcription factor bHLH49 Ta.25394 At1g68920 3.33 2.14E-02
50S ribosomal protein L11 Ta.12746 At1g32990 3.32 1.54E-02
30S ribosomal protein S31 Ta.9419 At2g38140 3.29 1.67E-02
30S ribosomal protein S17 Ta.13258 At1g79850 3.27 1.65E-02
Zinc finger protein CONSTANS-LIKE 16 Ta.36576 At1g25440 3.11 9.17E-03
tel-0
0804
633,
ver
sion
1 -
26 M
ar 2
013
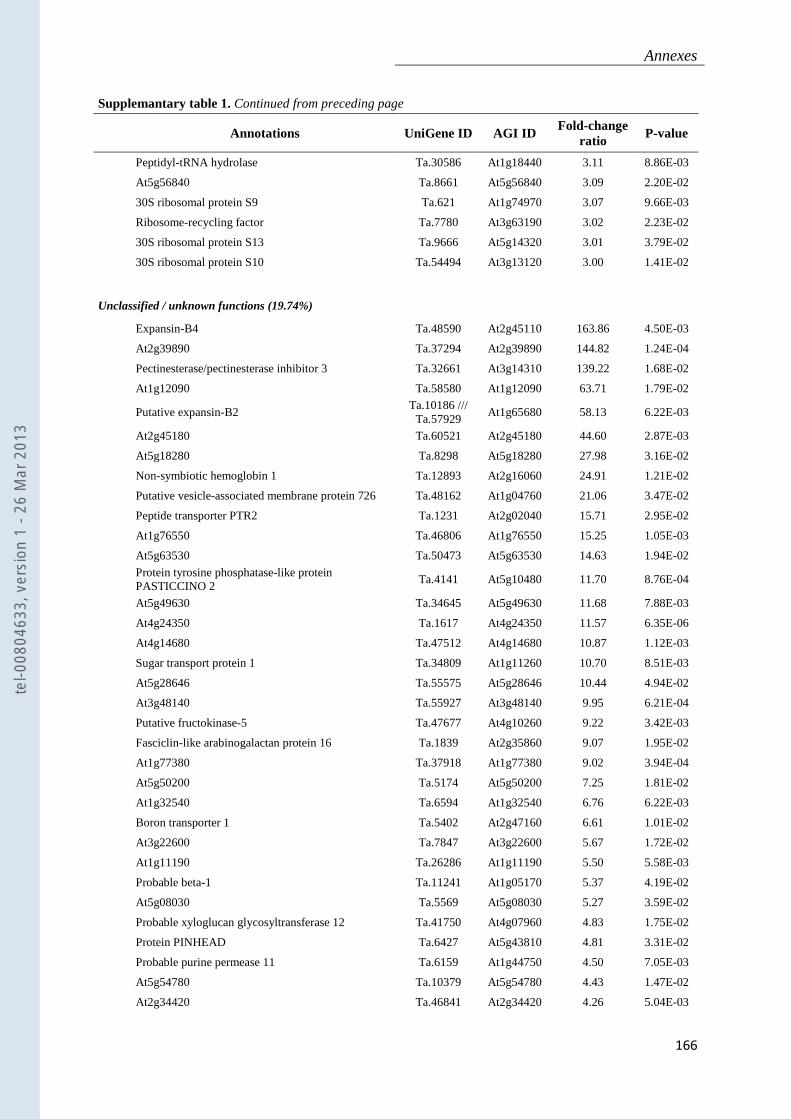
Annexes
166
Supplemantary table 1. Continued from preceding page
Annotations UniGene ID AGI ID Fold-change
ratio P-value
Peptidyl-tRNA hydrolase Ta.30586 At1g18440 3.11 8.86E-03
At5g56840 Ta.8661 At5g56840 3.09 2.20E-02
30S ribosomal protein S9 Ta.621 At1g74970 3.07 9.66E-03
Ribosome-recycling factor Ta.7780 At3g63190 3.02 2.23E-02
30S ribosomal protein S13 Ta.9666 At5g14320 3.01 3.79E-02
30S ribosomal protein S10 Ta.54494 At3g13120 3.00 1.41E-02
Unclassified / unknown functions (19.74%)
Expansin-B4 Ta.48590 At2g45110 163.86 4.50E-03
At2g39890 Ta.37294 At2g39890 144.82 1.24E-04
Pectinesterase/pectinesterase inhibitor 3 Ta.32661 At3g14310 139.22 1.68E-02
At1g12090 Ta.58580 At1g12090 63.71 1.79E-02
Putative expansin-B2 Ta.10186 /// Ta.57929
At1g65680 58.13 6.22E-03
At2g45180 Ta.60521 At2g45180 44.60 2.87E-03
At5g18280 Ta.8298 At5g18280 27.98 3.16E-02
Non-symbiotic hemoglobin 1 Ta.12893 At2g16060 24.91 1.21E-02
Putative vesicle-associated membrane protein 726 Ta.48162 At1g04760 21.06 3.47E-02
Peptide transporter PTR2 Ta.1231 At2g02040 15.71 2.95E-02
At1g76550 Ta.46806 At1g76550 15.25 1.05E-03
At5g63530 Ta.50473 At5g63530 14.63 1.94E-02
Protein tyrosine phosphatase-like protein PASTICCINO 2
Ta.4141 At5g10480 11.70 8.76E-04
At5g49630 Ta.34645 At5g49630 11.68 7.88E-03
At4g24350 Ta.1617 At4g24350 11.57 6.35E-06
At4g14680 Ta.47512 At4g14680 10.87 1.12E-03
Sugar transport protein 1 Ta.34809 At1g11260 10.70 8.51E-03
At5g28646 Ta.55575 At5g28646 10.44 4.94E-02
At3g48140 Ta.55927 At3g48140 9.95 6.21E-04
Putative fructokinase-5 Ta.47677 At4g10260 9.22 3.42E-03
Fasciclin-like arabinogalactan protein 16 Ta.1839 At2g35860 9.07 1.95E-02
At1g77380 Ta.37918 At1g77380 9.02 3.94E-04
At5g50200 Ta.5174 At5g50200 7.25 1.81E-02
At1g32540 Ta.6594 At1g32540 6.76 6.22E-03
Boron transporter 1 Ta.5402 At2g47160 6.61 1.01E-02
At3g22600 Ta.7847 At3g22600 5.67 1.72E-02
At1g11190 Ta.26286 At1g11190 5.50 5.58E-03
Probable beta-1 Ta.11241 At1g05170 5.37 4.19E-02
At5g08030 Ta.5569 At5g08030 5.27 3.59E-02
Probable xyloglucan glycosyltransferase 12 Ta.41750 At4g07960 4.83 1.75E-02
Protein PINHEAD Ta.6427 At5g43810 4.81 3.31E-02
Probable purine permease 11 Ta.6159 At1g44750 4.50 7.05E-03
At5g54780 Ta.10379 At5g54780 4.43 1.47E-02
At2g34420 Ta.46841 At2g34420 4.26 5.04E-03
tel-0
0804
633,
ver
sion
1 -
26 M
ar 2
013
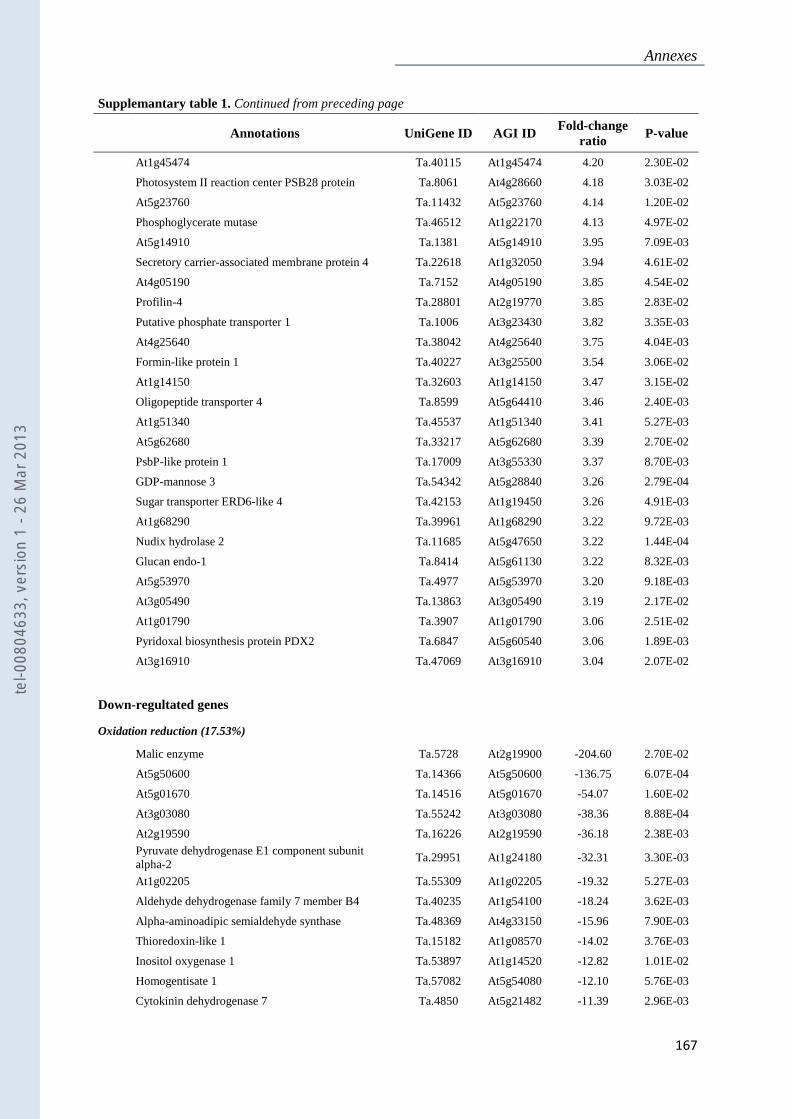
Annexes
167
Supplemantary table 1. Continued from preceding page
Annotations UniGene ID AGI ID Fold-change
ratio P-value
At1g45474 Ta.40115 At1g45474 4.20 2.30E-02
Photosystem II reaction center PSB28 protein Ta.8061 At4g28660 4.18 3.03E-02
At5g23760 Ta.11432 At5g23760 4.14 1.20E-02
Phosphoglycerate mutase Ta.46512 At1g22170 4.13 4.97E-02
At5g14910 Ta.1381 At5g14910 3.95 7.09E-03
Secretory carrier-associated membrane protein 4 Ta.22618 At1g32050 3.94 4.61E-02
At4g05190 Ta.7152 At4g05190 3.85 4.54E-02
Profilin-4 Ta.28801 At2g19770 3.85 2.83E-02
Putative phosphate transporter 1 Ta.1006 At3g23430 3.82 3.35E-03
At4g25640 Ta.38042 At4g25640 3.75 4.04E-03
Formin-like protein 1 Ta.40227 At3g25500 3.54 3.06E-02
At1g14150 Ta.32603 At1g14150 3.47 3.15E-02
Oligopeptide transporter 4 Ta.8599 At5g64410 3.46 2.40E-03
At1g51340 Ta.45537 At1g51340 3.41 5.27E-03
At5g62680 Ta.33217 At5g62680 3.39 2.70E-02
PsbP-like protein 1 Ta.17009 At3g55330 3.37 8.70E-03
GDP-mannose 3 Ta.54342 At5g28840 3.26 2.79E-04
Sugar transporter ERD6-like 4 Ta.42153 At1g19450 3.26 4.91E-03
At1g68290 Ta.39961 At1g68290 3.22 9.72E-03
Nudix hydrolase 2 Ta.11685 At5g47650 3.22 1.44E-04
Glucan endo-1 Ta.8414 At5g61130 3.22 8.32E-03
At5g53970 Ta.4977 At5g53970 3.20 9.18E-03
At3g05490 Ta.13863 At3g05490 3.19 2.17E-02
At1g01790 Ta.3907 At1g01790 3.06 2.51E-02
Pyridoxal biosynthesis protein PDX2 Ta.6847 At5g60540 3.06 1.89E-03
At3g16910 Ta.47069 At3g16910 3.04 2.07E-02
Down-regultated genes
Oxidation reduction (17.53%)
Malic enzyme Ta.5728 At2g19900 -204.60 2.70E-02
At5g50600 Ta.14366 At5g50600 -136.75 6.07E-04
At5g01670 Ta.14516 At5g01670 -54.07 1.60E-02
At3g03080 Ta.55242 At3g03080 -38.36 8.88E-04
At2g19590 Ta.16226 At2g19590 -36.18 2.38E-03
Pyruvate dehydrogenase E1 component subunit alpha-2
Ta.29951 At1g24180 -32.31 3.30E-03
At1g02205 Ta.55309 At1g02205 -19.32 5.27E-03
Aldehyde dehydrogenase family 7 member B4 Ta.40235 At1g54100 -18.24 3.62E-03
Alpha-aminoadipic semialdehyde synthase Ta.48369 At4g33150 -15.96 7.90E-03
Thioredoxin-like 1 Ta.15182 At1g08570 -14.02 3.76E-03
Inositol oxygenase 1 Ta.53897 At1g14520 -12.82 1.01E-02
Homogentisate 1 Ta.57082 At5g54080 -12.10 5.76E-03
Cytokinin dehydrogenase 7 Ta.4850 At5g21482 -11.39 2.96E-03
tel-0
0804
633,
ver
sion
1 -
26 M
ar 2
013
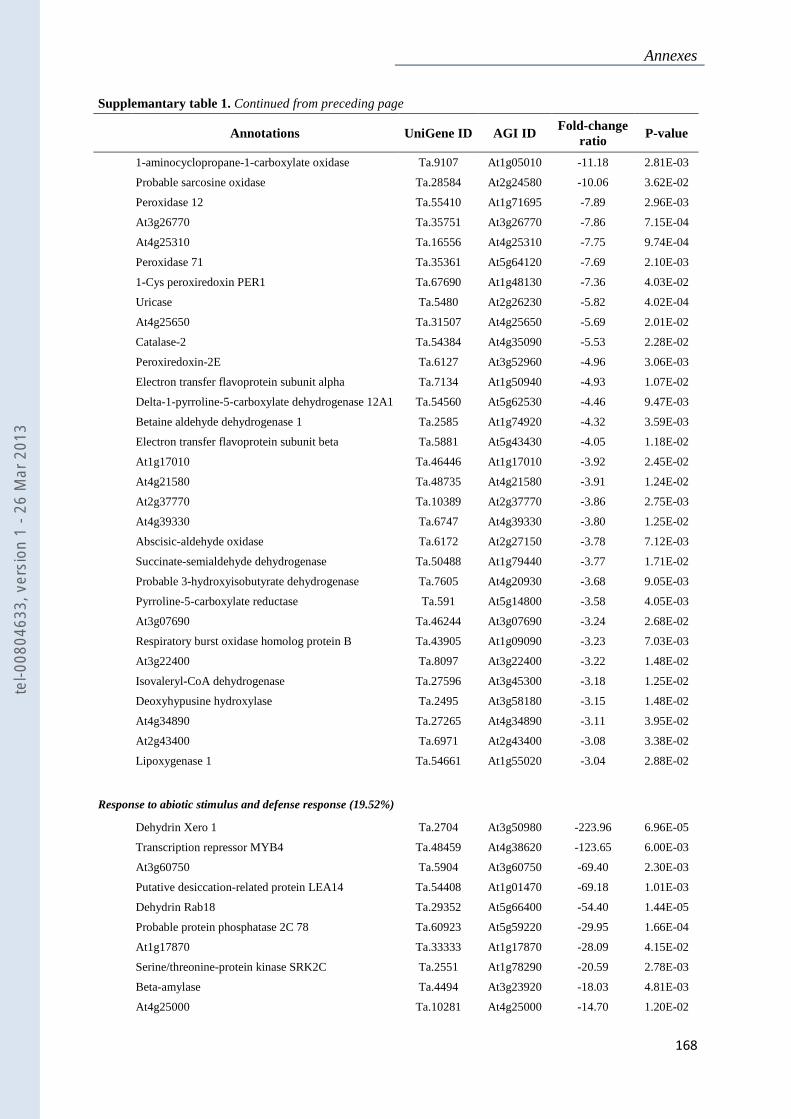
Annexes
168
Supplemantary table 1. Continued from preceding page
Annotations UniGene ID AGI ID Fold-change
ratio P-value
1-aminocyclopropane-1-carboxylate oxidase Ta.9107 At1g05010 -11.18 2.81E-03
Probable sarcosine oxidase Ta.28584 At2g24580 -10.06 3.62E-02
Peroxidase 12 Ta.55410 At1g71695 -7.89 2.96E-03
At3g26770 Ta.35751 At3g26770 -7.86 7.15E-04
At4g25310 Ta.16556 At4g25310 -7.75 9.74E-04
Peroxidase 71 Ta.35361 At5g64120 -7.69 2.10E-03
1-Cys peroxiredoxin PER1 Ta.67690 At1g48130 -7.36 4.03E-02
Uricase Ta.5480 At2g26230 -5.82 4.02E-04
At4g25650 Ta.31507 At4g25650 -5.69 2.01E-02
Catalase-2 Ta.54384 At4g35090 -5.53 2.28E-02
Peroxiredoxin-2E Ta.6127 At3g52960 -4.96 3.06E-03
Electron transfer flavoprotein subunit alpha Ta.7134 At1g50940 -4.93 1.07E-02
Delta-1-pyrroline-5-carboxylate dehydrogenase 12A1 Ta.54560 At5g62530 -4.46 9.47E-03
Betaine aldehyde dehydrogenase 1 Ta.2585 At1g74920 -4.32 3.59E-03
Electron transfer flavoprotein subunit beta Ta.5881 At5g43430 -4.05 1.18E-02
At1g17010 Ta.46446 At1g17010 -3.92 2.45E-02
At4g21580 Ta.48735 At4g21580 -3.91 1.24E-02
At2g37770 Ta.10389 At2g37770 -3.86 2.75E-03
At4g39330 Ta.6747 At4g39330 -3.80 1.25E-02
Abscisic-aldehyde oxidase Ta.6172 At2g27150 -3.78 7.12E-03
Succinate-semialdehyde dehydrogenase Ta.50488 At1g79440 -3.77 1.71E-02
Probable 3-hydroxyisobutyrate dehydrogenase Ta.7605 At4g20930 -3.68 9.05E-03
Pyrroline-5-carboxylate reductase Ta.591 At5g14800 -3.58 4.05E-03
At3g07690 Ta.46244 At3g07690 -3.24 2.68E-02
Respiratory burst oxidase homolog protein B Ta.43905 At1g09090 -3.23 7.03E-03
At3g22400 Ta.8097 At3g22400 -3.22 1.48E-02
Isovaleryl-CoA dehydrogenase Ta.27596 At3g45300 -3.18 1.25E-02
Deoxyhypusine hydroxylase Ta.2495 At3g58180 -3.15 1.48E-02
At4g34890 Ta.27265 At4g34890 -3.11 3.95E-02
At2g43400 Ta.6971 At2g43400 -3.08 3.38E-02
Lipoxygenase 1 Ta.54661 At1g55020 -3.04 2.88E-02
Response to abiotic stimulus and defense response (19.52%)
Dehydrin Xero 1 Ta.2704 At3g50980 -223.96 6.96E-05
Transcription repressor MYB4 Ta.48459 At4g38620 -123.65 6.00E-03
At3g60750 Ta.5904 At3g60750 -69.40 2.30E-03
Putative desiccation-related protein LEA14 Ta.54408 At1g01470 -69.18 1.01E-03
Dehydrin Rab18 Ta.29352 At5g66400 -54.40 1.44E-05
Probable protein phosphatase 2C 78 Ta.60923 At5g59220 -29.95 1.66E-04
At1g17870 Ta.33333 At1g17870 -28.09 4.15E-02
Serine/threonine-protein kinase SRK2C Ta.2551 At1g78290 -20.59 2.78E-03
Beta-amylase Ta.4494 At3g23920 -18.03 4.81E-03
At4g25000 Ta.10281 At4g25000 -14.70 1.20E-02
tel-0
0804
633,
ver
sion
1 -
26 M
ar 2
013
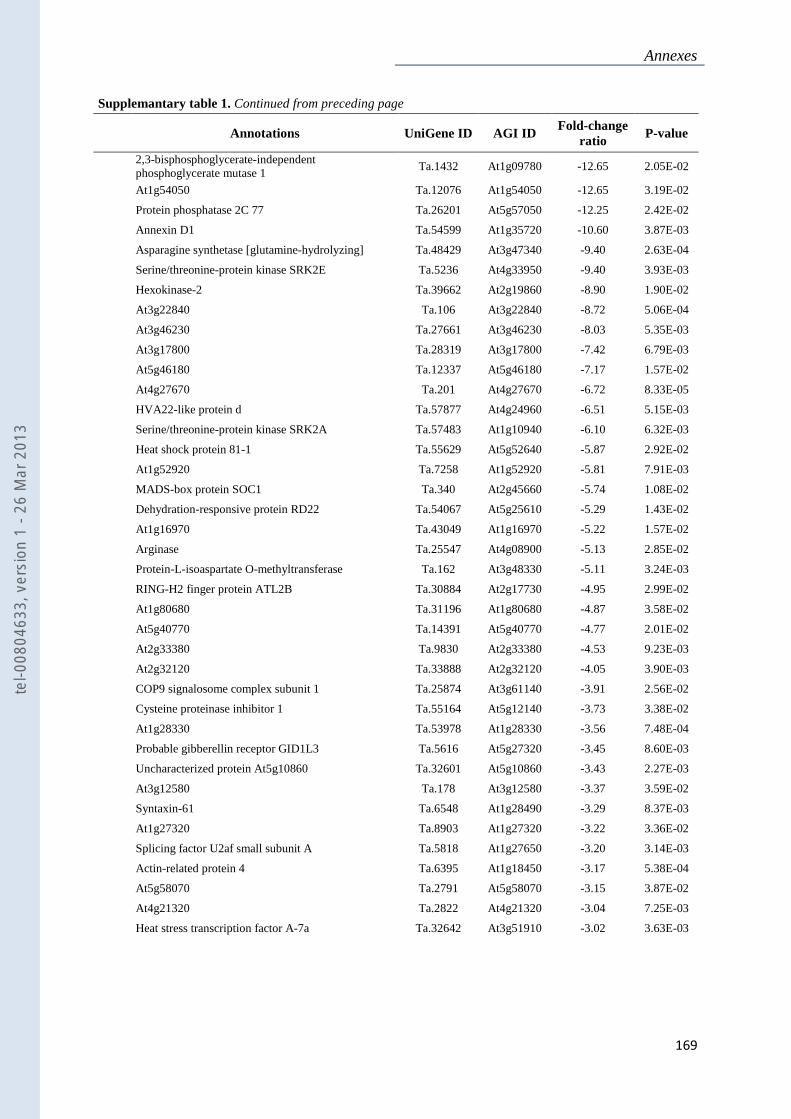
Annexes
169
Supplemantary table 1. Continued from preceding page
Annotations UniGene ID AGI ID Fold-change
ratio P-value
2,3-bisphosphoglycerate-independent phosphoglycerate mutase 1
Ta.1432 At1g09780 -12.65 2.05E-02
At1g54050 Ta.12076 At1g54050 -12.65 3.19E-02
Protein phosphatase 2C 77 Ta.26201 At5g57050 -12.25 2.42E-02
Annexin D1 Ta.54599 At1g35720 -10.60 3.87E-03
Asparagine synthetase [glutamine-hydrolyzing] Ta.48429 At3g47340 -9.40 2.63E-04
Serine/threonine-protein kinase SRK2E Ta.5236 At4g33950 -9.40 3.93E-03
Hexokinase-2 Ta.39662 At2g19860 -8.90 1.90E-02
At3g22840 Ta.106 At3g22840 -8.72 5.06E-04
At3g46230 Ta.27661 At3g46230 -8.03 5.35E-03
At3g17800 Ta.28319 At3g17800 -7.42 6.79E-03
At5g46180 Ta.12337 At5g46180 -7.17 1.57E-02
At4g27670 Ta.201 At4g27670 -6.72 8.33E-05
HVA22-like protein d Ta.57877 At4g24960 -6.51 5.15E-03
Serine/threonine-protein kinase SRK2A Ta.57483 At1g10940 -6.10 6.32E-03
Heat shock protein 81-1 Ta.55629 At5g52640 -5.87 2.92E-02
At1g52920 Ta.7258 At1g52920 -5.81 7.91E-03
MADS-box protein SOC1 Ta.340 At2g45660 -5.74 1.08E-02
Dehydration-responsive protein RD22 Ta.54067 At5g25610 -5.29 1.43E-02
At1g16970 Ta.43049 At1g16970 -5.22 1.57E-02
Arginase Ta.25547 At4g08900 -5.13 2.85E-02
Protein-L-isoaspartate O-methyltransferase Ta.162 At3g48330 -5.11 3.24E-03
RING-H2 finger protein ATL2B Ta.30884 At2g17730 -4.95 2.99E-02
At1g80680 Ta.31196 At1g80680 -4.87 3.58E-02
At5g40770 Ta.14391 At5g40770 -4.77 2.01E-02
At2g33380 Ta.9830 At2g33380 -4.53 9.23E-03
At2g32120 Ta.33888 At2g32120 -4.05 3.90E-03
COP9 signalosome complex subunit 1 Ta.25874 At3g61140 -3.91 2.56E-02
Cysteine proteinase inhibitor 1 Ta.55164 At5g12140 -3.73 3.38E-02
At1g28330 Ta.53978 At1g28330 -3.56 7.48E-04
Probable gibberellin receptor GID1L3 Ta.5616 At5g27320 -3.45 8.60E-03
Uncharacterized protein At5g10860 Ta.32601 At5g10860 -3.43 2.27E-03
At3g12580 Ta.178 At3g12580 -3.37 3.59E-02
Syntaxin-61 Ta.6548 At1g28490 -3.29 8.37E-03
At1g27320 Ta.8903 At1g27320 -3.22 3.36E-02
Splicing factor U2af small subunit A Ta.5818 At1g27650 -3.20 3.14E-03
Actin-related protein 4 Ta.6395 At1g18450 -3.17 5.38E-04
At5g58070 Ta.2791 At5g58070 -3.15 3.87E-02
At4g21320 Ta.2822 At4g21320 -3.04 7.25E-03
Heat stress transcription factor A-7a Ta.32642 At3g51910 -3.02 3.63E-03
tel-0
0804
633,
ver
sion
1 -
26 M
ar 2
013
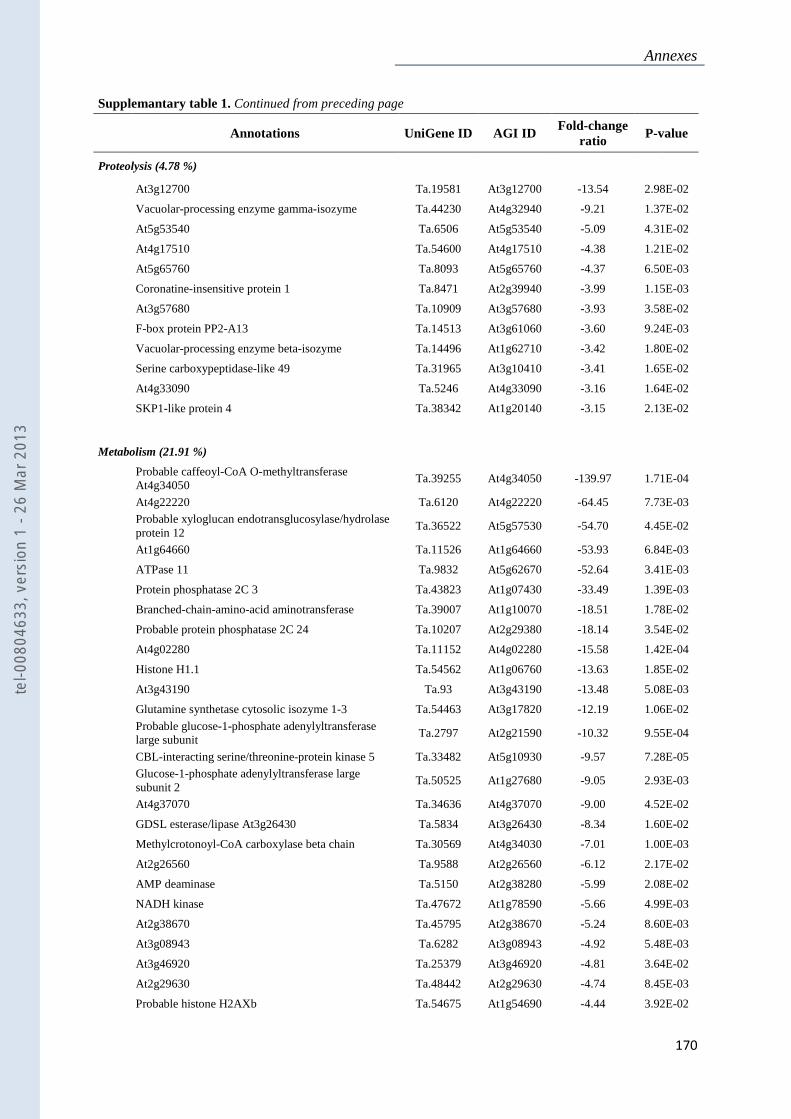
Annexes
170
Supplemantary table 1. Continued from preceding page
Annotations UniGene ID AGI ID Fold-change
ratio P-value
Proteolysis (4.78 %)
At3g12700 Ta.19581 At3g12700 -13.54 2.98E-02
Vacuolar-processing enzyme gamma-isozyme Ta.44230 At4g32940 -9.21 1.37E-02
At5g53540 Ta.6506 At5g53540 -5.09 4.31E-02
At4g17510 Ta.54600 At4g17510 -4.38 1.21E-02
At5g65760 Ta.8093 At5g65760 -4.37 6.50E-03
Coronatine-insensitive protein 1 Ta.8471 At2g39940 -3.99 1.15E-03
At3g57680 Ta.10909 At3g57680 -3.93 3.58E-02
F-box protein PP2-A13 Ta.14513 At3g61060 -3.60 9.24E-03
Vacuolar-processing enzyme beta-isozyme Ta.14496 At1g62710 -3.42 1.80E-02
Serine carboxypeptidase-like 49 Ta.31965 At3g10410 -3.41 1.65E-02
At4g33090 Ta.5246 At4g33090 -3.16 1.64E-02
SKP1-like protein 4 Ta.38342 At1g20140 -3.15 2.13E-02
Metabolism (21.91 %)
Probable caffeoyl-CoA O-methyltransferase At4g34050
Ta.39255 At4g34050 -139.97 1.71E-04
At4g22220 Ta.6120 At4g22220 -64.45 7.73E-03
Probable xyloglucan endotransglucosylase/hydrolase protein 12
Ta.36522 At5g57530 -54.70 4.45E-02
At1g64660 Ta.11526 At1g64660 -53.93 6.84E-03
ATPase 11 Ta.9832 At5g62670 -52.64 3.41E-03
Protein phosphatase 2C 3 Ta.43823 At1g07430 -33.49 1.39E-03
Branched-chain-amino-acid aminotransferase Ta.39007 At1g10070 -18.51 1.78E-02
Probable protein phosphatase 2C 24 Ta.10207 At2g29380 -18.14 3.54E-02
At4g02280 Ta.11152 At4g02280 -15.58 1.42E-04
Histone H1.1 Ta.54562 At1g06760 -13.63 1.85E-02
At3g43190 Ta.93 At3g43190 -13.48 5.08E-03
Glutamine synthetase cytosolic isozyme 1-3 Ta.54463 At3g17820 -12.19 1.06E-02
Probable glucose-1-phosphate adenylyltransferase large subunit
Ta.2797 At2g21590 -10.32 9.55E-04
CBL-interacting serine/threonine-protein kinase 5 Ta.33482 At5g10930 -9.57 7.28E-05
Glucose-1-phosphate adenylyltransferase large subunit 2
Ta.50525 At1g27680 -9.05 2.93E-03
At4g37070 Ta.34636 At4g37070 -9.00 4.52E-02
GDSL esterase/lipase At3g26430 Ta.5834 At3g26430 -8.34 1.60E-02
Methylcrotonoyl-CoA carboxylase beta chain Ta.30569 At4g34030 -7.01 1.00E-03
At2g26560 Ta.9588 At2g26560 -6.12 2.17E-02
AMP deaminase Ta.5150 At2g38280 -5.99 2.08E-02
NADH kinase Ta.47672 At1g78590 -5.66 4.99E-03
At2g38670 Ta.45795 At2g38670 -5.24 8.60E-03
At3g08943 Ta.6282 At3g08943 -4.92 5.48E-03
At3g46920 Ta.25379 At3g46920 -4.81 3.64E-02
At2g29630 Ta.48442 At2g29630 -4.74 8.45E-03
Probable histone H2AXb Ta.54675 At1g54690 -4.44 3.92E-02
tel-0
0804
633,
ver
sion
1 -
26 M
ar 2
013
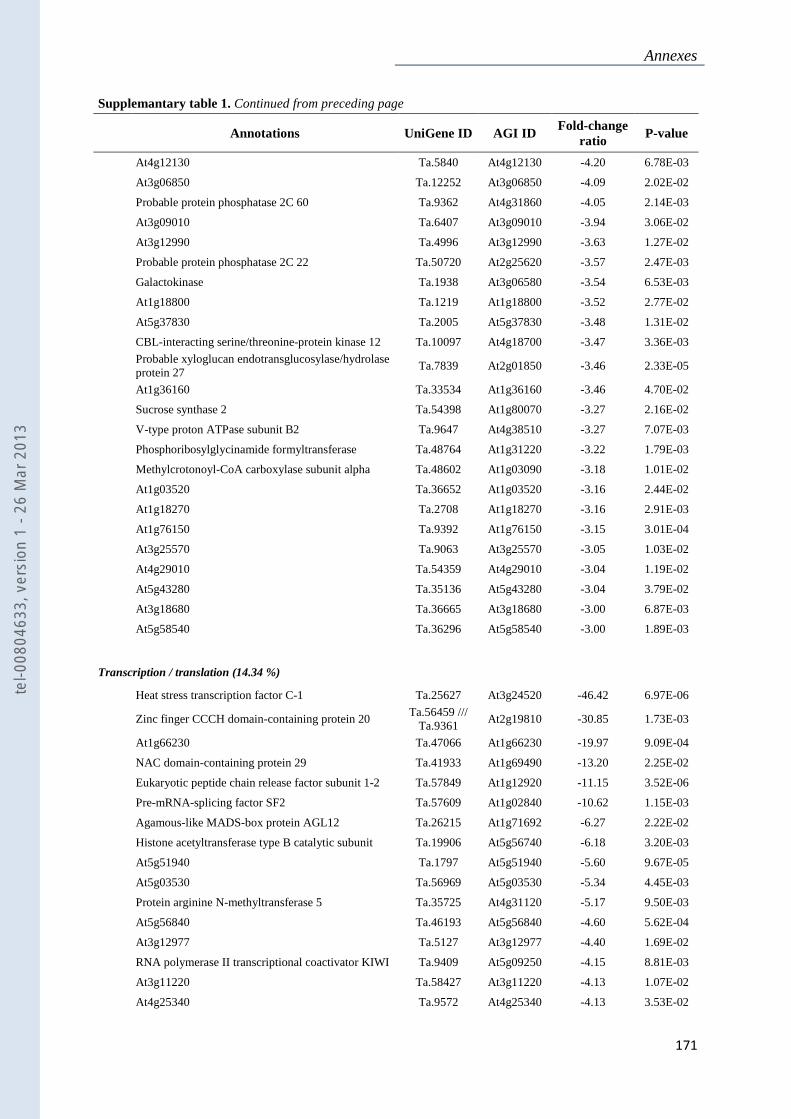
Annexes
171
Supplemantary table 1. Continued from preceding page
Annotations UniGene ID AGI ID Fold-change
ratio P-value
At4g12130 Ta.5840 At4g12130 -4.20 6.78E-03
At3g06850 Ta.12252 At3g06850 -4.09 2.02E-02
Probable protein phosphatase 2C 60 Ta.9362 At4g31860 -4.05 2.14E-03
At3g09010 Ta.6407 At3g09010 -3.94 3.06E-02
At3g12990 Ta.4996 At3g12990 -3.63 1.27E-02
Probable protein phosphatase 2C 22 Ta.50720 At2g25620 -3.57 2.47E-03
Galactokinase Ta.1938 At3g06580 -3.54 6.53E-03
At1g18800 Ta.1219 At1g18800 -3.52 2.77E-02
At5g37830 Ta.2005 At5g37830 -3.48 1.31E-02
CBL-interacting serine/threonine-protein kinase 12 Ta.10097 At4g18700 -3.47 3.36E-03
Probable xyloglucan endotransglucosylase/hydrolase protein 27
Ta.7839 At2g01850 -3.46 2.33E-05
At1g36160 Ta.33534 At1g36160 -3.46 4.70E-02
Sucrose synthase 2 Ta.54398 At1g80070 -3.27 2.16E-02
V-type proton ATPase subunit B2 Ta.9647 At4g38510 -3.27 7.07E-03
Phosphoribosylglycinamide formyltransferase Ta.48764 At1g31220 -3.22 1.79E-03
Methylcrotonoyl-CoA carboxylase subunit alpha Ta.48602 At1g03090 -3.18 1.01E-02
At1g03520 Ta.36652 At1g03520 -3.16 2.44E-02
At1g18270 Ta.2708 At1g18270 -3.16 2.91E-03
At1g76150 Ta.9392 At1g76150 -3.15 3.01E-04
At3g25570 Ta.9063 At3g25570 -3.05 1.03E-02
At4g29010 Ta.54359 At4g29010 -3.04 1.19E-02
At5g43280 Ta.35136 At5g43280 -3.04 3.79E-02
At3g18680 Ta.36665 At3g18680 -3.00 6.87E-03
At5g58540 Ta.36296 At5g58540 -3.00 1.89E-03
Transcription / translation (14.34 %)
Heat stress transcription factor C-1 Ta.25627 At3g24520 -46.42 6.97E-06
Zinc finger CCCH domain-containing protein 20 Ta.56459 ///
Ta.9361 At2g19810 -30.85 1.73E-03
At1g66230 Ta.47066 At1g66230 -19.97 9.09E-04
NAC domain-containing protein 29 Ta.41933 At1g69490 -13.20 2.25E-02
Eukaryotic peptide chain release factor subunit 1-2 Ta.57849 At1g12920 -11.15 3.52E-06
Pre-mRNA-splicing factor SF2 Ta.57609 At1g02840 -10.62 1.15E-03
Agamous-like MADS-box protein AGL12 Ta.26215 At1g71692 -6.27 2.22E-02
Histone acetyltransferase type B catalytic subunit Ta.19906 At5g56740 -6.18 3.20E-03
At5g51940 Ta.1797 At5g51940 -5.60 9.67E-05
At5g03530 Ta.56969 At5g03530 -5.34 4.45E-03
Protein arginine N-methyltransferase 5 Ta.35725 At4g31120 -5.17 9.50E-03
At5g56840 Ta.46193 At5g56840 -4.60 5.62E-04
At3g12977 Ta.5127 At3g12977 -4.40 1.69E-02
RNA polymerase II transcriptional coactivator KIWI Ta.9409 At5g09250 -4.15 8.81E-03
At3g11220 Ta.58427 At3g11220 -4.13 1.07E-02
At4g25340 Ta.9572 At4g25340 -4.13 3.53E-02
tel-0
0804
633,
ver
sion
1 -
26 M
ar 2
013
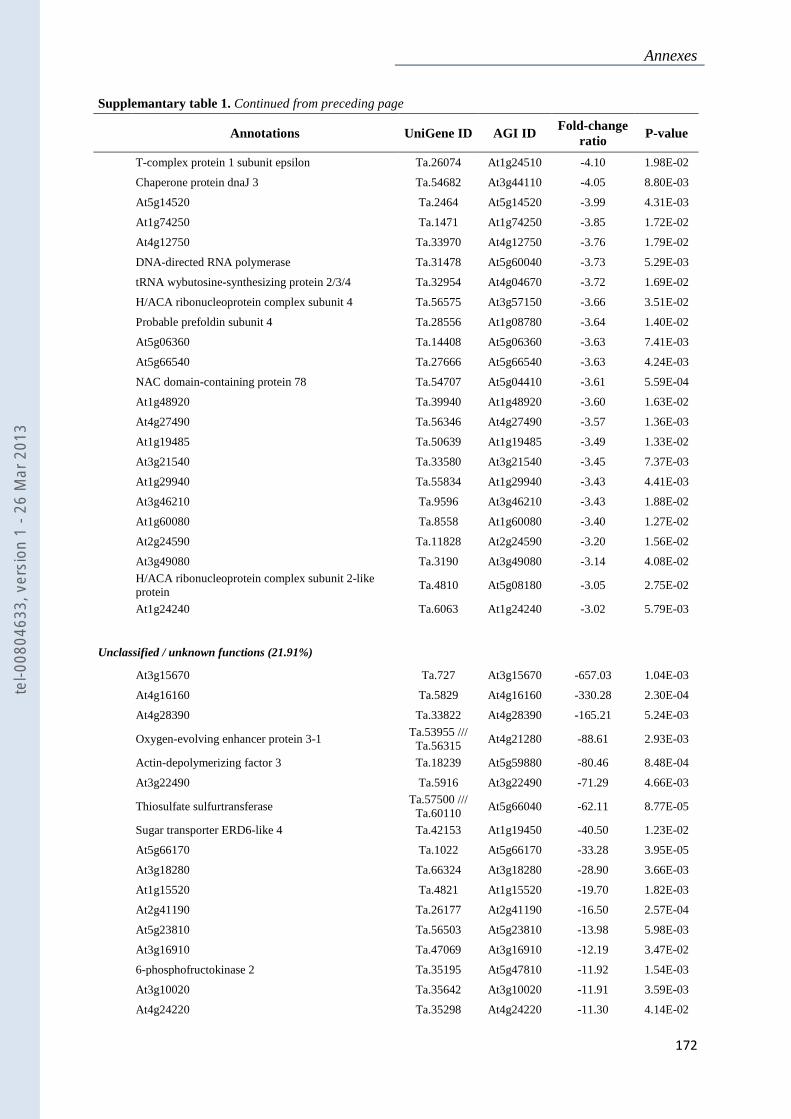
Annexes
172
Supplemantary table 1. Continued from preceding page
Annotations UniGene ID AGI ID Fold-change
ratio P-value
T-complex protein 1 subunit epsilon Ta.26074 At1g24510 -4.10 1.98E-02
Chaperone protein dnaJ 3 Ta.54682 At3g44110 -4.05 8.80E-03
At5g14520 Ta.2464 At5g14520 -3.99 4.31E-03
At1g74250 Ta.1471 At1g74250 -3.85 1.72E-02
At4g12750 Ta.33970 At4g12750 -3.76 1.79E-02
DNA-directed RNA polymerase Ta.31478 At5g60040 -3.73 5.29E-03
tRNA wybutosine-synthesizing protein 2/3/4 Ta.32954 At4g04670 -3.72 1.69E-02
H/ACA ribonucleoprotein complex subunit 4 Ta.56575 At3g57150 -3.66 3.51E-02
Probable prefoldin subunit 4 Ta.28556 At1g08780 -3.64 1.40E-02
At5g06360 Ta.14408 At5g06360 -3.63 7.41E-03
At5g66540 Ta.27666 At5g66540 -3.63 4.24E-03
NAC domain-containing protein 78 Ta.54707 At5g04410 -3.61 5.59E-04
At1g48920 Ta.39940 At1g48920 -3.60 1.63E-02
At4g27490 Ta.56346 At4g27490 -3.57 1.36E-03
At1g19485 Ta.50639 At1g19485 -3.49 1.33E-02
At3g21540 Ta.33580 At3g21540 -3.45 7.37E-03
At1g29940 Ta.55834 At1g29940 -3.43 4.41E-03
At3g46210 Ta.9596 At3g46210 -3.43 1.88E-02
At1g60080 Ta.8558 At1g60080 -3.40 1.27E-02
At2g24590 Ta.11828 At2g24590 -3.20 1.56E-02
At3g49080 Ta.3190 At3g49080 -3.14 4.08E-02
H/ACA ribonucleoprotein complex subunit 2-like protein
Ta.4810 At5g08180 -3.05 2.75E-02
At1g24240 Ta.6063 At1g24240 -3.02 5.79E-03
Unclassified / unknown functions (21.91%)
At3g15670 Ta.727 At3g15670 -657.03 1.04E-03
At4g16160 Ta.5829 At4g16160 -330.28 2.30E-04
At4g28390 Ta.33822 At4g28390 -165.21 5.24E-03
Oxygen-evolving enhancer protein 3-1 Ta.53955 /// Ta.56315
At4g21280 -88.61 2.93E-03
Actin-depolymerizing factor 3 Ta.18239 At5g59880 -80.46 8.48E-04
At3g22490 Ta.5916 At3g22490 -71.29 4.66E-03
Thiosulfate sulfurtransferase Ta.57500 /// Ta.60110
At5g66040 -62.11 8.77E-05
Sugar transporter ERD6-like 4 Ta.42153 At1g19450 -40.50 1.23E-02
At5g66170 Ta.1022 At5g66170 -33.28 3.95E-05
At3g18280 Ta.66324 At3g18280 -28.90 3.66E-03
At1g15520 Ta.4821 At1g15520 -19.70 1.82E-03
At2g41190 Ta.26177 At2g41190 -16.50 2.57E-04
At5g23810 Ta.56503 At5g23810 -13.98 5.98E-03
At3g16910 Ta.47069 At3g16910 -12.19 3.47E-02
6-phosphofructokinase 2 Ta.35195 At5g47810 -11.92 1.54E-03
At3g10020 Ta.35642 At3g10020 -11.91 3.59E-03
At4g24220 Ta.35298 At4g24220 -11.30 4.14E-02
tel-0
0804
633,
ver
sion
1 -
26 M
ar 2
013
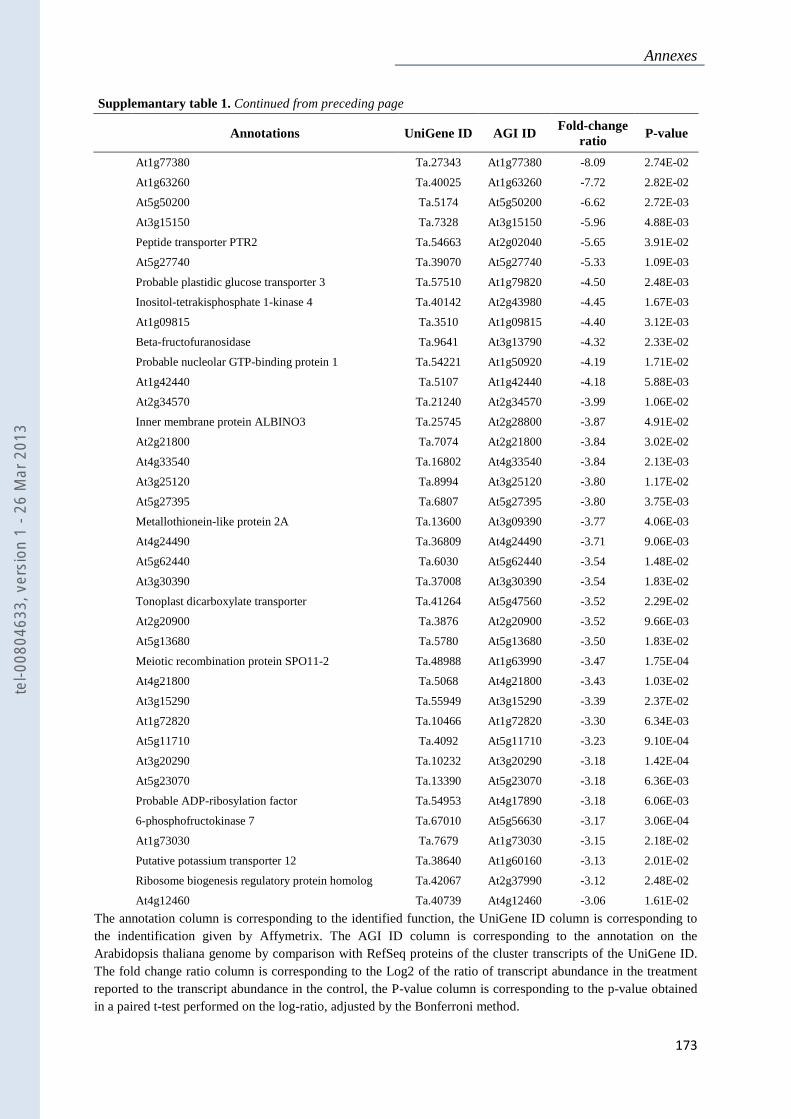
Annexes
173
Supplemantary table 1. Continued from preceding page
Annotations UniGene ID AGI ID Fold-change
ratio P-value
At1g77380 Ta.27343 At1g77380 -8.09 2.74E-02
At1g63260 Ta.40025 At1g63260 -7.72 2.82E-02
At5g50200 Ta.5174 At5g50200 -6.62 2.72E-03
At3g15150 Ta.7328 At3g15150 -5.96 4.88E-03
Peptide transporter PTR2 Ta.54663 At2g02040 -5.65 3.91E-02
At5g27740 Ta.39070 At5g27740 -5.33 1.09E-03
Probable plastidic glucose transporter 3 Ta.57510 At1g79820 -4.50 2.48E-03
Inositol-tetrakisphosphate 1-kinase 4 Ta.40142 At2g43980 -4.45 1.67E-03
At1g09815 Ta.3510 At1g09815 -4.40 3.12E-03
Beta-fructofuranosidase Ta.9641 At3g13790 -4.32 2.33E-02
Probable nucleolar GTP-binding protein 1 Ta.54221 At1g50920 -4.19 1.71E-02
At1g42440 Ta.5107 At1g42440 -4.18 5.88E-03
At2g34570 Ta.21240 At2g34570 -3.99 1.06E-02
Inner membrane protein ALBINO3 Ta.25745 At2g28800 -3.87 4.91E-02
At2g21800 Ta.7074 At2g21800 -3.84 3.02E-02
At4g33540 Ta.16802 At4g33540 -3.84 2.13E-03
At3g25120 Ta.8994 At3g25120 -3.80 1.17E-02
At5g27395 Ta.6807 At5g27395 -3.80 3.75E-03
Metallothionein-like protein 2A Ta.13600 At3g09390 -3.77 4.06E-03
At4g24490 Ta.36809 At4g24490 -3.71 9.06E-03
At5g62440 Ta.6030 At5g62440 -3.54 1.48E-02
At3g30390 Ta.37008 At3g30390 -3.54 1.83E-02
Tonoplast dicarboxylate transporter Ta.41264 At5g47560 -3.52 2.29E-02
At2g20900 Ta.3876 At2g20900 -3.52 9.66E-03
At5g13680 Ta.5780 At5g13680 -3.50 1.83E-02
Meiotic recombination protein SPO11-2 Ta.48988 At1g63990 -3.47 1.75E-04
At4g21800 Ta.5068 At4g21800 -3.43 1.03E-02
At3g15290 Ta.55949 At3g15290 -3.39 2.37E-02
At1g72820 Ta.10466 At1g72820 -3.30 6.34E-03
At5g11710 Ta.4092 At5g11710 -3.23 9.10E-04
At3g20290 Ta.10232 At3g20290 -3.18 1.42E-04
At5g23070 Ta.13390 At5g23070 -3.18 6.36E-03
Probable ADP-ribosylation factor Ta.54953 At4g17890 -3.18 6.06E-03
6-phosphofructokinase 7 Ta.67010 At5g56630 -3.17 3.06E-04
At1g73030 Ta.7679 At1g73030 -3.15 2.18E-02
Putative potassium transporter 12 Ta.38640 At1g60160 -3.13 2.01E-02
Ribosome biogenesis regulatory protein homolog Ta.42067 At2g37990 -3.12 2.48E-02
At4g12460 Ta.40739 At4g12460 -3.06 1.61E-02
The annotation column is corresponding to the identified function, the UniGene ID column is corresponding to the indentification given by Affymetrix. The AGI ID column is corresponding to the annotation on the Arabidopsis thaliana genome by comparison with RefSeq proteins of the cluster transcripts of the UniGene ID. The fold change ratio column is corresponding to the Log2 of the ratio of transcript abundance in the treatment reported to the transcript abundance in the control, the P-value column is corresponding to the p-value obtained in a paired t-test performed on the log-ratio, adjusted by the Bonferroni method.
tel-0
0804
633,
ver
sion
1 -
26 M
ar 2
013
Annexes
174
Annexe 2 : Article publié dans Functional Plant Biology :
Combined effects of contrast between poor and rich patches and overall nitrate concentration on Arabidopsis thaliana root system structure
tel-0
0804
633,
ver
sion
1 -
26 M
ar 2
013
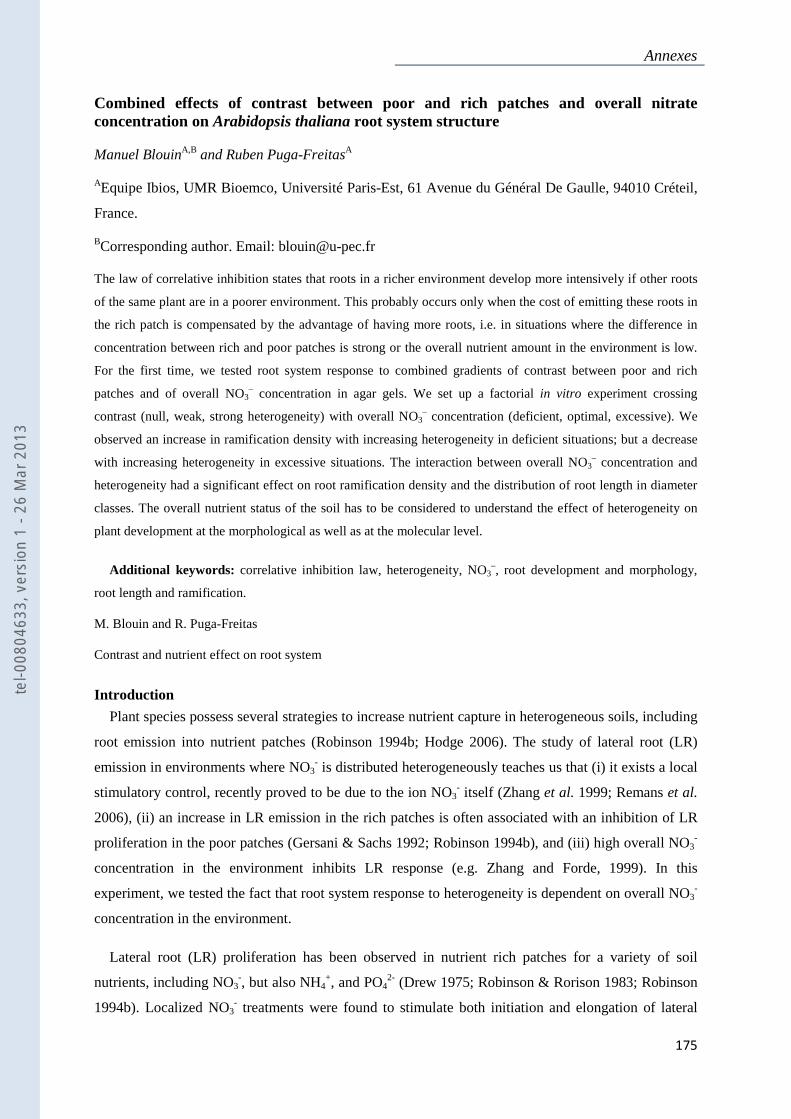
Annexes
175
Combined effects of contrast between poor and rich patches and overall nitrate concentration on Arabidopsis thaliana root system structure
Manuel BlouinA,B and Ruben Puga-FreitasA
AEquipe Ibios, UMR Bioemco, Université Paris-Est, 61 Avenue du Général De Gaulle, 94010 Créteil,
France.
BCorresponding author. Email: [email protected]
The law of correlative inhibition states that roots in a richer environment develop more intensively if other roots
of the same plant are in a poorer environment. This probably occurs only when the cost of emitting these roots in
the rich patch is compensated by the advantage of having more roots, i.e. in situations where the difference in
concentration between rich and poor patches is strong or the overall nutrient amount in the environment is low.
For the first time, we tested root system response to combined gradients of contrast between poor and rich
patches and of overall NO3– concentration in agar gels. We set up a factorial in vitro experiment crossing
contrast (null, weak, strong heterogeneity) with overall NO3– concentration (deficient, optimal, excessive). We
observed an increase in ramification density with increasing heterogeneity in deficient situations; but a decrease
with increasing heterogeneity in excessive situations. The interaction between overall NO3– concentration and
heterogeneity had a significant effect on root ramification density and the distribution of root length in diameter
classes. The overall nutrient status of the soil has to be considered to understand the effect of heterogeneity on
plant development at the morphological as well as at the molecular level.
Additional keywords: correlative inhibition law, heterogeneity, NO3–, root development and morphology,
root length and ramification.
M. Blouin and R. Puga-Freitas
Contrast and nutrient effect on root system
Introduction
Plant species possess several strategies to increase nutrient capture in heterogeneous soils, including
root emission into nutrient patches (Robinson 1994b; Hodge 2006). The study of lateral root (LR)
emission in environments where NO3- is distributed heterogeneously teaches us that (i) it exists a local
stimulatory control, recently proved to be due to the ion NO3- itself (Zhang et al. 1999; Remans et al.
2006), (ii) an increase in LR emission in the rich patches is often associated with an inhibition of LR
proliferation in the poor patches (Gersani & Sachs 1992; Robinson 1994b), and (iii) high overall NO3-
concentration in the environment inhibits LR response (e.g. Zhang and Forde, 1999). In this
experiment, we tested the fact that root system response to heterogeneity is dependent on overall NO3-
concentration in the environment.
Lateral root (LR) proliferation has been observed in nutrient rich patches for a variety of soil
nutrients, including NO3-, but also NH4
+, and PO42- (Drew 1975; Robinson & Rorison 1983; Robinson
1994b). Localized NO3- treatments were found to stimulate both initiation and elongation of lateral
tel-0
0804
633,
ver
sion
1 -
26 M
ar 2
013
Annexes
176
roots (Hackett 1972; Drew & Goss 1973; Granato & Raper 1989). The study of Gersani & Sachs
(1992) brought new insight concerning LR emission: the local development of LR is not dependent on
the absolute nutrient concentration in the patch, but more on the relative concentration of nutrient in
the rich patch with regard to the poor one. They proposed the law of correlative inhibition: roots in a
given environment develop more intensively if the other roots of the same plant are in a poorer than in
richer environment.
In his Tansley Review on the responses of plants to non-uniform supplies of nutrient, Robinson
(1994) tested this correlative inhibition law on a data set of more than 100 results. He found that the
correlative inhibition law was explaining less than half of the results, probably due to the fact that
other factors than nutrient distribution controlled LR emission (Robinson 1994b).
Kotliar et al. (1990) have proposed an additional principle to the law of correlative inhibition for
explaining root system response to patchy environments. It states that the difference between nutrient
concentration in poor (or background soil) and rich patches, also called the degree of contrast (Kotliar
& Weins 1990; Lamb et al. 2004) or degree of heterogeneity in our study, should be strong enough to
lead to a benefit that overcomes the cost of emitting lateral roots in the patch (Kotliar & Weins 1990).
However, an experiment dedicated to test this hypothesis showed that plants did not respond to the
differences in contrast between nutrient in the rich patch and the surrounding background (Lamb et al.
2004). These authors concluded that “there is some threshold value necessary to trigger an increased
response (possibly a combination of factors such as patch value and overall nutrient status) that was
not reached”. This was supported by the fact that high NO3- amount inhibit the LR response (e.g.
Zhang and Forde, 1999), which suggests the existence of a systemic inhibitory control of LR
development due to plant internal N status, itself positively correlated with NO3- availability in the
environment. However, as it is known that high nitrate concentration can have a local stimulatory
effect in heterogeneous environment (e.g. Zhang and Forde, 1999), it is surprising that the stimulation
of growth throughout the root system, unrelated to any locally available nutrients, has received so few
comments (Robinson 1994b). Because of the view that plants rarely encounter soil nutrient
concentrations leading to toxicity, only low nutrient availability conditions have been studied.
Considering a wide range of overall nutrient concentrations is even necessary to develop a general
theory for plant response to variations in resource availability in the environment. A synthetic
conceptual model has been proposed by de Kroon et al. (2009): plant foraging for resources in
heterogeneous environments must involve (1) plasticity at the level of individual modules in reaction
to localized environmental signals and the potential for modification of these responses either, (2)
signals received from connected modules that may be exposed to different conditions (law of
correlative inhibition), or (3) signals reflecting the overall resource status of the plant, explaining the
negative feedbacks in excess nutrient conditions. Straightforward predictions from this conceptual
model are that a local response to resource abundance will be enhanced when many other integrated
tel-0
0804
633,
ver
sion
1 -
26 M
ar 2
013
Annexes
177
modules are growing under conditions of resource shortage, and that the whole plant itself experiences
a nutrient shortage, and that this will result in elevated resource uptake at a local scale (de Kroon et al.
2009). Conversely, the local response will be reduced when foraging efforts are unlikely to improve an
already favourable plant resource status (Lamb et al. 2004). We propose as an additional prediction
that LR emission could even decrease when NO3- is in excess and becomes toxic, as a way to reduce
root system surface area and the exposure of cells to the toxic ion.
In an in vitro experiment with a 3x3 factorial design, we study LR emission of Arabidopsis thaliana
along a gradient of NO3- distribution heterogeneity (null, weak or strong heterogeneity) crossed with
an overall gradient of NO3- amounts in the environment (deficit, optimal or excess) to determine if LR
density and root length were affected by (i) the level of heterogeneity of NO3- distribution, (ii) the
overall N amount in the soil, and (iii) the interaction between heterogeneity and the overall N amount
in the soil.
Materials and Methods
Microcosms
Our experimental design was set up to study the effect of the global N concentration in the
environment and the heterogeneity of its distribution. We applied localised NO3- treatments to
Arabidopsis thaliana with the segmented agar plate set-up accordingly to Zhang and Forde (1998),
except that we used square transparent boxes instead of circular Petri dishes, what permits to have
equal gel volume in the top, middle and down patches and makes the vertical positioning easier. Gels
were made of a 9 g l-1 gelrite, which represents a relatively high gel strength close to what plants can
experiment in soils, with a classical Murashige and Skoog medium (Murashige & Skoog 1962) with
micronutrients and vitamins at standard concentrations. Macronutrient concentrations were kept
standard for CaCl2 = 2.99 mM, KH2PO4 = 1.25 mM and MgSO4 = 1.50 mM. NO3- was brought at a
basal level as NH4NO3 = 10µM (instead of 20.61mM in MS medium). The KNO3 concentration was
adapted according to the treatment, and the K concentration was kept constant by adding KCl, which
has no effect on root system structure (Zhang et al. 1999). Gels with different KNO3 concentrations
were prepared, cut in bands (width: 10 cm, height: 2 cm, thickness: 1 cm, i.e. 20 ml per band) and
placed in new boxes with a small plastic grid with a 1 mm mesh size between two bands to avoid
direct contact and KNO3 diffusion. The overall NO3- concentration (or amount, since volume was
constant) in the whole culture medium (called Next hereafter) presented three levels (Fig. 1): (A) the
deficit treatment with 0.5 mM of NO3- in 60 ml, i.e. 3.10-5 moles, (B) the optimal treatment with 5 mM
in 60 ml, i.e. 3.10-4 moles and (C) the excess treatment with 50 mM in 60 ml, i.e. 3.10-3 moles.
Heterogeneity corresponded to the difference in concentration/amount of NO3- between the poor bands
(a and c) and the rich band (b). This factor presented also three levels (Fig. 1): (0) the null
heterogeneity corresponded to a situation where the a, b and c bands had a identical NO3- amount
tel-0
0804
633,
ver
sion
1 -
26 M
ar 2
013
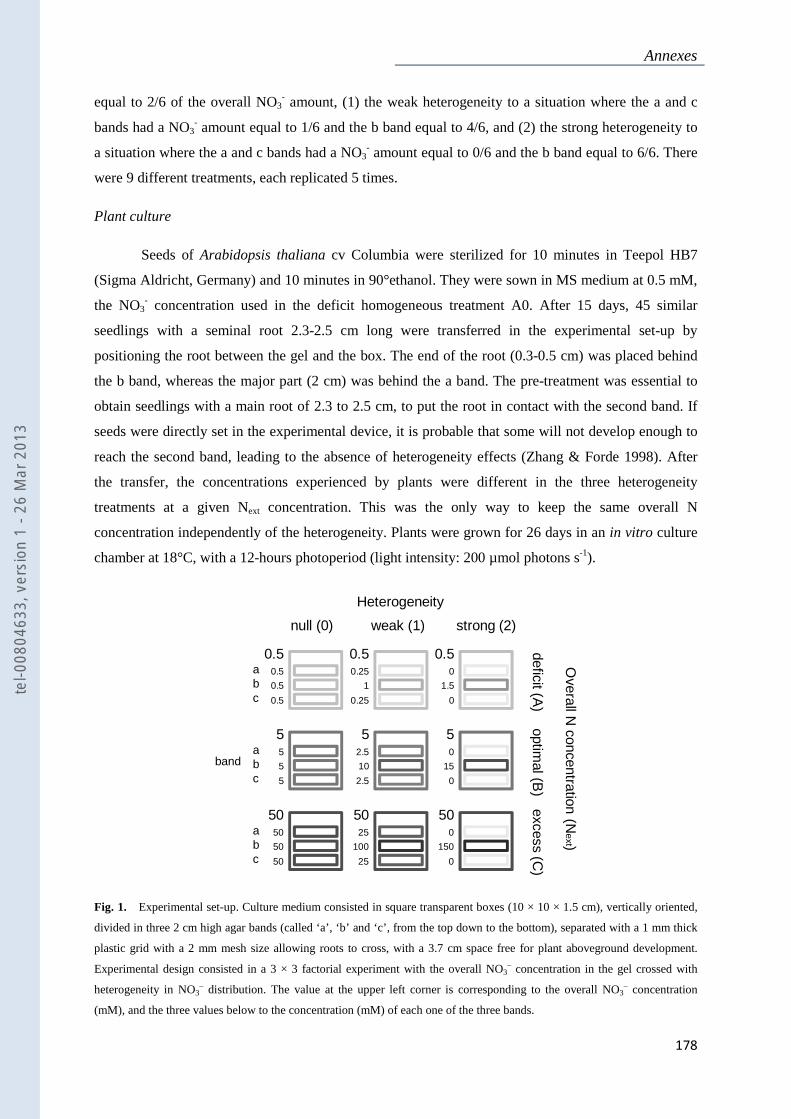
Annexes
178
equal to 2/6 of the overall NO3- amount, (1) the weak heterogeneity to a situation where the a and c
bands had a NO3- amount equal to 1/6 and the b band equal to 4/6, and (2) the strong heterogeneity to
a situation where the a and c bands had a NO3- amount equal to 0/6 and the b band equal to 6/6. There
were 9 different treatments, each replicated 5 times.
Plant culture
Seeds of Arabidopsis thaliana cv Columbia were sterilized for 10 minutes in Teepol HB7
(Sigma Aldricht, Germany) and 10 minutes in 90°ethanol. They were sown in MS medium at 0.5 mM,
the NO3- concentration used in the deficit homogeneous treatment A0. After 15 days, 45 similar
seedlings with a seminal root 2.3-2.5 cm long were transferred in the experimental set-up by
positioning the root between the gel and the box. The end of the root (0.3-0.5 cm) was placed behind
the b band, whereas the major part (2 cm) was behind the a band. The pre-treatment was essential to
obtain seedlings with a main root of 2.3 to 2.5 cm, to put the root in contact with the second band. If
seeds were directly set in the experimental device, it is probable that some will not develop enough to
reach the second band, leading to the absence of heterogeneity effects (Zhang & Forde 1998). After
the transfer, the concentrations experienced by plants were different in the three heterogeneity
treatments at a given Next concentration. This was the only way to keep the same overall N
concentration independently of the heterogeneity. Plants were grown for 26 days in an in vitro culture
chamber at 18°C, with a 12-hours photoperiod (light intensity: 200 µmol photons s-1).
Fig. 1. Experimental set-up. Culture medium consisted in square transparent boxes (10 × 10 × 1.5 cm), vertically oriented,
divided in three 2 cm high agar bands (called ‘a’, ‘b’ and ‘c’, from the top down to the bottom), separated with a 1 mm thick
plastic grid with a 2 mm mesh size allowing roots to cross, with a 3.7 cm space free for plant aboveground development.
Experimental design consisted in a 3 × 3 factorial experiment with the overall NO3– concentration in the gel crossed with
heterogeneity in NO3– distribution. The value at the upper left corner is corresponding to the overall NO3
– concentration
(mM), and the three values below to the concentration (mM) of each one of the three bands.
0.50.5
0.5
0.5
55
5
5
5050
50
50
0.50.25
1
0.25
52.5
10
2.5
5025
100
25
0.50
1.5
0
50
15
0
500
150
0
excess (C)
optimal (B
)deficit (A
)
Heterogeneity
null (0) weak (1) strong (2)
Overall N
concentration (Next)
abc
abc
abc
band
tel-0
0804
633,
ver
sion
1 -
26 M
ar 2
013
Annexes
179
Root system analysis
Each root system was analysed with a digital scanner (EPSON Expression 10000 XL, Epson
America Inc., USA) coupled with the WinRHIZO software (WinRHIZO, version 2007 pro, Regent
Instrument, Quebec, Canada). As advised by sensitivity analyses of this material and software (Bouma
et al. 2000; Himmelbauer et al. 2004), we used a double light system, at a resolution of 16 p mm–1
(400 dpi), with the automatic transformation threshold option which optimizes the distinction of pixels
considered as root or background according to their relative contrast. Eleven equal diameter classes
were defined: from 0-100 to 800-900 and >900 µm. After root system analysis, both above and below-
ground organs were dried for 2 days at 45°C and weighted.
Numerous variables characterising root systems can be obtained with image analysis. We were
specifically interested with the emission of lateral roots. The number of lateral roots in each band can
be considered a good indicia of the emission of lateral roots. But because the number of ramifications
is correlated with root system size, it was reported to the root biomass for each band to obtain the
ramification number per unit biomass, hereafter called “ramification density”. This variable was more
relevant to our research question than the ramification number per unit length; in fact, we investigated
a wide range of nitrogen concentrations, which could have an impact on the tissue density. This
change in tissue density was not taken into account in the ramification number per unit length, but in
the ramification number per unit biomass. We were also interested in the length of lateral roots, which
could respond differently than the emission of lateral roots to the different experimental factors. We
thus analysed the length per diameter classes.
Results
Plant biomasses
Belowground, aboveground and total dry biomasses were significantly affected by the overall
N concentration in the culture medium (Next) but not by heterogeneity, neither by the interaction
between Next and heterogeneity (Table 1). Shoot:root ratio was affected by Next, and less significantly
by heterogeneity (Table 1). Total, below and aboveground biomasses were slightly increased at the
“optimal” Next as compared with the “deficit” Next, but the difference was not significant (Fig. 2).
However, root biomass was significantly decreased in “excess” Next as compared with “optimal” and
“deficit” N ext. A significant increase in the shoot:root ratio was detected from the deficit to the excess
Next treatment.
tel-0
0804
633,
ver
sion
1 -
26 M
ar 2
013
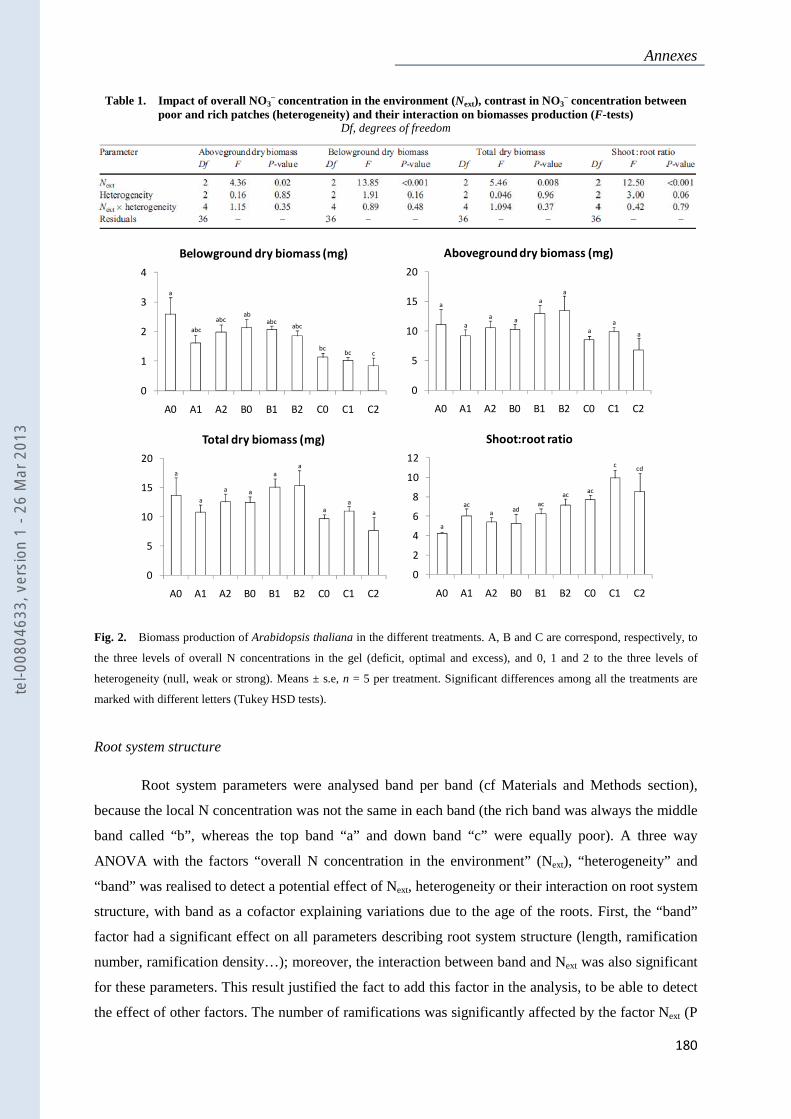
Annexes
180
Table 1. Impact of overall NO3– concentration in the environment (Next), contrast in NO3
– concentration between poor and rich patches (heterogeneity) and their interaction on biomasses production (F-tests)
Df, degrees of freedom
Fig. 2. Biomass production of Arabidopsis thaliana in the different treatments. A, B and C are correspond, respectively, to
the three levels of overall N concentrations in the gel (deficit, optimal and excess), and 0, 1 and 2 to the three levels of
heterogeneity (null, weak or strong). Means ± s.e, n = 5 per treatment. Significant differences among all the treatments are
marked with different letters (Tukey HSD tests).
Root system structure
Root system parameters were analysed band per band (cf Materials and Methods section),
because the local N concentration was not the same in each band (the rich band was always the middle
band called “b”, whereas the top band “a” and down band “c” were equally poor). A three way
ANOVA with the factors “overall N concentration in the environment” (Next), “heterogeneity” and
“band” was realised to detect a potential effect of Next, heterogeneity or their interaction on root system
structure, with band as a cofactor explaining variations due to the age of the roots. First, the “band”
factor had a significant effect on all parameters describing root system structure (length, ramification
number, ramification density…); moreover, the interaction between band and Next was also significant
for these parameters. This result justified the fact to add this factor in the analysis, to be able to detect
the effect of other factors. The number of ramifications was significantly affected by the factor Next (P
a
ac
aad
ac
acac
ccd
0
2
4
6
8
10
12
A0 A1 A2 B0 B1 B2 C0 C1 C2
Shoot:root ratio
a
abc
abcab
abcabc
bcbc c
0
1
2
3
4
A0 A1 A2 B0 B1 B2 C0 C1 C2
Belowground dry biomass (mg)
a
a
aa
a
a
a
a
a
0
5
10
15
20
A0 A1 A2 B0 B1 B2 C0 C1 C2
Aboveground dry biomass (mg)
a
a
a a
a
a
aa
a
0
5
10
15
20
A0 A1 A2 B0 B1 B2 C0 C1 C2
Total dry biomass (mg)
tel-0
0804
633,
ver
sion
1 -
26 M
ar 2
013
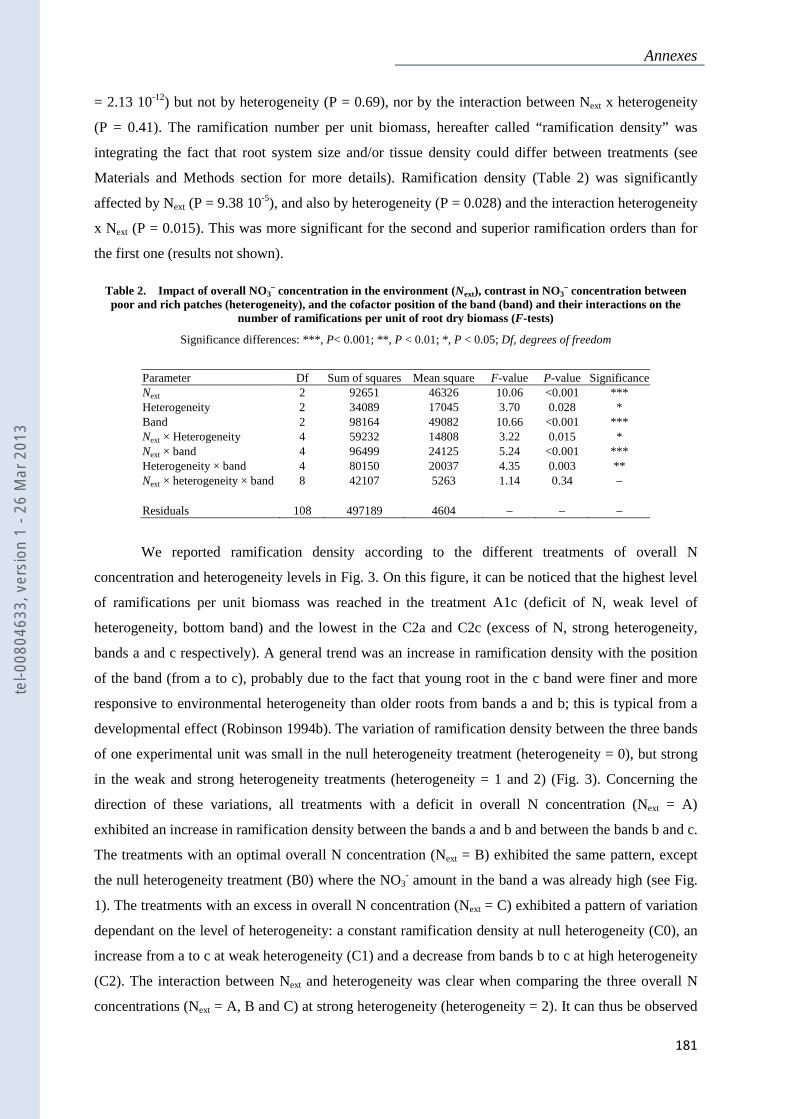
Annexes
181
= 2.13 10-12) but not by heterogeneity (P = 0.69), nor by the interaction between Next x heterogeneity
(P = 0.41). The ramification number per unit biomass, hereafter called “ramification density” was
integrating the fact that root system size and/or tissue density could differ between treatments (see
Materials and Methods section for more details). Ramification density (Table 2) was significantly
affected by Next (P = 9.38 10-5), and also by heterogeneity (P = 0.028) and the interaction heterogeneity
x Next (P = 0.015). This was more significant for the second and superior ramification orders than for
the first one (results not shown).
Table 2. Impact of overall NO3– concentration in the environment (Next), contrast in NO3
– concentration between poor and rich patches (heterogeneity), and the cofactor position of the band (band) and their interactions on the
number of ramifications per unit of root dry biomass (F-tests)
Significance differences: ***, P< 0.001; **, P < 0.01; *, P < 0.05; Df, degrees of freedom
Parameter Df Sum of squares Mean square F-value P-value Significance Next 2 92651 46326 10.06 <0.001 *** Heterogeneity 2 34089 17045 3.70 0.028 * Band 2 98164 49082 10.66 <0.001 *** Next × Heterogeneity 4 59232 14808 3.22 0.015 * Next × band 4 96499 24125 5.24 <0.001 *** Heterogeneity × band 4 80150 20037 4.35 0.003 ** Next × heterogeneity × band 8 42107 5263 1.14 0.34 –
Residuals 108 497189 4604 – – –
We reported ramification density according to the different treatments of overall N
concentration and heterogeneity levels in Fig. 3. On this figure, it can be noticed that the highest level
of ramifications per unit biomass was reached in the treatment A1c (deficit of N, weak level of
heterogeneity, bottom band) and the lowest in the C2a and C2c (excess of N, strong heterogeneity,
bands a and c respectively). A general trend was an increase in ramification density with the position
of the band (from a to c), probably due to the fact that young root in the c band were finer and more
responsive to environmental heterogeneity than older roots from bands a and b; this is typical from a
developmental effect (Robinson 1994b). The variation of ramification density between the three bands
of one experimental unit was small in the null heterogeneity treatment (heterogeneity = 0), but strong
in the weak and strong heterogeneity treatments (heterogeneity = 1 and 2) (Fig. 3). Concerning the
direction of these variations, all treatments with a deficit in overall N concentration (Next = A)
exhibited an increase in ramification density between the bands a and b and between the bands b and c.
The treatments with an optimal overall N concentration (Next = B) exhibited the same pattern, except
the null heterogeneity treatment (B0) where the NO3- amount in the band a was already high (see Fig.
1). The treatments with an excess in overall N concentration (Next = C) exhibited a pattern of variation
dependant on the level of heterogeneity: a constant ramification density at null heterogeneity (C0), an
increase from a to c at weak heterogeneity (C1) and a decrease from bands b to c at high heterogeneity
(C2). The interaction between Next and heterogeneity was clear when comparing the three overall N
concentrations (Next = A, B and C) at strong heterogeneity (heterogeneity = 2). It can thus be observed
tel-0
0804
633,
ver
sion
1 -
26 M
ar 2
013
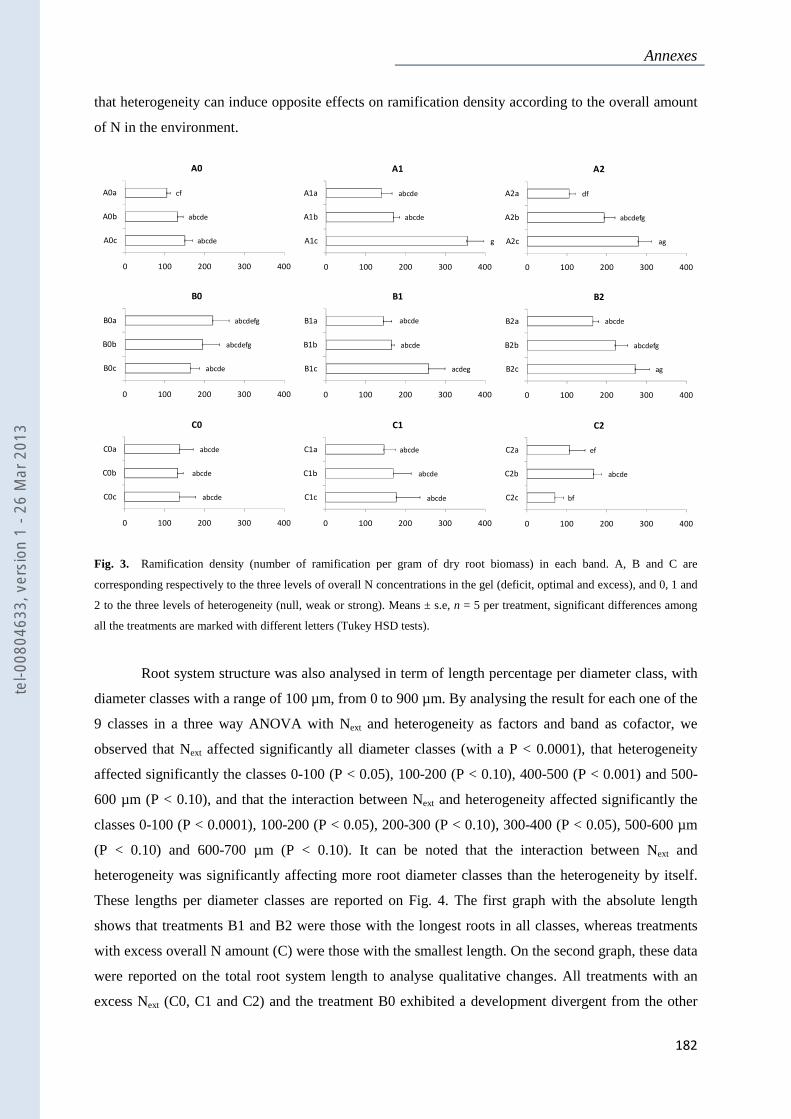
Annexes
182
that heterogeneity can induce opposite effects on ramification density according to the overall amount
of N in the environment.
Fig. 3. Ramification density (number of ramification per gram of dry root biomass) in each band. A, B and C are
corresponding respectively to the three levels of overall N concentrations in the gel (deficit, optimal and excess), and 0, 1 and
2 to the three levels of heterogeneity (null, weak or strong). Means ± s.e, n = 5 per treatment, significant differences among
all the treatments are marked with different letters (Tukey HSD tests).
Root system structure was also analysed in term of length percentage per diameter class, with
diameter classes with a range of 100 µm, from 0 to 900 µm. By analysing the result for each one of the
9 classes in a three way ANOVA with Next and heterogeneity as factors and band as cofactor, we
observed that Next affected significantly all diameter classes (with a P < 0.0001), that heterogeneity
affected significantly the classes 0-100 (P < 0.05), 100-200 (P < 0.10), 400-500 (P < 0.001) and 500-
600 µm (P < 0.10), and that the interaction between Next and heterogeneity affected significantly the
classes 0-100 (P < 0.0001), 100-200 (P < 0.05), 200-300 (P < 0.10), 300-400 (P < 0.05), 500-600 µm
(P < 0.10) and 600-700 µm (P < 0.10). It can be noted that the interaction between Next and
heterogeneity was significantly affecting more root diameter classes than the heterogeneity by itself.
These lengths per diameter classes are reported on Fig. 4. The first graph with the absolute length
shows that treatments B1 and B2 were those with the longest roots in all classes, whereas treatments
with excess overall N amount (C) were those with the smallest length. On the second graph, these data
were reported on the total root system length to analyse qualitative changes. All treatments with an
excess Next (C0, C1 and C2) and the treatment B0 exhibited a development divergent from the other
abcde
abcde
cf
0 100 200 300 400
A0c
A0b
A0a
A0
g
abcde
abcde
0 100 200 300 400
A1c
A1b
A1a
A1
ag
abcdefg
df
0 100 200 300 400
A2c
A2b
A2a
A2
abcde
abcdefg
abcdefg
0 100 200 300 400
B0c
B0b
B0a
B0
acdeg
abcde
abcde
0 100 200 300 400
B1c
B1b
B1a
B1
ag
abcdefg
abcde
0 100 200 300 400
B2c
B2b
B2a
B2
abcde
abcde
abcde
0 100 200 300 400
C0c
C0b
C0a
C0
abcde
abcde
abcde
0 100 200 300 400
C1c
C1b
C1a
C1
bf
abcde
ef
0 100 200 300 400
C2c
C2b
C2a
C2
tel-0
0804
633,
ver
sion
1 -
26 M
ar 2
013
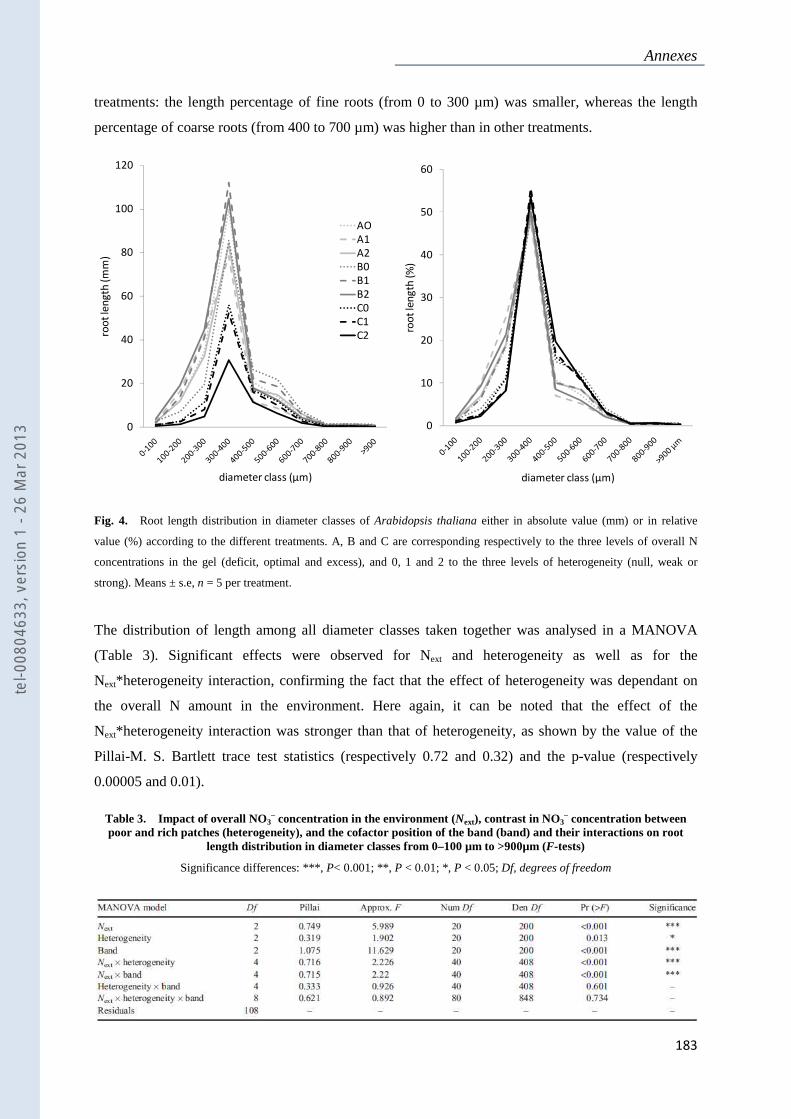
Annexes
183
treatments: the length percentage of fine roots (from 0 to 300 µm) was smaller, whereas the length
percentage of coarse roots (from 400 to 700 µm) was higher than in other treatments.
Fig. 4. Root length distribution in diameter classes of Arabidopsis thaliana either in absolute value (mm) or in relative
value (%) according to the different treatments. A, B and C are corresponding respectively to the three levels of overall N
concentrations in the gel (deficit, optimal and excess), and 0, 1 and 2 to the three levels of heterogeneity (null, weak or
strong). Means ± s.e, n = 5 per treatment.
The distribution of length among all diameter classes taken together was analysed in a MANOVA
(Table 3). Significant effects were observed for Next and heterogeneity as well as for the
Next*heterogeneity interaction, confirming the fact that the effect of heterogeneity was dependant on
the overall N amount in the environment. Here again, it can be noted that the effect of the
Next*heterogeneity interaction was stronger than that of heterogeneity, as shown by the value of the
Pillai-M. S. Bartlett trace test statistics (respectively 0.72 and 0.32) and the p-value (respectively
0.00005 and 0.01).
Table 3. Impact of overall NO3– concentration in the environment (Next), contrast in NO3
– concentration between poor and rich patches (heterogeneity), and the cofactor position of the band (band) and their interactions on root
length distribution in diameter classes from 0–100 µm to >900µm (F-tests)
Significance differences: ***, P< 0.001; **, P < 0.01; *, P < 0.05; Df, degrees of freedom
0
10
20
30
40
50
60
roo
t le
ng
th (
%)
diameter class (µm)
0
20
40
60
80
100
120
roo
t le
ng
th (
mm
)
diameter class (µm)
AO
A1
A2
B0
B1
B2
C0
C1
C2
tel-0
0804
633,
ver
sion
1 -
26 M
ar 2
013
Annexes
184
Discussion
This study was dedicated to investigate root system structure along a gradient of overall NO3-
concentrations crossed with a gradient of NO3- heterogeneity distribution. The dicotyledon species A.
thaliana has a root system developing from one main root, the radicle. A split root system with two
equivalent root system parts grown in vertical agar bands was thus not appropriate. Consequently, agar
bands were oriented horizontally (Zhang & Forde 1998) and plant roots were reaching the different
horizontal bands at different ages and development stages. As a result, one major effect observed in
our experiment was a “band” effect (Tables 2 and 3), strongly correlated with root age. As in several
previous studies, we observed a lateral root response not strictly localised in the rich patch. This “time-
dependant responses” have been reviewed by Robinson (1994); for example, when NO3- is applied to a
discrete location in soil with wheat plants that had already begun ear development, roots did
proliferate, but throughout the root system, not just around the point of NO3- application (Robinson
1994a). Younger plants did respond as one might expect (Robinson 1991). This effect of age made the
results more complex (Fig. 2 and 3), but it can be considered as a covariable in ANOVA to estimate
the significance of factors such as Next, heterogeneity and Next*heterogeneity which is discussed
below.
Overall N concentration affected significantly root system structure in our experiment (Tables
1, 2 and 3). It was difficult to observe a general trend in a 3x3 factorial design; this was probably due
to the age effect discussed above and to the pre-treatment at 0.5 mM for the germination of all seeds,
before their removal in the experimental units with different nitrogen concentrations. However, it can
be perceived that the number of ramifications per root biomass unit was constant from deficient to
optimal Next, whereas it was decreasing from optimal to excessive Next (Fig. 3). Root length was
increasing from deficient to optimal Next and then decreasing from optimal to excessive Next (Fig. 4).
This is in accordance with the fact that in high nutrient concentration situations, the general trend is a
decrease in root length and number of ramification at excessive nutrient supply. The most common
response to an increase in nitrate and ammonium concentration in the environment is a decrease in
root:shoot ratio (Boxman et al. 1991; Wang & Below 1996; Bauer & Berntson 1999) and a decrease in
fine:coarse root ratio (Haynes & Goh 1978; Boxman et al. 1991; Britto & Kronzucker 2006), as
observed here.
The degree of heterogeneity in nutrient distribution, also called the degree of contrast or the
difference in nutrient availability between the patch and the background soil (Kotliar & Weins 1990;
Lamb et al. 2004), has received little research attention. Models examining nutrient uptake from
heterogeneous soils predict an increase in the root proliferation and in the biomass of adapting plants
when contrast increases (Jackson & Taylor 1996; Fransen et al. 1999). To our knowledge,
experimental testing of this theory is limited to the studies by Wijesinghe and Hutchings (1994) and
tel-0
0804
633,
ver
sion
1 -
26 M
ar 2
013
Annexes
185
Lamb et al. (2004). In an experiment with the plant Abutilon theophrasti Medic., neither root and
shoot biomasses nor root proliferation was affected by patch/background contrast (Lamb et al. 2004).
Authors interpreted this as a potential consequence of “some threshold value necessary to trigger an
increased response (possibly a combination of factors such as patch value and overall nutrient status)
that was not reached”. They concluded that “Validation of this model will require similar experiments
using a much wider range of contrasts and total nutrient availability” (Lamb et al. 2004). In the other
experiment, the clonal herb Glechoma hederacea, a species that benefits strongly from heterogeneous
soil (Birch & Hutchings 1994), increasingly concentrates root biomass in rich patches as contrast
increases, while total shoot biomass is similar between contrast treatments (Wijesinghe & Hutchings
1999). In the same way, in our experiment, we observed a significant effect of heterogeneity on
ramification density and root length per diameter classes (Tables 2 and 3). This effect of heterogeneity
was associated with an increase in total biomass only in the optimal overall N concentration (Fig. 1). It
is likely that in the study of Lamb et al. (2004) the contrast was not strong enough, or that the effect of
overall N concentration was compensating the effect of contrast. In the study of Wijesinghe and
Hutchings (1999), the contrast was strong enough to observe changes in root proliferation, but the
overall N concentration was probably not appropriate to observe a change in plant biomass.
Finally, the most important result of our study was that root system response to heterogeneity
depended on the overall NO3- concentration in the environment, as shown by the significant effect of
the Next*heterogeneity interaction on ramification density and root length (Tables 2 and 3, Fig. 3 and
4). The effect of the Next*heterogeneity interaction was even more significant than the effect of
heterogeneity itself (Tables 2 and 3). Heterogeneity had a positive effect on ramification density when
the overall NO3- amount in the environment was limiting or optimal, but a negative effect when NO3
-
was in excess. This can be interpreted as a way to maximize the root surface area when a nutrient is
limiting, and to minimize it when it becomes toxic.
The significant interaction between overall NO3- concentration in the environment and the
degree of heterogeneity could explain why so few studies reviewed by Robinson (1994) seem to
follow the law of correlative inhibition. If authors were systematically mentioning the overall nutrient
amount in the environment in addition to the contrast between poor and rich patches, it should be
easier to overcome the apparent contradiction between experiments.
Acknowledgements
We thank Danielle Benest for technical and the “Ingénierie Ecologique” program of the CNRS
“Institut Ecologie et Environnement” for funding this study.
tel-0
0804
633,
ver
sion
1 -
26 M
ar 2
013
Annexes
186
References
Bauer GA, Berntson GM (1999) Ammonium and nitrate acquisition by plants in response to elevated
CO2 concentration: The roles of root physiology and architecture. Tree Physiology 21, 137-
144.
Birch CPD, Hutchings MJ (1994) Exploitation of patchily distributed soil resources by the clonal herb
Glechoma hederacea. Journal of Ecology 82, 653-664.
Bouma TJ, Nielsen KL, Koutstaal B (2000) Sample preparation and scanning protocol for
computerised analysis of root length and diameter. Plant Soil 218, 185-196.
Boxman AW, Krabbendam H, Bellemakers MJS, Roelofs JGM (1991) Effects of ammonium and
aluminium on the development and nutrition of Pinus nigra in hydroculture. Environmental
Pollution 73, 119-136.
Britto DT, Kronzucker HJ (2006) Futile cycling at the plasma membrane: a hallmark of low-affinity
nutrient transport. Trends in Plant Science 11, 529-534.
de Kroon H, Visser EJW, Huber H, Mommer L, Hutchings MJ (2009) A modular concept of plant
foraging behaviour: the interplay between local responses and systemic control. Plant, Cell
and Environment 32, 704-712.
Drew MC (1975) Comparison of the effects of a localized supply of phosphate, nitrate, ammonium
and potassium on the growth of the seminal root system, and the shoot, in barley. New
Phytologist 75, 479-490.
Drew MC, Goss M (1973) Effect of soil physical factors on root growth. Chemistry and Industry 14,
679-684.
Fransen B, De Kroon H, De Kovel CGF, Van den Bosch F (1999) Disentangling the effects of root
foraging and inherent growth rate on plant biomass accumulation in heterogeneous
environments: A modelling study. Annals of Botany 84, 305-311.
Gersani M, Sachs T (1992) Developmental correlations between roots in heterogeneous environments.
Plant, Cell and Environment 15, 463-469.
Granato TC, Raper CDJ (1989) Proliferation of maize (Zea mays L.) roots in response to localized
supply of nitrate. Journal of Experimental Botany 40, 263-275.
tel-0
0804
633,
ver
sion
1 -
26 M
ar 2
013
Annexes
187
Hackett C (1972) A method of applying nutrients locally to roots under controlled conditions, and
some morphological effects of locally applied nitrate on the branching of wheat roots.
Australian Journal of Biological Sciences 25, 1169-1180.
Haynes RJ, Goh KM (1978) Ammonium and nitrate nutrition of plants. Biological Reviews 53, 465-
510.
Himmelbauer ML, Loiskandl W, Kastanek F (2004) Estimating length, average diameter and surface
area of roots using two different Image analyses systems. Plant Soil 260, 111-120.
Hodge A (2006) Plastic plants and patchy soils. Journal of Experimental Botany 57, 401-411.
Jackson AO, Taylor CB (1996) Plantmicrobe interactions: life and death at the interface. Plant Cell 8,
1651-1668.
Kotliar NB, Weins JA (1990) Multiple scales of patchiness and patch structure: a hierarchical
framework for the study of heterogeneity. Oikos 59, 253–260.
Lamb EG, Haag JJ, Cahill JFJ (2004) Patch-background contrast and patch density have limited
effects on root proliferation and plant performance in Abutilon theophrasti. Functional
Ecology 18, 836-843.
Murashige T, Skoog F (1962) A revised medium for rapid growth and bio-assays with tobacco tissue
cultures. Physiologia Plantarum 15, 473-497.
Remans T, Nacry P, Pervent M, Filleur S, Diatloff E, Mounier E, Tillard P, Forde BG, Gojon A (2006)
The Arabidopsis NRT1.1 transporter participates in the signaling pathway triggering root
colonization of nitrate-rich patches. Proceedings of the National Academy of Sciences of the
United States of America 103, 19206-19211.
Robinson D (1991) The efficiency of crop root-systems in nutrient uptake. In 'Scottish Crop Research
Institute Annual Report 1991.' pp. 49-51. (Scottish Crop Research Institute: Dundee)
Robinson D (1994a) Resource capture by single roots. In 'Resource capture by crops.' (Eds JL
Monteith, RK Scott and MH Unsworth) pp. 53-76. (Nottingham University Press:
Nottingham)
Robinson D (1994b) The responses of plants to non-uniform supplies of nutrients. New Phytologist
127, 635-674.
tel-0
0804
633,
ver
sion
1 -
26 M
ar 2
013
Annexes
188
Robinson D, Rorison IH (1983) A comparison of the responses of Lolium perenne L., Holcus lanatus
L. and Deschampsia flexuosa (L.) Trin. to a localised supply of nitrogen. New Phytologist 94,
263-273.
Wang XT, Below FE (1996) Cytokinins in enhanced growth and tillering of wheat induced by mixed
nitrogen source. Crop Science 36, 121-126.
Wijesinghe DK, Hutchings MJ (1999) The effects of environmental heterogeneity on the performance
of Glechoma hederacea: the interactions between patch contrast and patch scale. Journal of
Ecology 87, 860-872.
Zhang H, Forde BG (1998) An Arabidopsis MADS box gene that controls nutrient-induced changes in
root architecture. Science 279, 407-409.
Zhang H, Jennings A, Barlow PW, Forde BG (1999) Dual pathways for regulation of root branching
by nitrate. Proceedings of the National Academy of Sciences of the United States of America
96, 6529-6534.
tel-0
0804
633,
ver
sion
1 -
26 M
ar 2
013
Effet du ver de terre Aporrectodea caliginosa sur la croissance des plantes, leur développement et leur résistance aux pathogènes: réponse physiologique et moléculaire de la plante à l'émission de molécules-signal
Les plantes se développent et évoluent en interaction avec les organismes du sol. L’impact des vers de terre sur la croissance des plantes, généralement positif, a été attribué à des modifications physiques, chimiques ou biochimiques du sol, souvent sans démonstration rigoureuse. Dans ce travail, les techniques développées en sciences du végétal (culture in vitro, utilisation de mutants et transcriptomique) ont été utilisées afin de comprendre les mécanismes à l’origine de l’effet des vers de terre sur les plantes. Nos résultats apportent de nouvelles connaissances fondamentales: (1) la production de molécules-signal à l’intérieur des déjections de vers de terre a un impact significatif sur la croissance d’Oryza sativa et Lolium perenne. (2) Ces molécules agissent sur la voie de signalisation fortement liée à l’auxine, comme suggéré par l’effet significatif du ver de terre sur la croissance du double mutant d’A. thaliana aux1-7;axr4-2. (3) L’abondance de ces molécules-signal en présence de vers de terre pourrait être liée à la stimulation de certaines populations bactériennes capables de synthétiser de l’auxine. (4) Le ver de terre induit une accumulation de transcrits pour des gènes sous contrôle de l’acide jasmonique et de l’éthylène. Ces hormones sont notamment impliquées dans un mécanisme de résistance systémique induite (ISR), connu pour être induit par certaines rhizobactéries promotrices de la croissance des plantes. Enfin, (5) Le piétin échaudage, maladie due à un champignon pathogène, déclenche chez le blé (Triticum aestivum) une réaction d’hypersensibilité et une modification de la signalisation hormonale, qui sont considérées comme des mécanismes de contrôle du métabolisme de la plante qui facilitent l’infection du pathogène. La sévérité de cette maladie est réduite en présence de vers de terre. La synthèse de ces résultats indique que les vers de terre, comme d’autres organismes du sol, modifient l’équilibre hormonal de la plante. L’homéostasie hormonale apparaît comme un élément incontournable pour prédire l’issue des interactions multiples que les plantes entretiennent avec les organismes du sol.
Mots-clés : Aporrectodea caliginosa ; Arabidopsis thaliana ; bactéries promotrices de la croissance des plantes ; hormones végétales ; molécules-signal ; piétin échaudage ; résistance systémique ; rhizosphère ; transcriptomique ; vers de terre
Impact of the earthworm Aporrectodea caliginosa on plant growth, development and resistance against pathogens: physiological and molecular plant response to the emission of signal molecules
Plants develop and evolve in interaction with soil organisms. The impact of earthworms, likely positive, has been attributed to modifications of physical, chemical or biochemical soil properties, without rigorous demonstration. In this work, techniques developed in plant science (in vitro culture, use of mutant plants and trancriptomic analysis) were used to understand the mechanism involved in the effect of earthworms on plants. Our results bring new fundamental knowledge: (1) production of signal-molecules within earthworm dejections has a positive impact on the growth of Oryza sativa and Lolium perenne. (2) These molecules act on auxin signaling, as suggested by the positive impact of the earthworm on the growth of A. thaliana double mutant aux1-7;axr4-2. (3) The abundance of these signal-molecules in presence of the earthworms could be related to the stimulation of bacterial communities able to produce auxin. (4) Earthworms induce an accumulation of gene transcripts known to be under control of jasmonic acid and ethylene. These two hormones are most notably involved in the defense mechanism called induced systemic resistance (ISR), known to be induced by plant growth promoting rhizobacteria. Finally, (5) Take-all disease, due to a pathogenic fungus, induced in wheat (Triticum aestivum) a hypersensitive response and a modification on hormone signaling, which are known as manipulations of plant metabolism in a way that facilitates pathogen infection. The severity of take-all disease was alleviated in the presence of earthworms. Synthesis of these results showed that earthworms, like other soil organisms, modify the hormone balance in the plant. Hormone homeostasis appeared to be an important element to predict the issue of the multiple interactions that plants established with soil organisms.
Keywords : Aporrectodea caliginosa ; Arabidopsis thaliana ; earthworms ; plant hormones ; plant growth promoting rhizobacteria ; rhizosphere; signal molecules; take-all ; transcriptomic; systemic resistance
tel-0
0804
633,
ver
sion
1 -
26 M
ar 2
013


![Pdf pdf projet_educatif-2[1]](https://img.pdfslide.fr/doc/110x75/5499da0bac7959092e8b5a10/pdf-pdf-projeteducatif-21.jpg)