Embed Size (px)
Citation preview
Pneumonie aigue communautaire et bon usage des an1bio1ques
Aurélien Dinh Infec1ologie
Hôpitaux Universitaires Paris Ile de France Ouest
Conflits d’intérêts
• PHRC na1onal 2013 • PHRC na1onal 2016
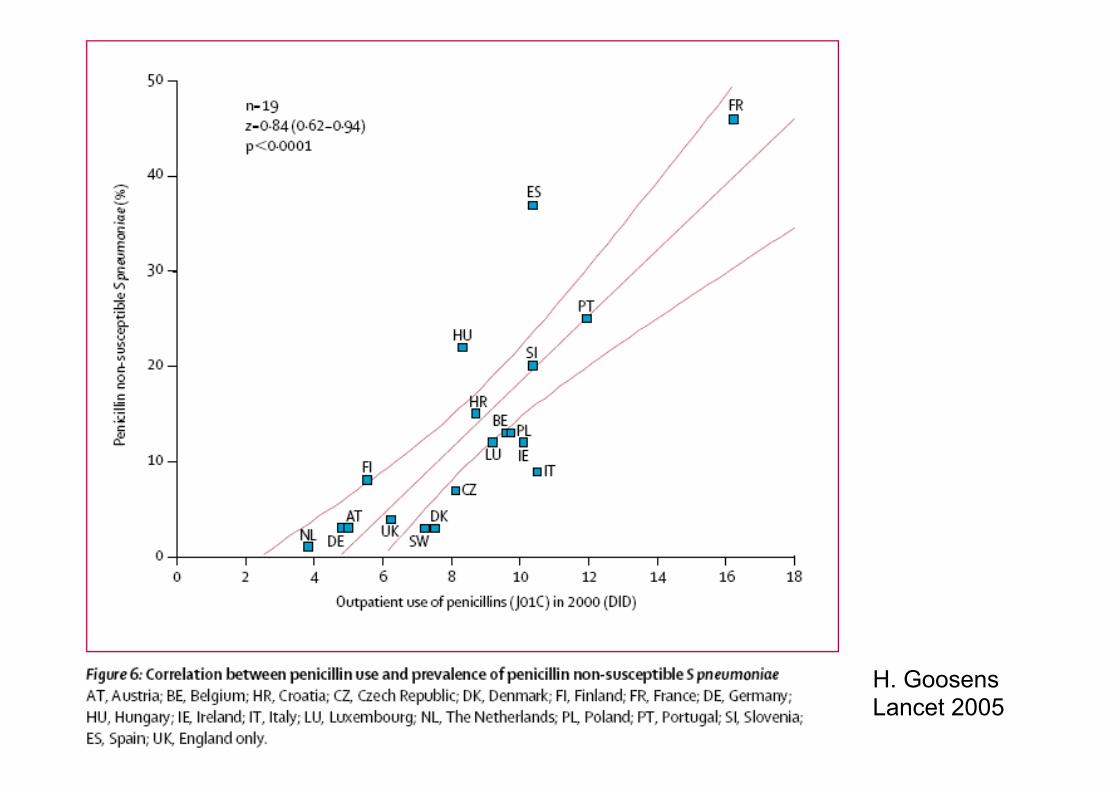
H. Goosens Lancet 2005

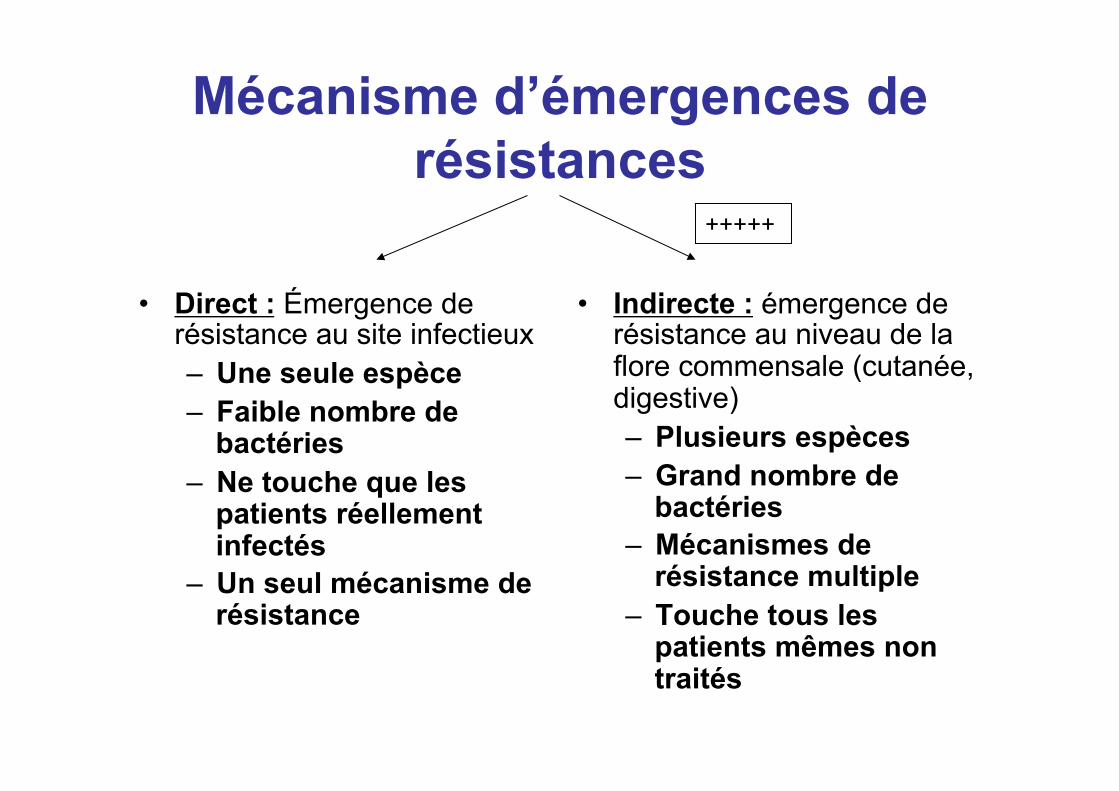
Mécanisme d’émergences de résistances
• Direct : Émergence de résistance au site infectieux – Une seule espèce – Faible nombre de
bactéries – Ne touche que les
patients réellement infectés
– Un seul mécanisme de résistance
• Indirecte : émergence de résistance au niveau de la flore commensale (cutanée, digestive) – Plusieurs espèces – Grand nombre de
bactéries – Mécanismes de
résistance multiple – Touche tous les
patients mêmes non traités
+++++
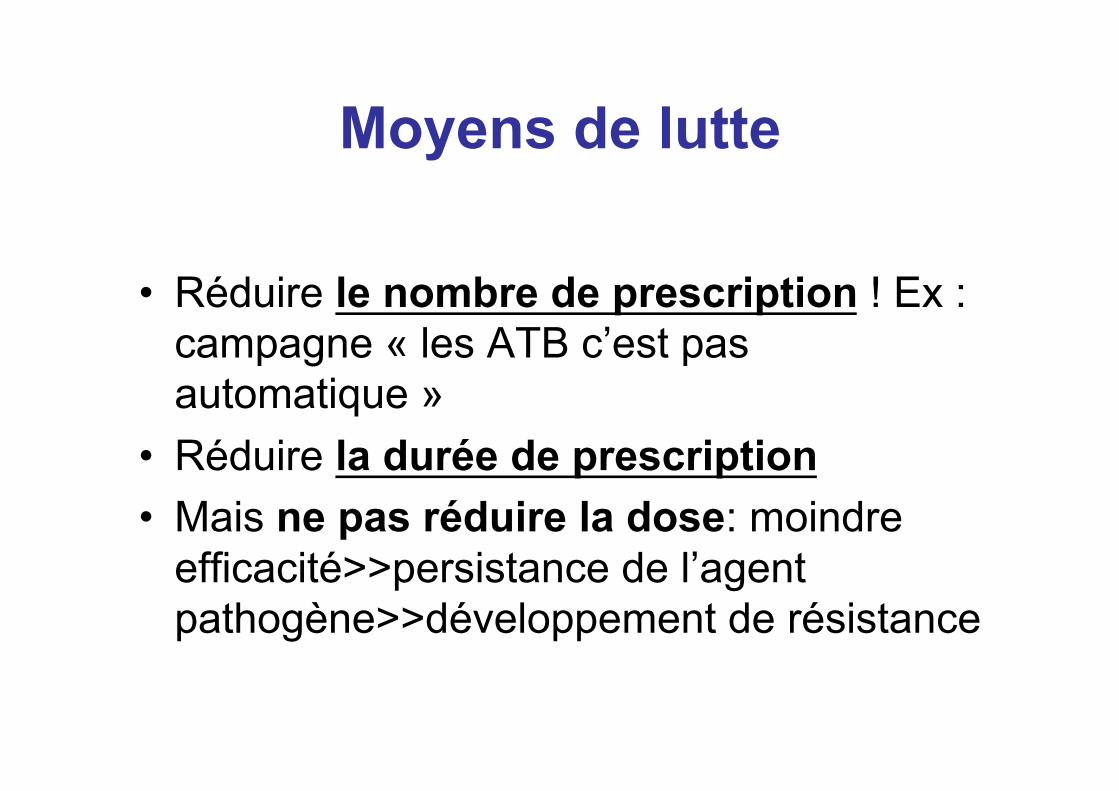
Moyens de lutte
• Réduire le nombre de prescription ! Ex : campagne « les ATB c’est pas automatique »
• Réduire la durée de prescription • Mais ne pas réduire la dose: moindre
efficacité>>persistance de l’agent pathogène>>développement de résistance
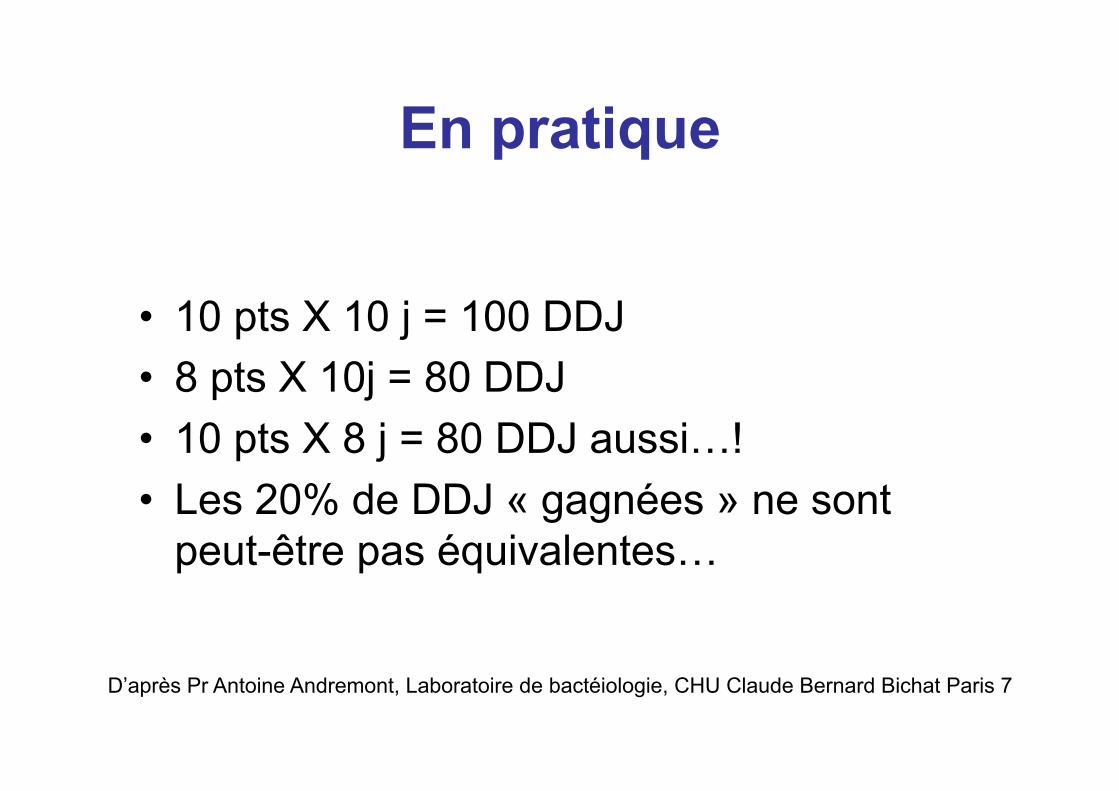
En pratique
• 10 pts X 10 j = 100 DDJ • 8 pts X 10j = 80 DDJ • 10 pts X 8 j = 80 DDJ aussi…! • Les 20% de DDJ « gagnées » ne sont
peut-être pas équivalentes…
D’après Pr Antoine Andremont, Laboratoire de bactéiologie, CHU Claude Bernard Bichat Paris 7
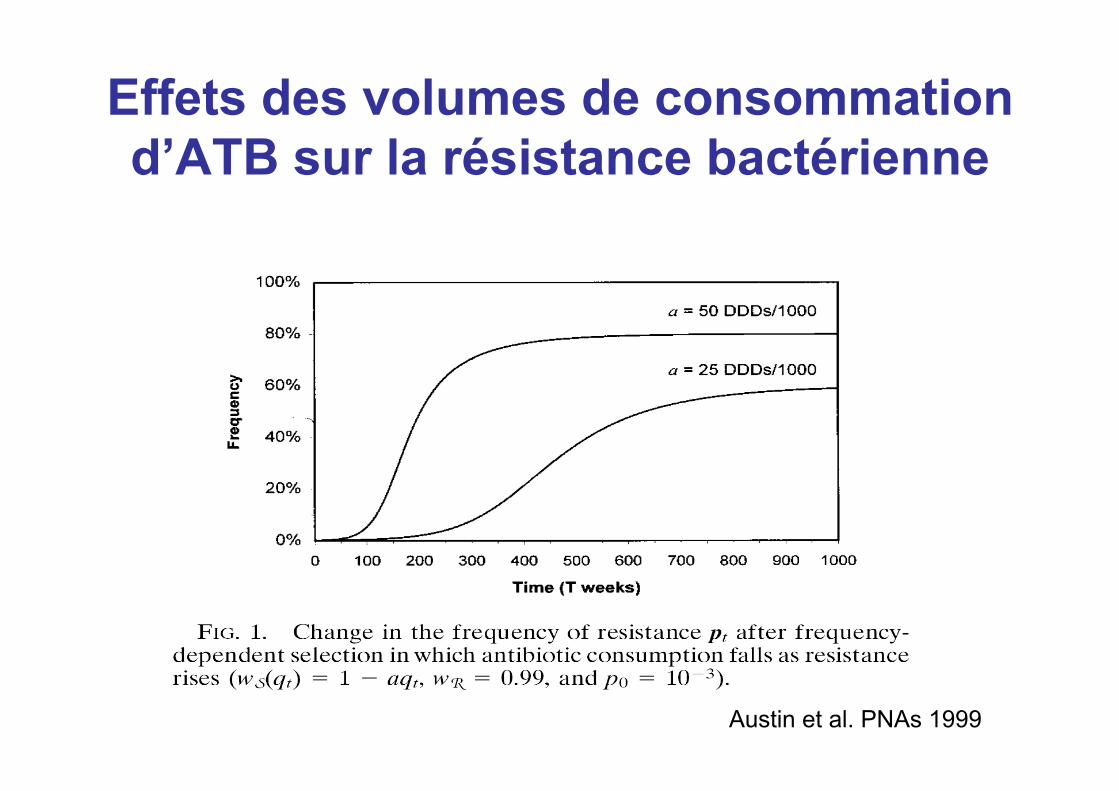
Effets des volumes de consommation d’ATB sur la résistance bactérienne
Austin et al. PNAs 1999

Intérêt d’une durée courte pour une même efficacité !!
Meilleure qualité de vie
Moins de toxicité, d’effets indésirables
Satisfaction du patient
Meilleure efficacité ??!!
Moins de résistances bactériennes
Durée de traitement courte
Moindre coût Meilleure observance
D’après Li JZ. Am Med J 2007
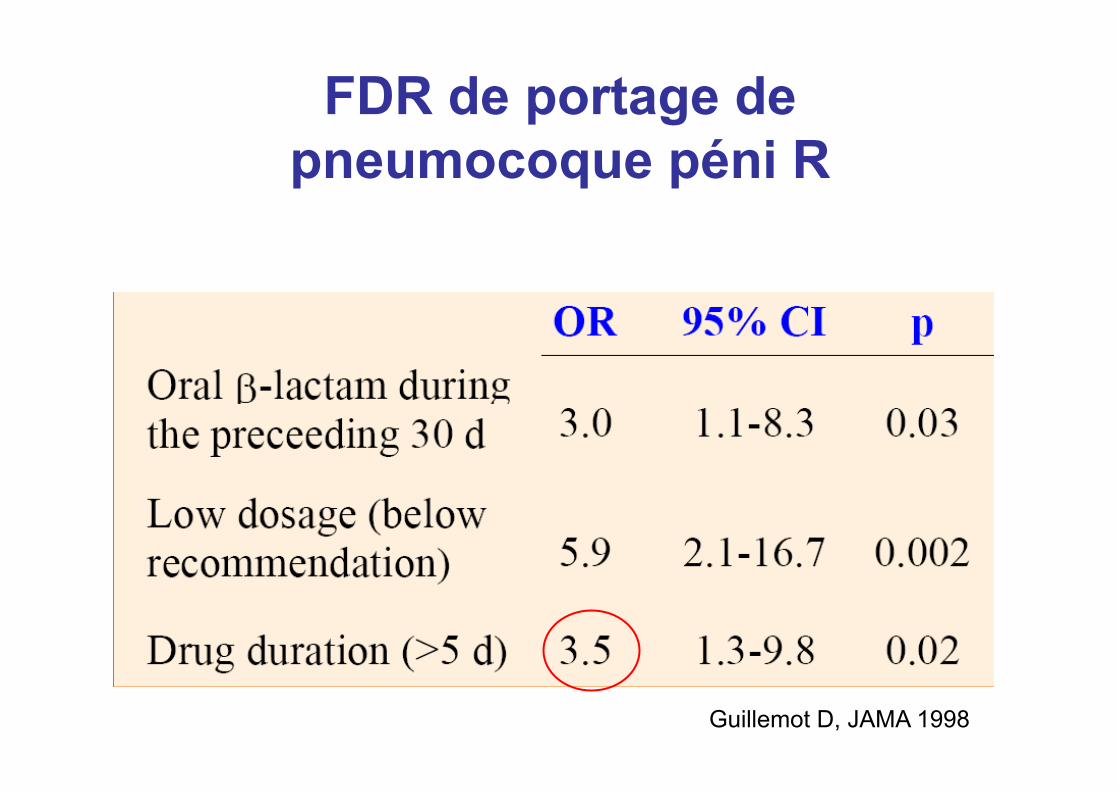
FDR de portage de pneumocoque péni R
Guillemot D, JAMA 1998
« Treatment duration: so common, so complex »
T. Hooton
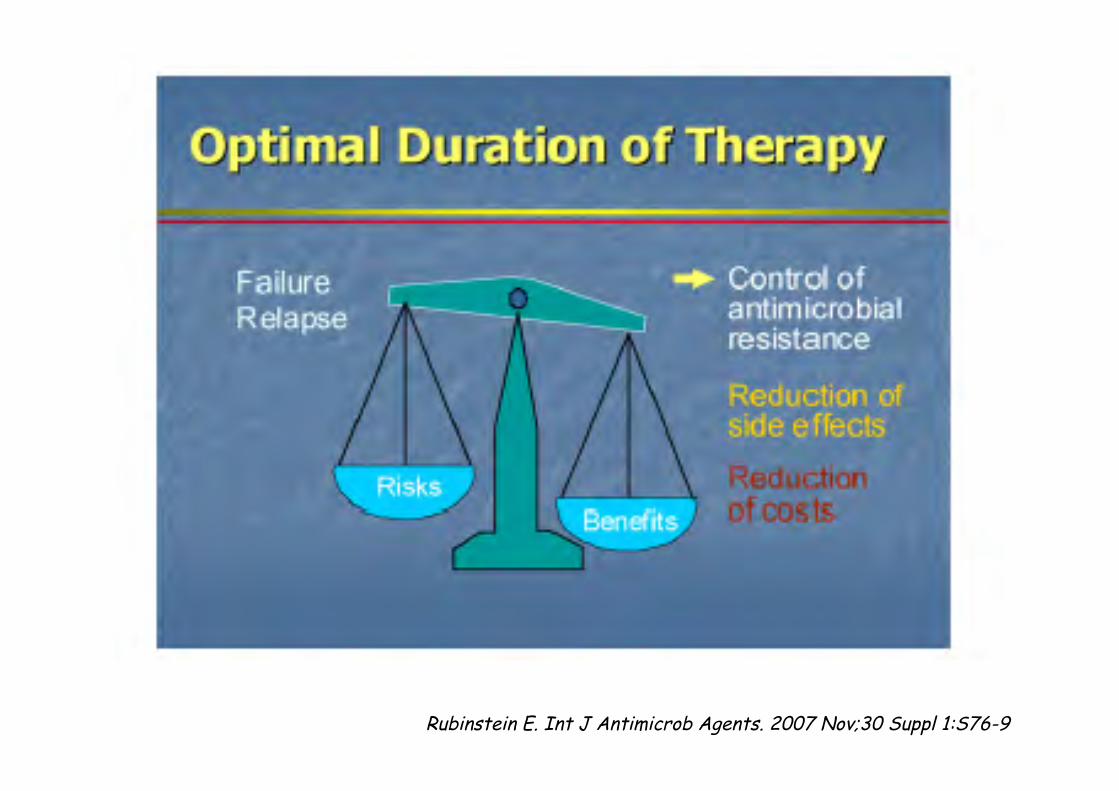
Rubinstein E. Int J Antimicrob Agents. 2007 Nov;30 Suppl 1:S76-9
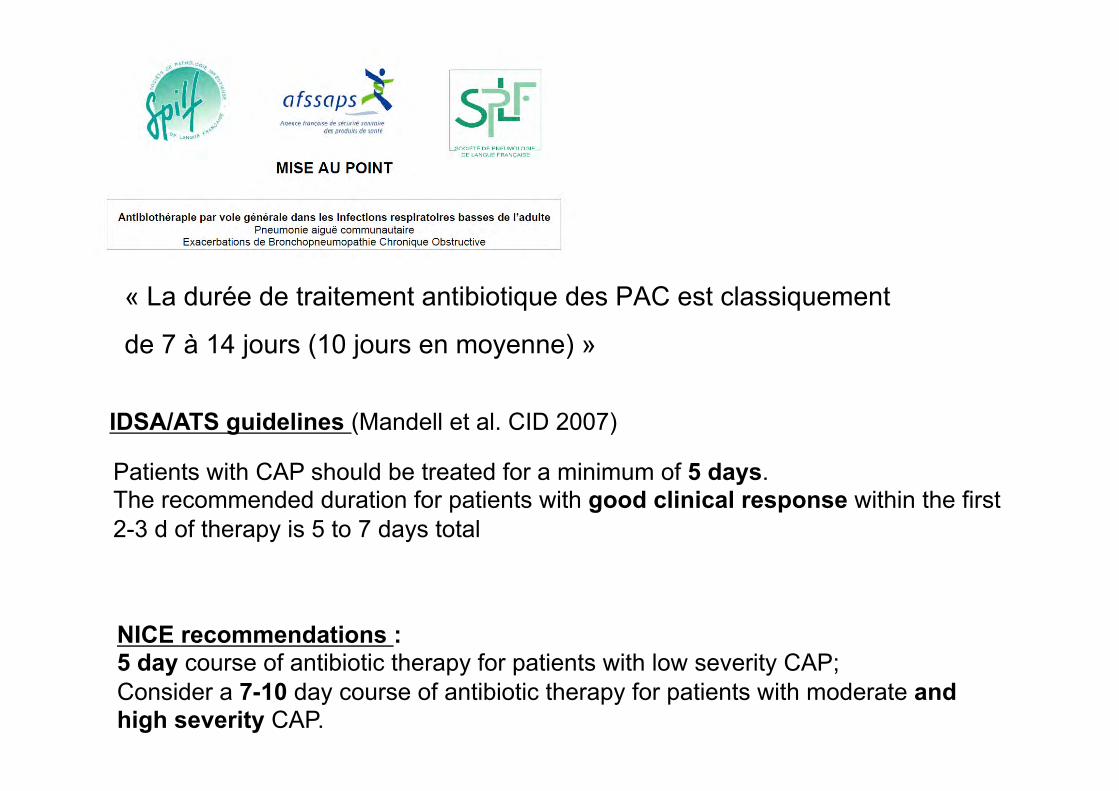
« La durée de traitement antibiotique des PAC est classiquement
de 7 à 14 jours (10 jours en moyenne) »
Patients with CAP should be treated for a minimum of 5 days. The recommended duration for patients with good clinical response within the first 2-3 d of therapy is 5 to 7 days total
IDSA/ATS guidelines (Mandell et al. CID 2007)
NICE recommendations : 5 day course of antibiotic therapy for patients with low severity CAP; Consider a 7-10 day course of antibiotic therapy for patients with moderate and high severity CAP.
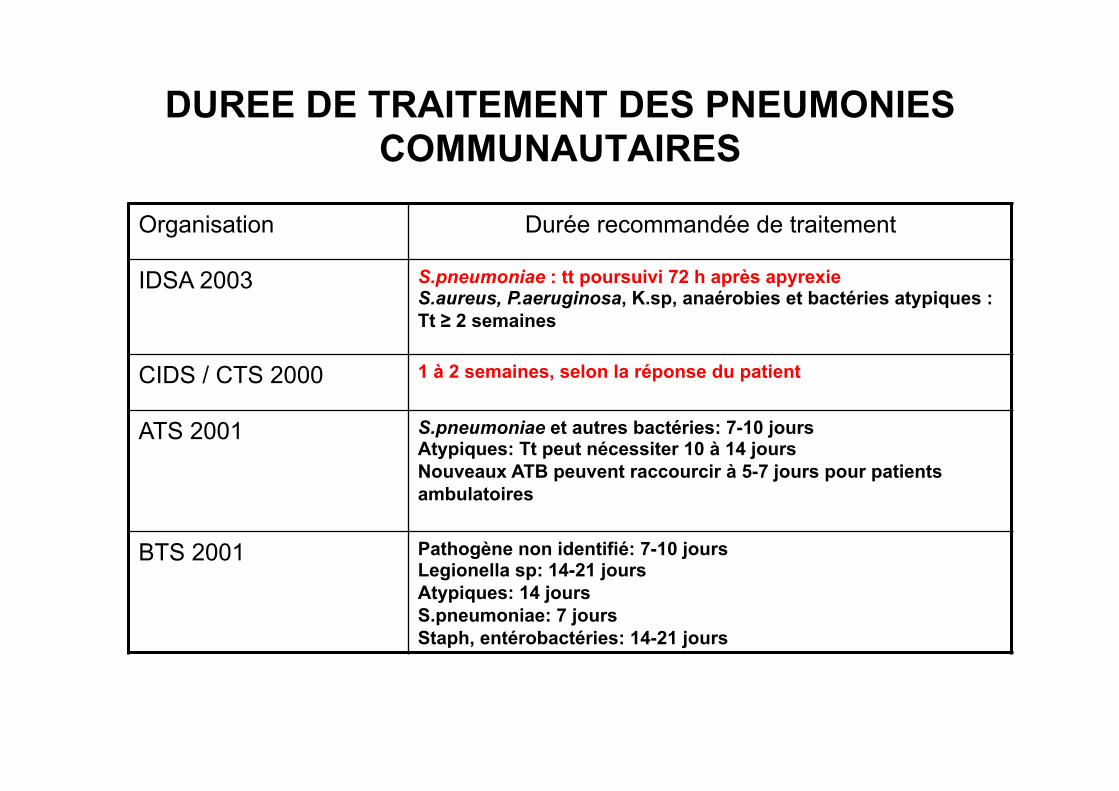
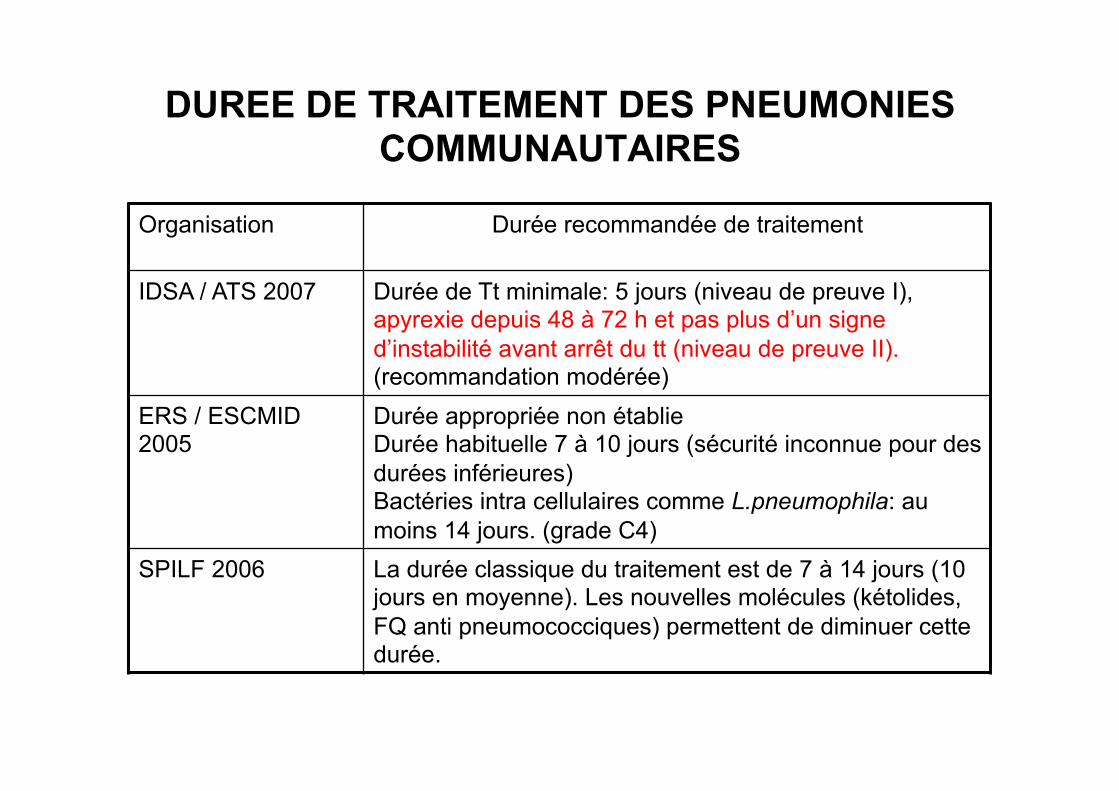
DUREE DE TRAITEMENT DES PNEUMONIES COMMUNAUTAIRES
Organisation Durée recommandée de traitement
IDSA 2003 S.pneumoniae : tt poursuivi 72 h après apyrexie S.aureus, P.aeruginosa, K.sp, anaérobies et bactéries atypiques : Tt ≥ 2 semaines
CIDS / CTS 2000 1 à 2 semaines, selon la réponse du patient
ATS 2001 S.pneumoniae et autres bactéries: 7-10 jours Atypiques: Tt peut nécessiter 10 à 14 jours Nouveaux ATB peuvent raccourcir à 5-7 jours pour patients ambulatoires
BTS 2001 Pathogène non identifié: 7-10 jours Legionella sp: 14-21 jours Atypiques: 14 jours S.pneumoniae: 7 jours Staph, entérobactéries: 14-21 jours
DUREE DE TRAITEMENT DES PNEUMONIES COMMUNAUTAIRES
Organisation
Durée recommandée de traitement
IDSA / ATS 2007 Durée de Tt minimale: 5 jours (niveau de preuve I), apyrexie depuis 48 à 72 h et pas plus d’un signe d’instabilité avant arrêt du tt (niveau de preuve II). (recommandation modérée)
ERS / ESCMID 2005
Durée appropriée non établie Durée habituelle 7 à 10 jours (sécurité inconnue pour des durées inférieures) Bactéries intra cellulaires comme L.pneumophila: au moins 14 jours. (grade C4)
SPILF 2006 La durée classique du traitement est de 7 à 14 jours (10 jours en moyenne). Les nouvelles molécules (kétolides, FQ anti pneumococciques) permettent de diminuer cette durée.
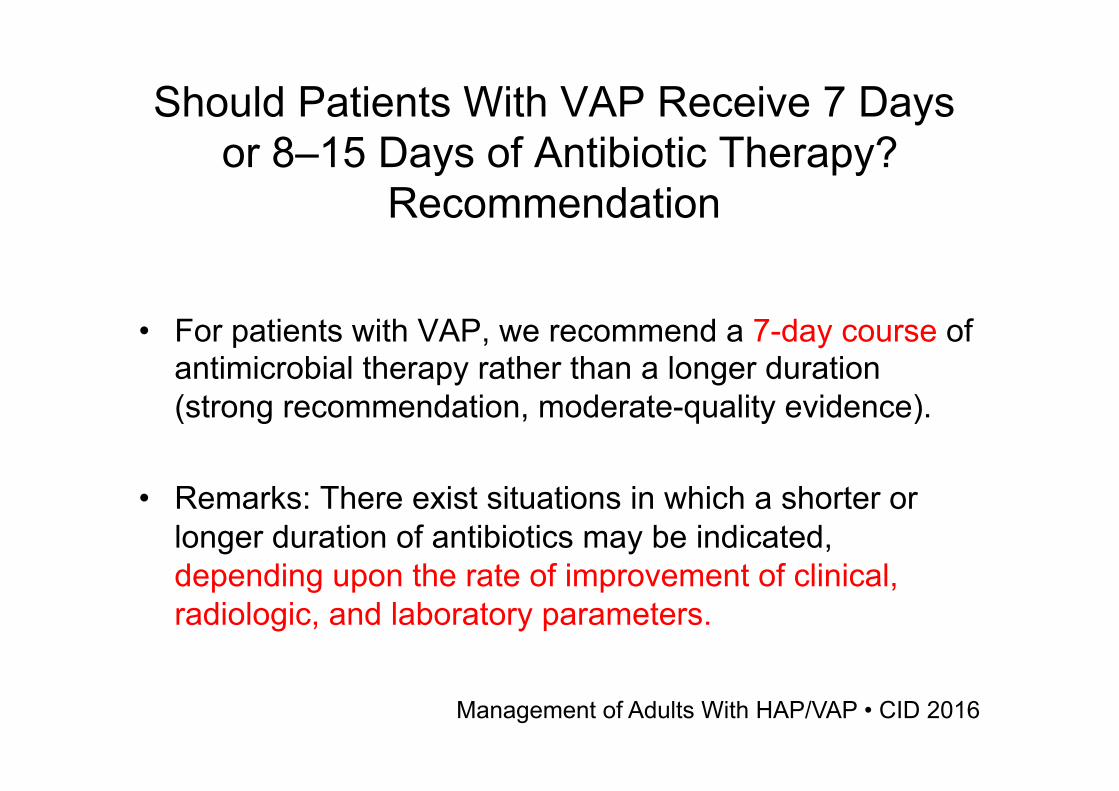
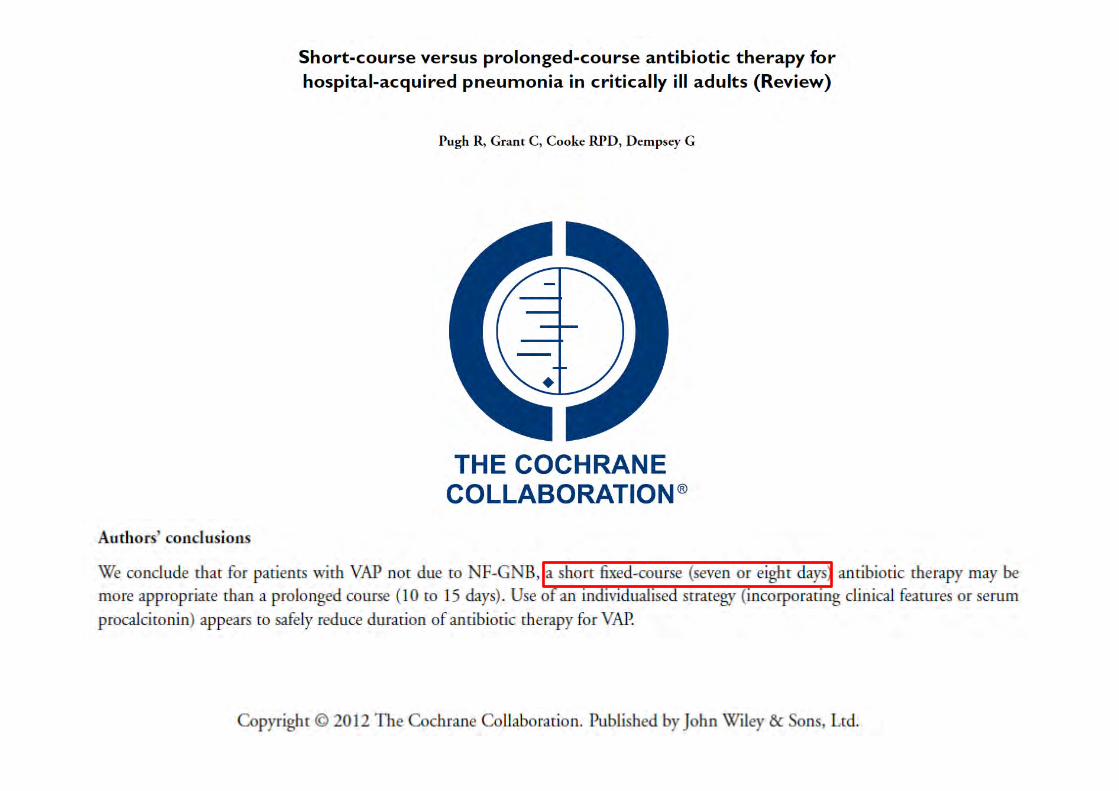
Should Patients With VAP Receive 7 Days or 8–15 Days of Antibiotic Therapy?
Recommendation
• For patients with VAP, we recommend a 7-day course of antimicrobial therapy rather than a longer duration (strong recommendation, moderate-quality evidence).
• Remarks: There exist situations in which a shorter or longer duration of antibiotics may be indicated, depending upon the rate of improvement of clinical, radiologic, and laboratory parameters.
Management of Adults With HAP/VAP • CID 2016
Auteurs Caractéristique des études Indications Durées de traitement et posologies Efficacité
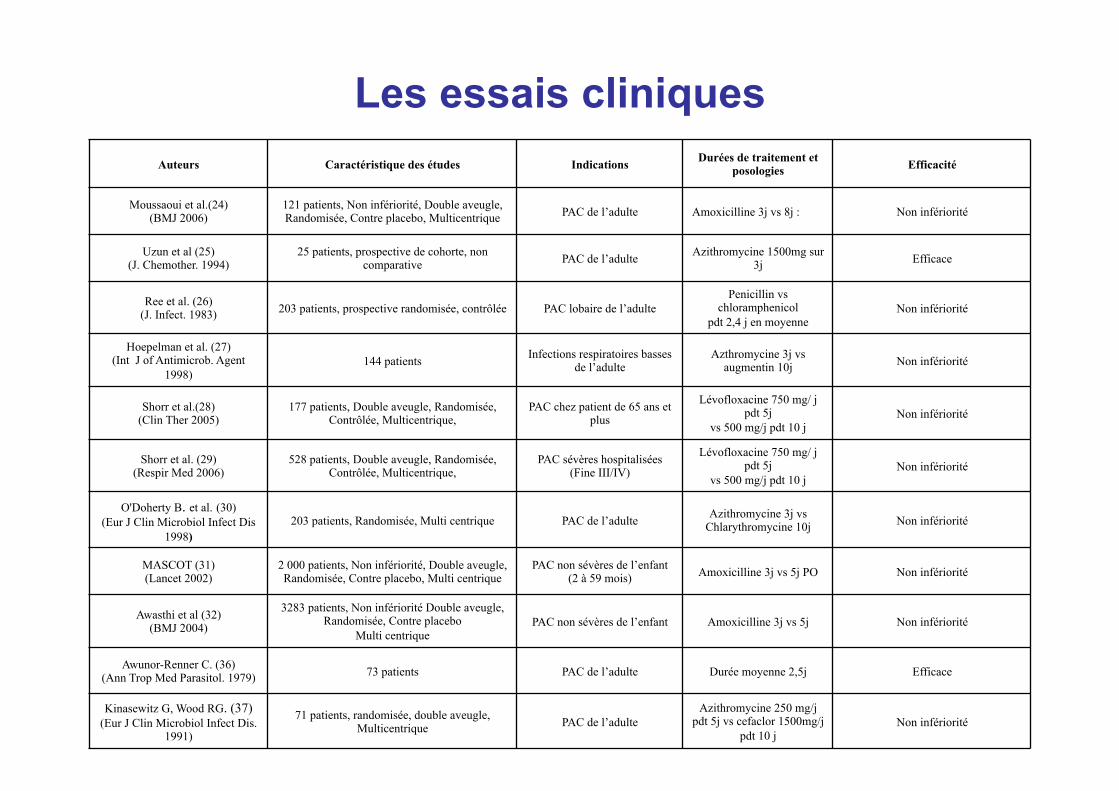
Moussaoui et al.(24) (BMJ 2006) 121 patients, Non infériorité, Double aveugle,
Randomisée, Contre placebo, Multicentrique PAC de l’adulte Amoxicilline 3j vs 8j : Non infériorité Uzun et al (25)
(J. Chemother. 1994) 25 patients, prospective de cohorte, non comparative PAC de l’adulte Azithromycine 1500mg sur
3j Efficace
Ree et al. (26) (J. Infect. 1983) 203 patients, prospective randomisée, contrôlée PAC lobaire de l’adulte Penicillin vs
chloramphenicol pdt 2,4 j en moyenne Non infériorité
Hoepelman et al. (27) (Int J of Antimicrob. Agent
1998) 144 patients Infections respiratoires basses de l’adulte Azthromycine 3j vs
augmentin 10j Non infériorité
Shorr et al.(28) (Clin Ther 2005) 177 patients, Double aveugle, Randomisée,
Contrôlée, Multicentrique, PAC chez patient de 65 ans et plus
Lévofloxacine 750 mg/ j pdt 5j
vs 500 mg/j pdt 10 j Non infériorité
Shorr et al. (29) (Respir Med 2006) 528 patients, Double aveugle, Randomisée,
Contrôlée, Multicentrique, PAC sévères hospitalisées (Fine III/IV)
Lévofloxacine 750 mg/ j pdt 5j
vs 500 mg/j pdt 10 j Non infériorité
O'Doherty B. et al. (30) (Eur J Clin Microbiol Infect Dis
1998) 203 patients, Randomisée, Multi centrique PAC de l’adulte Azithromycine 3j vs
Chlarythromycine 10j Non infériorité
MASCOT (31) (Lancet 2002) 2 000 patients, Non infériorité, Double aveugle,
Randomisée, Contre placebo, Multi centrique PAC non sévères de l’enfant (2 à 59 mois) Amoxicilline 3j vs 5j PO Non infériorité
Awasthi et al (32) (BMJ 2004)
3283 patients, Non infériorité Double aveugle, Randomisée, Contre placebo
Multi centrique PAC non sévères de l’enfant Amoxicilline 3j vs 5j Non infériorité
Awunor-Renner C. (36) (Ann Trop Med Parasitol. 1979) 73 patients PAC de l’adulte Durée moyenne 2,5j Efficace Kinasewitz G, Wood RG. (37)
(Eur J Clin Microbiol Infect Dis. 1991)
71 patients, randomisée, double aveugle, Multicentrique PAC de l’adulte Azithromycine 250 mg/j
pdt 5j vs cefaclor 1500mg/j pdt 10 j Non infériorité
Les essais cliniques

« A new concept ? »
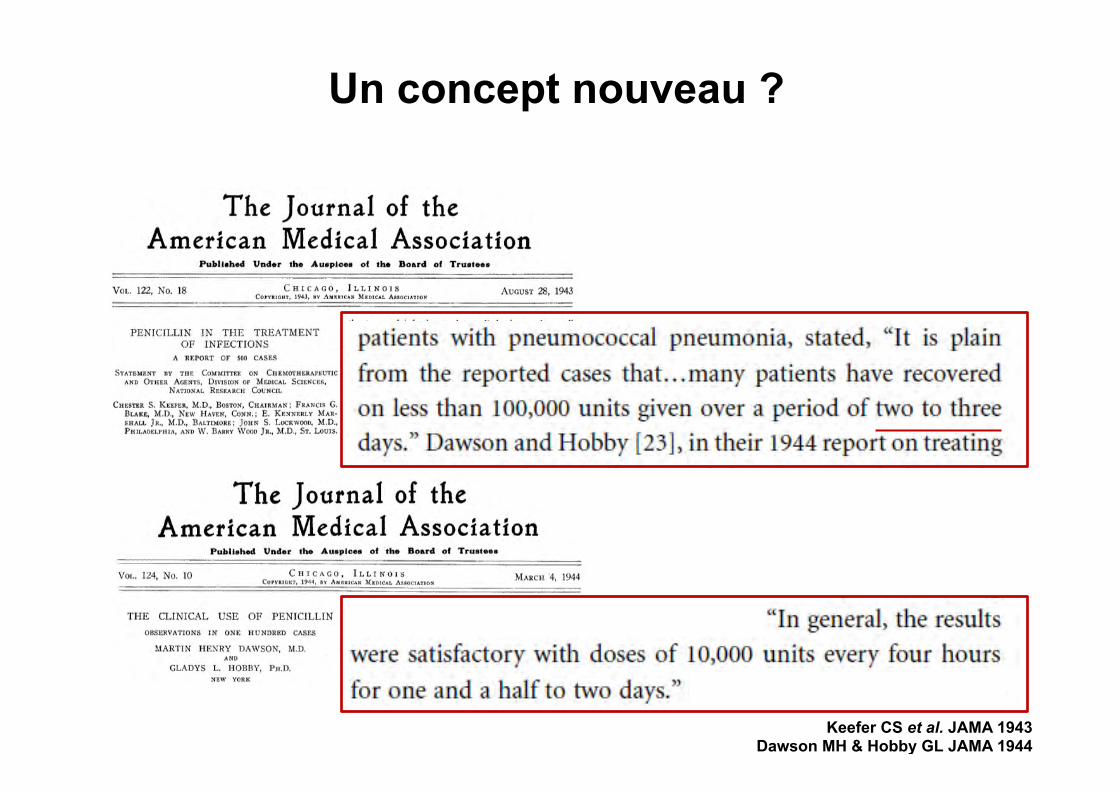
Keefer CS et al. JAMA 1943 Dawson MH & Hobby GL JAMA 1944
Un concept nouveau ?
v
v
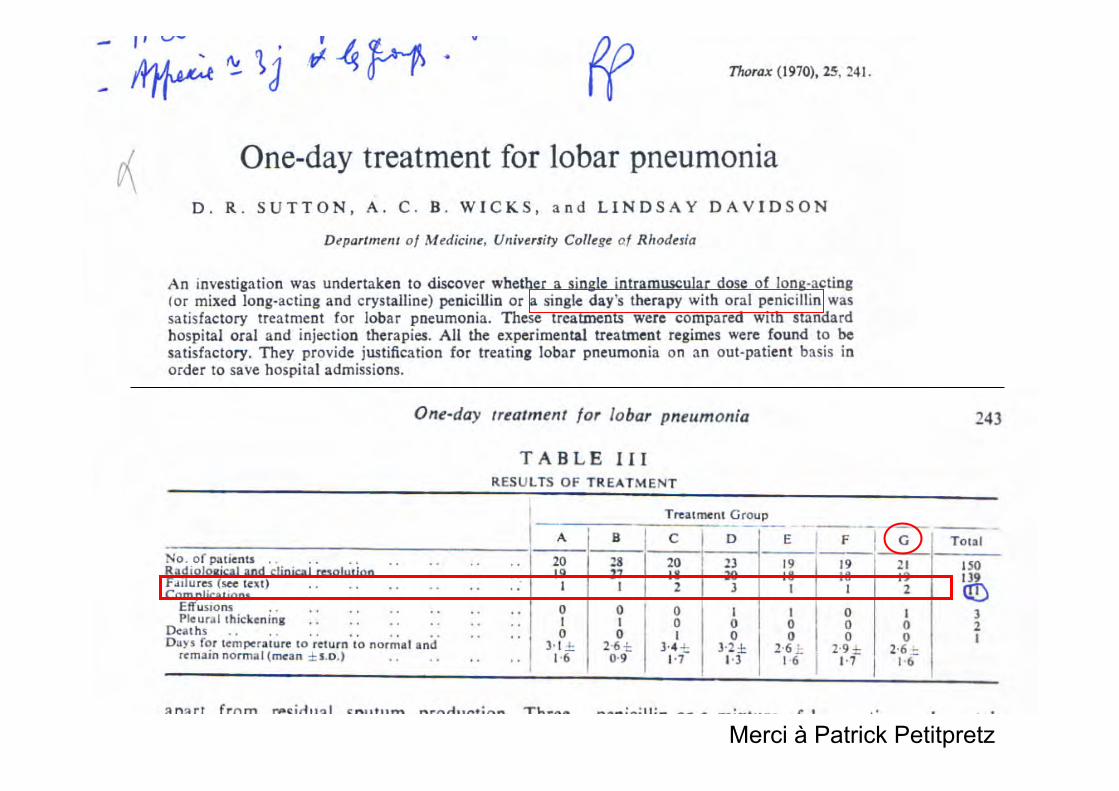
Merci à Patrick Petitpretz
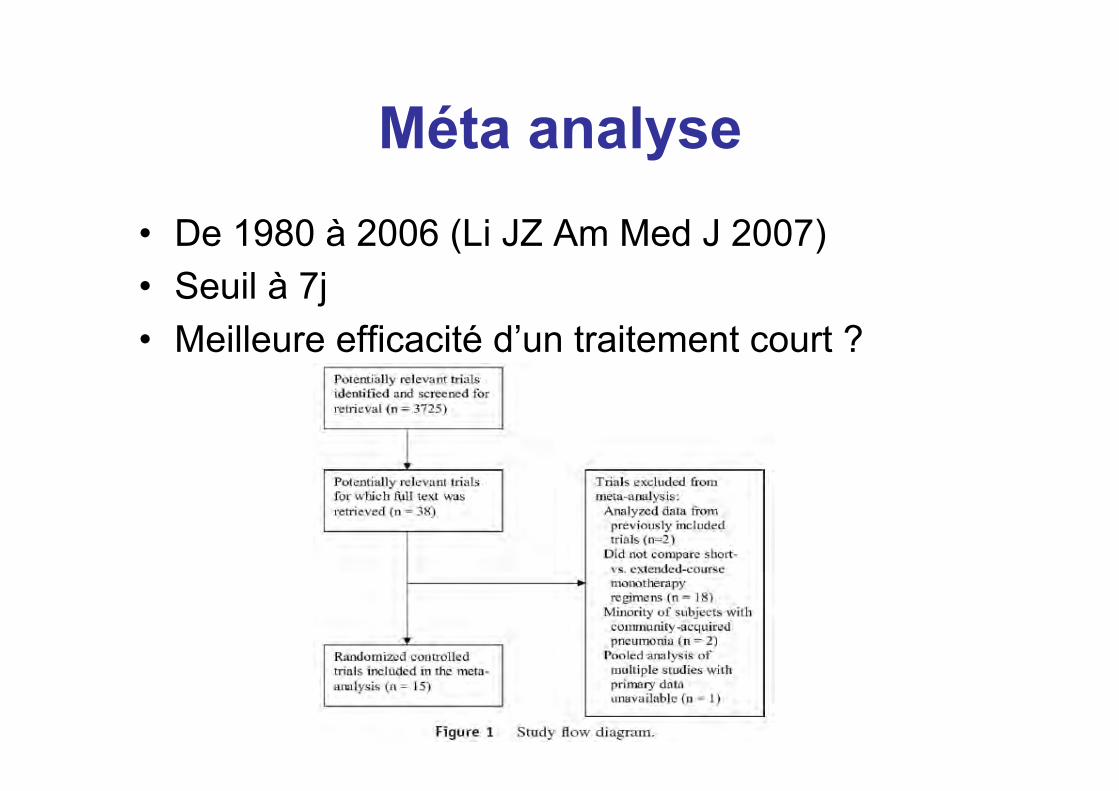
Méta analyse • De 1980 à 2006 (Li JZ Am Med J 2007) • Seuil à 7j • Meilleure efficacité d’un traitement court ?
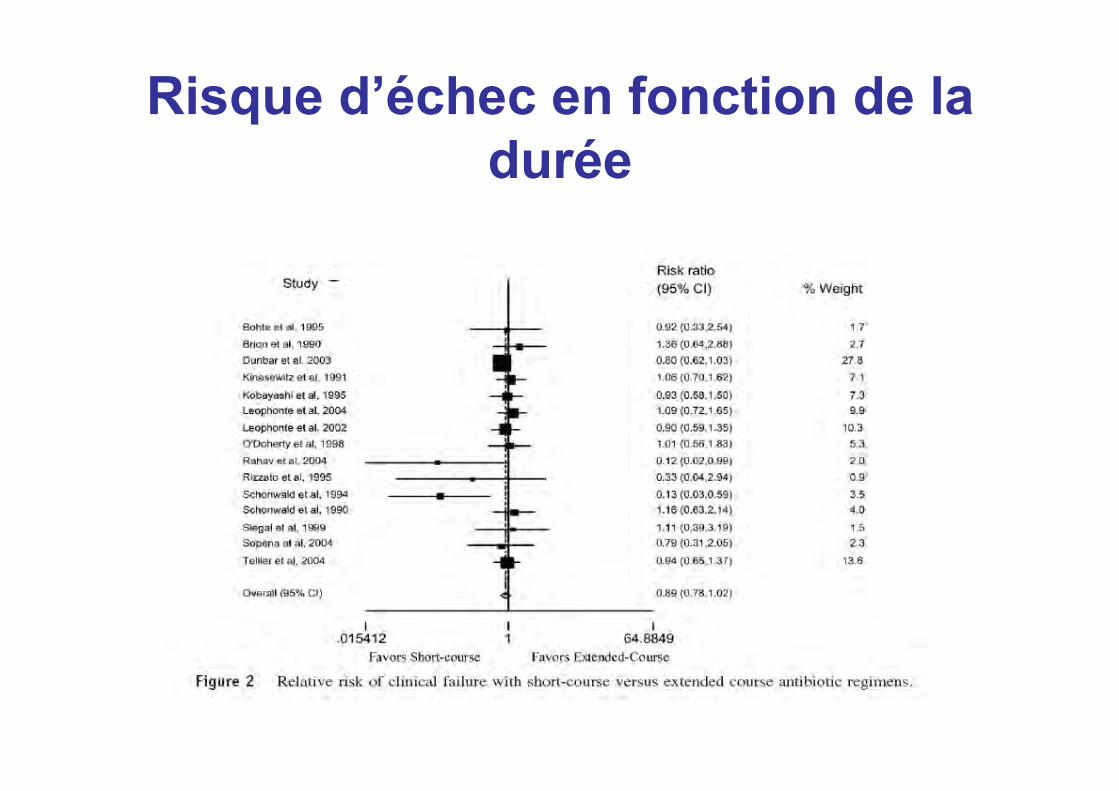
Risque d’échec en fonction de la durée
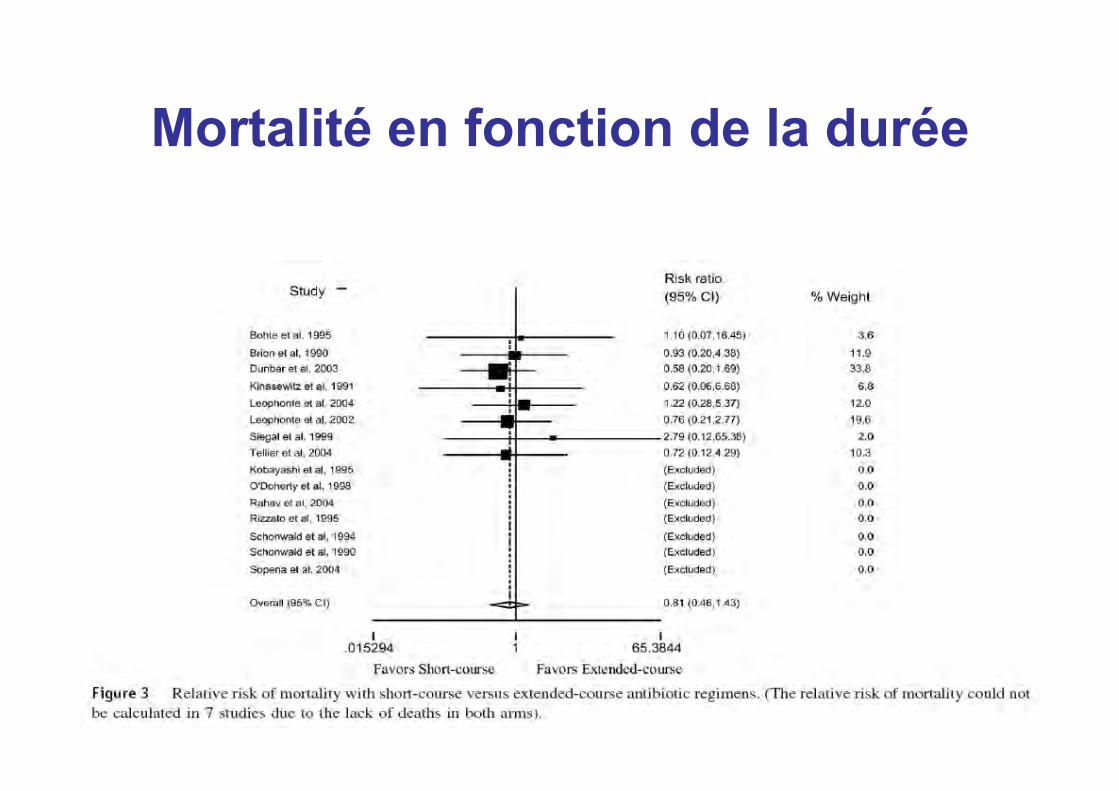
Mortalité en fonction de la durée
HAS (avril 2008) • « L’antibiothérapie curative ne dépasse
généralement pas une semaine. • En effet, beaucoup d’infections ne nécessitent
pas une antibiothérapie d’une durée plus longue. • Une antibiothérapie prolongée expose à un
bénéfice/risque défavorable (résistances bactériennes augmentées, toxicité accrue).
• De plus, des traitements plus courts ont été validés dans des situations bien définies. »
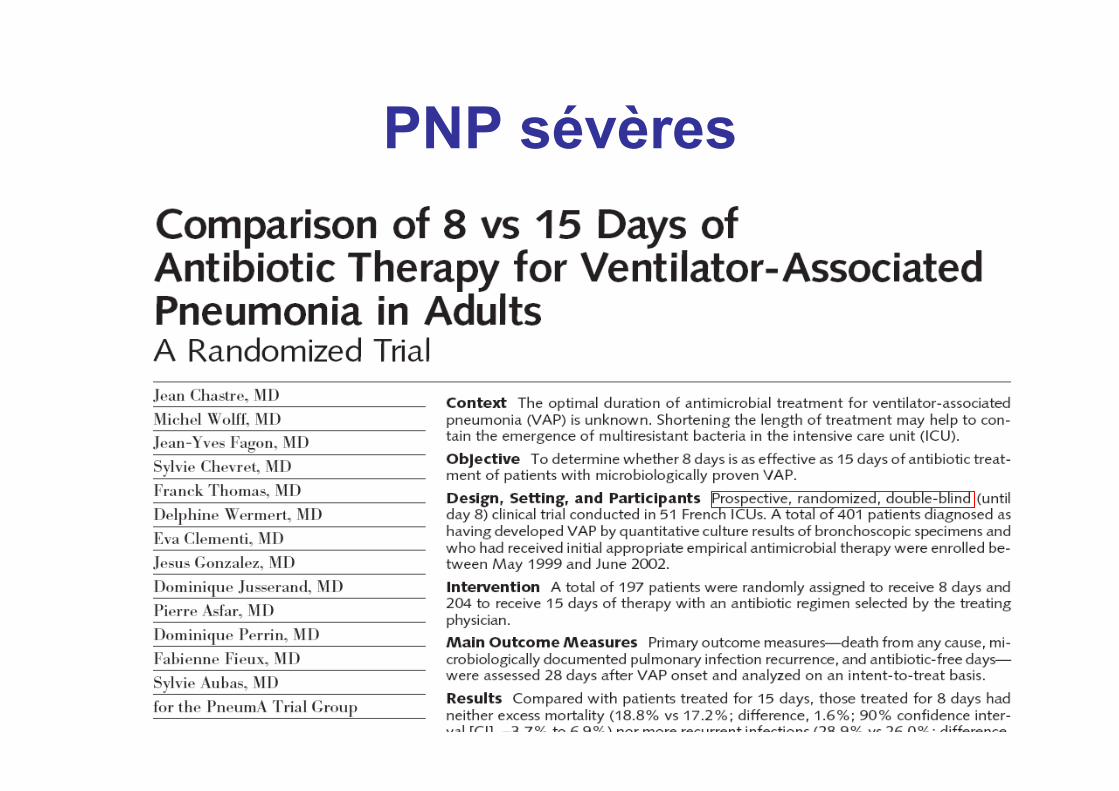
PNP sévères
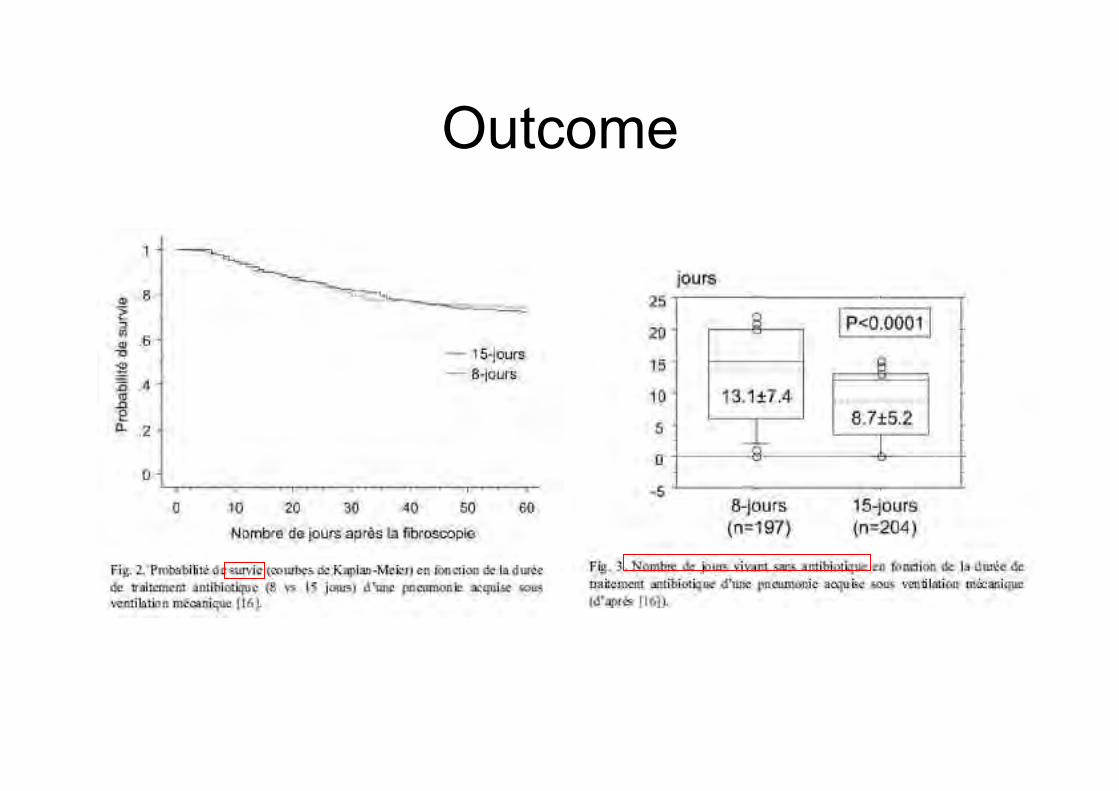
Outcome
El Moussaoui, BMJ 2006.
PNP communautaires
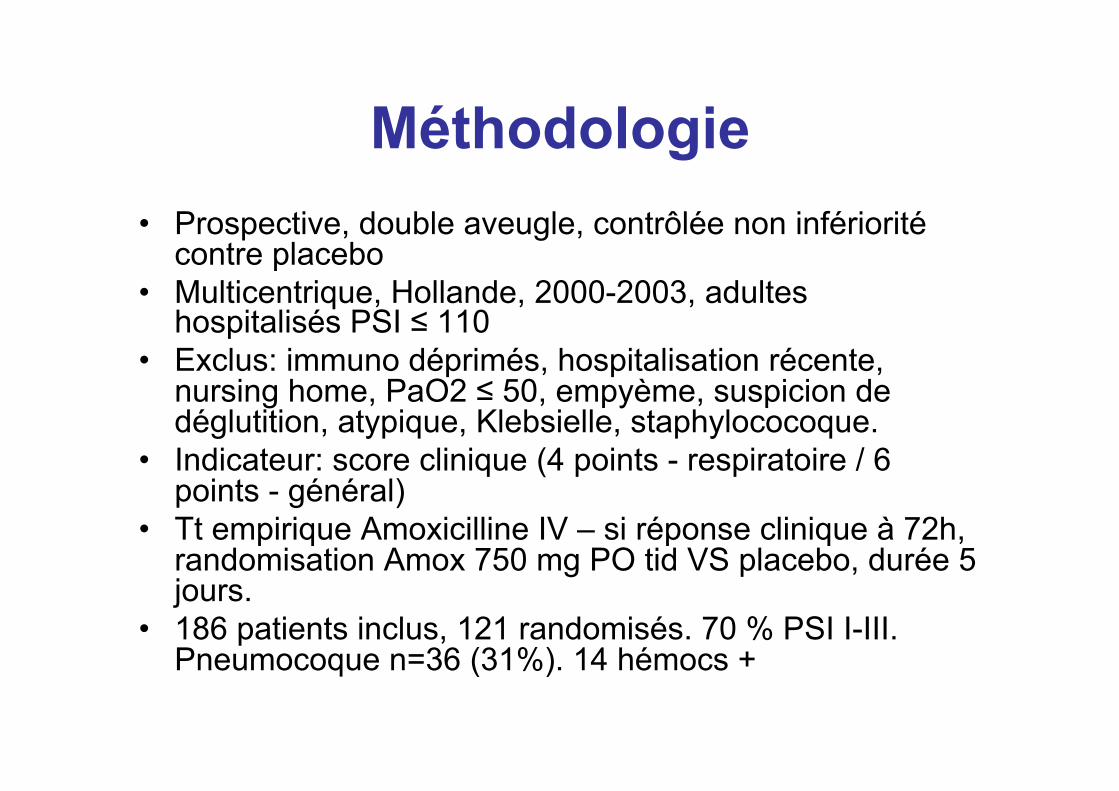
Méthodologie • Prospective, double aveugle, contrôlée non infériorité
contre placebo • Multicentrique, Hollande, 2000-2003, adultes
hospitalisés PSI ≤ 110 • Exclus: immuno déprimés, hospitalisation récente,
nursing home, PaO2 ≤ 50, empyème, suspicion de déglutition, atypique, Klebsielle, staphylococoque.
• Indicateur: score clinique (4 points - respiratoire / 6 points - général)
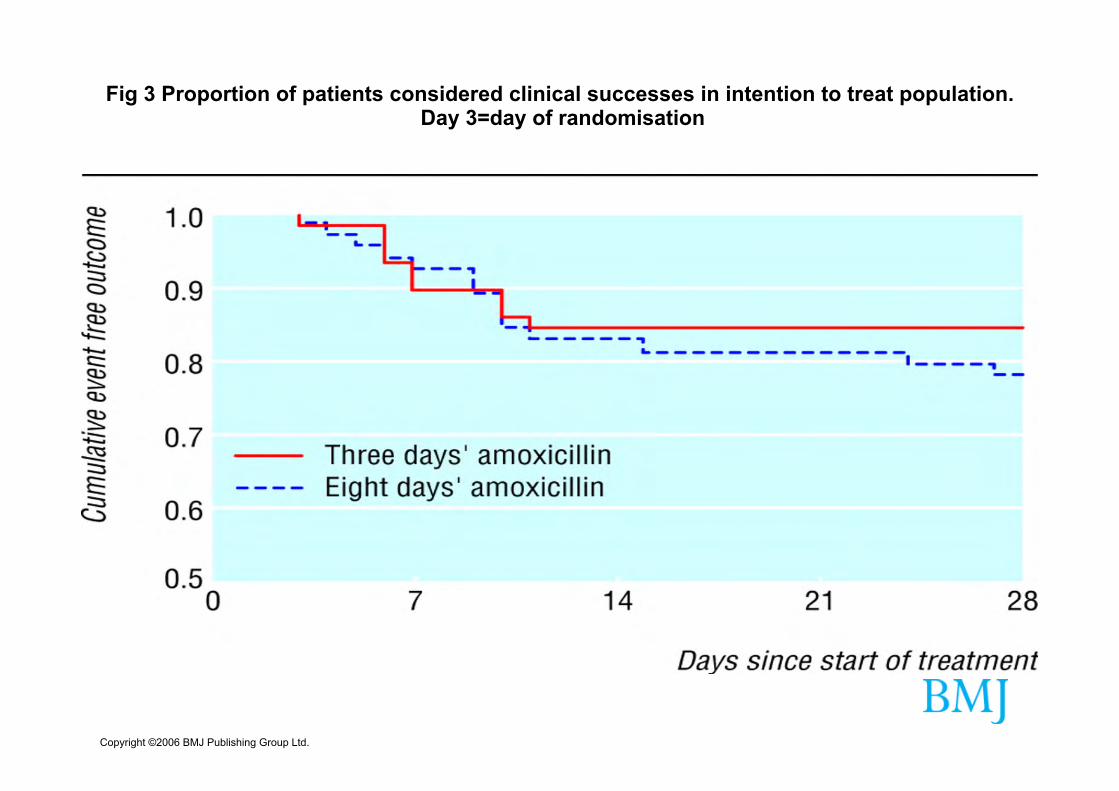
• Tt empirique Amoxicilline IV – si réponse clinique à 72h, randomisation Amox 750 mg PO tid VS placebo, durée 5 jours.
• 186 patients inclus, 121 randomisés. 70 % PSI I-III. Pneumocoque n=36 (31%). 14 hémocs +
Copyright ©2006 BMJ Publishing Group Ltd.
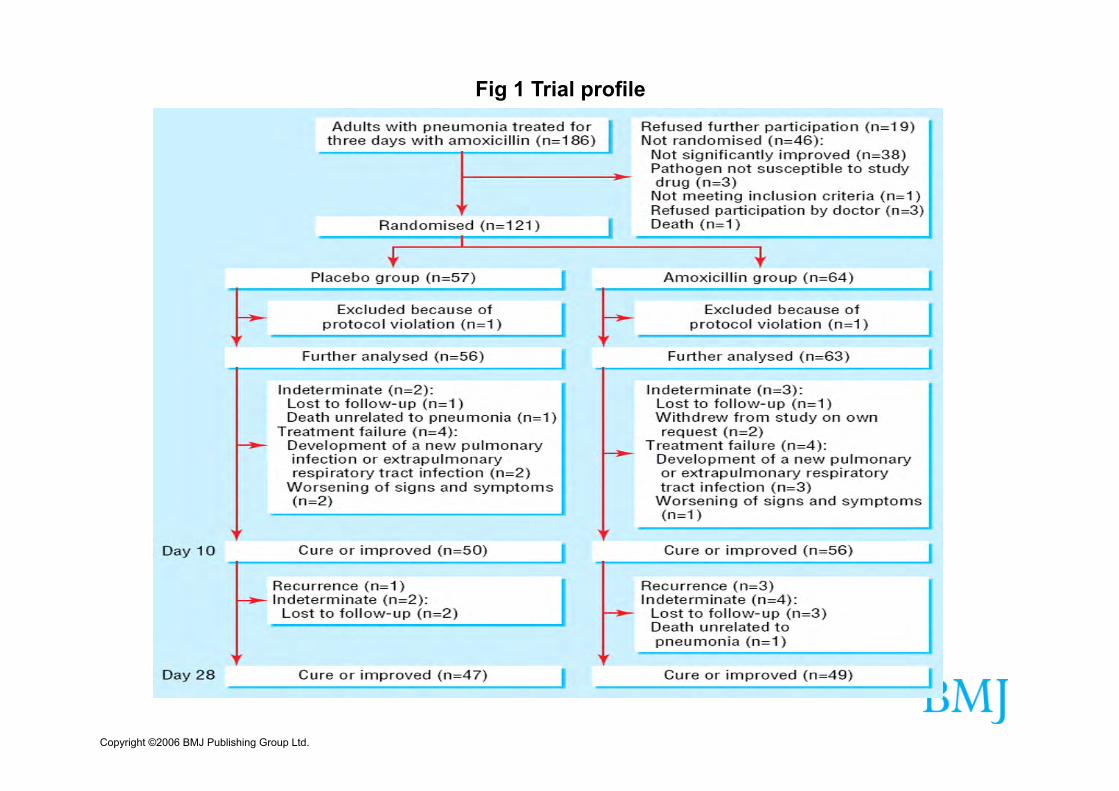
Fig 1 Trial profile
Copyright ©2006 BMJ Publishing Group Ltd.
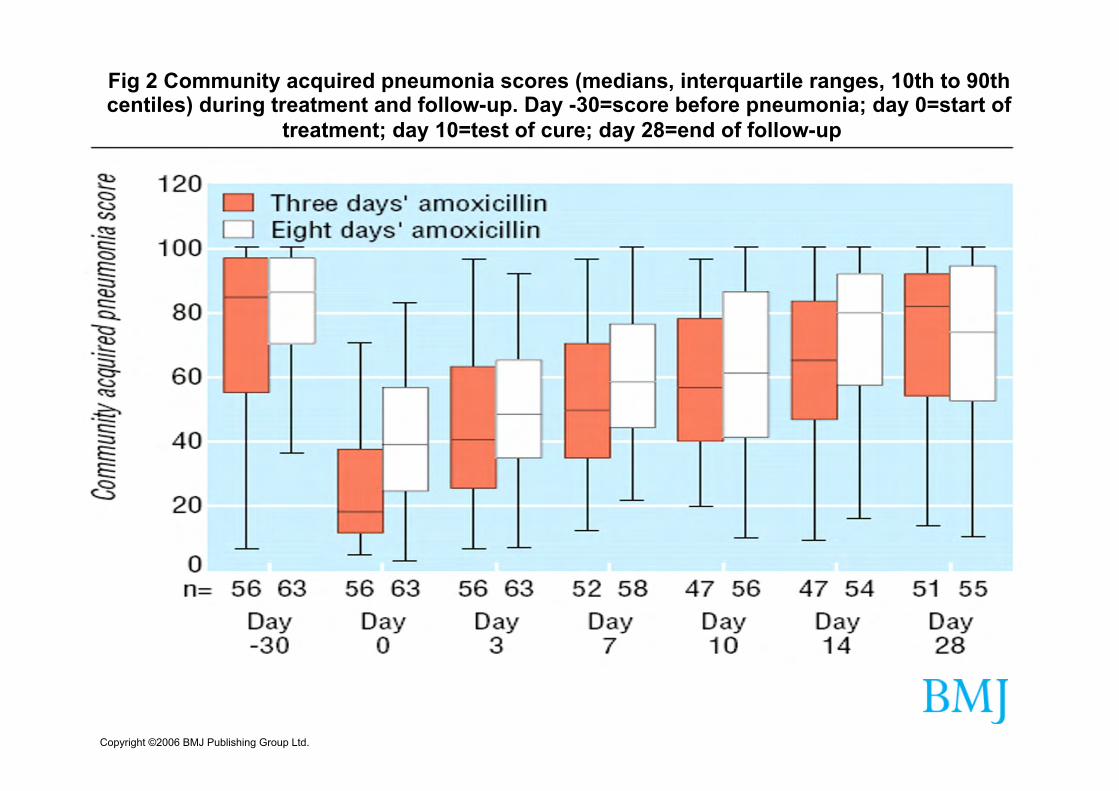
Fig 2 Community acquired pneumonia scores (medians, interquartile ranges, 10th to 90th centiles) during treatment and follow-up. Day -30=score before pneumonia; day 0=start of
treatment; day 10=test of cure; day 28=end of follow-up
Copyright ©2006 BMJ Publishing Group Ltd.
Fig 3 Proportion of patients considered clinical successes in intention to treat population. Day 3=day of randomisation
Peut-on traiter les pneumonies aiguës communautaires hospitalisées par 3 jours de β-
lactamines ?
A. Dinh*1, J. Dumoulin2, C. Duran1, B. Davido1, A. Lagrange1, D. Benhamou3, M. C. Dombret4, B. Renaud5, Y. E. Claessens6, J. Labarère7, B. Philippe8, J. F. Boitiaux8, J. P. Bedos9, J.
Ropers10, T. Chinet2, A. C. Crémieux1,11
1 Unité de Maladies Infectieuses, Hôpital Raymond Poincaré, HU PIFO, APHP, UVSQ, Garches, France ; 2 Service de Pneumologie, Hôpital Ambroise Paré, HU PIFO, APHP, UVSQ, Boulogne-Billancourt, France ; 3 Service de Pneumologie, CHU Bois-Guillaume, Rouen, France ; 4 Service
de Pneumologie, Hôpital Bichât-Claude Bernard, HU PNVS, APHP, Paris, France ; 5 Service des Urgences, Hôpital Cochin, HUPC, APHP, Paris, France ; 6 Service des Urgences, Centre Hospitalier Princesse Grace, Monaco, Monaco ; 7 Unité Epidémiologie, CHU de Grenoble, Grenoble,
France ; 8 Service de Pneumologie, Centre Hospitalier René Dubos, Pontoise, France ; 9 Service de Réanimation, Hôpital André Mignot, CH de Versailles, Le Chesnay, France ; 10 URC PO, GH HU PIFO, Boulogne-Billancourt, France ; 11 Service de Maladies Infectieuses, Hôpital Saint-Louis,
HU SLLFW, APHP, Paris, France
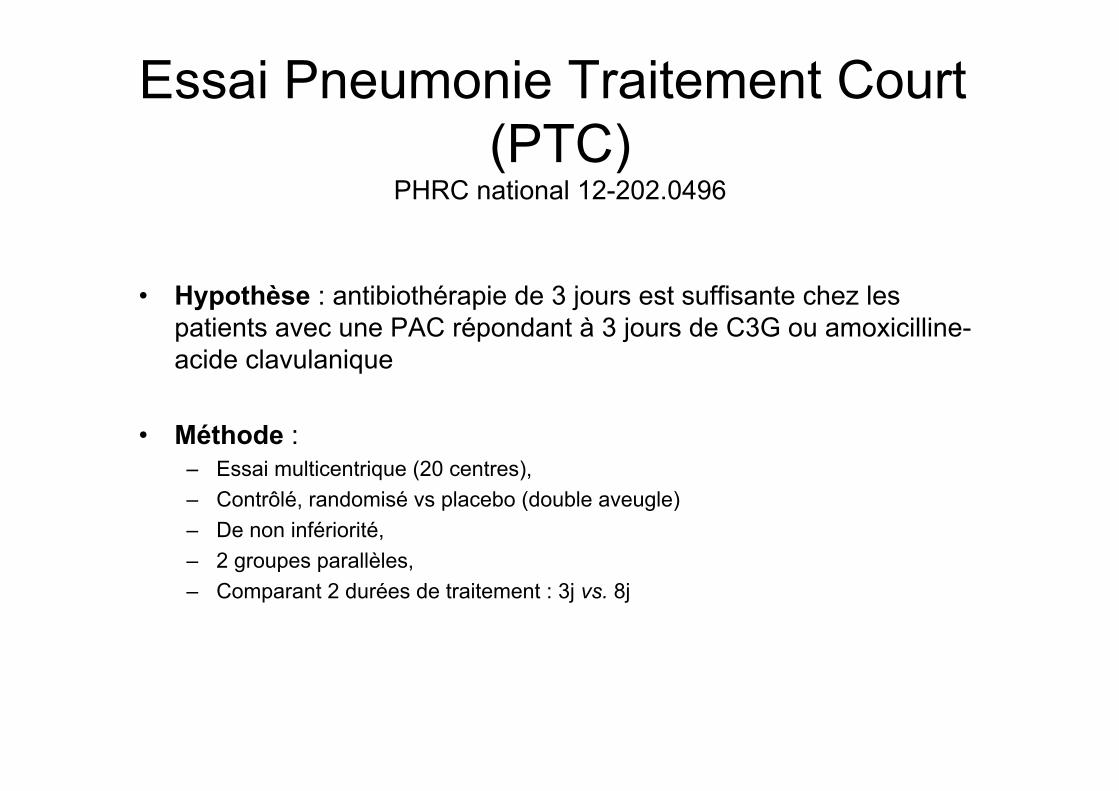
Essai Pneumonie Traitement Court (PTC)
PHRC national 12-202.0496
• Hypothèse : antibiothérapie de 3 jours est suffisante chez les patients avec une PAC répondant à 3 jours de C3G ou amoxicilline-acide clavulanique
• Méthode : – Essai multicentrique (20 centres), – Contrôlé, randomisé vs placebo (double aveugle) – De non infériorité, – 2 groupes parallèles, – Comparant 2 durées de traitement : 3j vs. 8j
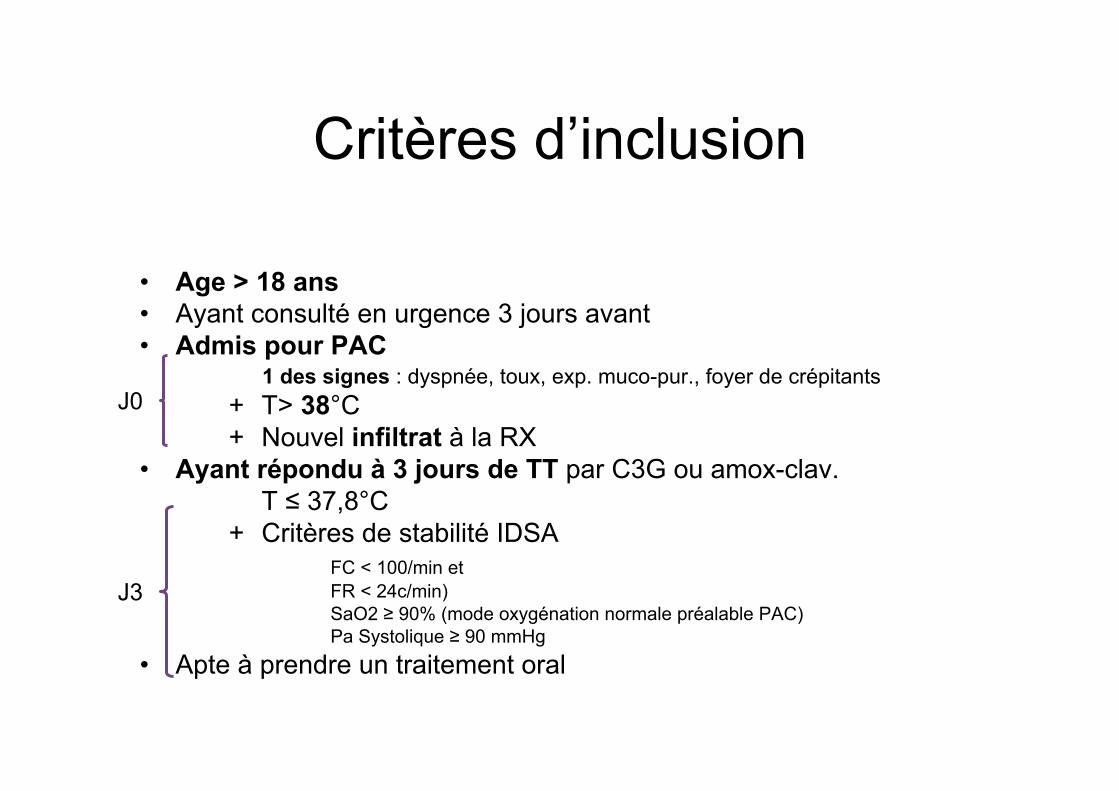
Critères d’inclusion
• Age > 18 ans • Ayant consulté en urgence 3 jours avant • Admis pour PAC
1 des signes : dyspnée, toux, exp. muco-pur., foyer de crépitants + T> 38°C + Nouvel infiltrat à la RX
• Ayant répondu à 3 jours de TT par C3G ou amox-clav. T ≤ 37,8°C
+ Critères de stabilité IDSA FC < 100/min et FR < 24c/min) SaO2 ≥ 90% (mode oxygénation normale préalable PAC) Pa Systolique ≥ 90 mmHg
• Apte à prendre un traitement oral
J0
J3
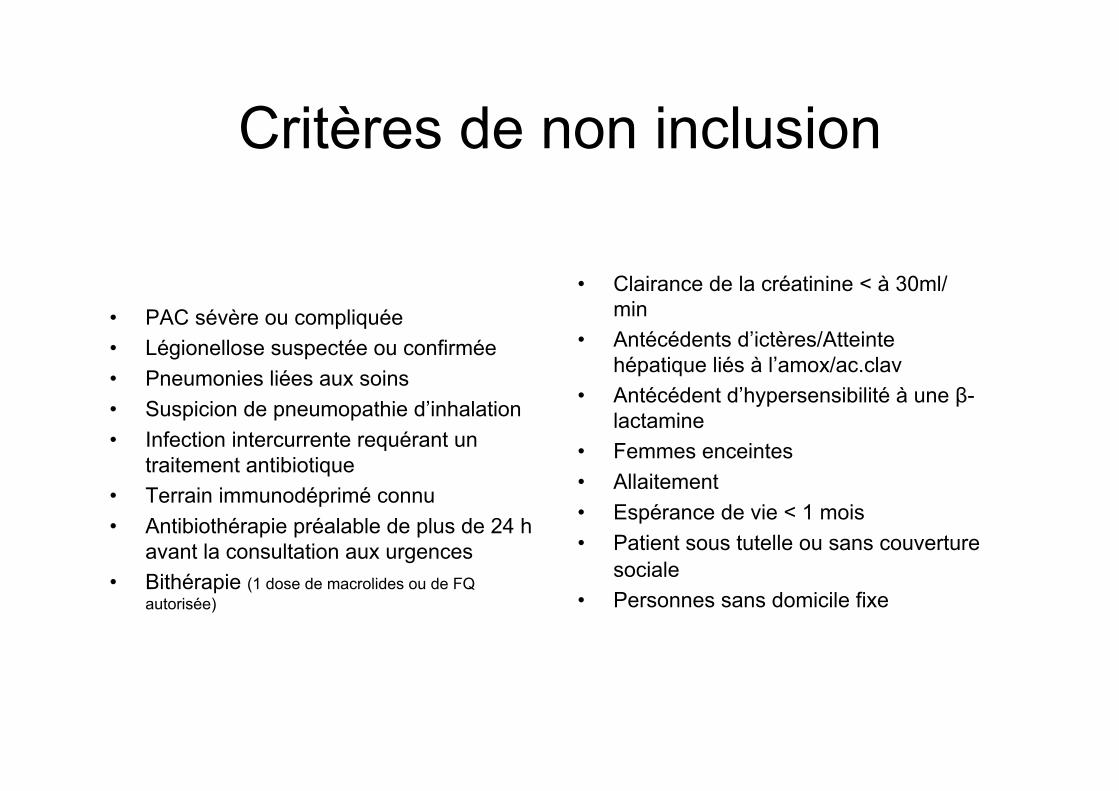
Critères de non inclusion
• PAC sévère ou compliquée • Légionellose suspectée ou confirmée • Pneumonies liées aux soins • Suspicion de pneumopathie d’inhalation • Infection intercurrente requérant un
traitement antibiotique • Terrain immunodéprimé connu • Antibiothérapie préalable de plus de 24 h
avant la consultation aux urgences • Bithérapie (1 dose de macrolides ou de FQ
autorisée)
• Clairance de la créatinine < à 30ml/min
• Antécédents d’ictères/Atteinte hépatique liés à l’amox/ac.clav
• Antécédent d’hypersensibilité à une β-lactamine
• Femmes enceintes • Allaitement • Espérance de vie < 1 mois • Patient sous tutelle ou sans couverture
sociale • Personnes sans domicile fixe
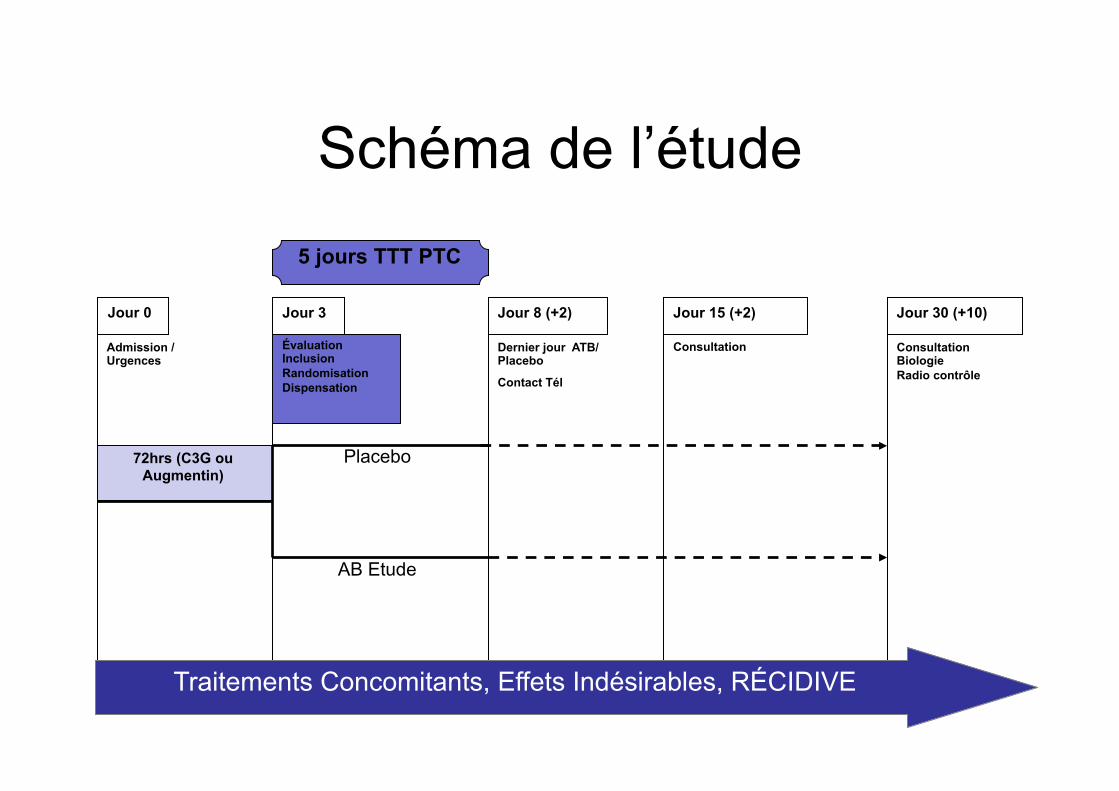
Schéma de l’étude
Placebo
AB Etude
Traitements Concomitants, Effets Indésirables, RÉCIDIVE
5 jours TTT PTC
Évaluation Inclusion Randomisation Dispensation
Admission /Urgences
Dernier jour ATB/Placebo
Contact Tél
Consultation Consultation Biologie Radio contrôle
Jour 0 Jour 3 Jour 8 (+2) Jour 15 (+2) Jour 30 (+10)
72hrs (C3G ou Augmentin)
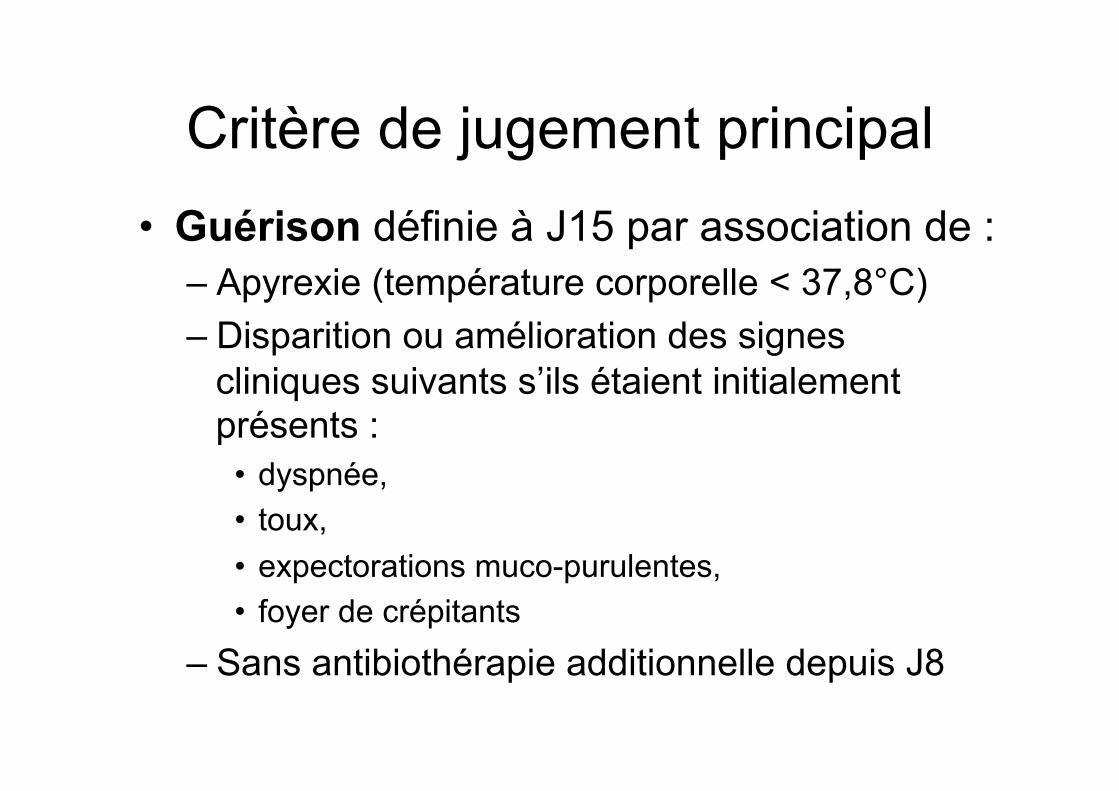
Critère de jugement principal • Guérison définie à J15 par association de :
– Apyrexie (température corporelle < 37,8°C) – Disparition ou amélioration des signes
cliniques suivants s’ils étaient initialement présents :
• dyspnée, • toux, • expectorations muco-purulentes, • foyer de crépitants
– Sans antibiothérapie additionnelle depuis J8
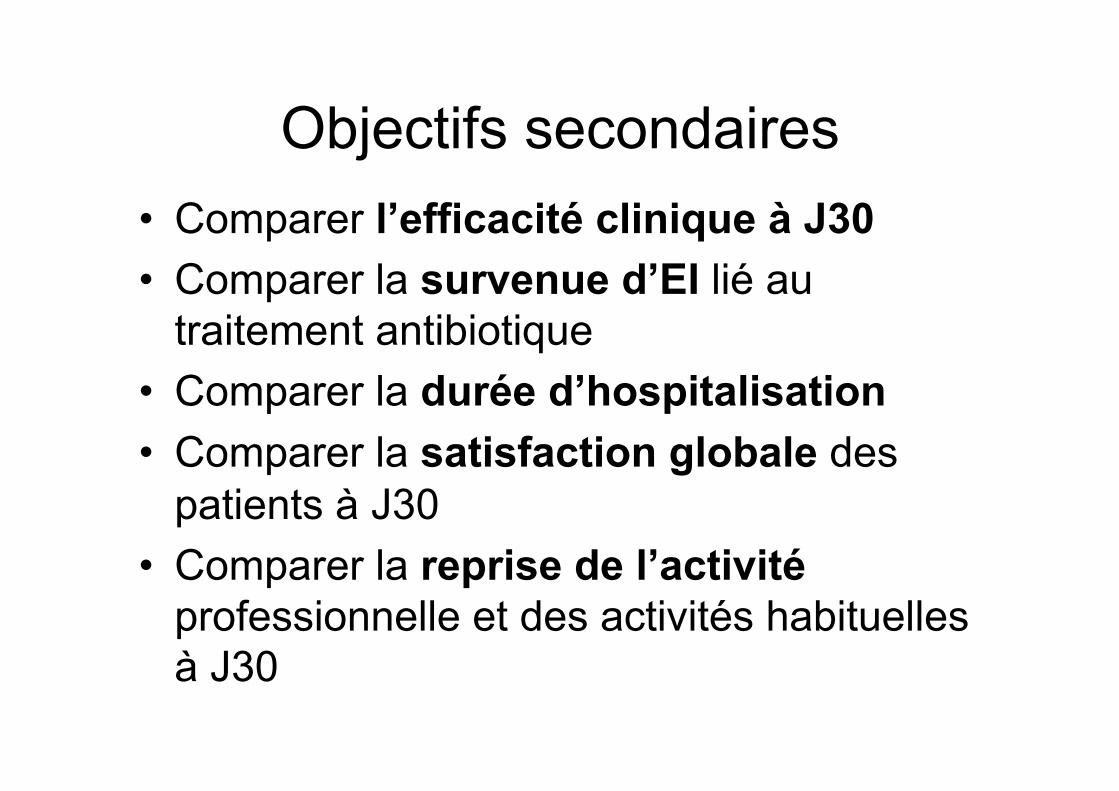
Objectifs secondaires • Comparer l’efficacité clinique à J30 • Comparer la survenue d’EI lié au
traitement antibiotique • Comparer la durée d’hospitalisation • Comparer la satisfaction globale des
patients à J30 • Comparer la reprise de l’activité
professionnelle et des activités habituelles à J30
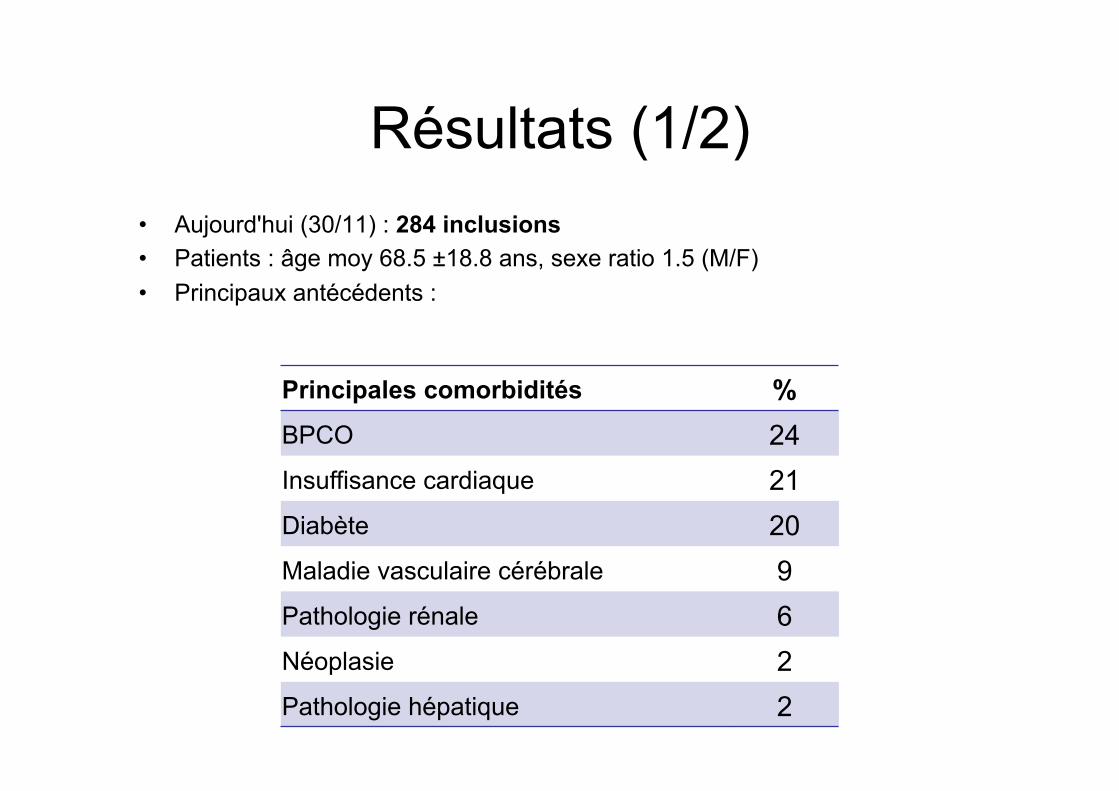
Résultats (1/2) • Aujourd'hui (30/11) : 284 inclusions • Patients : âge moy 68.5 ±18.8 ans, sexe ratio 1.5 (M/F) • Principaux antécédents :
Principales comorbidités %BPCO 24Insuffisance cardiaque 21Diabète 20Maladie vasculaire cérébrale 9Pathologie rénale 6Néoplasie 2Pathologie hépatique 2
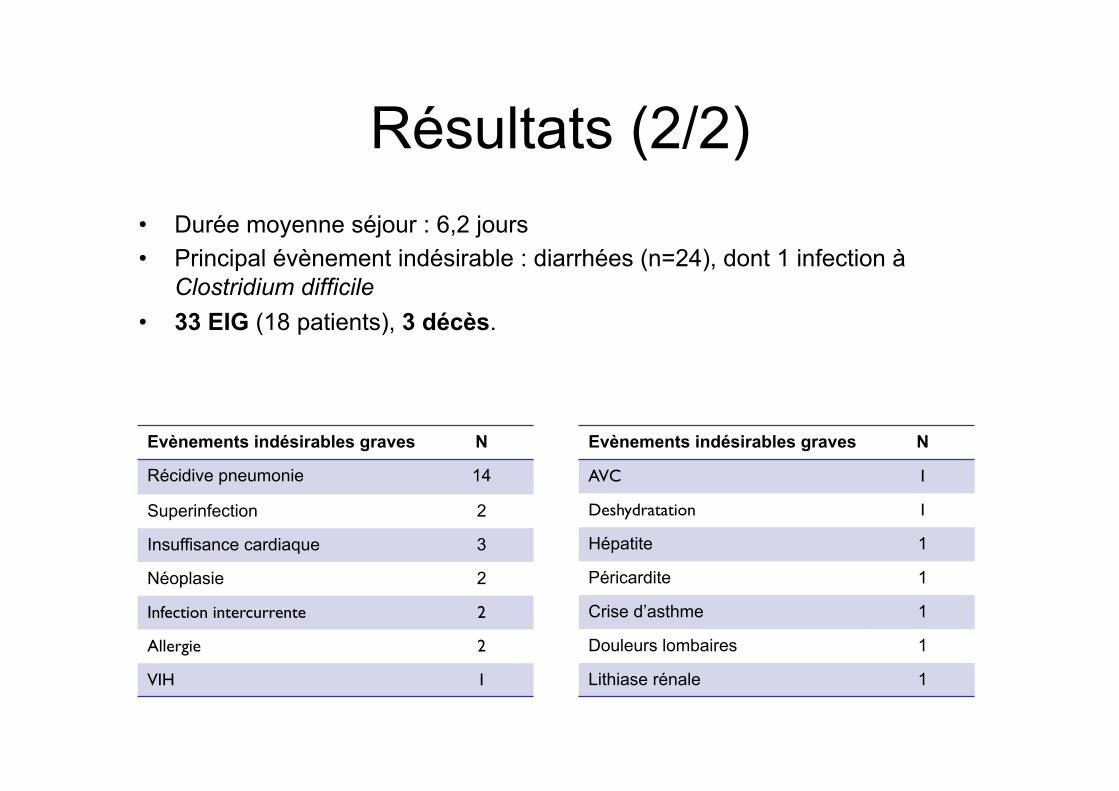
Résultats (2/2) • Durée moyenne séjour : 6,2 jours • Principal évènement indésirable : diarrhées (n=24), dont 1 infection à
Clostridium difficile • 33 EIG (18 patients), 3 décès.
Evènements indésirables graves N
Récidive pneumonie 14
Superinfection 2
Insuffisance cardiaque 3
Néoplasie 2
Infection intercurrente 2
Allergie 2
VIH 1
Evènements indésirables graves N
AVC 1
Deshydratation 1
Hépatite 1
Péricardite 1
Crise d’asthme 1
Douleurs lombaires 1
Lithiase rénale 1
Comité Indépendant de Surveillance
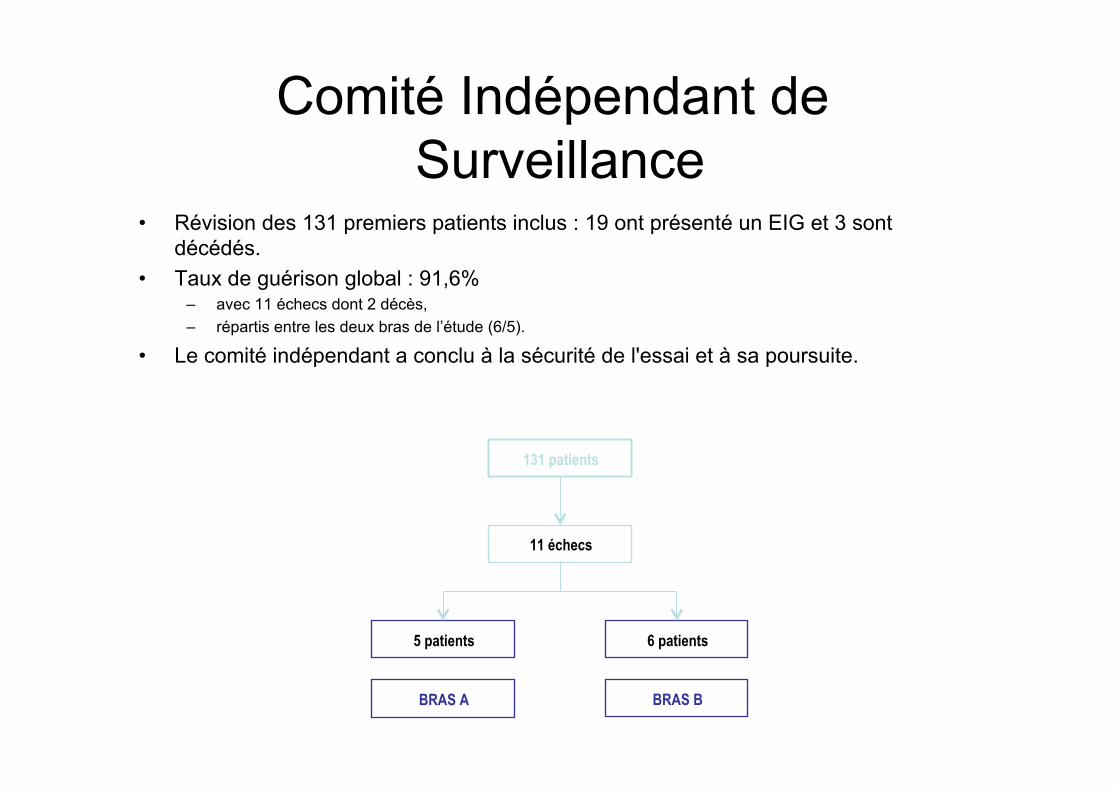
• Révision des 131 premiers patients inclus : 19 ont présenté un EIG et 3 sont décédés.
• Taux de guérison global : 91,6% – avec 11 échecs dont 2 décès, – répartis entre les deux bras de l’étude (6/5).
• Le comité indépendant a conclu à la sécurité de l'essai et à sa poursuite.
131 patients
11 échecs
5 patients
BRAS A
6 patients
BRAS B
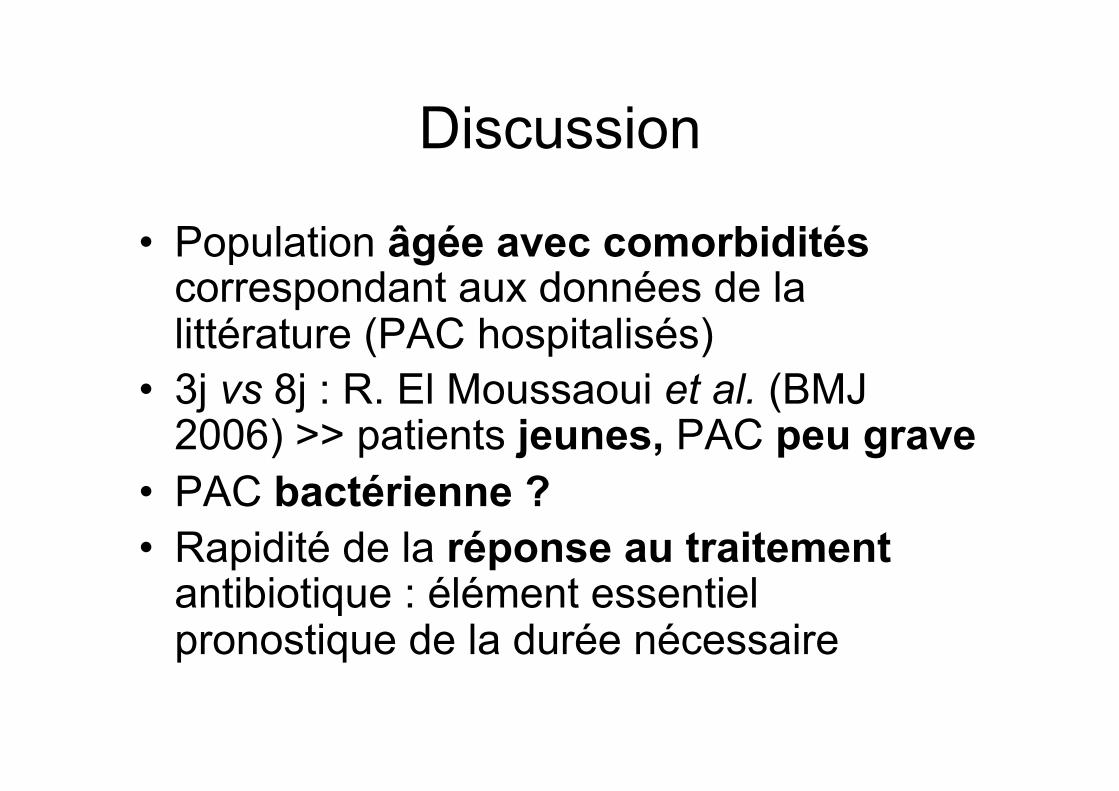
Discussion
• Population âgée avec comorbidités correspondant aux données de la littérature (PAC hospitalisés)
• 3j vs 8j : R. El Moussaoui et al. (BMJ 2006) >> patients jeunes, PAC peu grave
• PAC bactérienne ? • Rapidité de la réponse au traitement
antibiotique : élément essentiel pronostique de la durée nécessaire
Conclusion

Vers une durée individualisée ?
Copyright 2016 American Medical Association. All rights reserved.
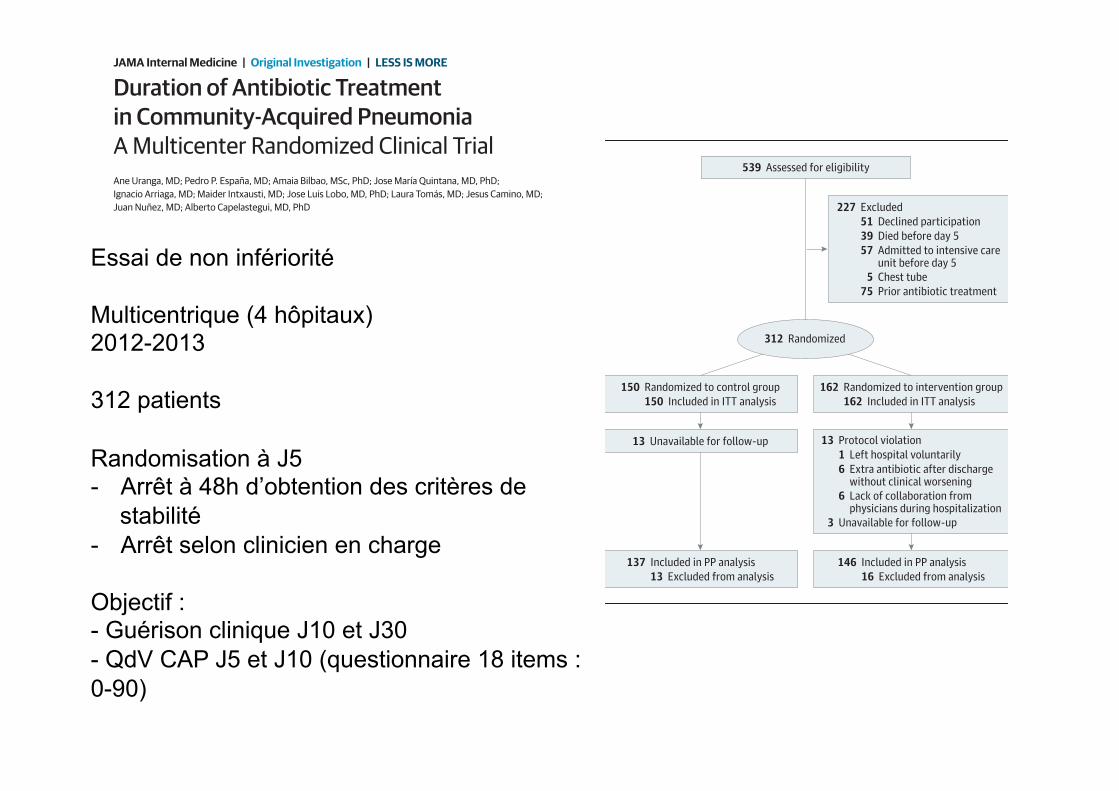
Duration of Antibiotic Treatmentin Community-Acquired PneumoniaA Multicenter Randomized Clinical Trial
Ane Uranga, MD; Pedro P. España, MD; Amaia Bilbao, MSc, PhD; Jose María Quintana, MD, PhD;
Ignacio Arriaga, MD; Maider Intxausti, MD; Jose Luis Lobo, MD, PhD; Laura Tomás, MD; Jesus Camino, MD;
Juan Nuñez, MD; Alberto Capelastegui, MD, PhD
IMPORTANCE The optimal duration of antibiotic treatment for community-acquired
pneumonia (CAP) has not been well established.
OBJECTIVE To validate Infectious Diseases Society of America/American Thoracic Society
guidelines for duration of antibiotic treatment in hospitalized patients with CAP.
DESIGN, SETTING, AND PARTICIPANTS This study was a multicenter, noninferiority randomized
clinical trial performed at 4 teaching hospitals in Spain from January 1, 2012, through August
31, 2013. A total of 312 hospitalized patients diagnosed as having CAP were studied. Data
analysis was performed from January 1, 2014, through February 28, 2015.
INTERVENTIONS Patients were randomized at day 5 to an intervention or control group.
Those in the intervention group were treated with antibiotics for a minimum of 5 days, and
the antibiotic treatment was stopped at this point if their body temperature was 37.8°C or less
for 48 hours and they had no more than 1 CAP-associated sign of clinical instability. Duration
of antibiotic treatment in the control group was determined by physicians.
MAIN OUTCOMES AND MEASURES Clinical success rate at days 10 and 30 since admission and
CAP-related symptoms at days 5 and 10 measured with the 18-item CAP symptom
questionnaire score range, 0-90; higher scores indicate more severe symptoms.
RESULTS Of the 312 patients included, 150 and 162 were randomized to the control and
intervention groups, respectively. The mean (SD) age of the patients was 66.2 (17.9) years
and 64.7 (18.7) years in the control and intervention groups, respectively. There were 95 men
(63.3%) and 55 women (36.7%) in the control group and 101 men (62.3%) and 61 women
(37.7%) in the intervention group. In the intent-to-treat analysis, clinical success was 48.6%
(71 of 150) in the control group and 56.3% (90 of 162) in the intervention group at day 10
(P = .18) and 88.6% (132 of 150) in the control group and 91.9% (147 of 162) in the
intervention group at day 30 (P = .33). The mean (SD) CAP symptom questionnaire scores
were 24.7 (11.4) vs 27.2 (12.5) at day 5 (P = .10) and 18.6 (9.0) vs 17.9 (7.6) at day 10 (P = .69).
In the per-protocol analysis, clinical success was 50.4% (67 of 137) in the control group and
59.7% (86 of 146) in the intervention group at day 10 (P = .12) and 92.7% (126 of 137) in the
control group and 94.4% (136 of 146) in the intervention group at day 30 (P = .54). The mean
(SD) CAP symptom questionnaire scores were 24.3 (11.4) vs 26.6 (12.1) at day 5 (P = .16) and
18.1 (8.5) vs 17.6 (7.4) at day 10 (P = .81).
CONCLUSIONS AND RELEVANCE The Infectious Diseases Society of America/American
Thoracic Society recommendations for duration of antibiotic treatment based on clinical
stability criteria can be safely implemented in hospitalized patients with CAP.
TRIAL REGISTRATION clinicaltrialsregister.eu Identifier: 2011-001067-51
JAMA Intern Med. 2016;176(9):1257-1265. doi:10.1001/jamainternmed.2016.3633
Published online July 25, 2016.
Editorial page 1254
Supplemental content at
jamainternalmedicine.com
Author Affiliations: Department of
Pneumology, Galdakao-Usansolo
Hospital, Galdakao, Bizkaia, Spain
(Uranga, España, Capelastegui);
Research Unit, Basurto University
Hospital, Bilbao, Bizkaia, Spain
(Bilbao); Research Unit, Galdakao-
Usansolo Hospital, Galdakao, Bizkaia,
Spain (Quintana); Department of
Pneumology, Basurto University
Hospital, Bilbao, Bizkaia, Spain
(Arriaga, Intxausti); Department of
Pneumology, Alava University
Hospital, Vitoria, Alava, Spain (Lobo,
Tomás); Department of Pneumology,
San Eloy Hospital, Barakaldo, Bizkaia,
Spain (Camino, Nuñez).
Corresponding Author: Ane Uranga,
MD, Department of Pneumology,
Galdakao-Usansolo Hospital, Barrio
Labeaga s/n, 48960, Galdakao,
Bizkaia, Spain
Research
JAMA Internal Medicine | Original Investigation | LESS IS MORE
(Reprinted) 1257
Copyright 2016 American Medical Association. All rights reserved.
Essai de non infériorité Multicentrique (4 hôpitaux) 2012-2013 312 patients Randomisation à J5 - Arrêt à 48h d’obtention des critères de
stabilité - Arrêt selon clinicien en charge Objectif : - Guérison clinique J10 et J30 - QdV CAP J5 et J10 (questionnaire 18 items : 0-90)
Copyright 2016 American Medical Association. All rights reserved.
SAS statistical software for Windows, version 9.2 (SAS Insti-
tute Inc), or S-Plus 2000 (MathSoft Inc).
Results
A total of 539 patients were assessed for eligibility (Figure). Be-
fore randomization, 227 patients did not meet the selection
criteria, leaving 312 patients. Of these, 150 patients were ran-
domized to the control group and 162 to the intervention group.
The mean (SD) age of the patients was 66.2 (17.9) years and 64.7
(18.7) years in the control and intervention groups, respec-
tively. There were 95 men (63.3%) and 55 women (36.7%) in
the control group and 101 men (62.3%) and 61 women (37.7%)
in the intervention group. Thirteen patients were later ex-
cluded for protocol violation (6 being treated with extra anti-
biotics within <1 week after discharge by their primary care phy-
sician without evidence of clinical worsening and 1 leaving the
hospital voluntarily, whereas in 6 antibiotic treatment was
not stopped during hospitalization despite clinical stability
because of lack of collaboration by their physicians). In addi-
tion, 13 and 3 patients in the control and intervention groups,
respectively, were unavailable for the late follow-up. How-
ever, the status of these 16 patients was checked through
electronic medical records, and all but 1 was alive at late follow-
up, whereas no information was found for the other patient.
No differences were found in terms of age, sex, comorbidi-
ties, Katz Index, and severity of disease between those who
violated the protocol or were unavailable for follow-up and
those who did not.
Baseline demographics and characteristics were similar in
the control and intervention groups (Table 1). Mean (SD) PSI
scores were 83.7 (33.7) and 81.8 (33.8) in the control and in-
tervention groups, respectively (P = .55). Vital signs at day 5
were similar in both groups (eTable 1 in Supplement 2). Nearly
80% of patients in both groups underwent treatment with qui-
nolones, whereas less than 10% were treated with a β-lactam
plus macrolide. Etiologic diagnosis was made in 35 individu-
als (26.5%) in the control group and 28 (20.5%) in the inter-
vention group (P = .25) (eTable 2 in Supplement 2).
Primary OutcomesClinical success rate at day 10 was 48.6% (71 of 150) in the con-
trol group and 56.3% (90 of 162) in the intervention group
(P = .18) in the intent-to-treat analysis and 50.4% (67 of 137)
in the control group and 59.7% (86 of 146) in the intervention
Figure. Study Flow Diagram
539 Assessed for eligibility
227 Excluded
51 Declined participation
39 Died before day 5
57 Admitted to intensive careunit before day 5
5 Chest tube
75 Prior antibiotic treatment
312 Randomized
137 Included in PP analysis
13 Excluded from analysis
146 Included in PP analysis
16 Excluded from analysis
150 Randomized to control group
150 Included in ITT analysis
162 Randomized to intervention group
162 Included in ITT analysis
13 Protocol violation
1 Left hospital voluntarily
6 Extra antibiotic after dischargewithout clinical worsening
6 Lack of collaboration fromphysicians during hospitalization
3 Unavailable for follow-up
13 Unavailable for follow-up
ITT indicates intent to treat; PP, per protocol.
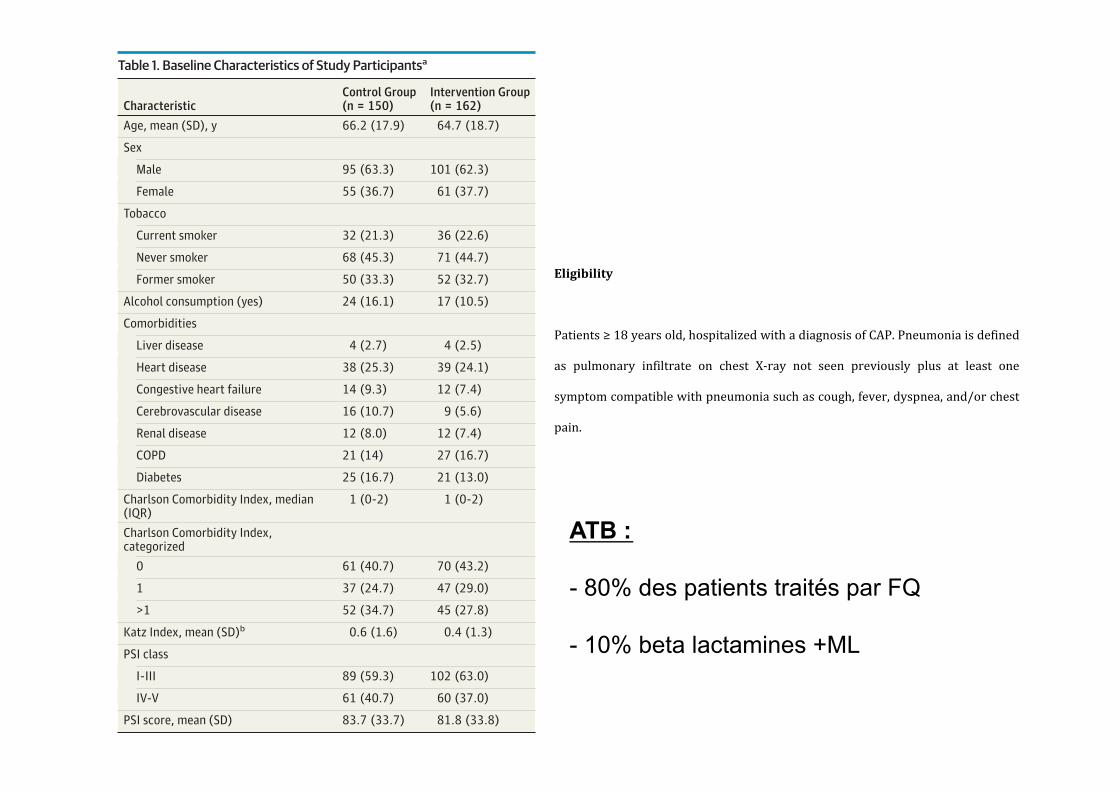
Table 1. Baseline Characteristics of Study Participantsa
CharacteristicControl Group(n = 150)
Intervention Group(n = 162)
Age, mean (SD), y 66.2 (17.9) 64.7 (18.7)
Sex
Male 95 (63.3) 101 (62.3)
Female 55 (36.7) 61 (37.7)
Tobacco
Current smoker 32 (21.3) 36 (22.6)
Never smoker 68 (45.3) 71 (44.7)
Former smoker 50 (33.3) 52 (32.7)
Alcohol consumption (yes) 24 (16.1) 17 (10.5)
Comorbidities
Liver disease 4 (2.7) 4 (2.5)
Heart disease 38 (25.3) 39 (24.1)
Congestive heart failure 14 (9.3) 12 (7.4)
Cerebrovascular disease 16 (10.7) 9 (5.6)
Renal disease 12 (8.0) 12 (7.4)
COPD 21 (14) 27 (16.7)
Diabetes 25 (16.7) 21 (13.0)
Charlson Comorbidity Index, median(IQR)
1 (0-2) 1 (0-2)
Charlson Comorbidity Index,categorized
0 61 (40.7) 70 (43.2)
1 37 (24.7) 47 (29.0)
>1 52 (34.7) 45 (27.8)
Katz Index, mean (SD)b 0.6 (1.6) 0.4 (1.3)
PSI class
I-III 89 (59.3) 102 (63.0)
IV-V 61 (40.7) 60 (37.0)
PSI score, mean (SD) 83.7 (33.7) 81.8 (33.8)
Abbreviations: COPD, chronic obstructive pulmonary disease; IQR, interquartile
range; PSI, Pneumonia Severity Index.a Data are presented as number (percentage) of study participants unless
otherwise indicated. Percentages exclude patients with missing data. The
percentage of missing data was 0% for all variables, except for the following:
tobacco, 0.9%; alcohol consumption, 0.3%; and Katz Index, 0.9%.b The Katz index assesses patient independence in activities of daily living, with
higher values indicating more dependence (range, 0-6).
Research Original Investigation Duration of Antibiotic Treatment in Community-Acquired Pneumonia
1260 JAMA Internal Medicine September 2016 Volume 176, Number 9 (Reprinted) jamainternalmedicine.com
Copyright 2016 American Medical Association. All rights reserved.
Copyright 2016 American Medical Association. All rights reserved.
SAS statistical software for Windows, version 9.2 (SAS Insti-
tute Inc), or S-Plus 2000 (MathSoft Inc).
Results
A total of 539 patients were assessed for eligibility (Figure). Be-
fore randomization, 227 patients did not meet the selection
criteria, leaving 312 patients. Of these, 150 patients were ran-
domized to the control group and 162 to the intervention group.
The mean (SD) age of the patients was 66.2 (17.9) years and 64.7
(18.7) years in the control and intervention groups, respec-
tively. There were 95 men (63.3%) and 55 women (36.7%) in
the control group and 101 men (62.3%) and 61 women (37.7%)
in the intervention group. Thirteen patients were later ex-
cluded for protocol violation (6 being treated with extra anti-
biotics within <1 week after discharge by their primary care phy-
sician without evidence of clinical worsening and 1 leaving the
hospital voluntarily, whereas in 6 antibiotic treatment was
not stopped during hospitalization despite clinical stability
because of lack of collaboration by their physicians). In addi-
tion, 13 and 3 patients in the control and intervention groups,
respectively, were unavailable for the late follow-up. How-
ever, the status of these 16 patients was checked through
electronic medical records, and all but 1 was alive at late follow-
up, whereas no information was found for the other patient.
No differences were found in terms of age, sex, comorbidi-
ties, Katz Index, and severity of disease between those who
violated the protocol or were unavailable for follow-up and
those who did not.
Baseline demographics and characteristics were similar in
the control and intervention groups (Table 1). Mean (SD) PSI
scores were 83.7 (33.7) and 81.8 (33.8) in the control and in-
tervention groups, respectively (P = .55). Vital signs at day 5
were similar in both groups (eTable 1 in Supplement 2). Nearly
80% of patients in both groups underwent treatment with qui-
nolones, whereas less than 10% were treated with a β-lactam
plus macrolide. Etiologic diagnosis was made in 35 individu-
als (26.5%) in the control group and 28 (20.5%) in the inter-
vention group (P = .25) (eTable 2 in Supplement 2).
Primary OutcomesClinical success rate at day 10 was 48.6% (71 of 150) in the con-
trol group and 56.3% (90 of 162) in the intervention group
(P = .18) in the intent-to-treat analysis and 50.4% (67 of 137)
in the control group and 59.7% (86 of 146) in the intervention
Figure. Study Flow Diagram
539 Assessed for eligibility
227 Excluded
51 Declined participation
39 Died before day 5
57 Admitted to intensive careunit before day 5
5 Chest tube
75 Prior antibiotic treatment
312 Randomized
137 Included in PP analysis
13 Excluded from analysis
146 Included in PP analysis
16 Excluded from analysis
150 Randomized to control group
150 Included in ITT analysis
162 Randomized to intervention group
162 Included in ITT analysis
13 Protocol violation
1 Left hospital voluntarily
6 Extra antibiotic after dischargewithout clinical worsening
6 Lack of collaboration fromphysicians during hospitalization
3 Unavailable for follow-up
13 Unavailable for follow-up
ITT indicates intent to treat; PP, per protocol.
Table 1. Baseline Characteristics of Study Participantsa
CharacteristicControl Group(n = 150)
Intervention Group(n = 162)
Age, mean (SD), y 66.2 (17.9) 64.7 (18.7)
Sex
Male 95 (63.3) 101 (62.3)
Female 55 (36.7) 61 (37.7)
Tobacco
Current smoker 32 (21.3) 36 (22.6)
Never smoker 68 (45.3) 71 (44.7)
Former smoker 50 (33.3) 52 (32.7)
Alcohol consumption (yes) 24 (16.1) 17 (10.5)
Comorbidities
Liver disease 4 (2.7) 4 (2.5)
Heart disease 38 (25.3) 39 (24.1)
Congestive heart failure 14 (9.3) 12 (7.4)
Cerebrovascular disease 16 (10.7) 9 (5.6)
Renal disease 12 (8.0) 12 (7.4)
COPD 21 (14) 27 (16.7)
Diabetes 25 (16.7) 21 (13.0)
Charlson Comorbidity Index, median(IQR)
1 (0-2) 1 (0-2)
Charlson Comorbidity Index,categorized
0 61 (40.7) 70 (43.2)
1 37 (24.7) 47 (29.0)
>1 52 (34.7) 45 (27.8)
Katz Index, mean (SD)b 0.6 (1.6) 0.4 (1.3)
PSI class
I-III 89 (59.3) 102 (63.0)
IV-V 61 (40.7) 60 (37.0)
PSI score, mean (SD) 83.7 (33.7) 81.8 (33.8)
Abbreviations: COPD, chronic obstructive pulmonary disease; IQR, interquartile
range; PSI, Pneumonia Severity Index.a Data are presented as number (percentage) of study participants unless
otherwise indicated. Percentages exclude patients with missing data. The
percentage of missing data was 0% for all variables, except for the following:
tobacco, 0.9%; alcohol consumption, 0.3%; and Katz Index, 0.9%.b The Katz index assesses patient independence in activities of daily living, with
higher values indicating more dependence (range, 0-6).
Research Original Investigation Duration of Antibiotic Treatment in Community-Acquired Pneumonia
1260 JAMA Internal Medicine September 2016 Volume 176, Number 9 (Reprinted) jamainternalmedicine.com
Copyright 2016 American Medical Association. All rights reserved.
StudyDesign Allocation Randomized
EndpointClassification EfficacyStudy
)nterventionModel ParallelAssignment
Masking DoubleBlind Subject Caregiver )nvestigator OutcomesAssessor
Interventiongroup:
Patientsrandomizedatday toan interventionoracontrolgroup Those in the
interventiongroupare treatedwithantibiotics foraminimumof daysand the
antibiotic treatment is stoppedat thispoint if theirbody temperature is C
for hours and they have no more than one CAP associated sign of clinical
instability defined as systolic blood pressure mm(g heart rate
beats min respiratoryrate breaths min arterialoxygensaturation or
PaO mm(ginroomair
Controlgroup:
Duration of antibiotics in the control group is determined by physicians as in
routineclinicalpractice
Eligibility
Patients yearsold hospitalizedwithadiagnosisofCAP Pneumoniaisdefined
as pulmonary infiltrate on chest X ray not seen previously plus at least one
symptomcompatiblewithpneumoniasuchascough fever dyspnea and orchest
pain
Exclusioncriteria
ATB :
- 80% des patients traités par FQ
- 10% beta lactamines +ML
Copyright 2016 American Medical Association. All rights reserved.
Multilevel analyses with mixed models revealed that, even
including a hospital-level random effect, differences between
the intervention and control groups in clinical success at days
10 or 30 were not significant (odds ratio, 1.54;P = .11; and odds
ratio, 1.38; P = .52, respectively, considering the control group
as the reference group). Regarding the CAP symptom question-
naire, we found significant differences between the 2 groups at
day 5, with scores being higher in the intervention group
(β = 2.71, P = .0497) but did not find significant differences at
day 10 (β = 0.12, P = .89).
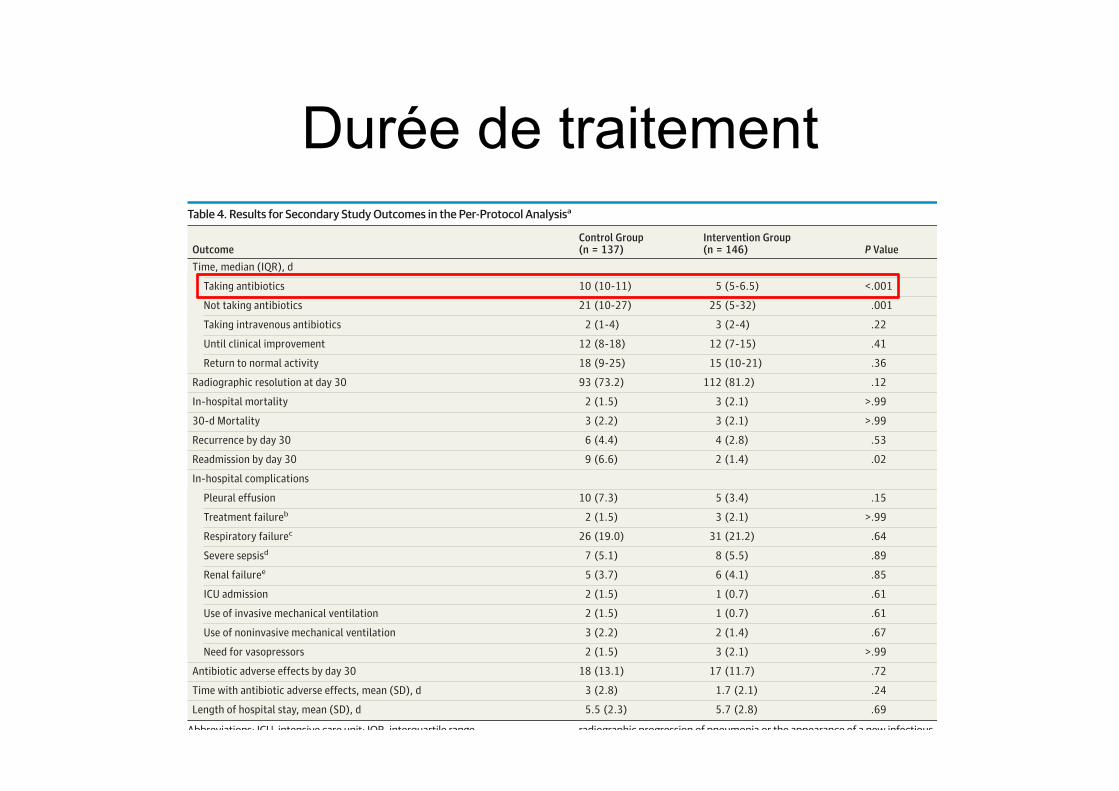
Secondary OutcomesSecondary outcomes in the intent-to treat analysis are sum-
marized in eTable 5 in Supplement 2. Time receiving antibi-
otic treatment was significantly longer in the control than the
intervention group (median, 10 days [interquartile range, 10-
11] vs 5 days [interquartile range, 5-6.5], respectively;P < .001).
Four patients (2.9%) and 101 patients (70.1%) from the con-
trol and intervention groups, respectively, were receiving an-
tibiotics for only 5 days (P < .001). No significant differences
were found between groups in time until clinical improve-
ment and days to return to normal activity measured at day
30, radiographic resolution at day 30, or adverse effects by day
30 (Table 4). Furthermore, no significant differences were
found between groups using Kaplan-Meier survival curves of
return to normal activity (eFigure in the Supplement 2) until
day 30 (mean time to return to normal activity, 16.6 and 15.4
days in the control and intervention groups, respectively; log-
rank test, P = .16).
In-hospital and 30-day mortality, in-hospital complica-
tions, recurrence by day 30, and length of hospital stay were
similar in the 2 groups (Table 4). However, readmission by day
30 was significantly more common in the control group than in
the intervention group (9 [6.6%] vs 2 [1.4%]; P = .02). Calling
Table 4. Results for Secondary Study Outcomes in the Per-Protocol Analysisa
OutcomeControl Group(n = 137)
Intervention Group(n = 146) P Value
Time, median (IQR), d
Taking antibiotics 10 (10-11) 5 (5-6.5) <.001
Not taking antibiotics 21 (10-27) 25 (5-32) .001
Taking intravenous antibiotics 2 (1-4) 3 (2-4) .22
Until clinical improvement 12 (8-18) 12 (7-15) .41
Return to normal activity 18 (9-25) 15 (10-21) .36
Radiographic resolution at day 30 93 (73.2) 112 (81.2) .12
In-hospital mortality 2 (1.5) 3 (2.1) >.99
30-d Mortality 3 (2.2) 3 (2.1) >.99
Recurrence by day 30 6 (4.4) 4 (2.8) .53
Readmission by day 30 9 (6.6) 2 (1.4) .02
In-hospital complications
Pleural effusion 10 (7.3) 5 (3.4) .15
Treatment failureb 2 (1.5) 3 (2.1) >.99
Respiratory failurec 26 (19.0) 31 (21.2) .64
Severe sepsisd 7 (5.1) 8 (5.5) .89
Renal failuree 5 (3.7) 6 (4.1) .85
ICU admission 2 (1.5) 1 (0.7) .61
Use of invasive mechanical ventilation 2 (1.5) 1 (0.7) .61
Use of noninvasive mechanical ventilation 3 (2.2) 2 (1.4) .67
Need for vasopressors 2 (1.5) 3 (2.1) >.99
Antibiotic adverse effects by day 30 18 (13.1) 17 (11.7) .72
Time with antibiotic adverse effects, mean (SD), d 3 (2.8) 1.7 (2.1) .24
Length of hospital stay, mean (SD), d 5.5 (2.3) 5.7 (2.8) .69
Abbreviations: ICU, intensive care unit; IQR, interquartile range.a Data are presented as number (percentage) of study participants unless
otherwise indicated. Percentages exclude patients with missing data. The
percentage of missing data was 0% for all variables, except for the following:
days taking antibiotics, days taking intravenous antibiotics, and days to return
to normal activity, 1.4%; days until clinical improvement, 7.0%; radiographic
resolution at day 30, 6.3%; recurrence by day 30, readmission by day 30,
treatment failure, renal failure, ICU admission, and antibiotic adverse effects
by day 30, 0.3%; and use of mechanical ventilation and need for vasopressors,
0.7%.b Treatment failure was defined as clinical deterioration based on the presence
of any of the following: hemodynamic instability, demonstrated respiratory
failure or the appearance of it, need for mechanical ventilation, demonstrated
radiographic progression of pneumonia or the appearance of a new infectious
foci, and absence or delay in achieving clinical stability after first 72 hours.c Respiratory failure was defined as PaO2 to fraction of inspired oxygen ratio less
than 250 mm Hg.d Severe sepsis was defined as sepsis associated with organ dysfunction and
perfusion abnormalities. One of the following criteria had to be met: pH less
than 7.30, systolic blood pressure less than 90 mm Hg, pneumonia-associated
altered mental status, PaO2 to fraction of inspired oxygen ratio less than
250 mm Hg, acute renal failure (creatinine level >2 mg/dL [to convert to
micromoles per liter, multiply by 88.4]), disseminated intravascular
coagulopathy, or hematocrit less than 25%.e Renal failure was defined as a creatinine level greater than 2 mg/dL.
Research Original Investigation Duration of Antibiotic Treatment in Community-Acquired Pneumonia
1262 JAMA Internal Medicine September 2016 Volume 176, Number 9 (Reprinted) jamainternalmedicine.com
Copyright 2016 American Medical Association. All rights reserved.
Durée de traitement
Copyright 2016 American Medical Association. All rights reserved.
group (P = .12) in the per-protocol analysis. At day 30, it im-
proved to 88.6% (132 of 150) and 91.9% (147 of 162) in the con-
trol and intervention groups, respectively, in the intent-to treat
analysis (P = .33) and to 92.7% (126 of 137) and 94.4% (136 of
146) in the control and intervention groups, respectively, in the
per-protocol analysis (P = .54). The CAP symptom question-
naire scores were similar in the 2 groups on day 5 (24.7 [11.4]
and 27.2 [12.5] in the control and intervention groups, respec-
tively;P = .10 in the intent-to-treat analysis; and 24.3 [11.4] and
26.6 [12.1] in the control and intervention groups, respec-
tively; P = .16 in the per protocol analysis). At day 10, the CAP
symptom questionnaire scores decreased in both groups (18.6
[9.0] and 17.9 [7.6] in the control and intervention groups, re-
spectively;P = .69 in the intent-to-treat analysis; and 18.1 [8.5]
and 17.6 [7.3] in the control and intervention groups, respec-
tively,P = .81 in the per protocol analysis) (Table2). Within dif-
ferent PSI severity groups, clinical success rate at day 10 was
comparable in the 2 groups. In the intent-to treat analysis, pa-
tients with more severe disease achieved clinical success at day
30 more frequently in the intervention group than in the con-
trol group. No differences were observed in the per-protocol
analysis (Table 3). Primary study outcomes by type of antibi-
otics and by hospitals are given in eTable 3 and eTable 4, re-
spectively, in Supplement 2.
Table 3. Clinical Success Rates at Days 10 and 30 Among Different Severity Groups Defined by PSI Classa
PSI Class
No. (%) of Participants
P ValueControl Group Intervention Group
Clinical Success at Day 10
PSI classes I-III
Intent to treat 41/86 (47.7) 58/101 (57.4) .18
Per protocol 39/80 (48.8) 58/94 (61.7) .09
PSI classes IV-V
Intent to treat 30/60 (50) 32/59 (54.2) .64
Per protocol 28/53 (52.8) 28/50 (56) .75
Clinical Success at Day 30
PSI classes I-III
Intent to treat 83/88 (94.3) 93/102 (91.2) .41
Per protocol 80/82 (97.6) 89/95 (93.7) .29
PSI classes IV-V
Intent to treat 49/61 (80.3) 54/58 (93.1) .04
Per protocol 46/54 (85.2) 47/49 (95.9) .10
Abbreviation: PSI, Pneumonia
Severity Index.a Percentages exclude patients with
missing data. The percentage of
missing data in the intent-to-treat
and per-protocol populations was as
follows: clinical success at day 10,
1.9% and 2.1%, respectively; and
clinical success at day 30, 0.9% and
1.0%, respectively.
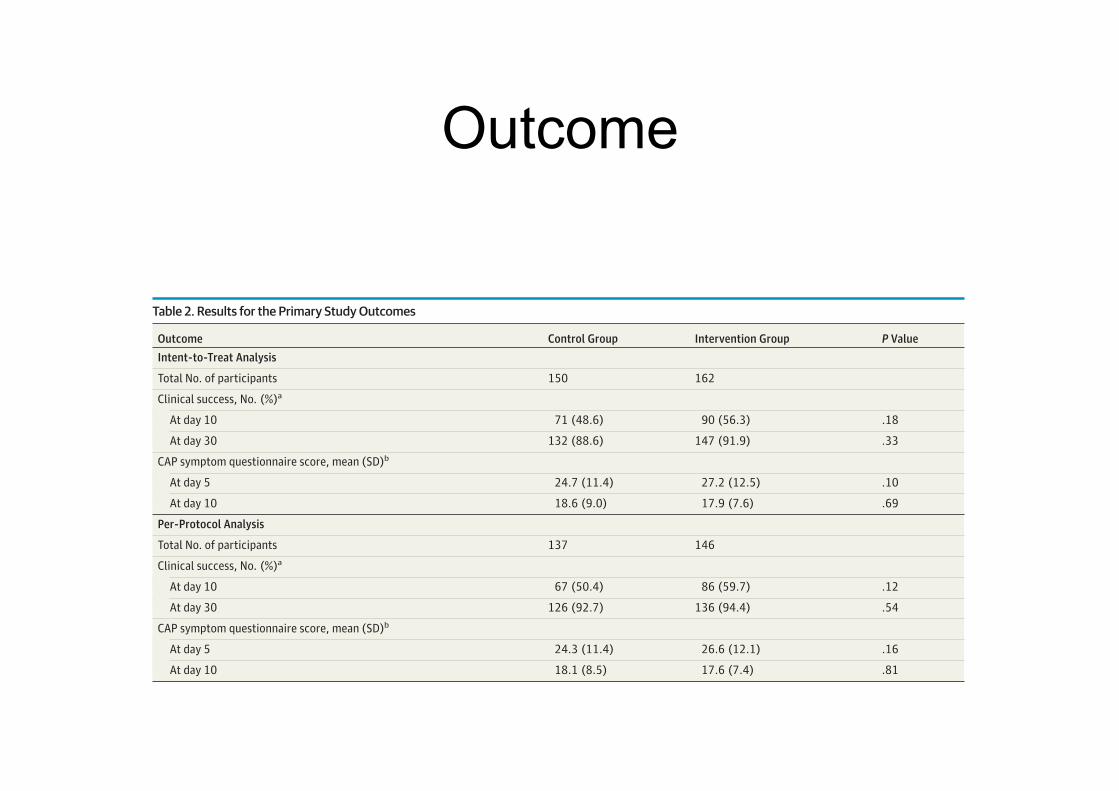
Table 2. Results for the Primary Study Outcomes
Outcome Control Group Intervention Group P Value
Intent-to-Treat Analysis
Total No. of participants 150 162
Clinical success, No. (%)a
At day 10 71 (48.6) 90 (56.3) .18
At day 30 132 (88.6) 147 (91.9) .33
CAP symptom questionnaire score, mean (SD)b
At day 5 24.7 (11.4) 27.2 (12.5) .10
At day 10 18.6 (9.0) 17.9 (7.6) .69
Per-Protocol Analysis
Total No. of participants 137 146
Clinical success, No. (%)a
At day 10 67 (50.4) 86 (59.7) .12
At day 30 126 (92.7) 136 (94.4) .54
CAP symptom questionnaire score, mean (SD)b
At day 5 24.3 (11.4) 26.6 (12.1) .16
At day 10 18.1 (8.5) 17.6 (7.4) .81
Abbreviation: CAP, community-acquired pneumonia.a Percentages exclude patients with missing data. In the intent-to-treat
population, the percentage of missing data for each variable was as follows:
clinical success at day 10, 1.9%; clinical success at day 30, 0.9%; CAP symptom
questionnaire score at day 5, 3.8%; and CAP symptom questionnaire score at
day 10, 4.4%. In the per-protocol population, the percentage of missing data
was as follows: clinical success at day 10, 2.1%; clinical success at day 30, 1.0%;
CAP symptom questionnaire score at day 5, 3.1%; and CAP symptom
questionnaire score at day 10, 3.8%.b On the CAP symptom questionnaire, which is a specific and validated
patient-reported outcome measure based on 18 items, higher scores indicated
more severe CAP-related symptoms (range, 0-90).
Duration of Antibiotic Treatment in Community-Acquired Pneumonia Original Investigation Research
jamainternalmedicine.com (Reprinted) JAMA Internal Medicine September 2016 Volume 176, Number 9 1261
Copyright 2016 American Medical Association. All rights reserved.
Outcome
Copyright 2016 American Medical Association. All rights reserved.
The New Antibiotic Mantra—“Shorter Is Better”Brad Spellberg, MD
In AD 321, Roman Emperor Constantine the Great codified that
there would be 7 days in a week. Even in the modern era of
evidence-based-medicine, this 1695-year-old decree re-
mains a primary reference for
duration of antibiotic therapy:
it leads physicians to treat
infections in intervals of 7
days. Thus, it is gratifying when clinical trials challenge the
standard antibiotic duration of 7 to 14 days.
In the past, community-acquired pneumonia was treated
with a 7- to 14-day course of antibiotics. However, clinical trials
in the early 2000s demonstrated that 3 or 5 days of protocol-
specified antibiotics are as efficacious as longer courses of
therapy for patients with mild to moderately severe community-
acquired pneumonia.1,2 To this body of literature is now added
a new randomized trial, in this issue of JAMA Internal Medicine,
by Uranga et al,3 comparing short-course vs longer courses of
therapy for hospitalized patients with community-acquired
pneumonia. The trial used a pragmatic design in that treating
physicians were allowed to select their preferred antibiotic for
the first 5 days of therapy. Patients were randomized such that
on day 5 those in the control group continued the therapy se-
lected by their treating physicians and those in the experimen-
tal group had their antibiotics stopped if they were afebrile for
48 hours and had no more than 1 sign of clinical instability (eg,
hypotension, tachycardia, tachypnea, or hypoxia). These crite-
ria for stopping the antibiotic applied to 70.1% of patients in the
experimental arm. Although patients admitted to the intensive
care unit were excluded from the trial, a substantial number (ap-
proximately 40%) of patients in both arms had Pneumonia Se-
verity Index scores of IV to V, indicative of severe illness. In
contrast, prior studies of short-course antibiotic therapy have
focused primarily on patients with mild to moderate illness.
The study arms were well matched, and the results were
compelling. The intervention worked, as patients who were ad-
ministered the short-course regimen received a median of 5
days of antibiotics vs 10 for the standard regimen. Across all
end points, time points, and populations, short-course therapy
was as effective as longer courses of therapy. Point estimates
of success favored short-course therapy across most end points
and time points. In the sickest cohort (Pneumonia Severity In-
dex scores of IV-V), 30-day rates of clinical success in the
intention-to-treat population were significantly higher for
short-course vs standard therapy (93.1% vs 80.3%; P = .04).
Furthermore, the readmission rate was significantly lower for
patients receiving the short-course regimen (1.4% vs 6.6%;
P = .02). Overall, the data are convincing that 5 days of anti-
biotic therapy is at least as effective as 10 days for the treat-
ment of community-acquired pneumonia.3
In his keynote address at an annual meeting of the Infec-
tious Diseases Society of America, Louis B. Rice, MD, pointed
out that pneumonia was successfully treated with short dura-
tions of antibiotics as long ago as the 1940s.4 Physicians con-
sidered “pioneers” of penicillin customized the duration of
therapy depending on the patient’s response and found that a
range of 1½ to 4 days of therapy resulted in high cure rates. The
modern concept that we should continue treating bacterial in-
fections past the time when signs and symptoms have resolved
can be traced to 1945. Meads et al wrote that they administered
penicillin to patients with pneumonia, “until there was definite
clinical improvement and the temperature had remained be-
low 100°F for 12 hours…then given for another two to three
days.”5(p748) The perceived need to treat beyond resolution of
symptoms was driven by a desire to prevent relapses. However,
the recurrent infections seen in the case series were caused by
isolates with distinct bacterial serotypes, indicative of reinfec-
tion rather than relapse. It is unclear how this confused desire
to prevent reinfections subsequently transformed into the il-
logical dogma that antibiotic resistance could be prevented by
continuing therapy beyond resolution of symptoms.4
Nevertheless, this dogma has been reinforced by the
equally illogical, often-heard statement that to prevent anti-
biotic resistance, it is necessary for patients to complete the
entire prescribed course of therapy, even after resolution of
symptoms. There is no evidence that taking antibiotics be-
yond the point at which a patient’s symptoms are resolved re-
duces antibiotic resistance. To the contrary, specifically for
pneumonia, studies have shown that longer courses of therapy
result in more emergence of antibiotic resistance,6,7 which is
consistent with everything we know about natural selection,
the driver of antibiotic resistance.8 In only a few types of in-
fections does resistance emerge at the site of infection; rather,
resistance typically emerges off target, among colonizing flora
away from the site of infection.9 Thus, all that is achieved by
treating an infection with antibiotics for longer than the pa-
tient has symptoms is increased selective pressure driving an-
tibiotic resistance among our colonizing microbial flora.
Given the large number of bacterial infections that occur ev-
ery year, overtreating patients who have established infection
is likely a major source of selective pressure that drives antibi-
otic resistance in society. Other than tuberculosis—which is
caused by a very slowly replicative organism that spends much
of its time in a nonreplicating state—for every bacterial infection
for which trials have compared short-course with longer course
antibiotic therapy, short-course therapy has been just as effec-
tive, and with reduced selective pressure driving resistance
(Table).1-3,6,7,10-15 Use of shorter courses of antibiotic therapy is
therefore greatly preferable to longer courses of therapy.
Related article page 1257
Opinion
EDITORIAL
1254 JAMA Internal Medicine September 2016 Volume 176, Number 9 (Reprinted) jamainternalmedicine.com
Copyright 2016 American Medical Association. All rights reserved.
Copyright 2016 American Medical Association. All rights reserved.
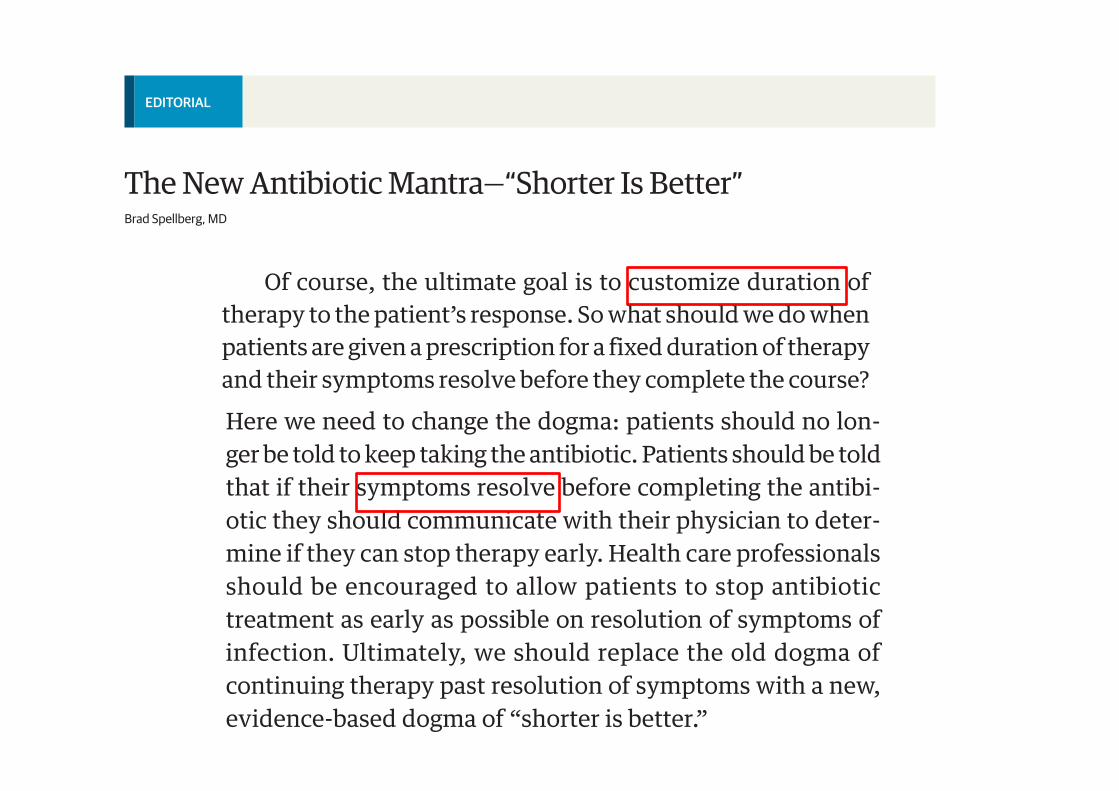
Of course, the ultimate goal is to customize duration of
therapy to the patient’s response. So what should we do when
patients are given a prescription for a fixed duration of therapy
and their symptoms resolve before they complete the course?
Here we need to change the dogma: patients should no lon-
ger be told to keep taking the antibiotic. Patients should be told
that if their symptoms resolve before completing the antibi-
otic they should communicate with their physician to deter-
mine if they can stop therapy early. Health care professionals
should be encouraged to allow patients to stop antibiotic
treatment as early as possible on resolution of symptoms of
infection. Ultimately, we should replace the old dogma of
continuing therapy past resolution of symptoms with a new,
evidence-based dogma of “shorter is better.”
ARTICLE INFORMATION
Author Affiliations: Los Angeles
County+University of Southern California Medical
Center, Los Angeles; Department of Medicine, Keck
School of Medicine at University of Southern
California, Los Angeles.
Corresponding Author: Brad Spellberg, MD, Los
Angeles County+University of Southern California
Medical Center, 2051 Marengo St, Office Number
C2K122, Los Angeles, CA 90033 (bspellberg@dhs
.lacounty.gov).
Published Online: July 25, 2016.
doi:10.1001/jamainternmed.2016.3646.
Conflict of Interest Disclosures: Dr Spellberg
reported receiving consulting fees from Cempra,
The Medicines Company, MedImmune/
AstraZeneca, PTC Therapeutics, Entasis,
Tetraphase, Merck, and Genentech; and Data and
Safety Monitoring Board fees from Dipexium; and
reported owning equity in Motif, BioAIM, and
Synthetic Biologics.
Funding/Support: This work was supported by
grants R01AI117211, R01AI103342, and
UM1AI104681 from the National Institutes of Health
and National Institute of Allergy and Infectious
Diseases.
Role of the Funder/Sponsor: The funding source
had no role in the design and conduct of the study;
collection, management, analysis, and
interpretation of the data; preparation, review, or
approval of the manuscript; and decision to submit
the manuscript for publication.
REFERENCES
1. el Moussaoui R, de Borgie CA, van den Broek P,
et al. Effectiveness of discontinuing antibiotic
treatment after three days versus eight days in mild
to moderate-severe community acquired
pneumonia: randomised, double blind study. BMJ.
2006;332(7554):1355.
2. Dunbar LM, Wunderink RG, Habib MP, et al.
High-dose, short-course levofloxacin for
community-acquired pneumonia: a new treatment
paradigm. Clin Infect Dis. 2003;37(6):752-760.
3. Uranga A, España PP, Bilbao A, et al. Duration of
antibiotic treatment in community-acquired
pneumonia: a multicenter randomized clinical trial
[published online July 25, 2016]. JAMA Internal Med.
doi:10.1001/jamainternmed.2016.3633.
4. Rice LB. The Maxwell Finland Lecture: for the
duration-rational antibiotic administration in an era
of antimicrobial resistance and clostridium difficile.
Clin Infect Dis. 2008;46(4):491-496.
5. Meads M, Harris HW, Finland M, Wilcox C.
Treatment of pneumococcal pneumonia with
penicillin. N Engl J Med. 1945;232:747-755.
6. Chastre J, Wolff M, Fagon JY, et al; PneumA Trial
Group. Comparison of 8 vs 15 days of antibiotic
therapy for ventilator-associated pneumonia in
adults: a randomized trial. JAMA. 2003;290(19):
2588-2598.
7. Singh N, Rogers P, Atwood CW, Wagener MM, Yu
VL. Short-course empiric antibiotic therapy for
patients with pulmonary infiltrates in the intensive
care unit: a proposed solution for indiscriminate
antibiotic prescription. Am J Respir Crit Care Med.
2000;162(2, pt 1):505-511.
8. Spellberg B, Bartlett JG, Gilbert DN. The future
of antibiotics and resistance. N Engl J Med. 2013;
368(4):299-302.
9. Russo TA, Spellberg B, Johnson JR. Important
complexities of the antivirulence target paradigm:
a novel ostensibly resistance-avoiding approach for
treating infections. J Infect Dis. 2016;213(6):901-903.
10. Eliakim-Raz N, Yahav D, Paul M, Leibovici L.
Duration of antibiotic treatment for acute
pyelonephritis and septic urinary tract infection—7
days or less versus longer treatment: systematic
review and meta-analysis of randomized controlled
trials. J Antimicrob Chemother. 2013;68(10):2183-
2191.
11. Sawyer RG, Claridge JA, Nathens AB, et al. Trial
of short-course antimicrobial therapy for
intraabdominal infection. N Engl J Med. 2015;372
(21):1996-2005.
12. El Moussaoui R, Roede BM, Speelman P, Bresser
P, Prins JM, Bossuyt PM. Short-course antibiotic
treatment in acute exacerbations of chronic
bronchitis and COPD: a meta-analysis of
double-blind studies. Thorax. 2008;63(5):415-422.
13. Falagas ME, Karageorgopoulos DE,
Grammatikos AP, Matthaiou DK. Effectiveness and
safety of short vs. long duration of antibiotic
therapy for acute bacterial sinusitis: a meta-analysis
of randomized trials. Br J Clin Pharmacol. 2009;67
(2):161-171.
14. Hepburn MJ, Dooley DP, Skidmore PJ, Ellis MW,
Starnes WF, Hasewinkle WC. Comparison of
short-course (5 days) and standard (10 days)
treatment for uncomplicated cellulitis. Arch InternMed. 2004;164(15):1669-1674.
15. Bernard L, Dinh A, Ghout I, et al; Duration of
Treatment for Spondylodiscitis (DTS) study group.
Antibiotic treatment for 6 weeks versus 12 weeks in
patients with pyogenic vertebral osteomyelitis: an
open-label, non-inferiority, randomised, controlled
trial. Lancet. 2015;385(9971):875-882.
Table. Infections for Which Short-Course Therapy Has Been Shown
to Be Equivalent in Efficacy to Longer Therapy
Disease
Treatment, Days
Short Long
Community-acquired pneumonia1-3 3-5 7-10
Nosocomial pneumonia6,7 ≤8 10-15
Pyelonephritis10 5-7 10-14
Intraabdominal infection11 4 10
Acute exacerbation of chronic bronchitis and COPD12 ≤5 ≥7
Acute bacterial sinusitis13 5 10
Cellulitis14 5-6 10
Chronic osteomyelitis15 42 84
Abbreviation: COPD, chronic obstructive pulmonary disease.
Editorial Opinion
jamainternalmedicine.com (Reprinted) JAMA Internal Medicine September 2016 Volume 176, Number 9 1255
Copyright 2016 American Medical Association. All rights reserved.
Copyright 2016 American Medical Association. All rights reserved.
Of course, the ultimate goal is to customize duration of
therapy to the patient’s response. So what should we do when
patients are given a prescription for a fixed duration of therapy
and their symptoms resolve before they complete the course?
Here we need to change the dogma: patients should no lon-
ger be told to keep taking the antibiotic. Patients should be told
that if their symptoms resolve before completing the antibi-
otic they should communicate with their physician to deter-
mine if they can stop therapy early. Health care professionals
should be encouraged to allow patients to stop antibiotic
treatment as early as possible on resolution of symptoms of
infection. Ultimately, we should replace the old dogma of
continuing therapy past resolution of symptoms with a new,
evidence-based dogma of “shorter is better.”
ARTICLE INFORMATION
Author Affiliations: Los Angeles
County+University of Southern California Medical
Center, Los Angeles; Department of Medicine, Keck
School of Medicine at University of Southern
California, Los Angeles.
Corresponding Author: Brad Spellberg, MD, Los
Angeles County+University of Southern California
Medical Center, 2051 Marengo St, Office Number
C2K122, Los Angeles, CA 90033 (bspellberg@dhs
.lacounty.gov).
Published Online: July 25, 2016.
doi:10.1001/jamainternmed.2016.3646.
Conflict of Interest Disclosures: Dr Spellberg
reported receiving consulting fees from Cempra,
The Medicines Company, MedImmune/
AstraZeneca, PTC Therapeutics, Entasis,
Tetraphase, Merck, and Genentech; and Data and
Safety Monitoring Board fees from Dipexium; and
reported owning equity in Motif, BioAIM, and
Synthetic Biologics.
Funding/Support: This work was supported by
grants R01AI117211, R01AI103342, and
UM1AI104681 from the National Institutes of Health
and National Institute of Allergy and Infectious
Diseases.
Role of the Funder/Sponsor: The funding source
had no role in the design and conduct of the study;
collection, management, analysis, and
interpretation of the data; preparation, review, or
approval of the manuscript; and decision to submit
the manuscript for publication.
REFERENCES
1. el Moussaoui R, de Borgie CA, van den Broek P,
et al. Effectiveness of discontinuing antibiotic
treatment after three days versus eight days in mild
to moderate-severe community acquired
pneumonia: randomised, double blind study. BMJ.
2006;332(7554):1355.
2. Dunbar LM, Wunderink RG, Habib MP, et al.
High-dose, short-course levofloxacin for
community-acquired pneumonia: a new treatment
paradigm. Clin Infect Dis. 2003;37(6):752-760.
3. Uranga A, España PP, Bilbao A, et al. Duration of
antibiotic treatment in community-acquired
pneumonia: a multicenter randomized clinical trial
[published online July 25, 2016]. JAMA Internal Med.
doi:10.1001/jamainternmed.2016.3633.
4. Rice LB. The Maxwell Finland Lecture: for the
duration-rational antibiotic administration in an era
of antimicrobial resistance and clostridium difficile.
Clin Infect Dis. 2008;46(4):491-496.
5. Meads M, Harris HW, Finland M, Wilcox C.
Treatment of pneumococcal pneumonia with
penicillin. N Engl J Med. 1945;232:747-755.
6. Chastre J, Wolff M, Fagon JY, et al; PneumA Trial
Group. Comparison of 8 vs 15 days of antibiotic
therapy for ventilator-associated pneumonia in
adults: a randomized trial. JAMA. 2003;290(19):
2588-2598.
7. Singh N, Rogers P, Atwood CW, Wagener MM, Yu
VL. Short-course empiric antibiotic therapy for
patients with pulmonary infiltrates in the intensive
care unit: a proposed solution for indiscriminate
antibiotic prescription. Am J Respir Crit Care Med.
2000;162(2, pt 1):505-511.
8. Spellberg B, Bartlett JG, Gilbert DN. The future
of antibiotics and resistance. N Engl J Med. 2013;
368(4):299-302.
9. Russo TA, Spellberg B, Johnson JR. Important
complexities of the antivirulence target paradigm:
a novel ostensibly resistance-avoiding approach for
treating infections. J Infect Dis. 2016;213(6):901-903.
10. Eliakim-Raz N, Yahav D, Paul M, Leibovici L.
Duration of antibiotic treatment for acute
pyelonephritis and septic urinary tract infection—7
days or less versus longer treatment: systematic
review and meta-analysis of randomized controlled
trials. J Antimicrob Chemother. 2013;68(10):2183-
2191.
11. Sawyer RG, Claridge JA, Nathens AB, et al. Trial
of short-course antimicrobial therapy for
intraabdominal infection. N Engl J Med. 2015;372
(21):1996-2005.
12. El Moussaoui R, Roede BM, Speelman P, Bresser
P, Prins JM, Bossuyt PM. Short-course antibiotic
treatment in acute exacerbations of chronic
bronchitis and COPD: a meta-analysis of
double-blind studies. Thorax. 2008;63(5):415-422.
13. Falagas ME, Karageorgopoulos DE,
Grammatikos AP, Matthaiou DK. Effectiveness and
safety of short vs. long duration of antibiotic
therapy for acute bacterial sinusitis: a meta-analysis
of randomized trials. Br J Clin Pharmacol. 2009;67
(2):161-171.
14. Hepburn MJ, Dooley DP, Skidmore PJ, Ellis MW,
Starnes WF, Hasewinkle WC. Comparison of
short-course (5 days) and standard (10 days)
treatment for uncomplicated cellulitis. Arch InternMed. 2004;164(15):1669-1674.
15. Bernard L, Dinh A, Ghout I, et al; Duration of
Treatment for Spondylodiscitis (DTS) study group.
Antibiotic treatment for 6 weeks versus 12 weeks in
patients with pyogenic vertebral osteomyelitis: an
open-label, non-inferiority, randomised, controlled
trial. Lancet. 2015;385(9971):875-882.
Table. Infections for Which Short-Course Therapy Has Been Shown
to Be Equivalent in Efficacy to Longer Therapy
Disease
Treatment, Days
Short Long
Community-acquired pneumonia1-3 3-5 7-10
Nosocomial pneumonia6,7 ≤8 10-15
Pyelonephritis10 5-7 10-14
Intraabdominal infection11 4 10
Acute exacerbation of chronic bronchitis and COPD12 ≤5 ≥7
Acute bacterial sinusitis13 5 10
Cellulitis14 5-6 10
Chronic osteomyelitis15 42 84
Abbreviation: COPD, chronic obstructive pulmonary disease.
Editorial Opinion
jamainternalmedicine.com (Reprinted) JAMA Internal Medicine September 2016 Volume 176, Number 9 1255
Copyright 2016 American Medical Association. All rights reserved.
PCT ?
www.thelancet.com/infection Published online October 13, 2017 http://dx.doi.org/10.1016/S1473-3099(17)30592-3 1
Articles
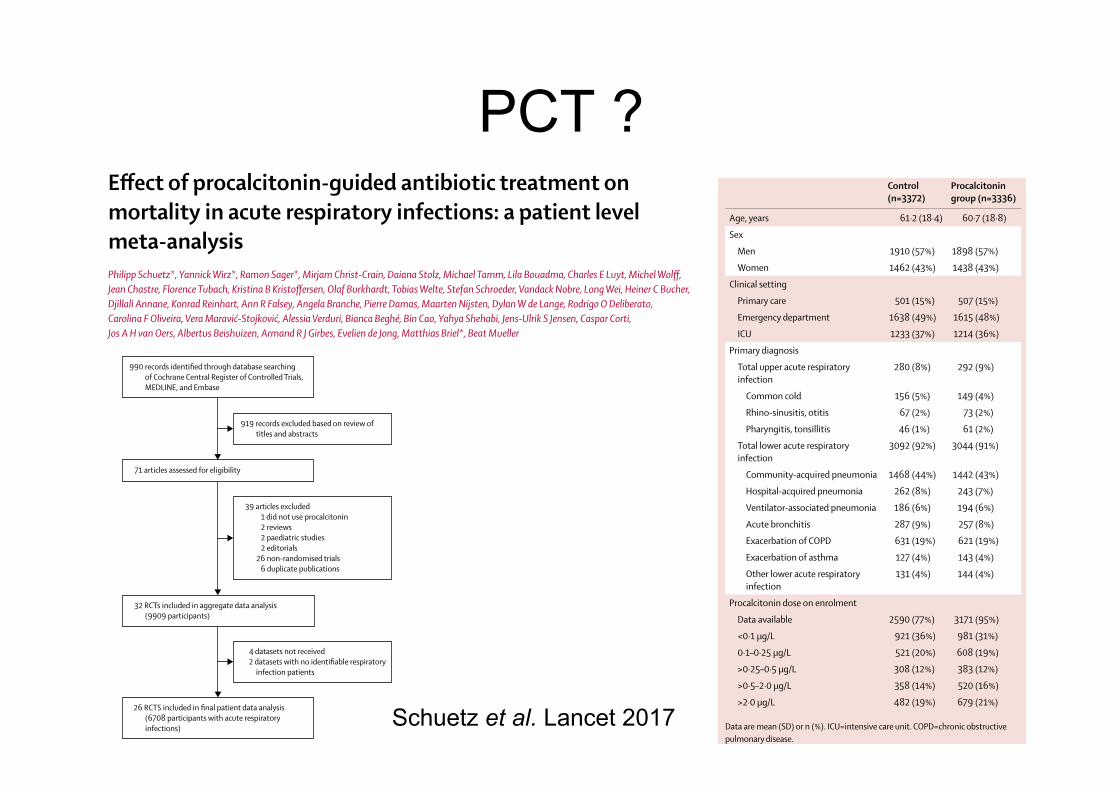
Effect of procalcitonin-guided antibiotic treatment on mortality in acute respiratory infections: a patient level meta-analysisPhilipp Schuetz*, Yannick Wirz*, Ramon Sager*, Mirjam Christ-Crain, Daiana Stolz, Michael Tamm, Lila Bouadma, Charles E Luyt, Michel Wolff, Jean Chastre, Florence Tubach, Kristina B Kristoffersen, Olaf Burkhardt, Tobias Welte, Stefan Schroeder, Vandack Nobre, Long Wei, Heiner C Bucher, Djillali Annane, Konrad Reinhart, Ann R Falsey, Angela Branche, Pierre Damas, Maarten Nijsten, Dylan W de Lange, Rodrigo O Deliberato, Carolina F Oliveira, Vera Maravić-Stojković, Alessia Verduri, Bianca Beghé, Bin Cao, Yahya Shehabi, Jens-Ulrik S Jensen, Caspar Corti, Jos A H van Oers, Albertus Beishuizen, Armand R J Girbes, Evelien de Jong, Matthias Briel*, Beat Mueller
SummaryBackground In February, 2017, the US Food and Drug Administration approved the blood infection marker procalcitonin for guiding antibiotic therapy in patients with acute respiratory infections. This meta-analysis of patient data from 26 randomised controlled trials was designed to assess safety of procalcitonin-guided treatment in patients with acute respiratory infections from different clinical settings.
Methods Based on a prespecified Cochrane protocol, we did a systematic literature search on the Cochrane Central Register of Controlled Trials, MEDLINE, and Embase, and pooled individual patient data from trials in which patients with respiratory infections were randomly assigned to receive antibiotics based on procalcitonin concentrations (procalcitonin-guided group) or control. The coprimary endpoints were 30-day mortality and setting-specific treatment failure. Secondary endpoints were antibiotic use, length of stay, and antibiotic side-effects.
Findings We identified 990 records from the literature search, of which 71 articles were assessed for eligibility after exclusion of 919 records. We collected data on 6708 patients from 26 eligible trials in 12 countries. Mortality at 30 days was significantly lower in procalcitonin-guided patients than in control patients (286 [9%] deaths in 3336 procalcitonin-guided patients vs 336 [10%] in 3372 controls; adjusted odds ratio [OR] 0·83 [95% CI 0·70 to 0·99], p=0·037). This mortality benefit was similar across subgroups by setting and type of infection (pinteractions>0·05), although mortality was very low in primary care and in patients with acute bronchitis. Procalcitonin guidance was also associated with a 2·4-day reduction in antibiotic exposure (5·7 vs 8·1 days [95% CI –2·71 to –2·15], p<0·0001) and a reduction in antibiotic-related side-effects (16% vs 22%, adjusted OR 0·68 [95% CI 0·57 to 0·82], p<0·0001).
Interpretation Use of procalcitonin to guide antibiotic treatment in patients with acute respiratory infections reduces antibiotic exposure and side-effects, and improves survival. Widespread implementation of procalcitonin protocols in patients with acute respiratory infections thus has the potential to improve antibiotic management with positive effects on clinical outcomes and on the current threat of increasing antibiotic multiresistance.
Funding National Institute for Health Research.
IntroductionThe US Food and Drug Administration approved the blood infection biomarker procalcitonin for the purpose of guiding antibiotic therapy in the context of acute respiratory infections and sepsis in February, 2017.1 Procalcitonin is a calcitonin-related gene product expressed by human epithelial cells in response to bacterial infections and is conversely downregulated during viral infections.2,3 Study findings have shown that procalcitonin concentrations fall rapidly during recovery from acute bacterial infections.4 As a surrogate marker of host response to bacterial infections, procalcitonin has therefore been proposed as an adjunct to traditional clinical and diagnostic parameters in helping to manage patients presenting with clinical symptoms suggestive of systemic infections and to guide antibiotic prescribing practices.5
Acute respiratory tract illnesses are one of the leading causes of adult hospital admissions and death worldwide, and are associated with antibiotic overuse.6 Although more than 40% of respiratory infections have a viral cause, imprecise bacterial diagnostics and provider concerns about co-infection prompt antibiotic prescription in most cases.7 Several trials have reported significant reductions in antibiotic exposure, when procalcitonin was used to guide decisions about initiation of antibiotics in low-risk patients (eg, patients with a clinical syndrome of bronchitis in the emergency department) and duration of treatment in high-risk patients (eg, in patients with pneumonia).8 However, although one trial9 found a reduction in mortality associated with procalcitonin-guided antibiotic stewardship in the intensive care unit (ICU), conclusive evidence on the safety of this approach across clinical settings and different types of respiratory infections has
Lancet Infect Dis 2017
Published Online October 13, 2017 http://dx.doi.org/10.1016/ S1473-3099(17)30592-3
See Online/Comment http://dx.doi.org/10.1016/ S1473-3099(17)30593-5
*Contributed equally as first authors
Medical University Department, Kantonsspital Aarau, Aarau, Switzerland (Prof P Schuetz MD, Y Wirz MD, R Sager MD, Prof B Mueller MD); Faculty of Medicine, University of Basel, Basel, Switzerland (Prof P Schuetz, M Christ-Crain MD, D Stolz MD, M Tamm MD, H C Bucher MD, M Briel MD, Prof B Mueller); Division of Endocrinology, Diabetology and Clinical Nutrition (M Christ-Crain), Clinic of Pneumology and Pulmonary Cell Research (D Stolz, M Tamm), and Basel Institute for Clinical Epidemiology and Biostatistics (H C Bucher, M Briel), University Hospital Basel, Basel, Switzerland; Service de Réanimation Médicale, Université Paris 7-Denis-Diderot, Assistance Publique Hôpitaux de Paris (AP-HP), Paris, France (L Bouadma MD, M Wolff MD); Service de Réanimation Médicale, Université Paris 6-Pierre-et-Marie-Curie, Paris, France (C E Luyt MD, J Chastre MD); Département de Biostatistique, Santé publique et Information médicale, AP-HP, Hôpital Pitié-Salpêtrière, Université Pierre et Marie Curie, Sorbonne Universités, Paris, France (Prof F Tubach MD); Department of Infectious Diseases, Aarhus University Hospital, Aarhus, Denmark (K B Kristoffersen MD);
Articles
www.thelancet.com/infection Published online October 13, 2017 http://dx.doi.org/10.1016/S1473-3099(17)30592-3 3
China-Japan Friendship Hospital, Beijing, China (B Cao MD); Critical Care and Peri-operative Medicine, Monash Health, Melbourne, VIC, Australia (Prof Y Shehabi PhD); School of Clinical Sciences, Faculty of Medicine Nursing and Health Sciences, Monash University, Melbourne, VIC, Australia (Y Shehabi); Centre of Excellence for Health, Immunity and Infections, Department of Infectious Diseases and Rheumatology, Finsencentret, Rigshospitalet, University of Copenhagen, Copenhagen, Denmark (J-U S Jensen MD); Department of Respiratory Medicine, Copenhagen University Hospital Bispebjerg, Copenhagen, Denmark (C Corti MD); Elisabeth Tweesteden Hospital, Tilburg, Netherlands (J A H van Oers MD); Medisch Spectrum Twente, Enschede, Netherlands (A Beishuizen MD); VUmc University Medical Center, Amsterdam, Netherlands (A R J Girbes MD, E de Jong MD); and Department of Health Research Methods, Evidence, and Impact, McMaster University, Hamilton, ON, Canada (M Briel)
Correspondence to: Prof Philipp Schuetz, University Department of Medicine, Kantonsspital Aarau, CH-5001 Aarau, Switzerland [email protected]
and thus mortality and adverse outcome rates differed slightly from previous reports. In accordance with the Cochrane method, we used GRADE system42 to assess risk for selection bias, performance bias, detection bias, attrition bias, reporting bias, and other bias.
Data analysisWe included all patients with an acute respiratory infection randomly assigned to a procalcitonin-guided care group or a control group in the analysis. There were two prespecified primary endpoints: all-cause mortality within 30 days of randomisation and treatment failure within 30 days of randomisation. For trials with a shorter follow-up period, we used the available information (eg, treatment failure at the time of hospital discharge). Definitions of treatment failure varied by and were specific for each clinical setting. For the primary care setting, we defined treatment failure as death, hospital admission, infection-specific complications (eg, empyema for lower respiratory tract infection, or meningitis for upper respiratory tract infection), recurrent or worsening infection and patients reporting any symptoms of an ongoing respiratory infection (eg, fever, cough, or dyspnoea) at 30-day follow-up. Recurrent or worsening infection was defined as receiving another course of antibiotics in patients in whom antibiotics were discontinued, or increasing antibiotic dose or frequency in patients already receiving therapy for the same index infection. For patients initially evaluated in the emergency department or hospital, but not ICU setting, we defined treatment failure as death, subsequent ICU admission, hospital re-admission after index hospital discharge, infection-associated complications (eg, empyema or acute respiratory distress syndrome), and recurrent or worsening infection within 30 days of follow-up. In the ICU setting, we defined treatment failure as death within 30 days of follow-up and recurrent or worsening infection.
Secondary endpoints were antibiotic use defined as initiation of antibiotics, duration of antibiotics in days, and total exposure to antibiotics (total number of antibiotic days divided by total number of patients). Exploratory analyses of other clinical outcomes included length of hospital stay, ICU admission, length of ICU stay, antibiotic side-effects (appendix p 8), and number of days with restricted activities of daily living within 14 days of randomisation.
For the coprimary endpoints (mortality and treatment failure), we calculated odds ratios (ORs) and 95% CIs using multivariable hierarchical logistic regression.43,44 Variables in the multivariate analysis were treatment group, age, sex, and type of infection. To control for variability within and between trials, we added a trial variable to the model as a random effect. Linear regression models were fitted for continuous endpoints and logistic regression models were fitted for binary secondary endpoints. Analyses were done following the intention-
to-treat principle—analysing patients according to the groups to which they were randomly assigned. We excluded patients who withdrew consent and assumed no events for the few patients lost to follow-up before day 30 after randomisation. Censoring was used for patients with a follow-up shorter than 30 days for time-to-event analyses.
Prespecified sensitivity analyses were done for the quality indicators allocation concealment, blinded outcome assessment, follow-up time, and protocol adherence (<70% vs ≥70%). We evaluated heterogeneity of disease severity across the patient population with prespecified analyses stratified by clinical setting and diagnosis. We tested for subgroup effects by adding interaction terms to the model. Finally, heterogeneity and inconsistency was further assessed in a meta-analysis of aggregate data from all eligible trials using I² and Cochran’s Q test.45 All statistical analyses were done using Stata (version 9.2) and Review Manager (version 5.3).
Role of the funding sourceThe funder of the study had no role in study design, data collection, data analysis, data interpretation, or writing of the report. The corresponding author had full access to all the data in the study and had final responsibility for the decision to submit for publication.
71 articles assessed for eligibility
4 datasets not received2 datasets with no identifiable respiratory
infection patients
39 articles excluded1 did not use procalcitonin2 reviews2 paediatric studies2 editorials
26 non-randomised trials6 duplicate publications
990 records identified through database searchingof Cochrane Central Register of Controlled Trials,MEDLINE, and Embase
919 records excluded based on review oftitles and abstracts
32 RCTs included in aggregate data analysis(9909 participants)
26 RCTS included in final patient data analysis (6708 participants with acute respiratory infections)
Figure 1: Study selectionRCT=randomised controlled trial.
See Online for appendix
Articles
www.thelancet.com/infection Published online October 13, 2017 http://dx.doi.org/10.1016/S1473-3099(17)30592-3 5
additional trials. Trials were done in 12 countries: Australia, Belgium, Brazil, China, Denmark, France, Germany, Italy, the Netherlands, Serbia, Switzerland, and the USA (table 1, appendix p 1). There were two primary care trials with patients with upper respiratory tract infections and lower respiratory tract infection (n=1008), 11 trials from emergency departments and medical wards with patients with lower respiratory tract infection (n=3253), and 13 trials from ICUs with patients who were septic because of lower respiratory tract infections (n=2447). Procalcitonin-based algorithms used in the different trials were similar in concept and recommended initiation or continuation of antibiotic therapy based on procalcitonin cutoff levels. Adherence to algorithms was variable, ranging from 44% to 100% (appendix p 3). Quality of trials according to GRADE was moderate to high (appendix p 6). Caregivers and patients were blinded to the intervention in most of the trials, but half of trials did not have a blinded outcome assessment. There was no evidence of publication bias based on inspection of the funnel plot (appendix p 7).
Baseline characteristics of individual patients were similar in procalcitonin and control groups (table 2). Most patients were recruited in the emergency department or the ICU. Community-acquired pneumonia was the most frequent diagnosis in more than 40% of patients (table 2).
There were 286 deaths within 30 days in 3336 procalcitonin-guided patients (9%) compared with 336 deaths in 3372 controls (10%), resulting in a signifi cantly lower mortality associated with procalcitonin-guided therapy (adjusted OR 0·83 [95% CI 0·70–0·99], p=0·037; table 3). This effect was consistent across clinical settings (no significant difference due to subgroup effect), although mortality could not be estimated in primary care trials in which only one death was reported in a control patient. The effects on mortality were also consistent among different types of infections (no significant difference for each interaction), excluding patients with bronchitis for whom mortality could not be assessed (table 3).
Treatment failure in procalcitonin-guided patients was numerically lower than control patients, but not significantly different (23·0% vs 24·9%; adjusted OR 0·90 [95% CI 0·80–1·01], p=0·068). These results were similar among subgroups by clinical setting and type of respiratory infection (pinteractions>0·05; table 3). Mortality and treatment failure results were also not significantly different from the main analysis in the sensitivity analysis based on the main quality indicators of trials with no evidence of effect modification (appendix p 5).
As an additional sensitivity analysis, a meta-analysis of the aggregate results of all 32 eligible trials was done and included the six trials initially excluded from the individual patient data analysis (figure 2). The point estimate for mortality was similar to the individual patient data analysis, but was not significant (OR 0·89 [95% CI 0·78–1·01]). The aggregate analysis of treatment failure showed a significant reduction in risk of treatment
failure associated with procalcitonin-guided treatment (0·90 [0·81–0·99]). Heterogeneity for both endpoints was low suggesting similar effects among subgroups (I²=0% for both).
Procalcitonin guidance was associated with a reduction in total antibiotic exposure (mean 5·7 days vs 8·1 days in the control group, adjusted regression coefficient –2·43 days [95% CI –2·71 to 2·15], p<0·0001; table 4, figure 3). Fewer patients in the procalcitonin group were prescribed antibiotics than in the control group and, in patients for whom antibiotics were prescribed, duration of therapy was shorter in procalcitonin-guided patients. The effect on antibiotic use differed by clinical setting. In the primary care setting, lower antibiotic exposure was mainly due to lower initial prescription rates in procalcitonin-guided patients than control patients (pinteraction<0·0001). Similarly, lower antibiotic exposure due to lower prescription rates was found in selected
Control (n=3372)
Procalcitonin group (n=3336)
Age, years 61·2 (18·4) 60·7 (18·8)
Sex
Men 1910 (57%) 1898 (57%)
Women 1462 (43%) 1438 (43%)
Clinical setting
Primary care 501 (15%) 507 (15%)
Emergency department 1638 (49%) 1615 (48%)
ICU 1233 (37%) 1214 (36%)
Primary diagnosis
Total upper acute respiratory infection
280 (8%) 292 (9%)
Common cold 156 (5%) 149 (4%)
Rhino-sinusitis, otitis 67 (2%) 73 (2%)
Pharyngitis, tonsillitis 46 (1%) 61 (2%)
Total lower acute respiratory infection
3092 (92%) 3044 (91%)
Community-acquired pneumonia 1468 (44%) 1442 (43%)
Hospital-acquired pneumonia 262 (8%) 243 (7%)
Ventilator-associated pneumonia 186 (6%) 194 (6%)
Acute bronchitis 287 (9%) 257 (8%)
Exacerbation of COPD 631 (19%) 621 (19%)
Exacerbation of asthma 127 (4%) 143 (4%)
Other lower acute respiratory infection
131 (4%) 144 (4%)
Procalcitonin dose on enrolment
Data available 2590 (77%) 3171 (95%)
<0·1 µg/L 921 (36%) 981 (31%)
0·1–0·25 µg/L 521 (20%) 608 (19%)
>0·25–0·5 µg/L 308 (12%) 383 (12%)
>0·5–2·0 µg/L 358 (14%) 520 (16%)
>2·0 µg/L 482 (19%) 679 (21%)
Data are mean (SD) or n (%). ICU=intensive care unit. COPD=chronic obstructive pulmonary disease.
Table 2: Baseline characteristics of included patients
Schuetz et al. Lancet 2017
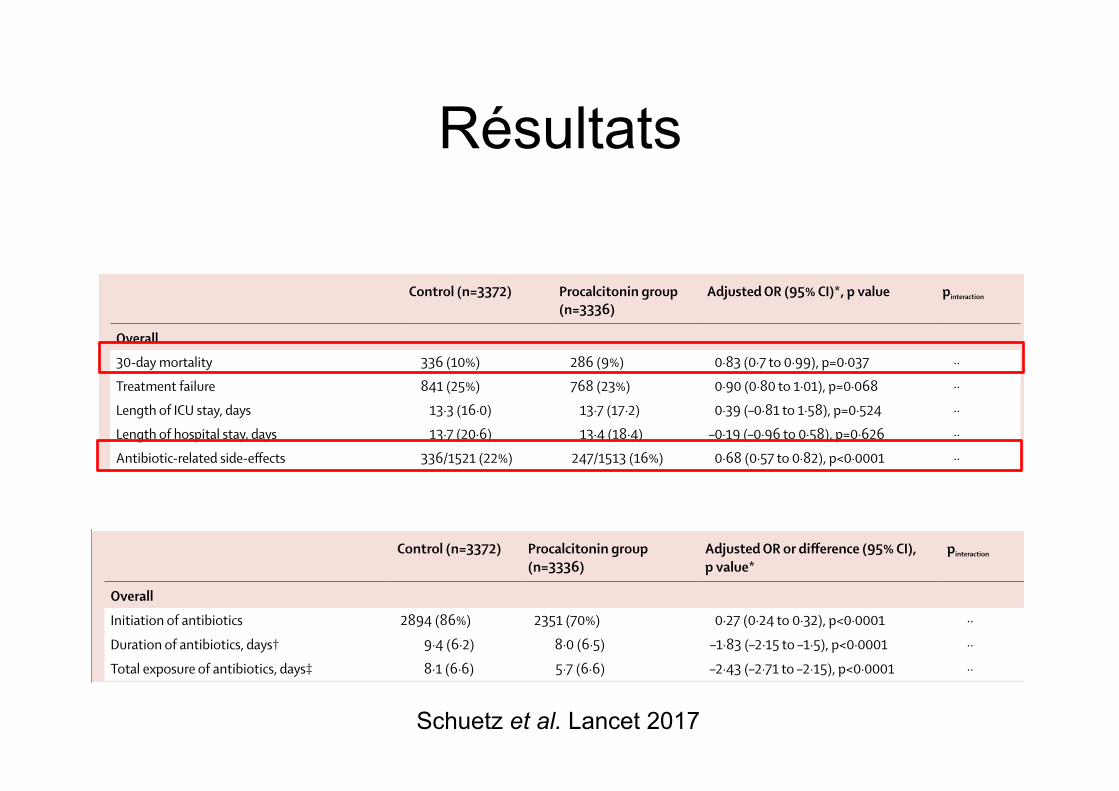
Articles
www.thelancet.com/infection Published online October 13, 2017 http://dx.doi.org/10.1016/S1473-3099(17)30592-3 9
bacterial invasion, are highest in patients who have bacteraemia, and correlate with disease severity and clinical outcome of patients with infection.49,50 Unlike other inflammatory markers, procalcitonin release is blocked by cytokines, which characterise the typical immune response to viral infections (interferon γ).51 Procalcitonin is therefore more specific for bacterial infections than C-reactive protein or white cell count.52–54 Procalcitonin concentrations rapidly fall by about 50% each day during resolution of infection and are therefore useful in monitoring the clinical course and supporting decisions to discontinue antibiotic treatment.
However, an important impediment to the evaluation and validation of any sepsis marker has been the absence
of a reliable reference standard for bacterial infection, particularly for respiratory infections. For procalcitonin, sensitivities and specificities of around 80% have been reported in previous observational studies using blood culture as the reference standard.55,56 To increase sensitivity and specificity of procalcitonin, existing algorithms use a variety of cutoff points in conjunction with clinical criteria to guide antibiotic prescription.10 Although observational research does not permit measurements of the true diagnostic accuracy of procalcitonin, interventional research is helpful to understand the clinical effect of such algorithms. Several studies have now compared antibiotic use and clinical outcomes of acute respiratory infections in patients
Control (n=3372) Procalcitonin group (n=3336)
Adjusted OR or difference (95% CI), p value*
pinteraction
Overall
Initiation of antibiotics 2894 (86%) 2351 (70%) 0·27 (0·24 to 0·32), p<0·0001 ··
Duration of antibiotics, days† 9·4 (6·2) 8·0 (6·5) –1·83 (–2·15 to –1·5), p<0·0001 ··
Total exposure of antibiotics, days‡ 8·1 (6·6) 5·7 (6·6) –2·43 (–2·71 to –2·15), p<0·0001 ··
Setting-specific outcomes
Primary care 501 507 ·· ··
Initiation of antibiotics 316 (63%) 116 (23%) 0·13 (0·09 to 0·18), p<0·0001 <0·0001
Duration of antibiotics, days† 7·3 (2·5) 7·0 (2·8) –0·52 (–1·07 to 0·04), p=0·068 0·064
Total exposure of antibiotics, days‡ 4·6 (4·1) 1·6 (3·2) –3·02 (–3·45 to –2·58), p<0·0001 0·101
Emergency department 1638 1615 ·· ··
Initiation of antibiotics 1354 (83%) 1119 (69%) 0·49 (0·41 to 0·58), p<0·0001 <0·0001
Duration of antibiotics, days† 9·8 (5·4) 7·3 (5·1) –2·45 (–2·86 to –2·05), p<0·0001 <0·0001
Total exposure of antibiotics, days‡ 8·2 (6·2) 5·2 (5·4) –3·02 (–3·41 to –2·62), p<0·0001 <0·0001
Intensive care unit 1233 1214 ·· ··
Initiation of antibiotics 1224 (99%) 1116 (92%) 0·02 (0·01 to 0·05), p<0·0001 <0·0001
Duration of antibiotics, days† 9·5 (7·4) 8·8 (7·8) –1·23 (–1·82 to –0·65), p<0·0001 <0·0001
Total exposure of antibiotics, days‡ 9·5 (7·4) 8·1 (7·9) –1·44 (–1·99 to –0·88), p<0·0001 <0·0001
Disease-specific outcomes
Community-acquired pneumonia 1468 1442 ·· ··
Initiation of antibiotics 1455 (99%) 1340 (93%) 0·08 (0·04 to 0·15), p<0·0001 <0·0001
Duration of antibiotics, days† 10·5 (6·2) 8·0 (5·7) –2·45 (–2·87 to –2·02), p<0·0001 <0·0001
Total exposure of antibiotics, days‡ 10·4 (6·2) 7·5 (5·9 –2·94 (–3·38 to –2·5), p<0·0001 0·004
Exacerbation of COPD 631 621 ·· ··
Initiation of antibiotics 453 (72%) 266 (43%) 0·29 (0·23 to 0·36), p<0·0001 0·017
Duration of antibiotics, days† 7·4 (5·3) 7·2 (6·7) –1·15 (–2 to –0·31), p=0·007 0·003
Total exposure of antibiotics, days‡ 5·3 (5·6) 3·1 (5·6) –2·22 (–2·83 to –1·6), p<0·0001 0·506
Acute bronchitis 287 257 ·· ··
Initiation of antibiotics 189 (66%) 68 (26%) 0·18 (0·12 to 0·26), p<0·0001 <0·0001
Duration of antibiotics, days† 7·1 (3·0) 6·4 (3·5) –0·35 (–1·15 to 0·45), p=0·393 0·359
Total exposure of antibiotics, days‡ 4·7 (4·2) 1·7 (3·3) –2·95 (–3·59 to –2·31), p<0·0001 0·33
Ventilator-associated pneumonia 186 194 ·· ··
Initiation of antibiotics 186 (100%) 193 (100%) ·· ··
Duration of antibiotics, days† 13·1 (7·9) 10·8 (8·7) –2·22 (–3·8 to –0·65), p=0·006 0·253
Total exposure of antibiotics, days‡ 13·1 (7·9) 10·8 (8·7) –2·45 (–4·09 to –0·82), p=0·003 0·786
Data are n, mean (SD), or n (%), unless otherwise specified. OR=odds ratio. COPD=chronic obstructive pulmonary disease. *Multivariable hierarchical model adjusted for age and diagnosis and trial as a random effect. †Total days of antibiotic therapy in patients in whom antibiotics were initiated. ‡Total days of antibiotic therapy in all randomly assigned patients.
Table 4: Antibiotic treatment overall and stratified by setting and diagnosis
Articles
6 www.thelancet.com/infection Published online October 13, 2017 http://dx.doi.org/10.1016/S1473-3099(17)30592-3
infections such as acute bronchitis. Lower antibiotic prescription rates and shorter duration of antibiotic therapy in patients contributed to the lower overall exposure in the emergency department setting. In the ICU setting and in patients diagnosed with community-
acquired pneumonia, the lower exposure was mainly explained by shorter treatment durations.
There was a significant reduction in antibiotic-related side-effects in procalcitonin-guided patients (16% vs 22%; adjusted OR 0·68 [95% CI 0·57–0·82], p<0·0001). This
Control (n=3372) Procalcitonin group (n=3336)
Adjusted OR (95% CI)*, p value pinteraction
Overall
30-day mortality 336 (10%) 286 (9%) 0·83 (0·7 to 0·99), p=0·037 ··
Treatment failure 841 (25%) 768 (23%) 0·90 (0·80 to 1·01), p=0·068 ··
Length of ICU stay, days 13·3 (16·0) 13·7 (17·2) 0·39 (–0·81 to 1·58), p=0·524 ··
Length of hospital stay, days 13·7 (20·6) 13·4 (18·4) –0·19 (–0·96 to 0·58), p=0·626 ··
Antibiotic-related side-effects 336/1521 (22%) 247/1513 (16%) 0·68 (0·57 to 0·82), p<0·0001 ··
Setting-specific outcomes
Primary care 501 507 ·· ··
30-day mortality 1 (<1%) 0 (0) ·· ··
Treatment failure 164 (33%) 159 (31%) 0·96 (0·73 to 1·25), p=0·751 0·715
Days with restricted activities 8·9 (4·2) 8·9 (4·1) 0·07 (–0·44 to 0·59), p=0·777 ··
Antibiotic-related side-effects 128/498 (26%) 102/506 (20%) 0·65 (0·46 to 0·91), p=0·012 0·596
Emergency department 1638 1615 ·· ··
30-day mortality 62 (4%) 57 (4%) 0·91 (0·63 to 1·33), p=0·635 0·546
Treatment failure 292 (18%) 259 (16%) 0·87 (0·72 to 1·05), p=0·141 0·807
Length of hospital stay, days 8·2 (10·5) 8·1 (7·5) –0·14 (–0·73 to 0·44), p=0·631 0·684
Antibiotic-related side-effects 208/1023 (20%) 145/1007 (14%) 0·66 (0·52 to 0·83), p=0·001 0·596
Intensive care unit 1233 1214 ·· ··
30-day mortality 273 (22%) 229 (19%) 0·84 (0·69 to 1·02), p=0·081 0·619
Length of ICU stay, days 14·8 (16·2) 15·3 (17·5) 0·56 (–0·82 to 1·93), p=0·427 0·849
Length of hospital stay, days 26·3 (26·9) 25·8 (23·9) –0·33 (–2·28 to 1·62), p=0·739 0·641
Disease-specific outcomes
Community-acquired pneumonia 1468 1442 ·· ··
30-day mortality 206 (14%) 175 (12%) 0·82 (0·66 to 1·03), p=0·083 0·958
Treatment failure 385 (26%) 317 (22%) 0·78 (0·66 to 0·93), p=0·005 0·052
Length of ICU stay, days 10·5 (10·3) 11·9 (13·3) 1·45 (0·15 to 2·75), p=0·029 0·119
Length of hospital stay, days 13·3 (15·7) 13·9 (16·1) 0·74 (–0·25 to 1·73), p=0·143 0·094
Antibiotic-related side-effects 186/671 (28%) 127/666 (19%) 0·62 (0·48 to 0·8), p<0·0001 0·227
Exacerbation of COPD 631 621 ·· ··
30-day mortality 24 (4%) 19 (3%) 0·80 (0·43 to 1·48), p=0·472 0·847
Treatment failure 110 (17%) 104 (17%) 0·94 (0·7 to 1·27), p=0·704 0·676
Length of hospital stay, days 9·3 (13·9) 8·4 (7·2) –0·6 (–1·84 to 0·64), p=0·342 0·658
Antibiotic-related side-effects 30/274 (11%) 29/275 (11%) 0·93 (0·53 to 1·63), p=0·805 0·198
Acute bronchitis 287 257 ·· ··
30-day mortality 0 (0) 2 (1%) ·· ··
Treatment failure 55 (19%) 52 (20%) 1·11 (0·72 to 1·7), p=0·643 0·4
Length of hospital stay, days 2·6 (5·7) 2·2 (4·7) –0·21 (–0·9 to 0·48), p=0·556 0·97
Antibiotic-related side-effects 54/250 (22%) 39/226 (17%) 0·77 (0·49 to 1·22), p=0·263 0·657
Ventilator-associated pneumonia 186 194 ·· ··
30-day mortality 29 (16%) 23 (12%) 0·75 (0·41 to 1·39), p=0·366 0·644
Treatment failure 51 (27%) 44 (23%) 0·78 (0·48 to 1·28), p=0·332 0·522
Length of ICU stay, days 23·5 (20·5) 21·8 (19·1) –1·74 (–5·64 to 2·17), p=0·383 0·441
Length of hospital stay, days 33·8 (27·6) 32·0 (23·1) –2·14 (–7·04 to 2·75), p=0·391 0·448
Data are n, mean (SD), or n (%), unless otherwise specified. OR=odds ratio. ICU=intensive care unit. COPD=chronic obstructive pulmonary disease. *Multivariable hierarchical regression with outcome of interest as dependent variable; age and respiratory tract infection diagnosis as independent variables; and trial as a random effect.
Table 3: Clinical endpoints overall and stratified by setting and diagnosis
Résultats
Schuetz et al. Lancet 2017
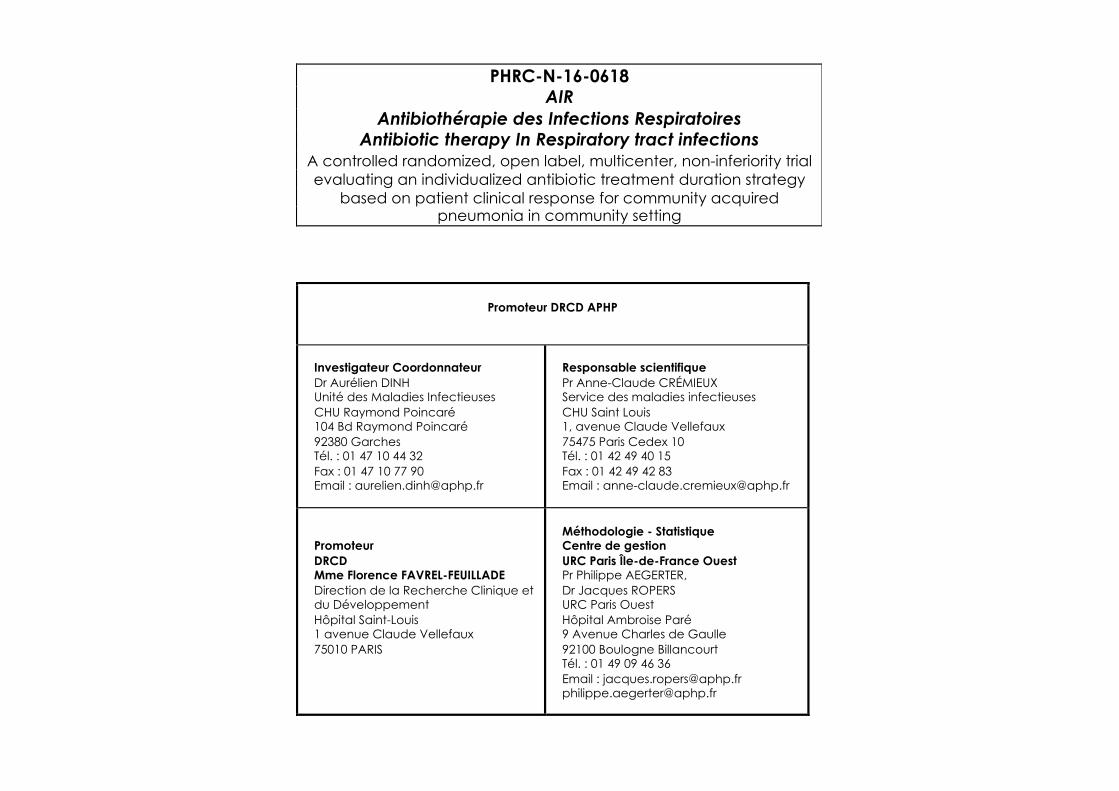
PHRC-N-16-0618 AIR
Antibiothérapie des Infections Respiratoires Antibiotic therapy In Respiratory tract infections
A controlled randomized, open label, multicenter, non-inferiority trial evaluating an individualized antibiotic treatment duration strategy
based on patient clinical response for community acquired pneumonia in community setting
Promoteur DRCD APHP
Investigateur Coordonnateur Dr Aurélien DINH Unité des Maladies Infectieuses CHU Raymond Poincaré 104 Bd Raymond Poincaré 92380 Garches Tél. : 01 47 10 44 32 Fax : 01 47 10 77 90 Email : [email protected]
Responsable scientifique Pr Anne-Claude CRÉMIEUX Service des maladies infectieuses CHU Saint Louis 1, avenue Claude Vellefaux 75475 Paris Cedex 10 Tél. : 01 42 49 40 15 Fax : 01 42 49 42 83 Email : [email protected]
Promoteur DRCD Mme Florence FAVREL-FEUILLADE Direction de la Recherche Clinique et du Développement Hôpital Saint-Louis 1 avenue Claude Vellefaux 75010 PARIS
Méthodologie - Statistique Centre de gestion URC Paris Île-de-France Ouest Pr Philippe AEGERTER, Dr Jacques ROPERS URC Paris Ouest Hôpital Ambroise Paré 9 Avenue Charles de Gaulle 92100 Boulogne Billancourt Tél. : 01 49 09 46 36Email : [email protected] [email protected]
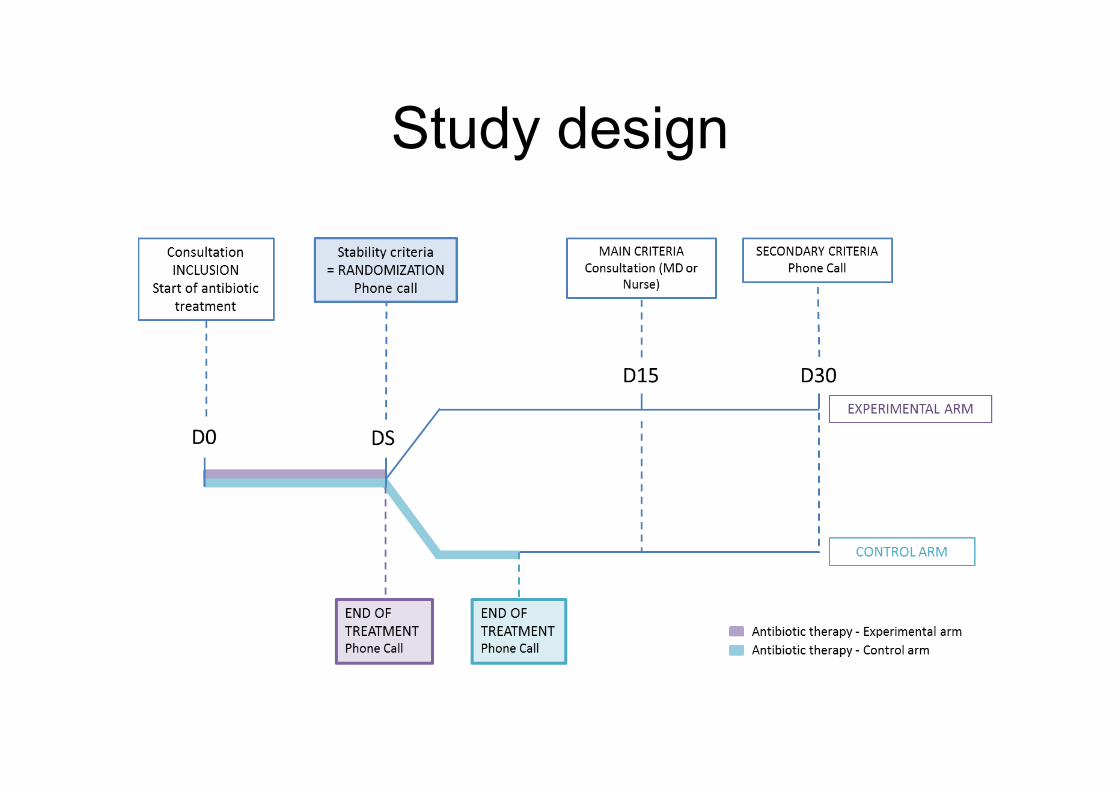
Study design

Outils connectés
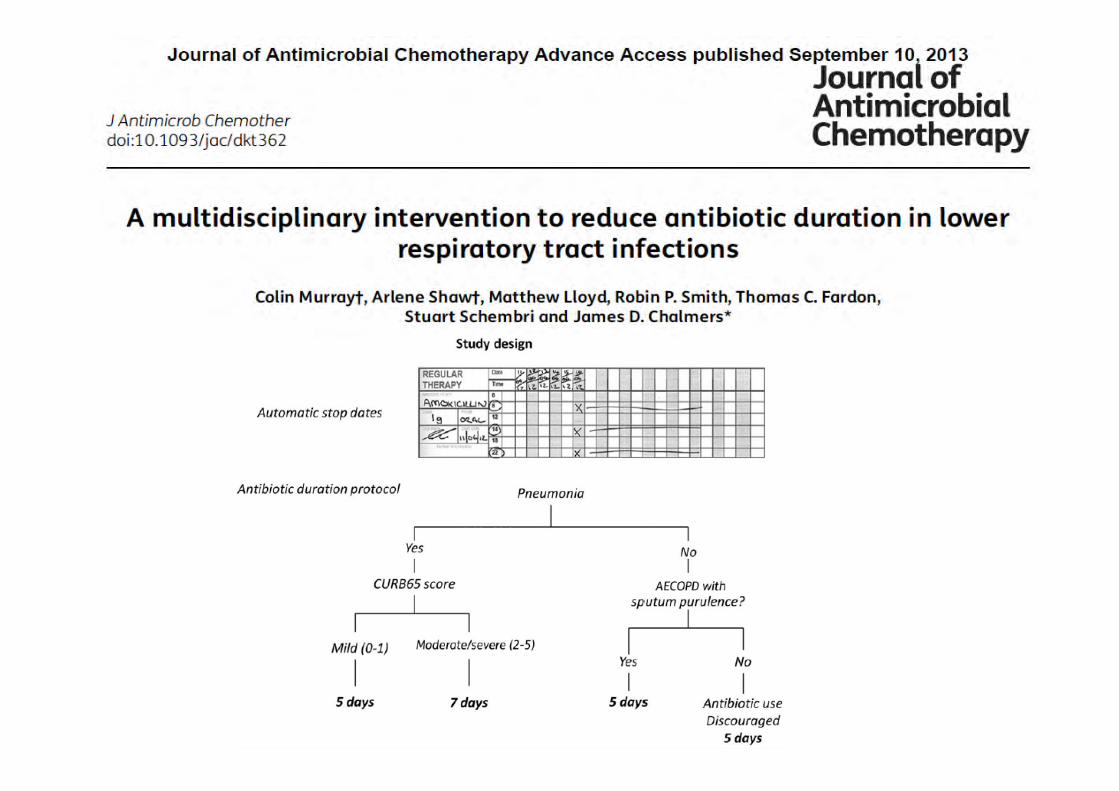
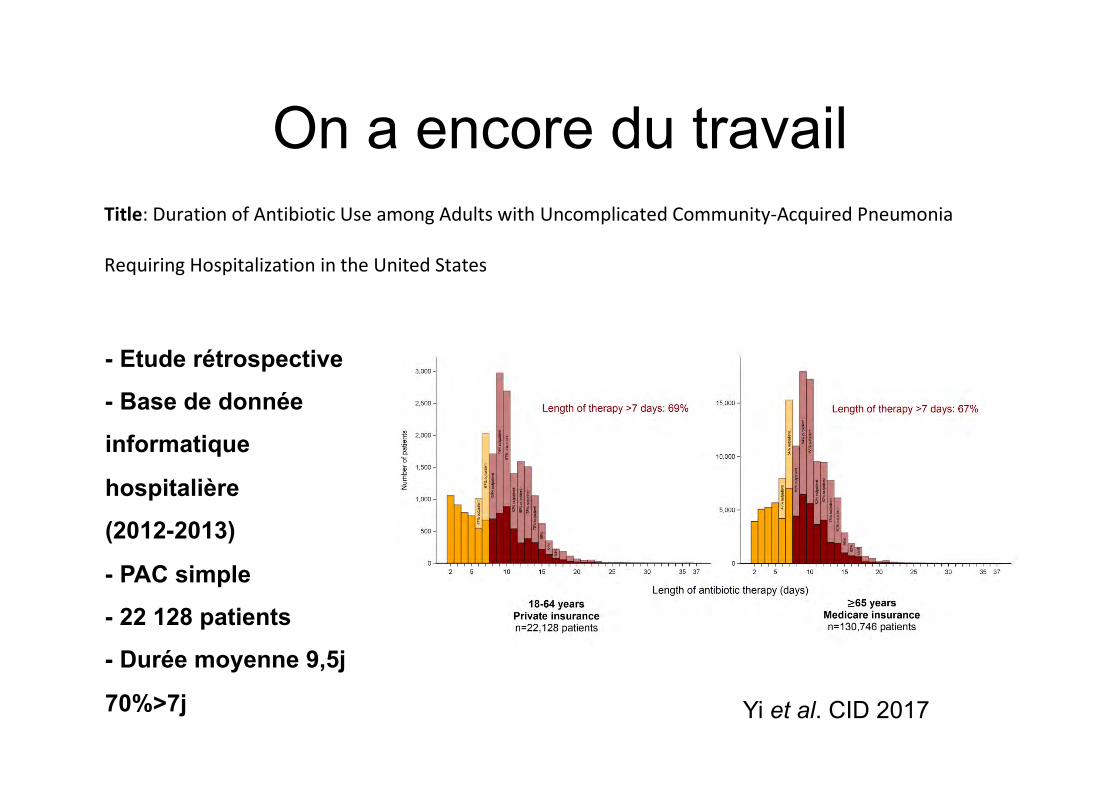
On a encore du travail
Published by Oxford University Press for the Infectious Diseases Society of America 2017. This work is
written by (a) US Government employee(s) and is in the public domain in the US.
Title: Duration of Antibiotic Use among Adults with Uncomplicated Community-Acquired Pneumonia
Requiring Hospitalization in the United States
Author names Institutional affiliation(s)
Sarah H. Yi, PhD1 1Division of Healthcare Quality Promotion, Centers for Disease
Control and Prevention, Atlanta, GA USA Kelly M. Hatfield, MSPH1
James Baggs, PhD1
Lauri A. Hicks, DO1
Arjun Srinivasan, MD1
Sujan Reddy, MD, MS1
John A. Jernigan, MD, MS1
Corresponding author
Name Sarah Yi
Address 1600 Clifton Road, MS A-16
Atlanta, GA 30329-4027
Telephone 404-639-4068;
Fax 404-471-8309
e-mail [email protected]
These findings were presented in part at the IDWeek 2016 Annual Meeting, in New Orleans, LA.
Running head: Duration of antibiotic use
Summary: Among patients hospitalized for community-acquired pneumonia in 2012-13, median total
length of antibiotic therapy was 9.5 days. Over 70% of patients exceeded treatment duration
recommendations due to outpatient prescribing at discharge. Discharge prescribing may be an
important antibiotic stewardship target.
Downloaded from https://academic.oup.com/cid/advance-article-abstract/doi/10.1093/cid/cix986/4595700by INSERM useron 29 November 2017
Yi et al. CID 2017
- Etude rétrospective
- Base de donnée
informatique
hospitalière
(2012-2013)
- PAC simple
- 22 128 patients
- Durée moyenne 9,5j
70%>7j
Page 29 of 30
Figure 3.
Downloaded from https://academic.oup.com/cid/advance-article-abstract/doi/10.1093/cid/cix986/4595700by INSERM useron 29 November 2017
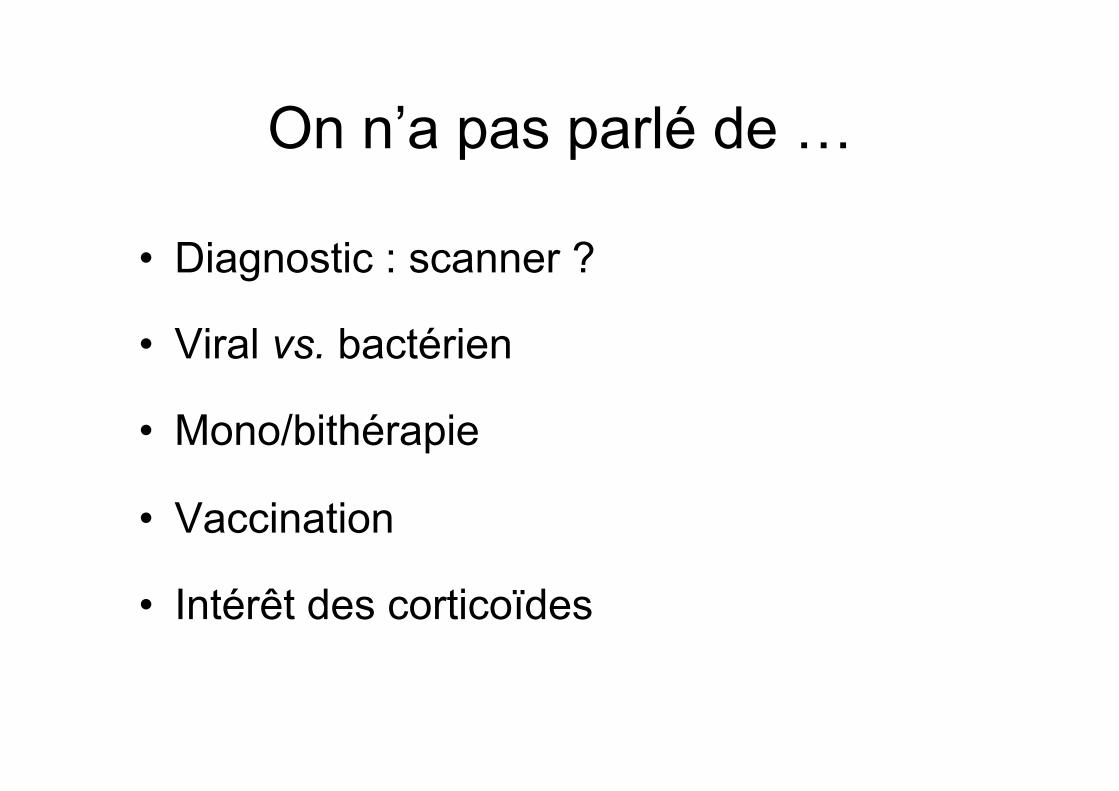
On n’a pas parlé de …
• Diagnostic : scanner ?
• Viral vs. bactérien
• Mono/bithérapie
• Vaccination
• Intérêt des corticoïdes

MERCI DE VOTRE ATTENTION
Remerciements
Ambroise Paré, Boulogne-Billancourt : ATTAL-BEHAR Julie, BEAUNE Sebastien, BLIVET Sandra, CHINET Thierry, CUDENNEC Tristan, DUMOULIN Jennifer, DUPONT Caroline, GIRAUT Violaine, GREFFE Ségolène, GRENET Julie, GUYOT Caroline, LABRUNE Sylvie, MOULIAS Sophie, NALINE Charlotte, ROUVEIX Elisabeth, SAHUT-D'IZARN Marine, SEFSSAFI Abel, TEILLET Laurent, TRAD Salim CH Annecy : BRU Jean-Pierre, GAILLAT Jacques, GAUTIER Vincent, JANSSEN Cecile, PAGANI Leonardo, VITRAT Virginie CH Argenteuil : ABDERRAHMANE Malika, CAMUSET Juliette, LEGALL Catherine, LONGUET-FLANDRES Pascale, MENN Anne-Marie Beaujon, Clichy : DE LASTOURS Victoire, PREVOST Gwenolée Bicêtre : BURDET Charles, DERRADJI Ouda, ESCAUT Lelia, HINGLAIS Etienne, LEBRAS Philippe, LEFEVRE Edouard, NOAILLON Mathilde, RABIER Pauline, RAPHAEL Maurice, TEICHER Elina, VERNY Christiane, VITTECOQ Daniel, WYPLOSZ Benjamin Bichât : BEN HAYOUN Michèle, BRUN-VEZINET Françoise, CASALINO Enrique, CHOQUET Christophe, DOMBRET Marie-Christine, DUVAL Xavier, JOLY Véronique, LESCURE Xavier, POGLIAGHI Manuela, RIOUX Christophe, YAZDANPANAH Yazdan CHI Créteil : BARROS Elsa, BEGGA Belinda, BOUKOBZA Sébastien, BOUREDJI Houria, CHOUAHI Imad, DELACROIX Isabelle, FROISSART Antoine, GARRAIT Valérie, NGWEM Elsa, PHLIPPOTEAU Catherine, SALEHABADI Sepehr, TOPER Cécile, VINAS Florent CHU Grenoble : AMSILLI Marie, EPAULARD Olivier, PAVESE Patricia, PIERRE Isabelle, STAHL Jean-Paul Foch, Suresnes : AULAGNIER Jérôme, CELERIER Julie, COJOCARIU Roxana, KAHN Jean-Emmanuel, MATHIEU Emmanuel, RACHLINE Charlotte, SENE Thomas, THIERRY Christelle Lariboisière : APARICIO Caroline, DELCEY Veronique, LOPES Amanda, MORGAND Marjolaine, SELLIER Pierre, SIMONEAU Guy Melun : CHAKVETADZE Catherine, DIAMANTIS Sylvain, GAUTHIER Arnaud, JIDAR Kaoutar, JOURDAIN Béatrice, MARIE Elisabeth, POSTAL Pâques Marie-Joelle CH Pontoise : BOITIAUX Jean-Francois, DESCHAMPS Patrick, DEVAUD Edouard, PHILIPPE Bruno Raymond Poincaré : CALIN Ruxandra-Oana, CHROBOCZEK Tomasz, DAVIDO Benjamin, DE TRUCHIS Pierre, HANACHI Mouna, LAGRANGE Aurore, MAKHLOUFI Sabrina, MELLON Guillaume, SALOMON Jérôme, SENARD Olivia CHU Rennes : REVEST Matthieu, TATTEVIN Pierre CHU Rouen : BENHAMOU Daniel, CHAPUZET Claire, CHAUFFREY Laure, ETIENNE Manuel, JOLY Luc-Marie, OBSTOY Bérengère, SALAUN Mathieu, THIBERVILLE Luc, TILLON Julie Saint-Antoine : BOLLENS Diane, BOTTERO Julie, CAMPA Pauline, COSQUERIC Gäelle, LEFEBVRE Bénédicte, OUAZENE Zineb, PACANOWSKI Jérôme, PATERON Dominique, THOMAS Caroline, VALIN Nadia CH Saint-Denis : COMPAIN Caroline, CORDEL Hugues, DOUMENC Benoit, FOIS Elena, GAMBIER Nicolas, KHUONG Marie-Aude, PASQUALONI Elisa, POUPARD Marie

Vous adorerez PTC !
VOUS AVEZ AIMÉ LA PCT ?


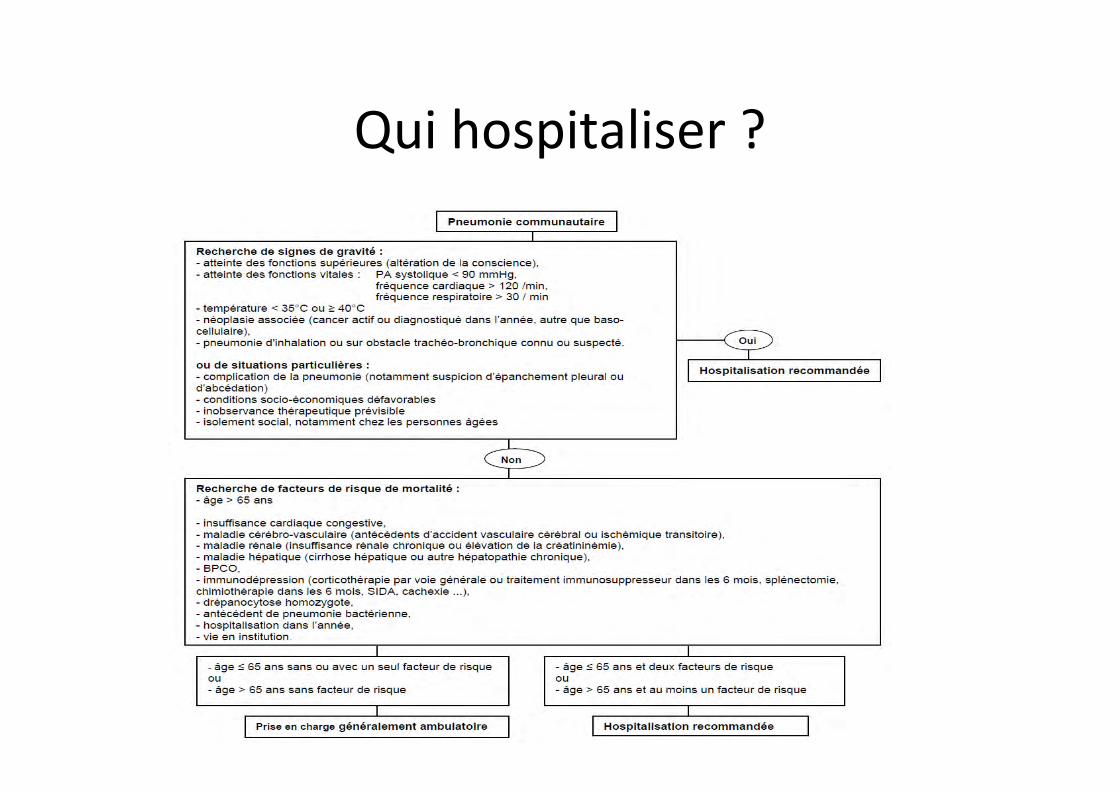
Qui hospitaliser ?
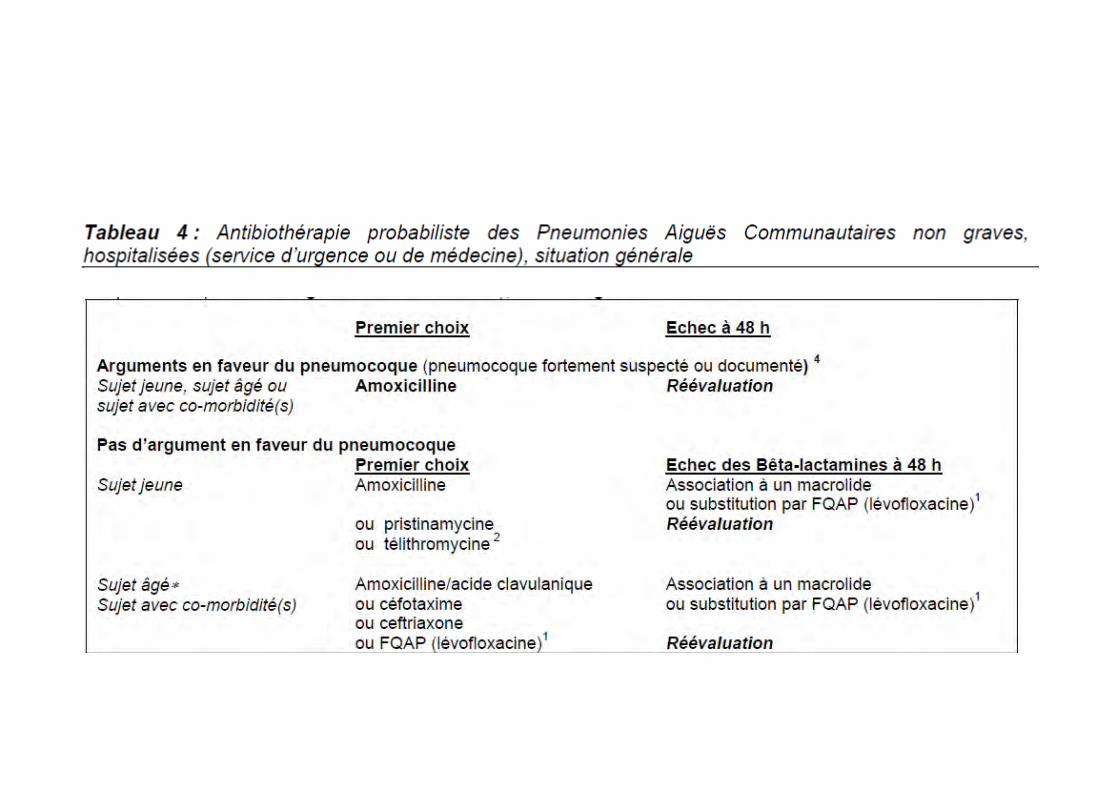
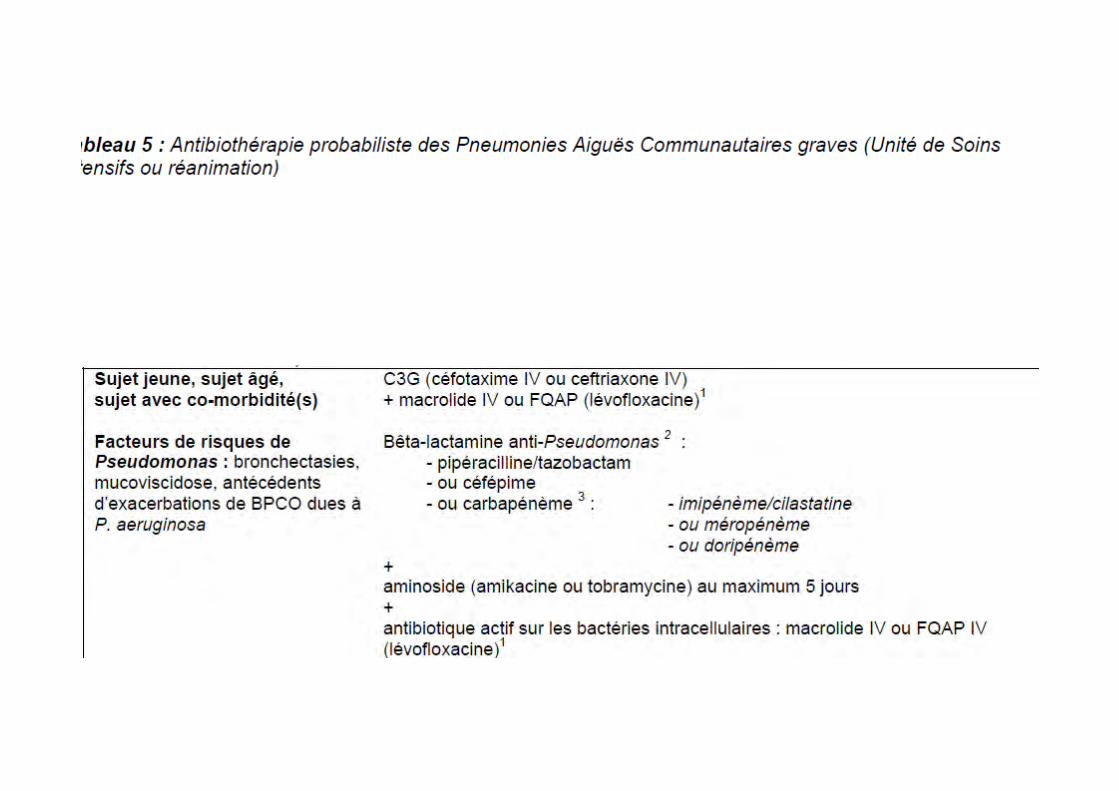

• Bithérapie pour qui ? • Cor1coïdes quand ? Comment ? • Durée de traitement ?
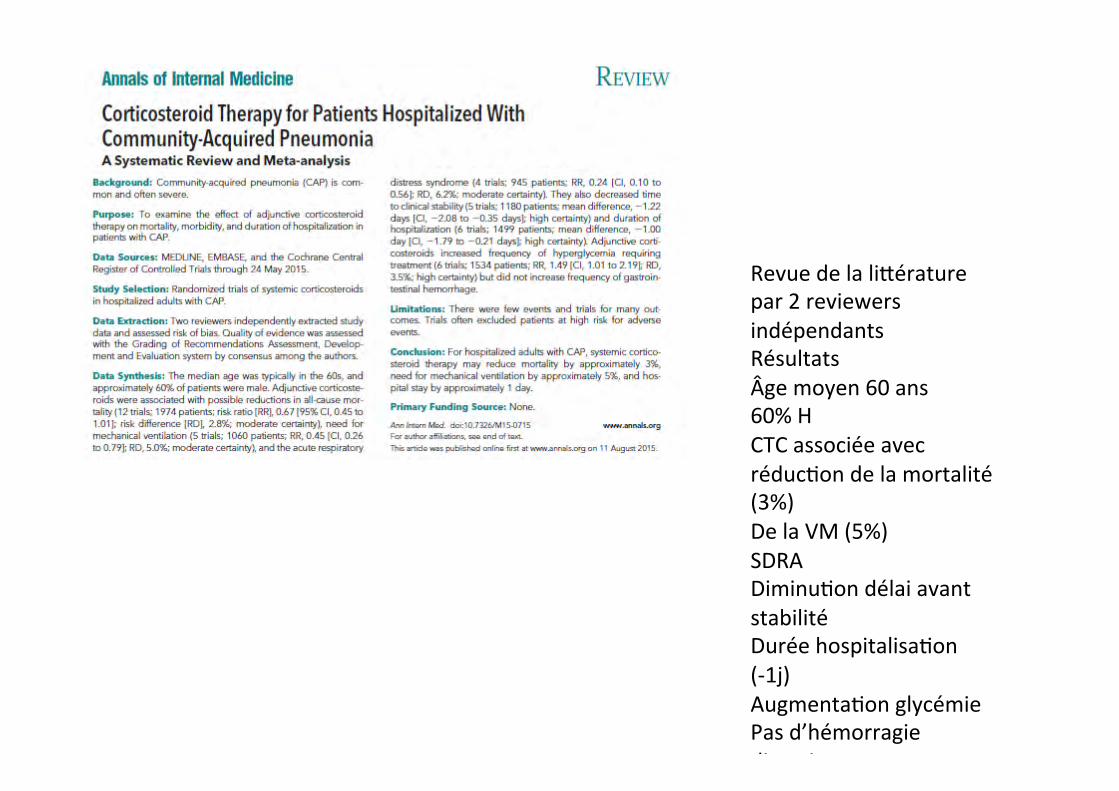
Revue de la liPérature par 2 reviewers indépendants Résultats Âge moyen 60 ans 60% H CTC associée avec réduc1on de la mortalité (3%) De la VM (5%) SDRA Diminu1on délai avant stabilité Durée hospitalisa1on (-‐1j) Augmenta1on glycémie Pas d’hémorragie diges1ve
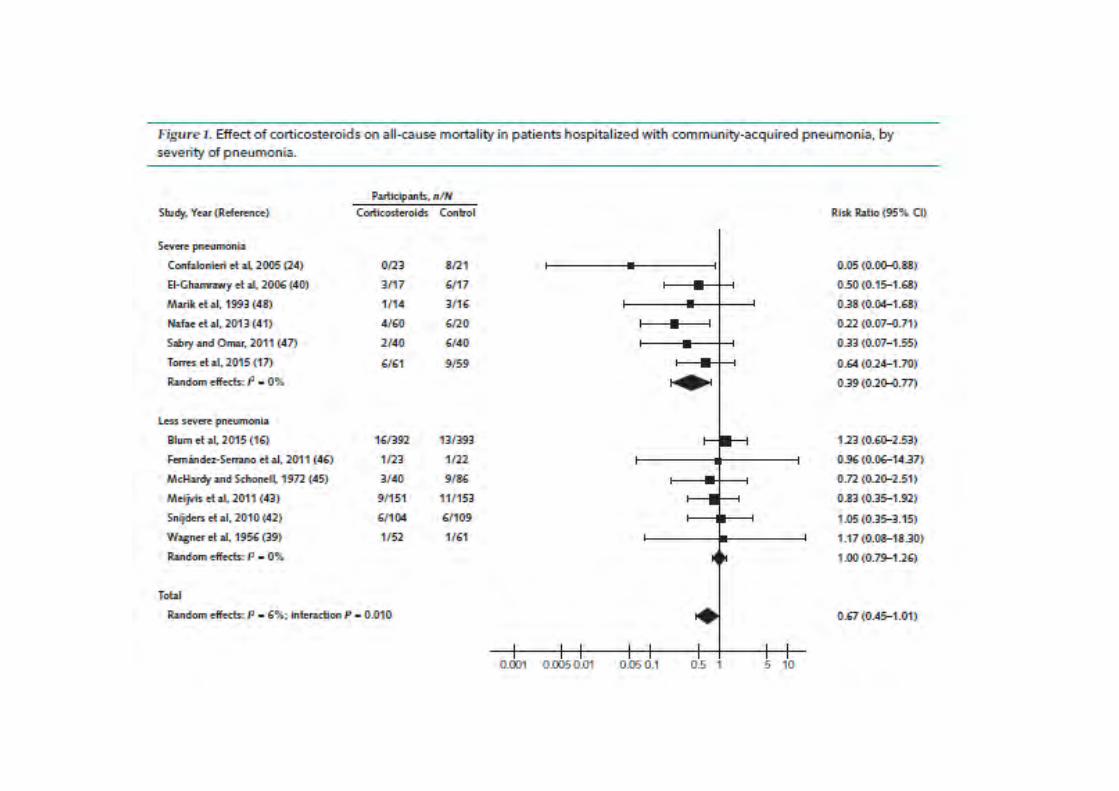
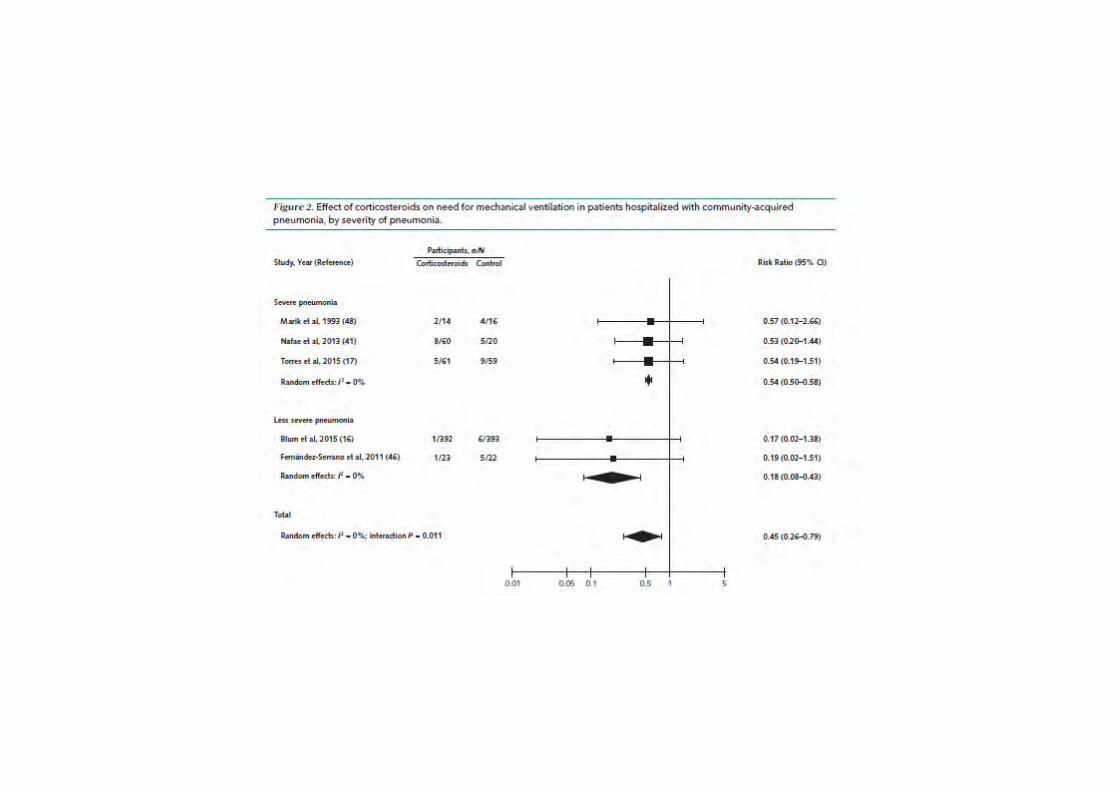
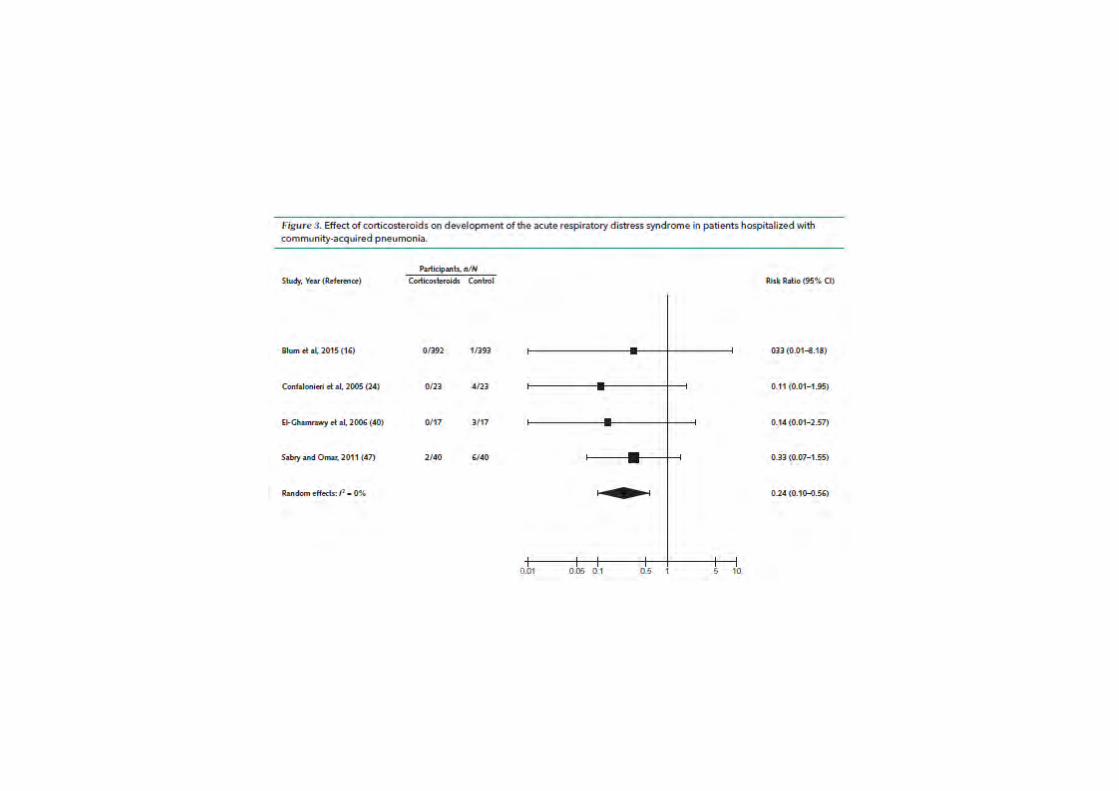
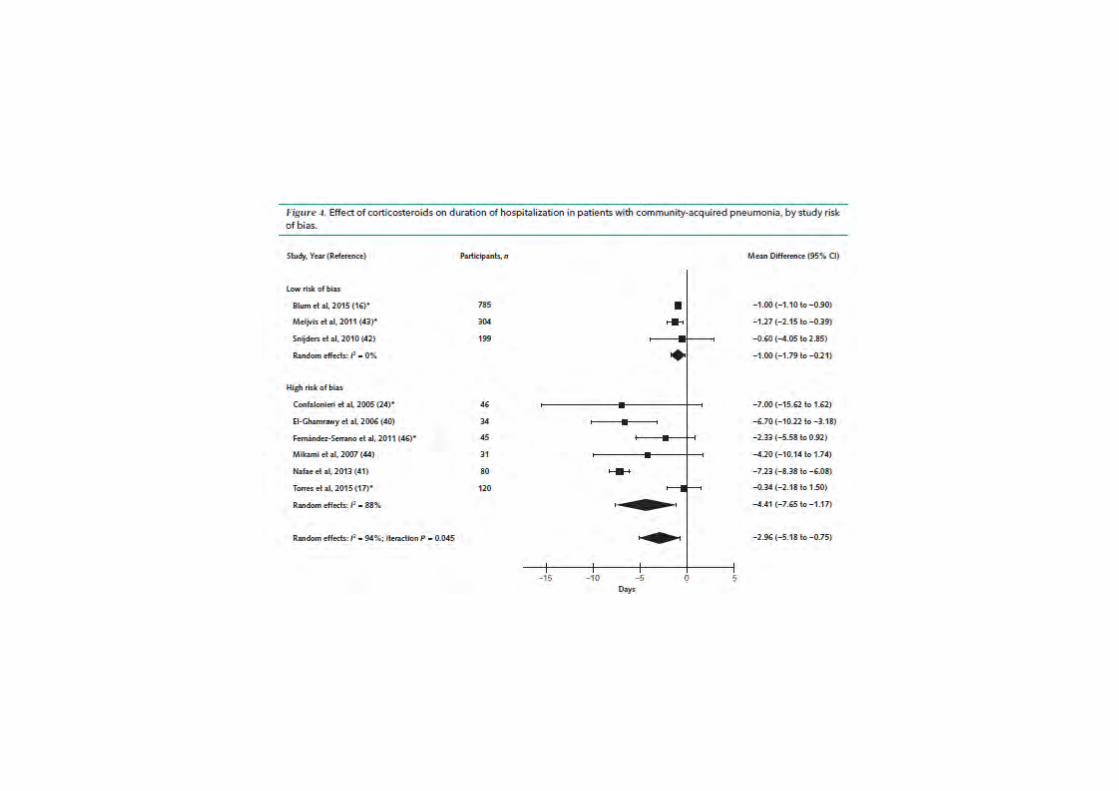

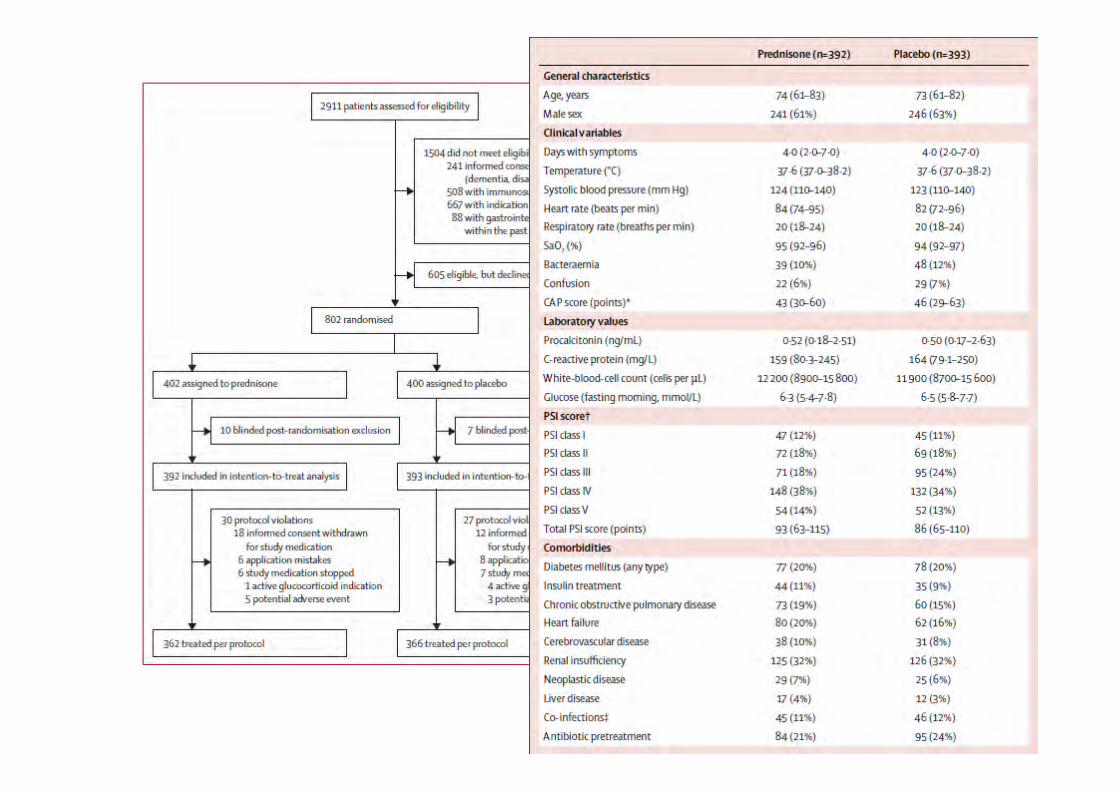
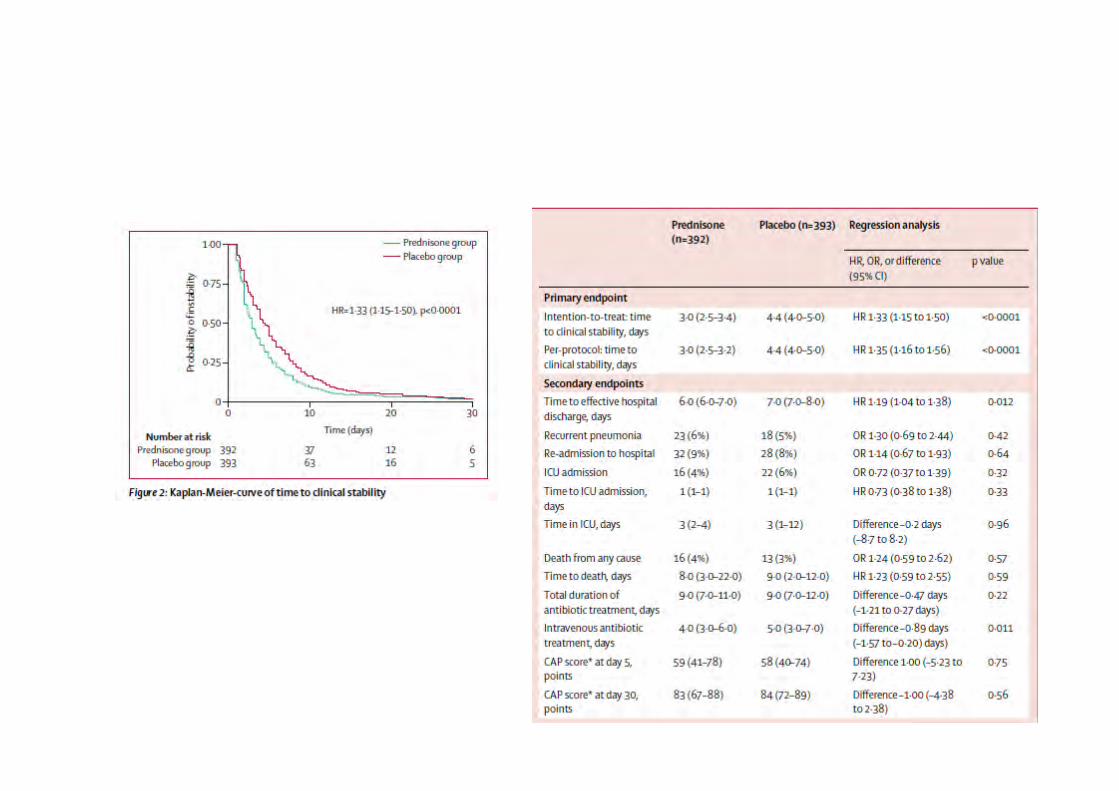
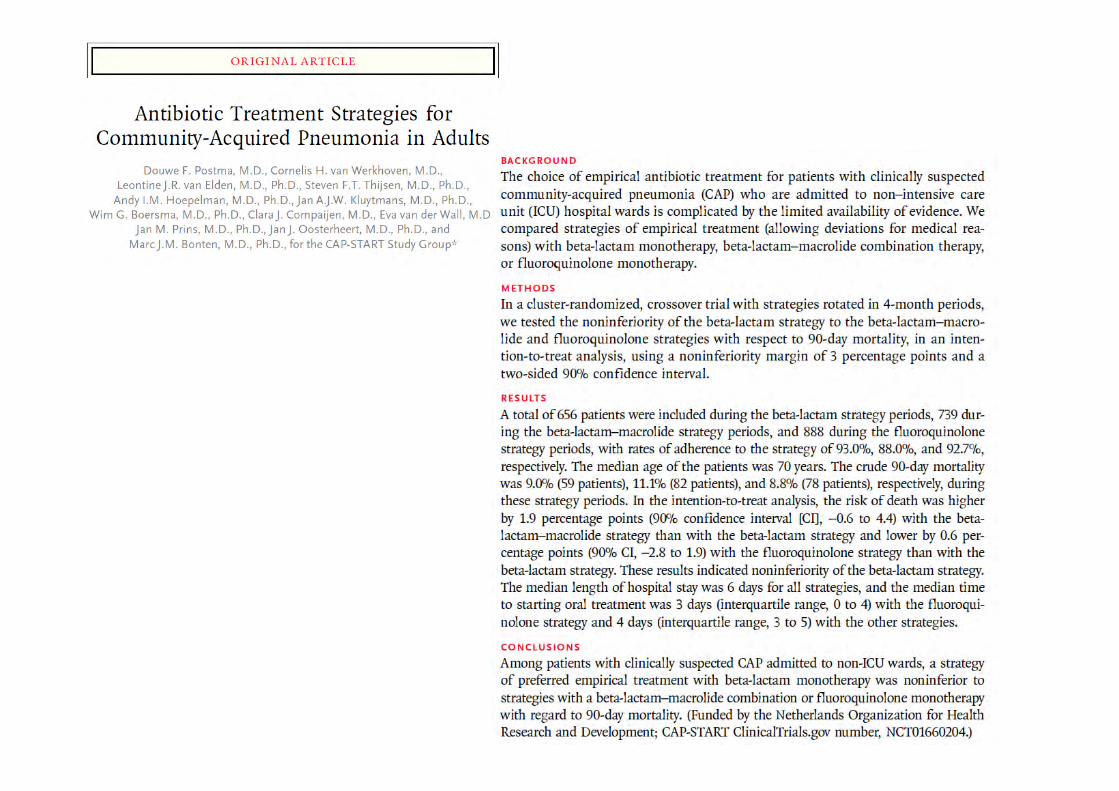
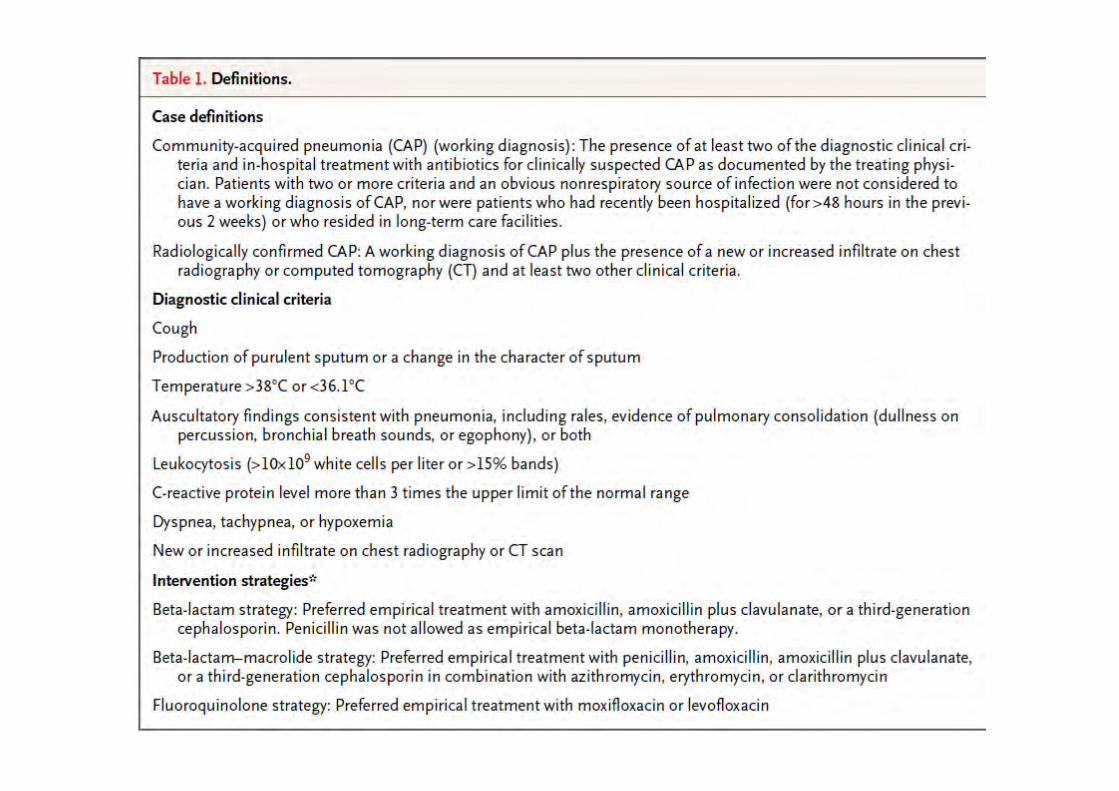
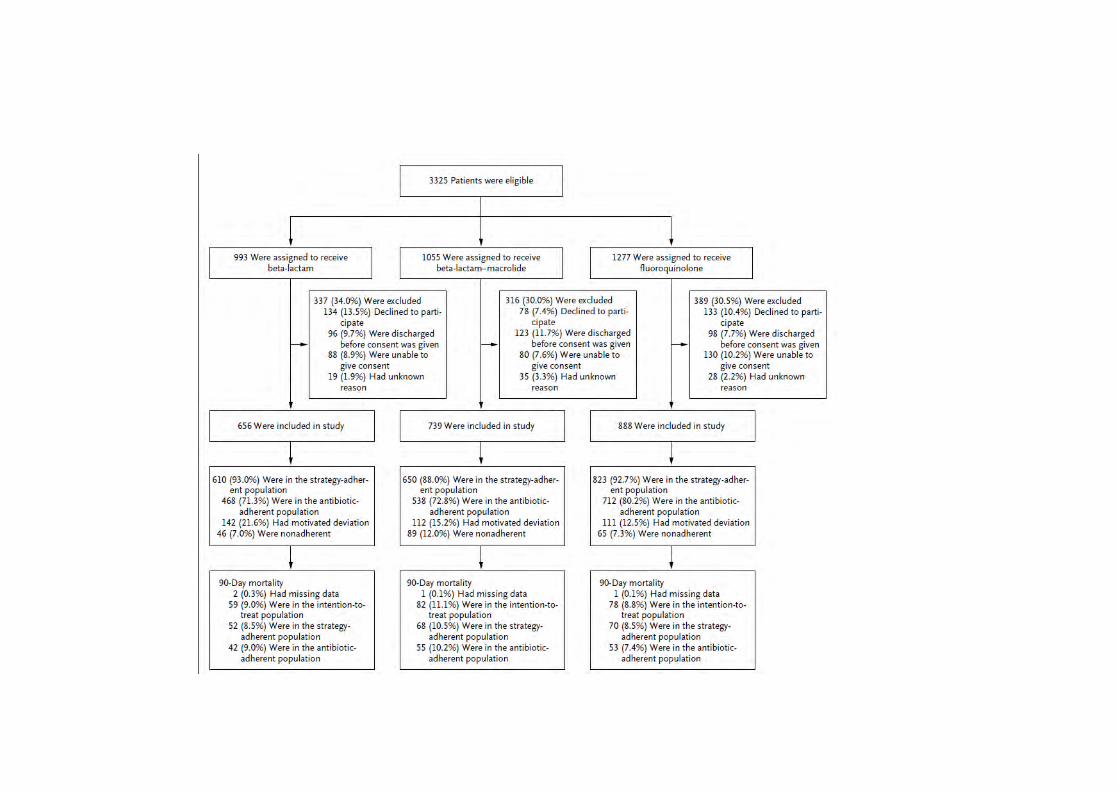
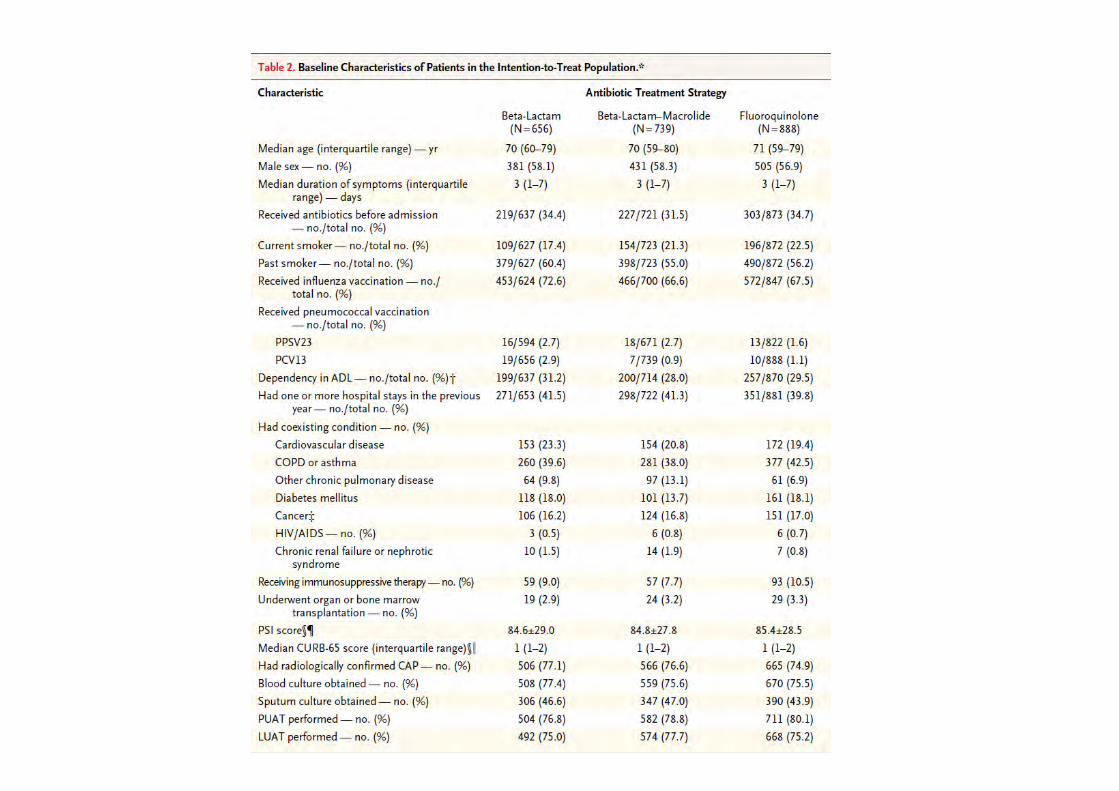
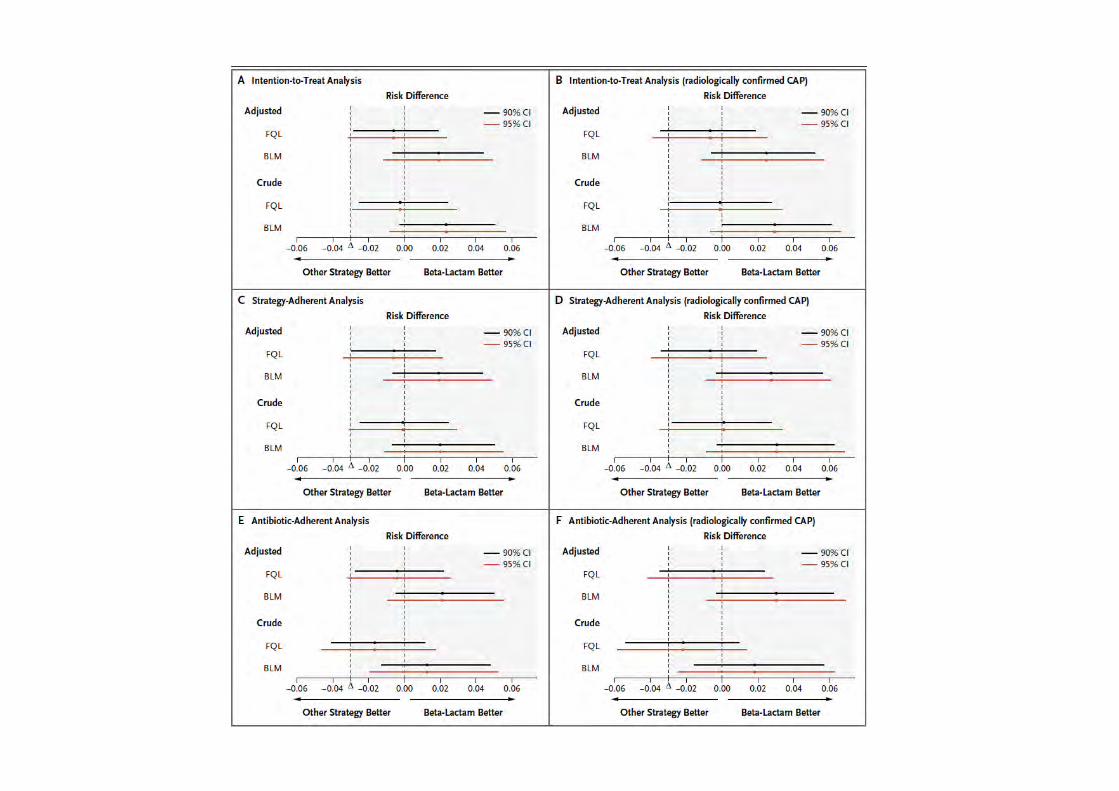
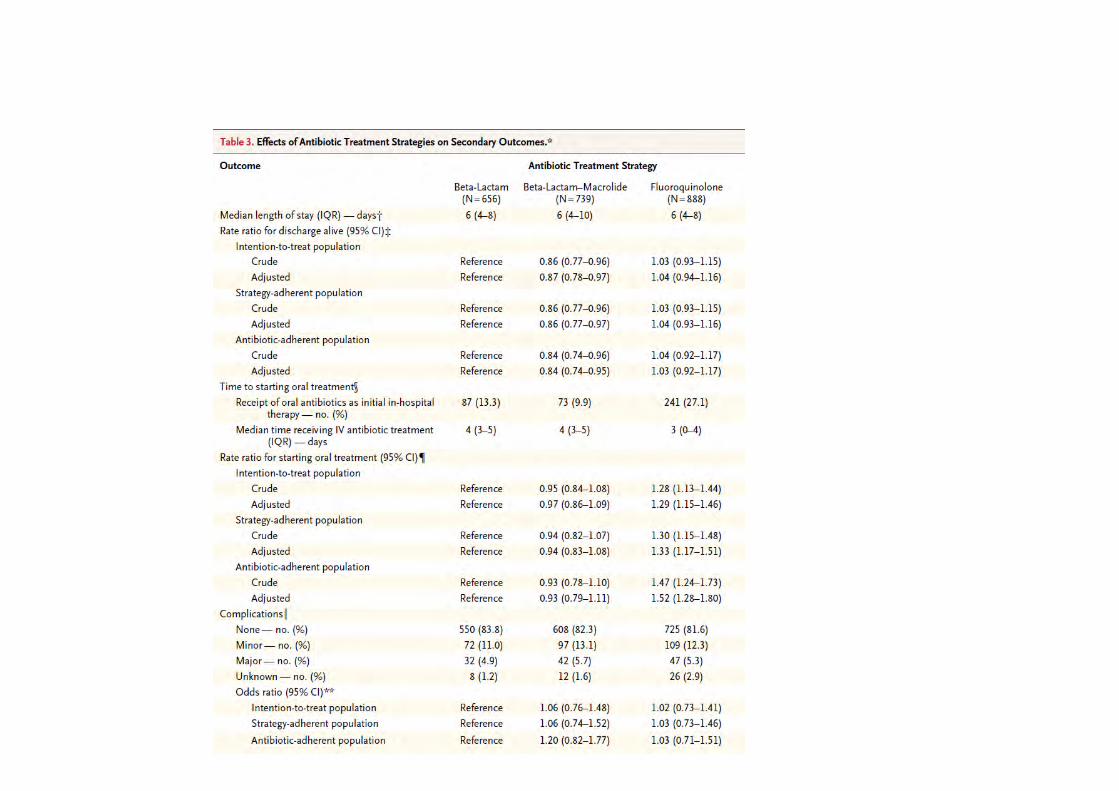
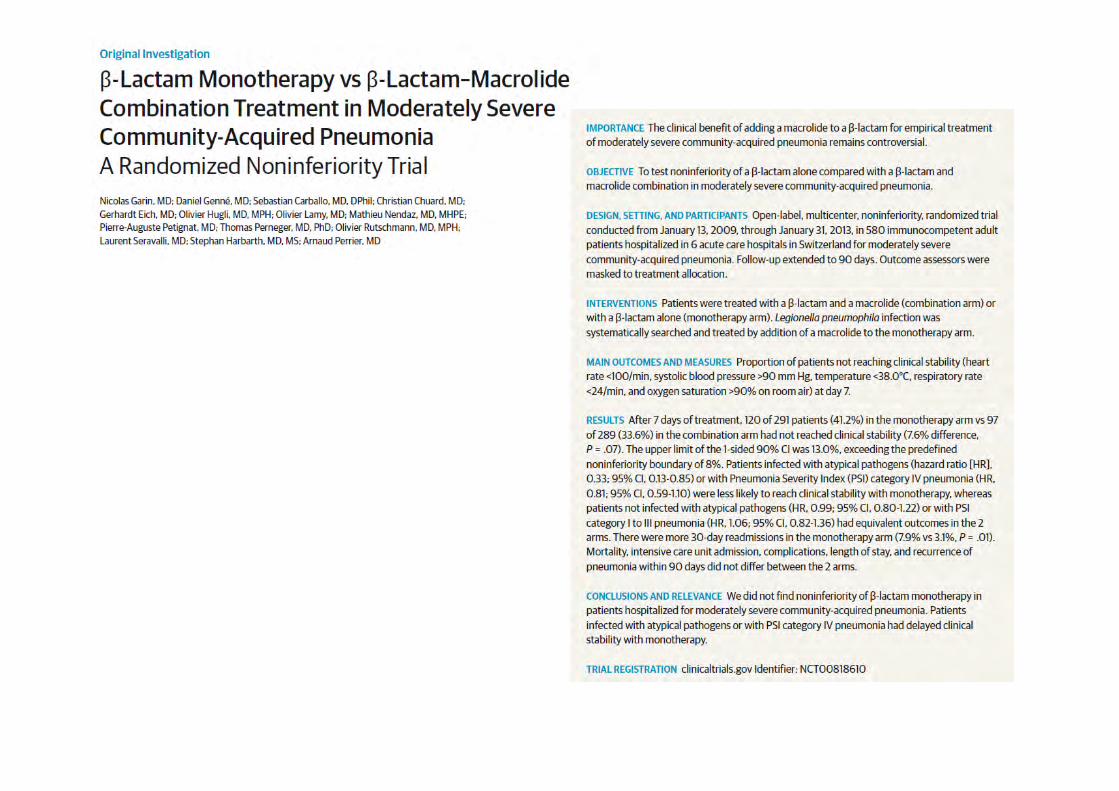
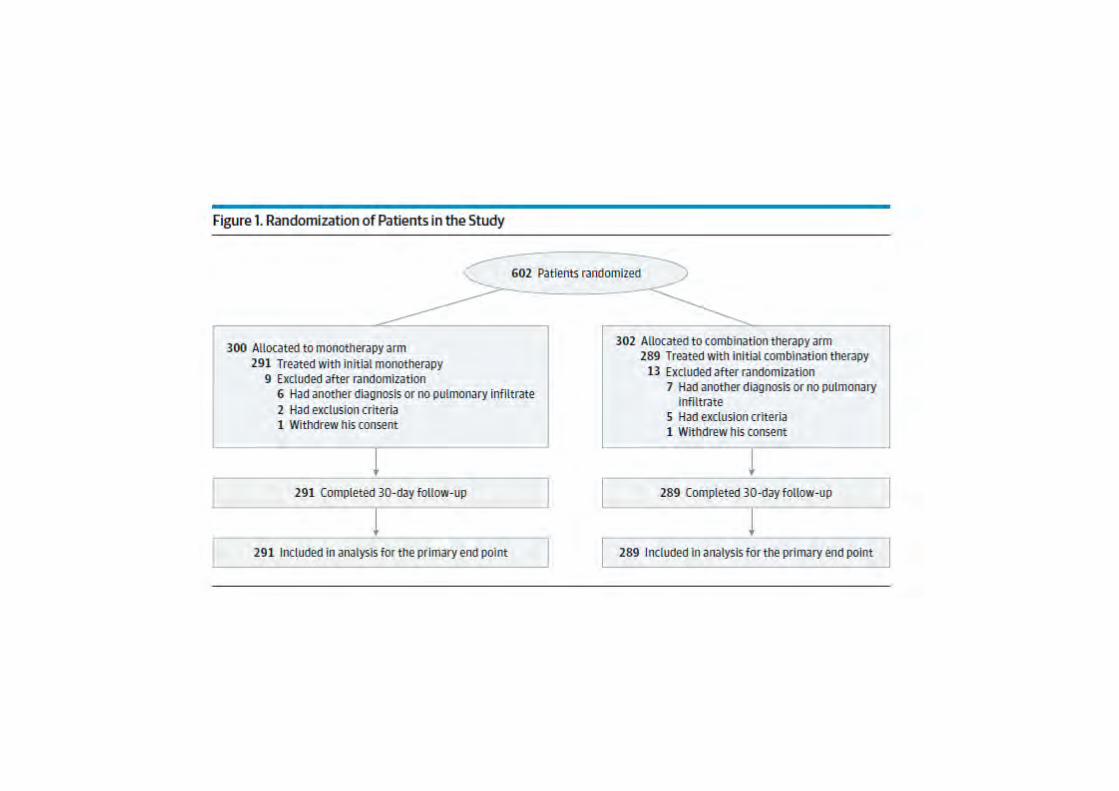
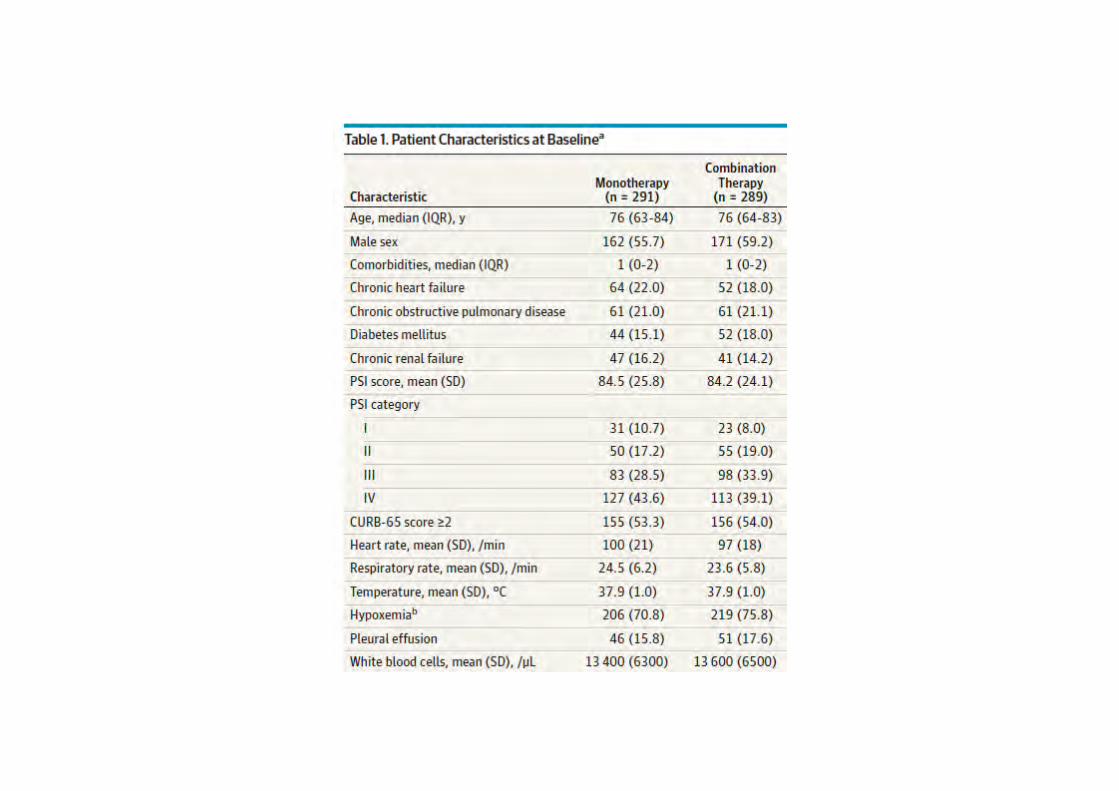
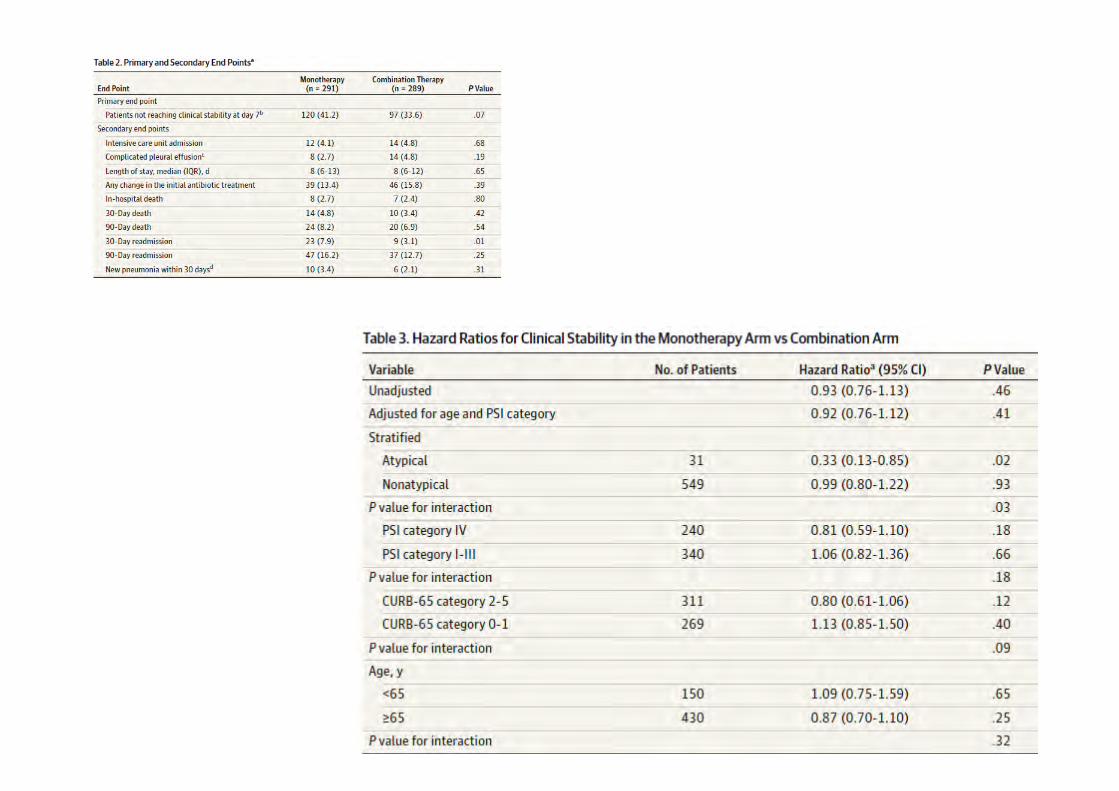
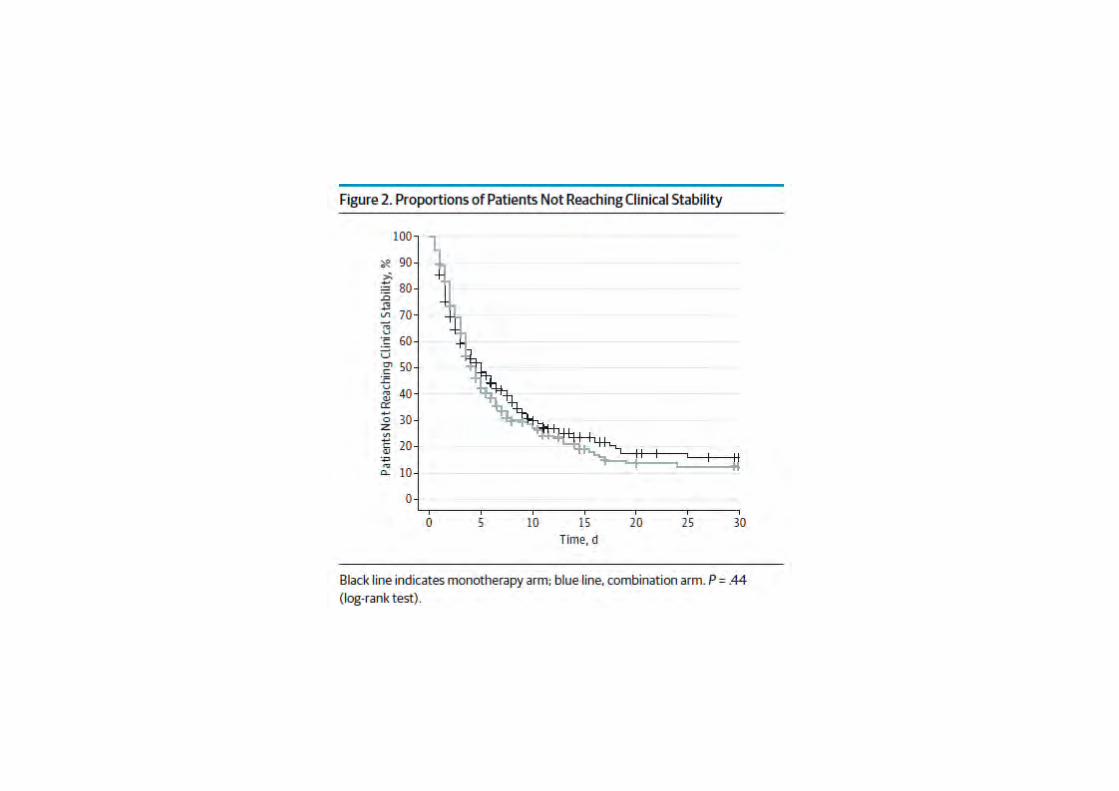
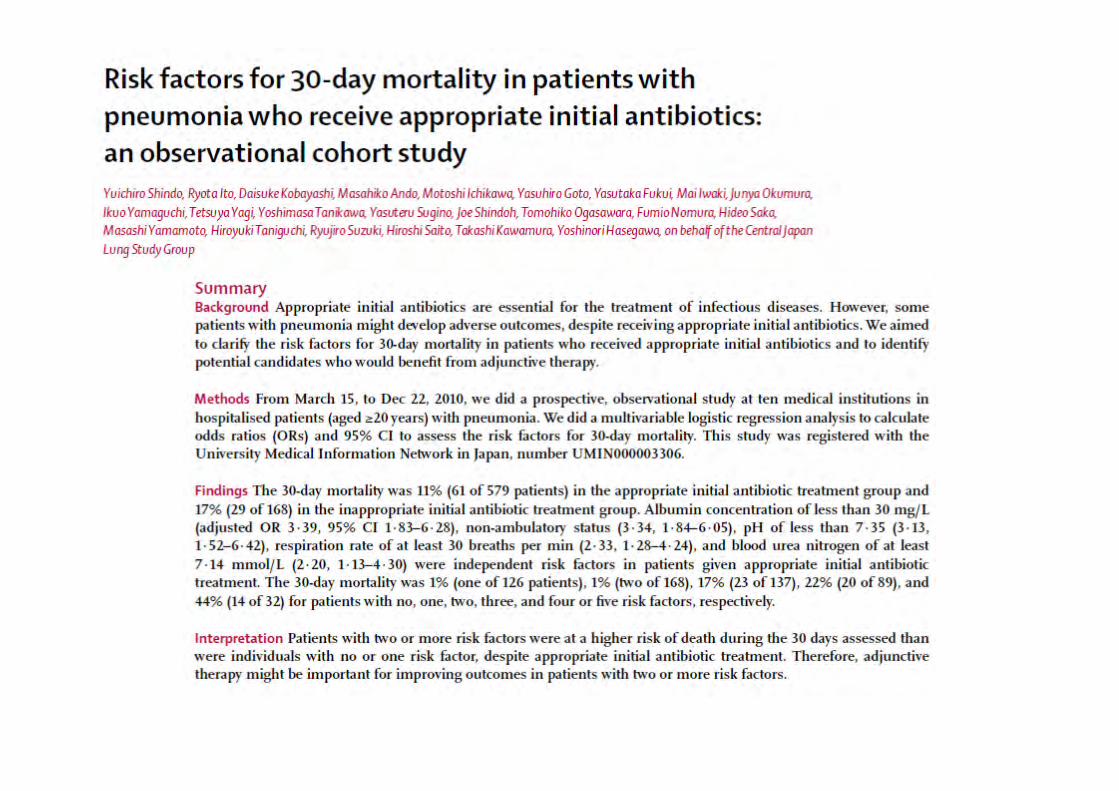
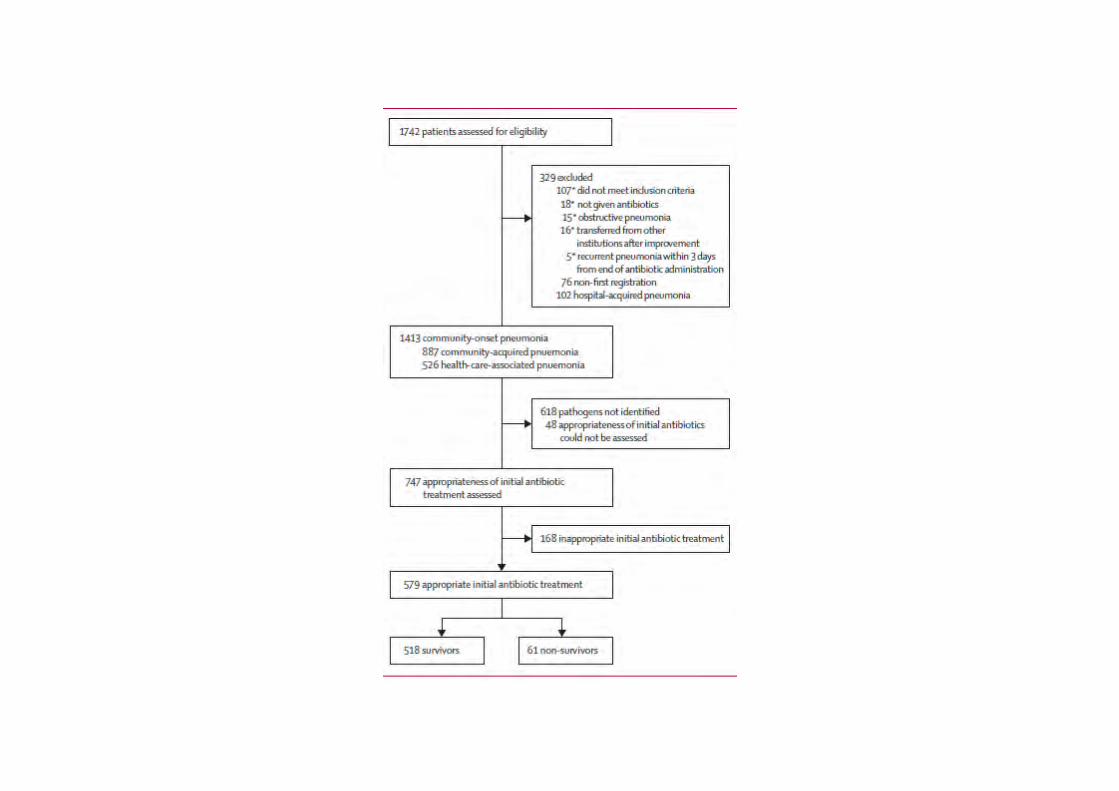
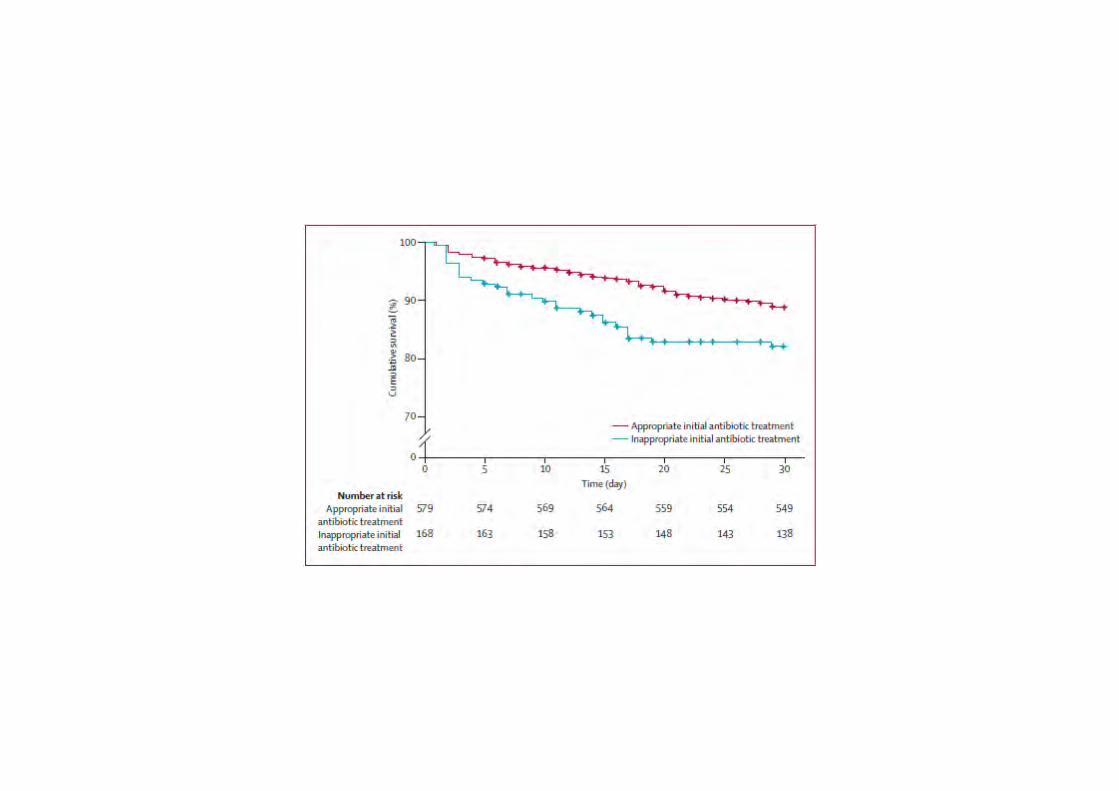
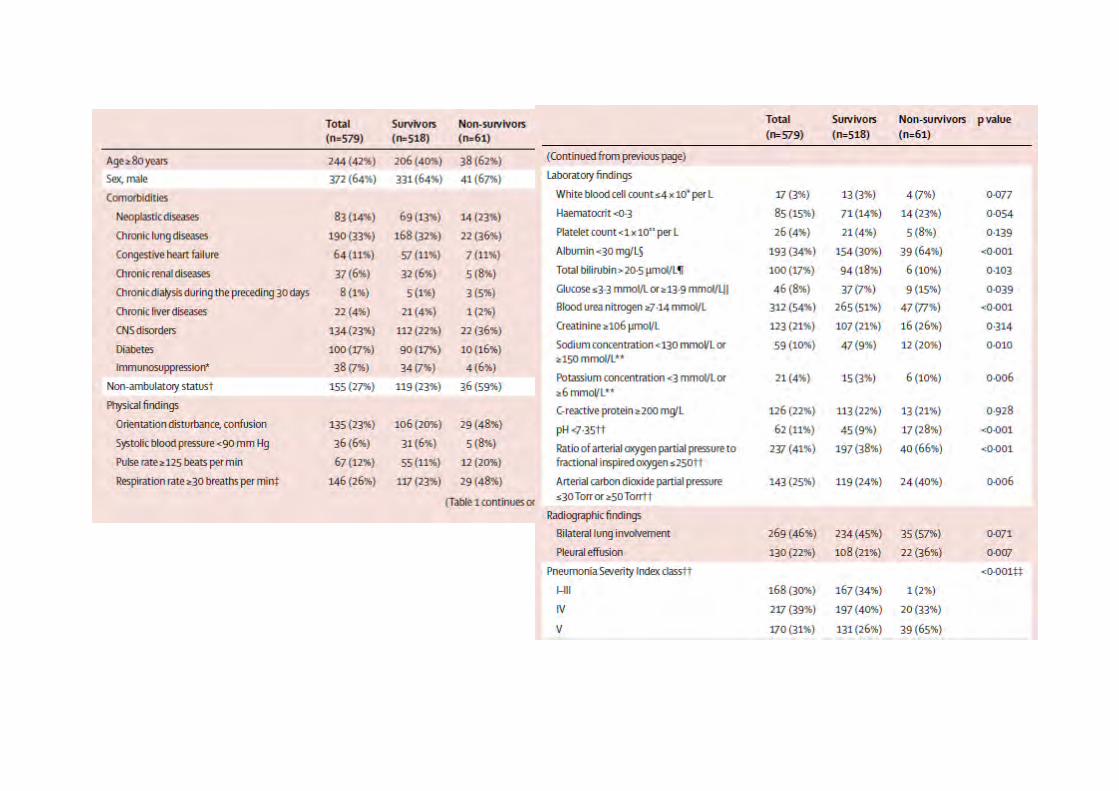
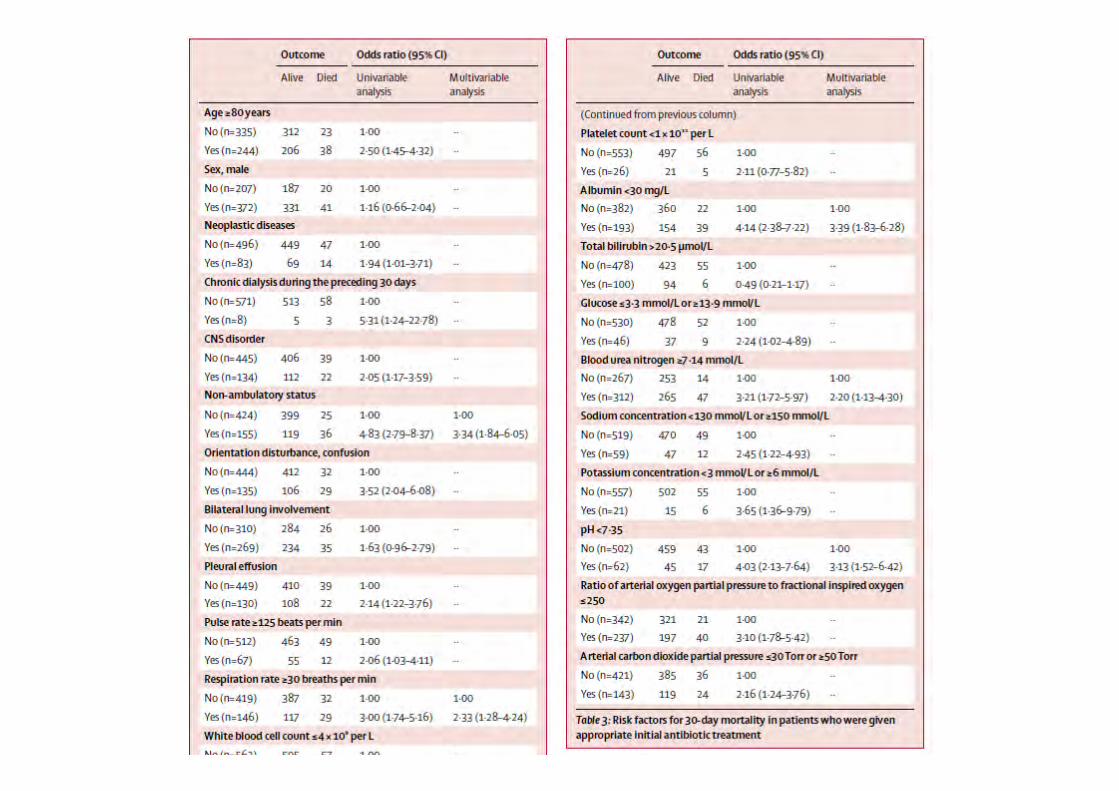
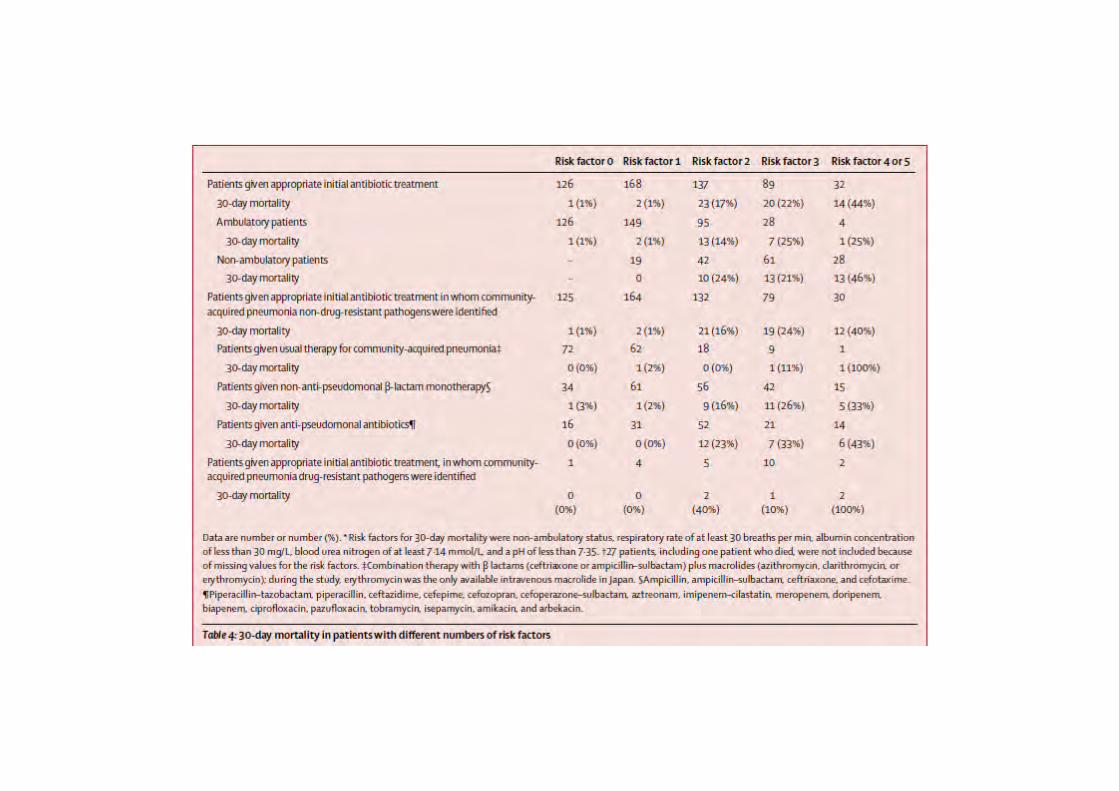
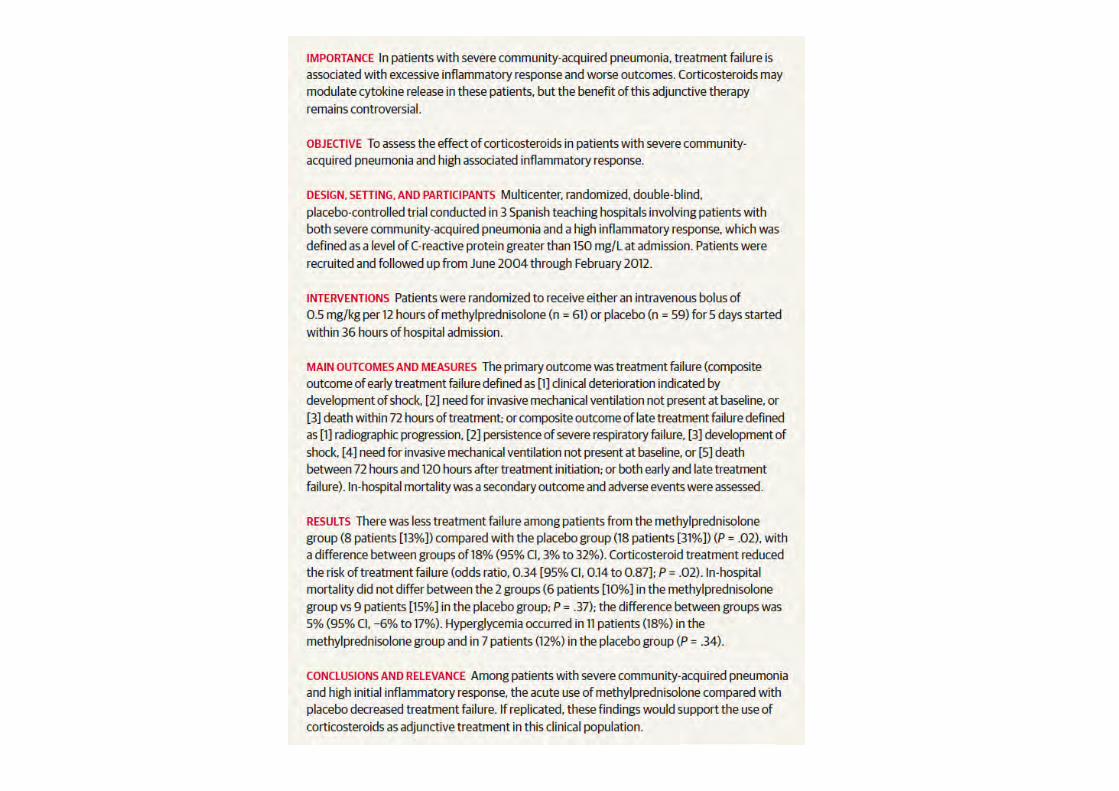
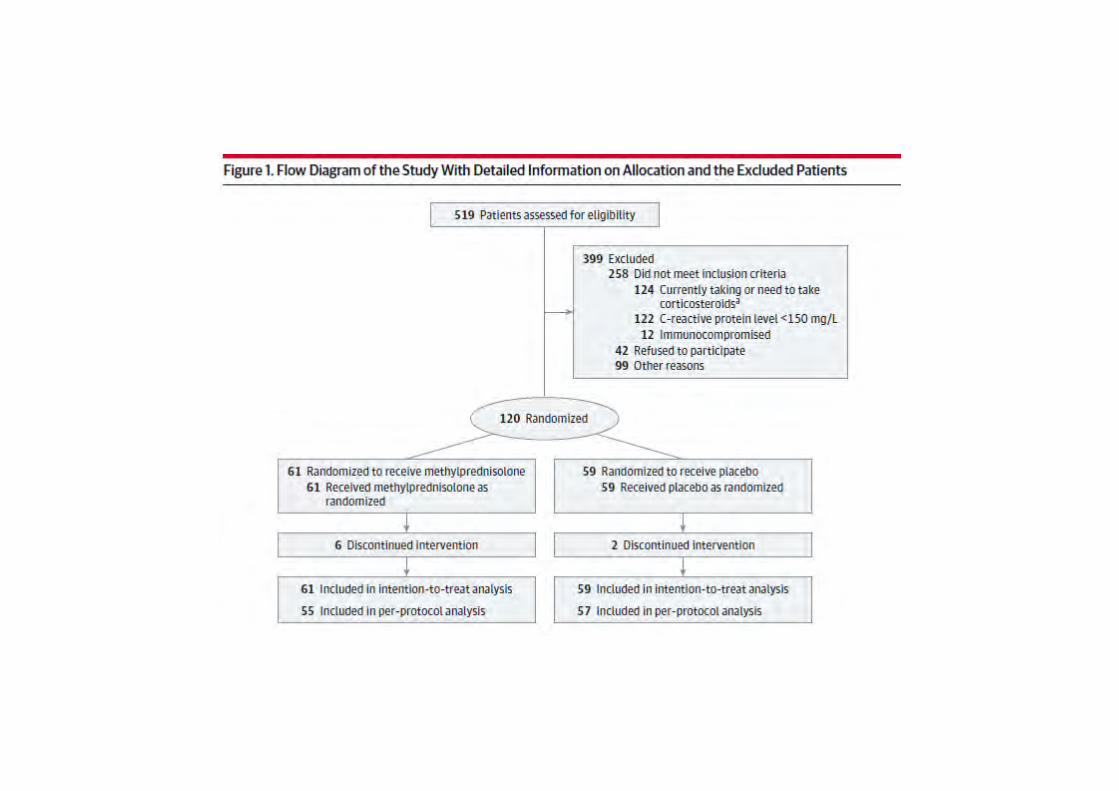
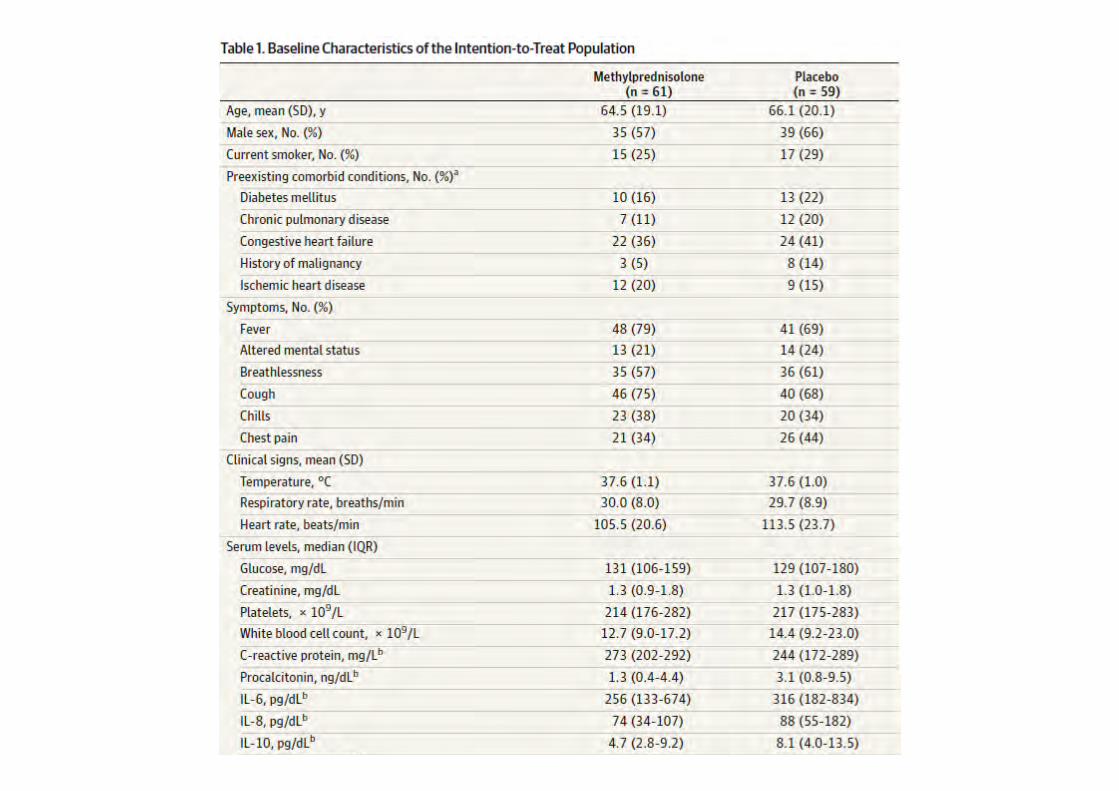
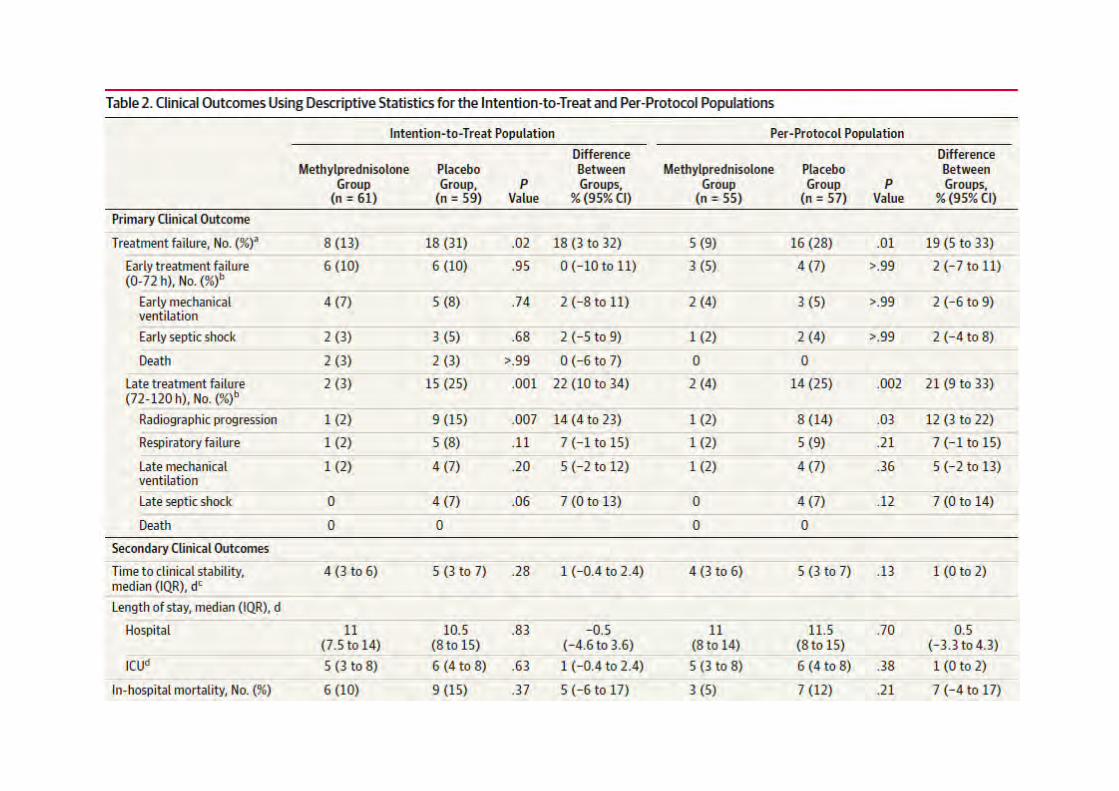
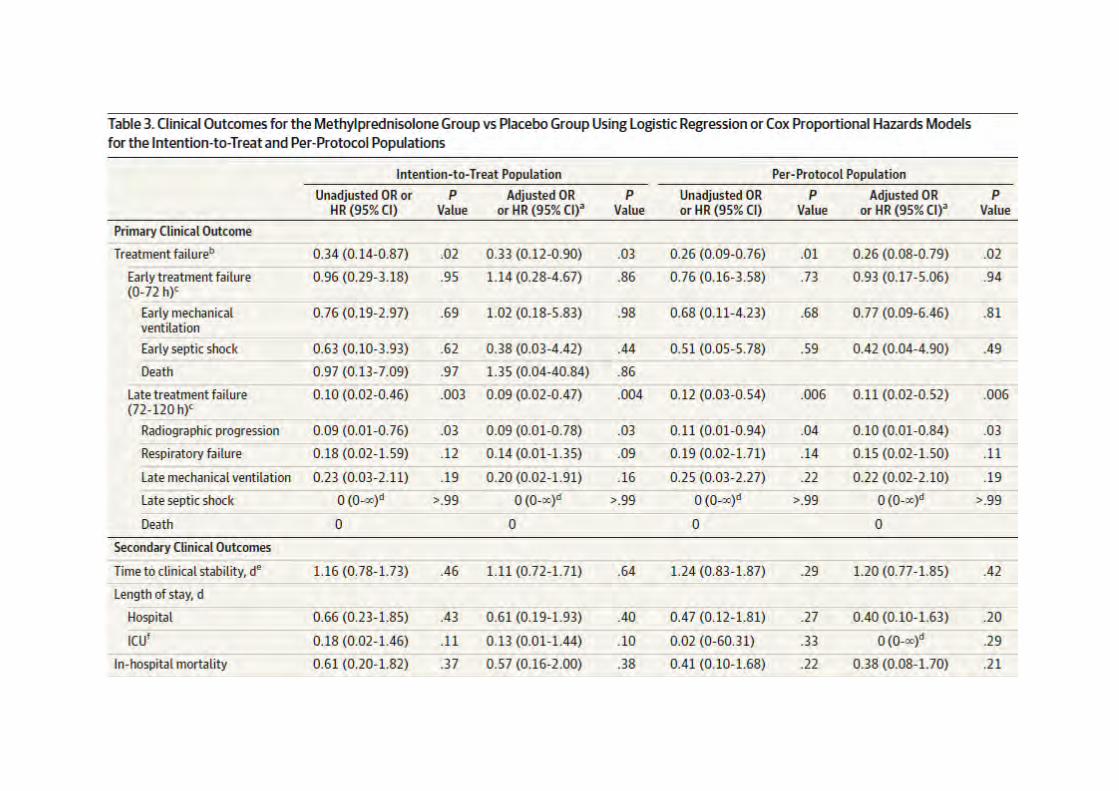
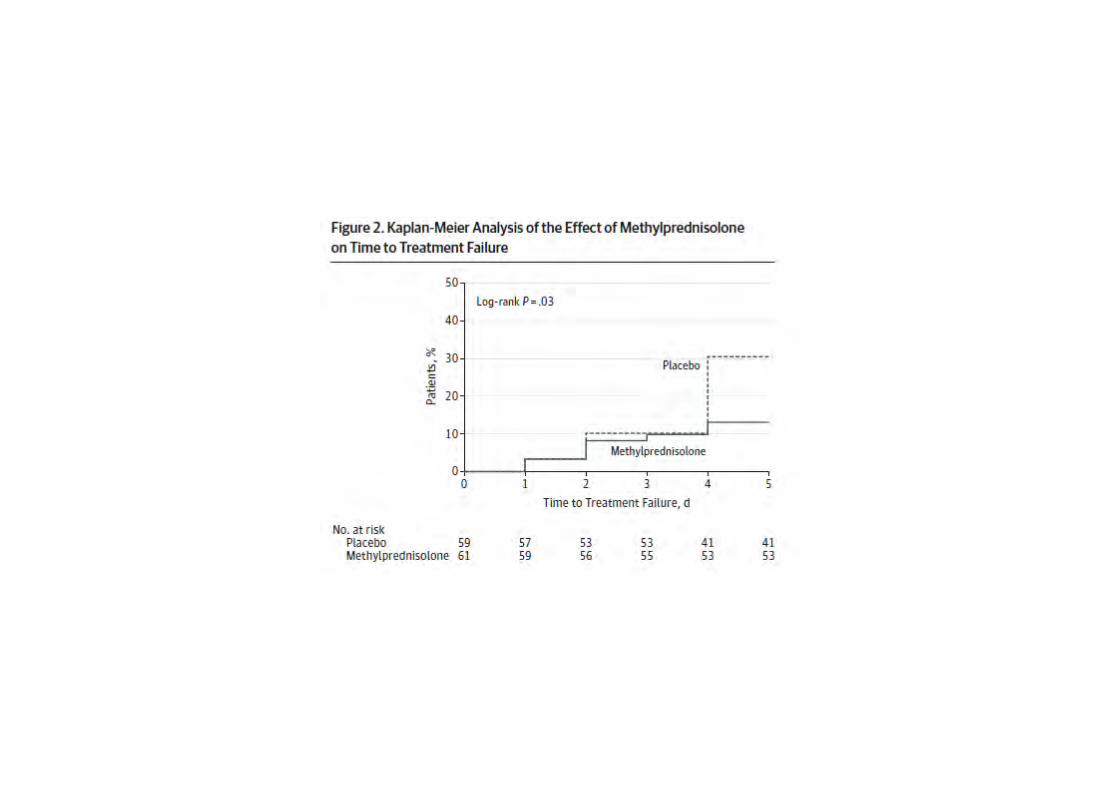
Durée de traitement des pneumonies : intérêt et
faisabilité des traitements de durée courte
Aurélien DINH, Référent antibiotique
Hôpitaux Paris Ile de France Ouest
Service de pneumologie le 15 novembre 2013
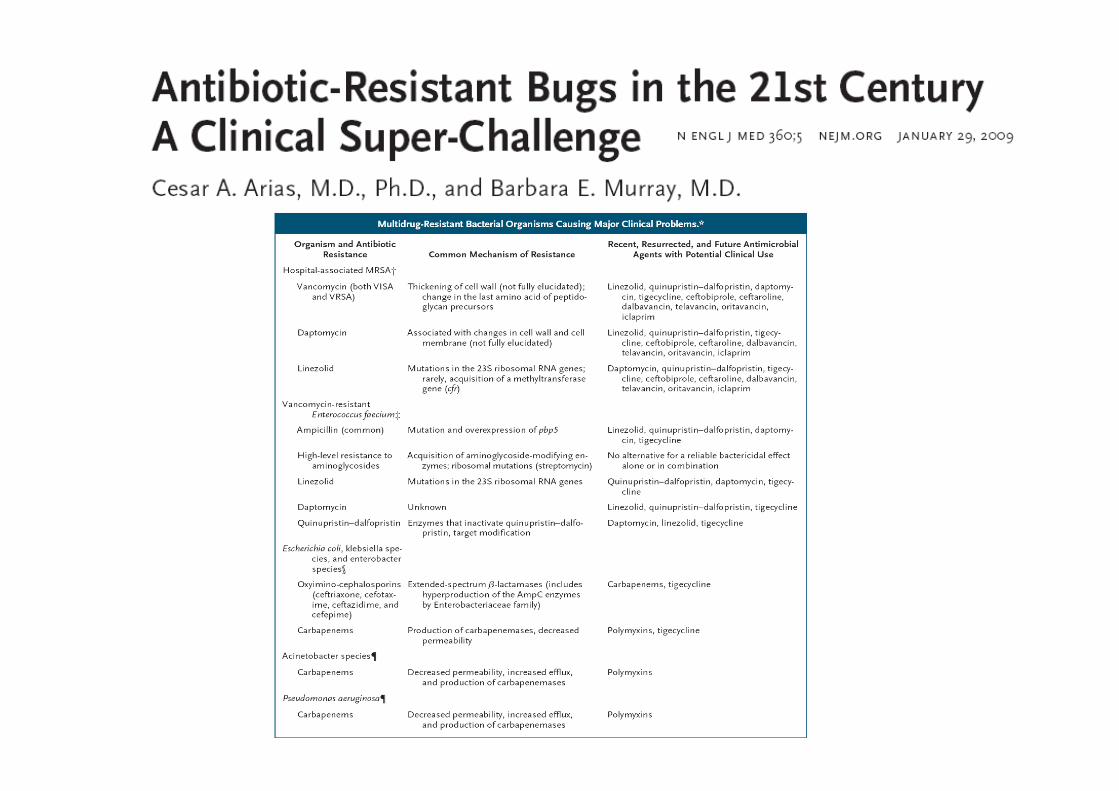

Mécanisme d’émergences de résistances
• Direct : Émergence de résistance au site infectieux – Une seule espèce – Faible nombre de
bactéries – Ne touche que les
patients réellement infectés
– Un seul mécanisme de résistance
• Indirecte : émergence de résistance au niveau de la flore commensale (cutanée, digestive) – Plusieurs espèces – Grand nombre de
bactéries – Mécanismes de
résistance multiple – Touche tous les
patients mêmes non traités
+++++
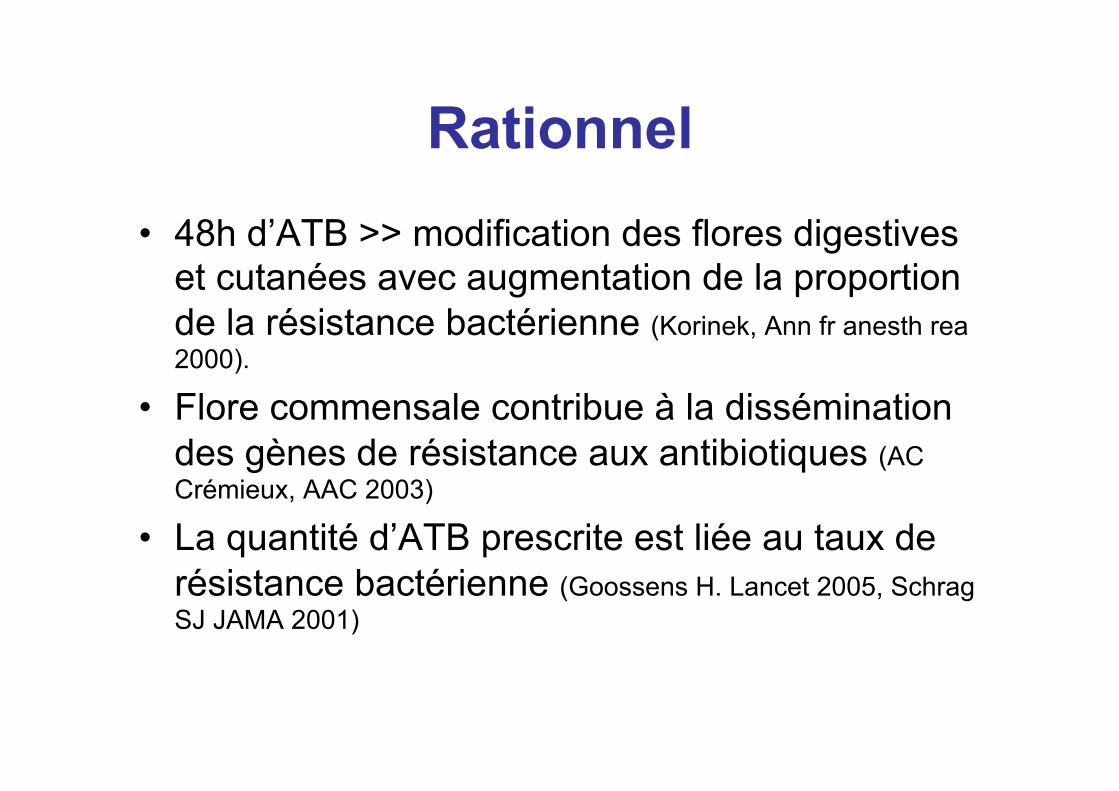
Rationnel • 48h d’ATB >> modification des flores digestives
et cutanées avec augmentation de la proportion de la résistance bactérienne (Korinek, Ann fr anesth rea 2000).
• Flore commensale contribue à la dissémination des gènes de résistance aux antibiotiques (AC Crémieux, AAC 2003)
• La quantité d’ATB prescrite est liée au taux de résistance bactérienne (Goossens H. Lancet 2005, Schrag SJ JAMA 2001)

Impact sur les flores commensales
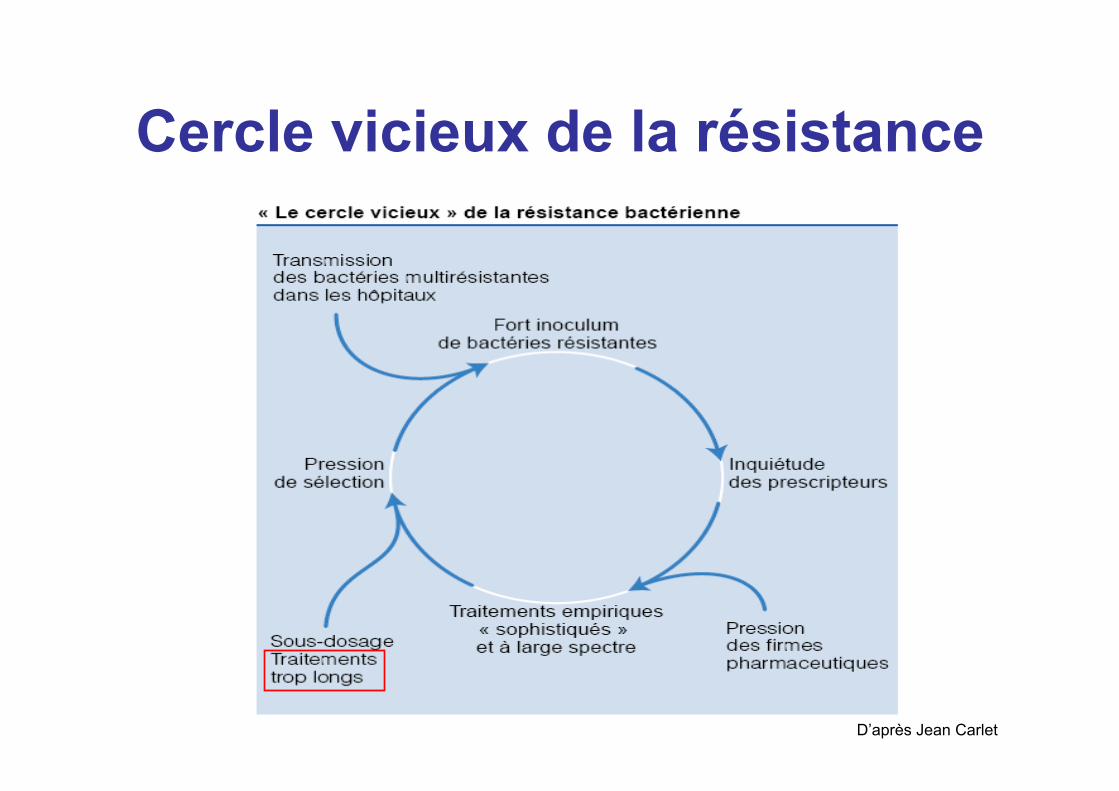
Cercle vicieux de la résistance
D’après Jean Carlet
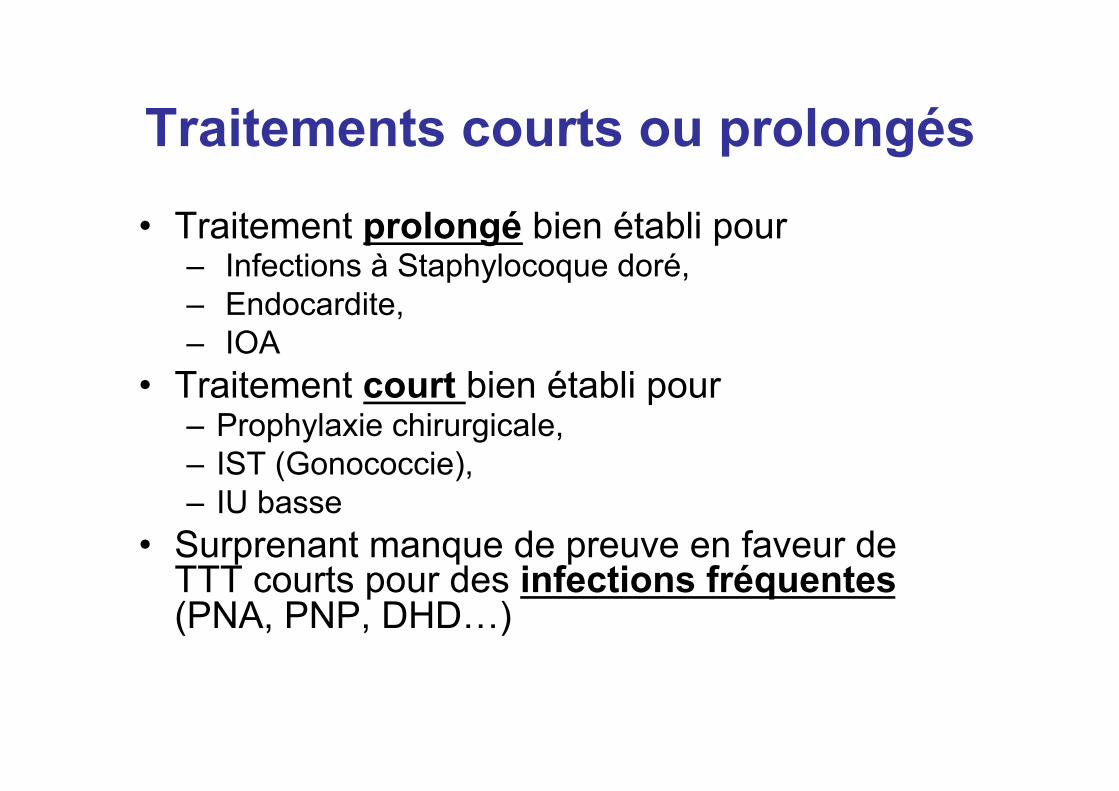
Traitements courts ou prolongés
• Traitement prolongé bien établi pour – Infections à Staphylocoque doré, – Endocardite, – IOA
• Traitement court bien établi pour – Prophylaxie chirurgicale, – IST (Gonococcie), – IU basse
• Surprenant manque de preuve en faveur de TTT courts pour des infections fréquentes (PNA, PNP, DHD…)
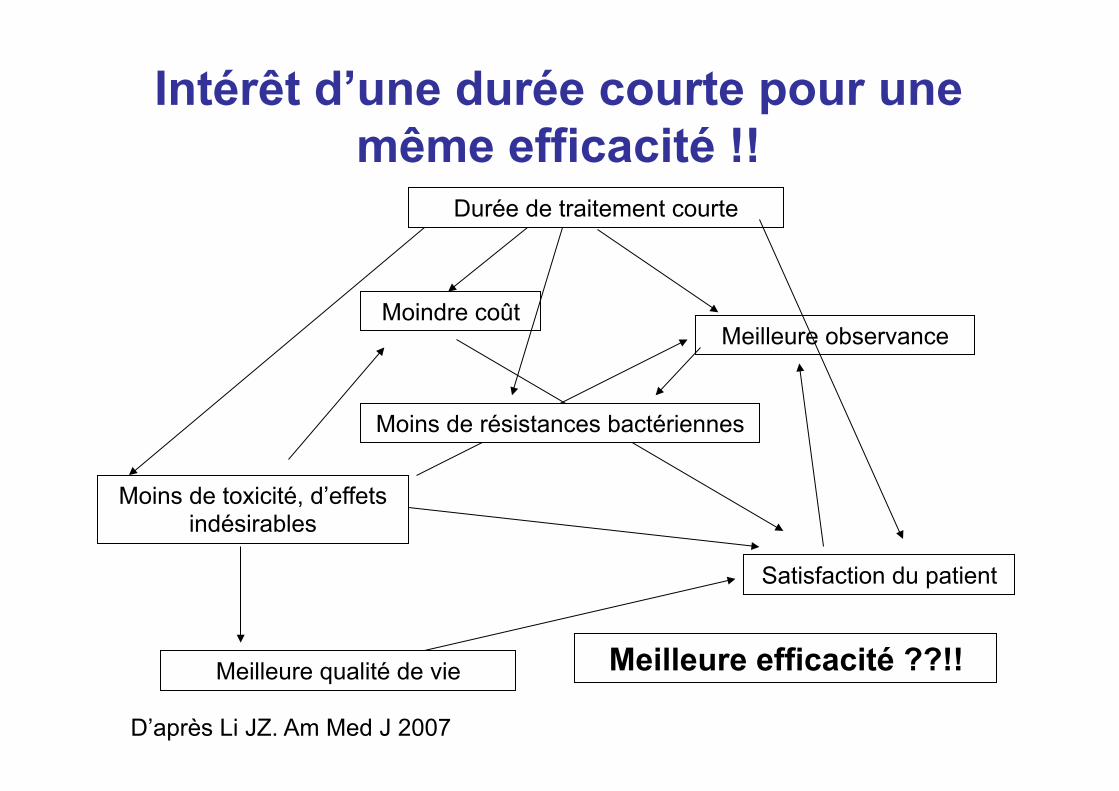
Intérêt d’une durée courte pour une même efficacité !!
Meilleure qualité de vie
Moins de toxicité, d’effets indésirables
Satisfaction du patient
Meilleure efficacité ??!!
Moins de résistances bactériennes
Durée de traitement courte
Moindre coût Meilleure observance
D’après Li JZ. Am Med J 2007

Effets indésirables de l’antibiothérapie
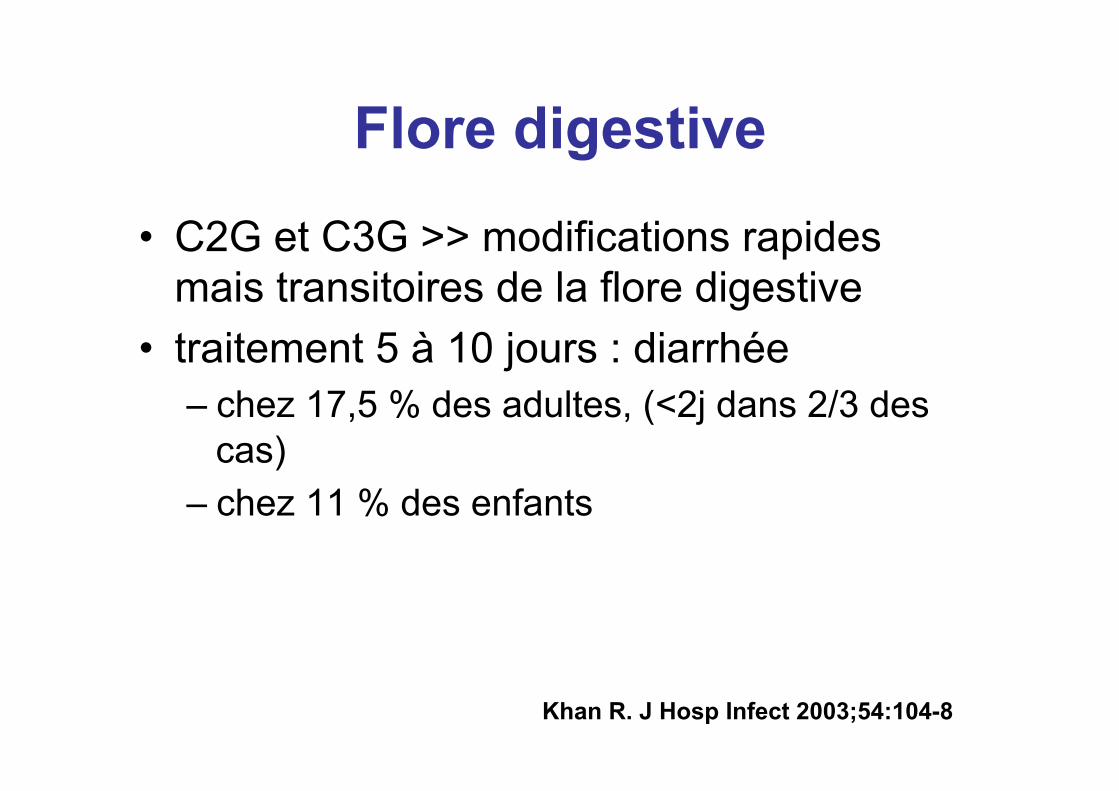
Flore digestive
• C2G et C3G >> modifications rapides mais transitoires de la flore digestive
• traitement 5 à 10 jours : diarrhée – chez 17,5 % des adultes, (<2j dans 2/3 des
cas) – chez 11 % des enfants
Khan R. J Hosp Infect 2003;54:104-8
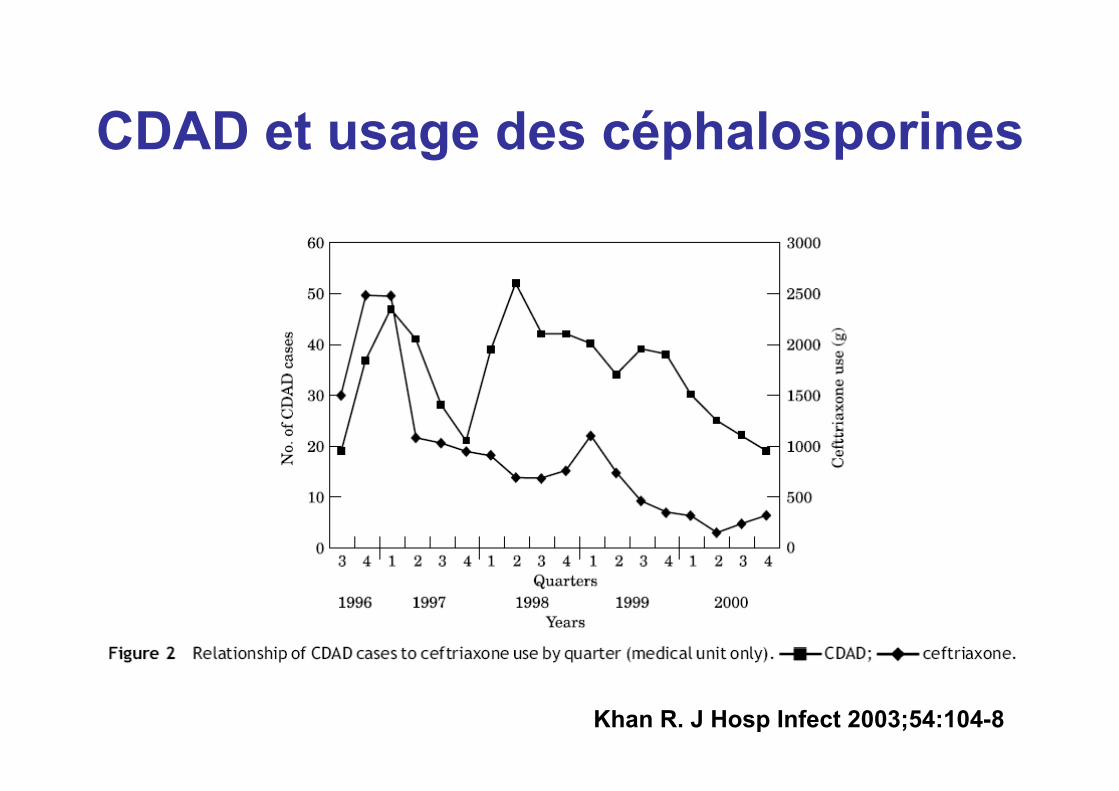
CDAD et usage des céphalosporines
Khan R. J Hosp Infect 2003;54:104-8
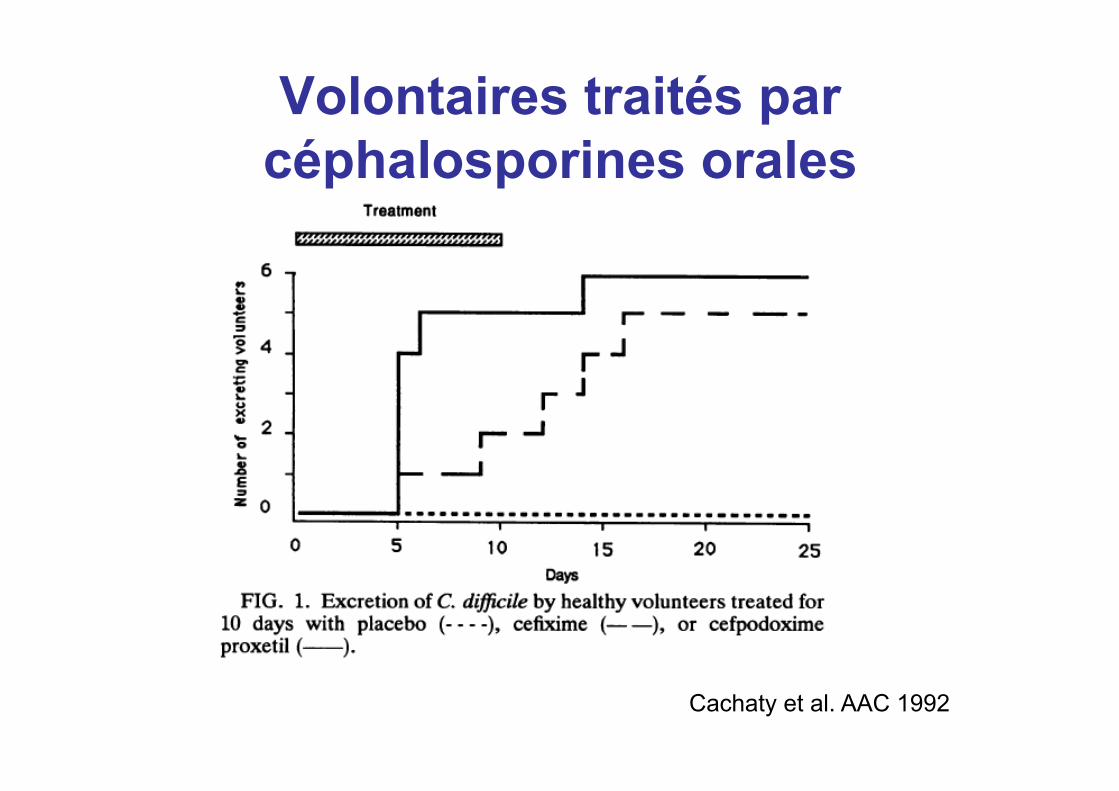
Volontaires traités par céphalosporines orales
Cachaty et al. AAC 1992
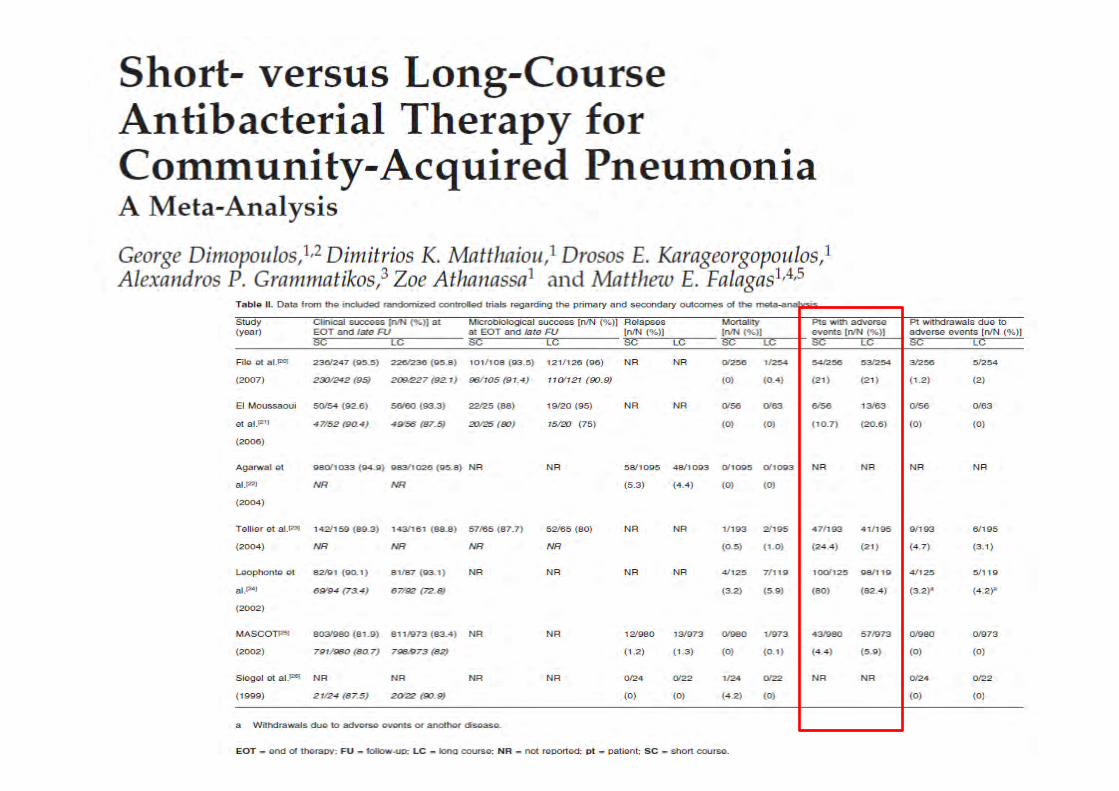

Coût de l’antibiothérapie
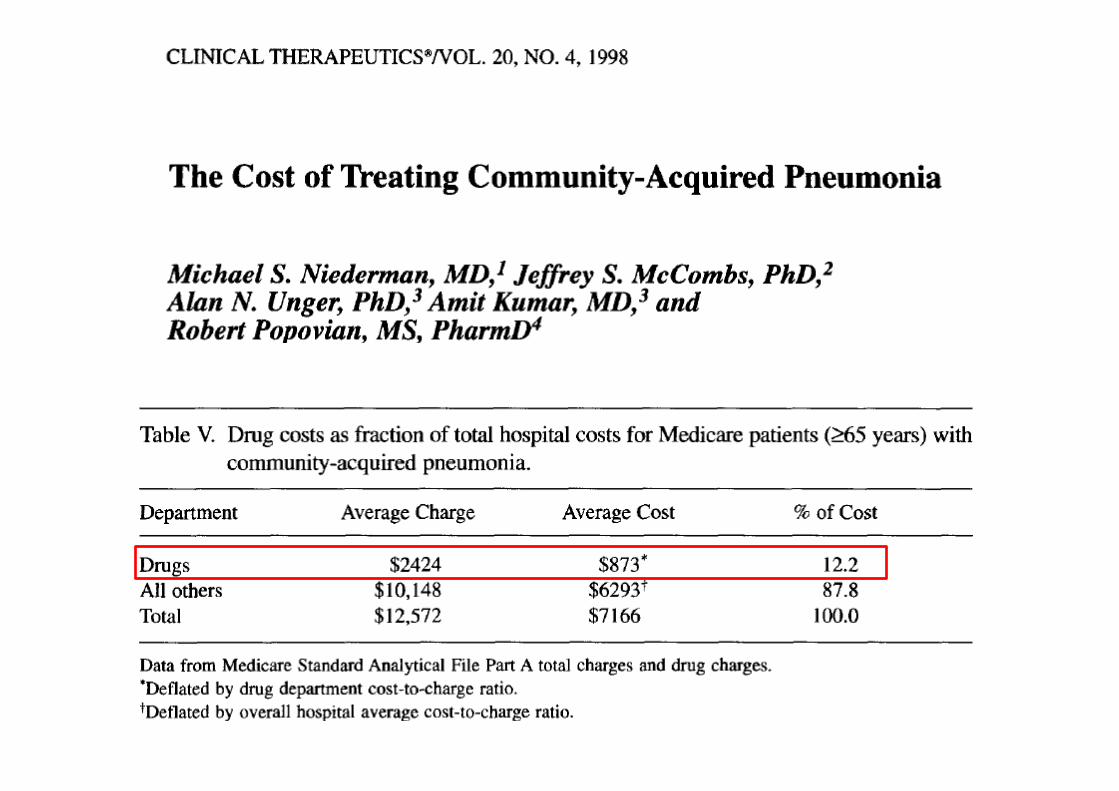
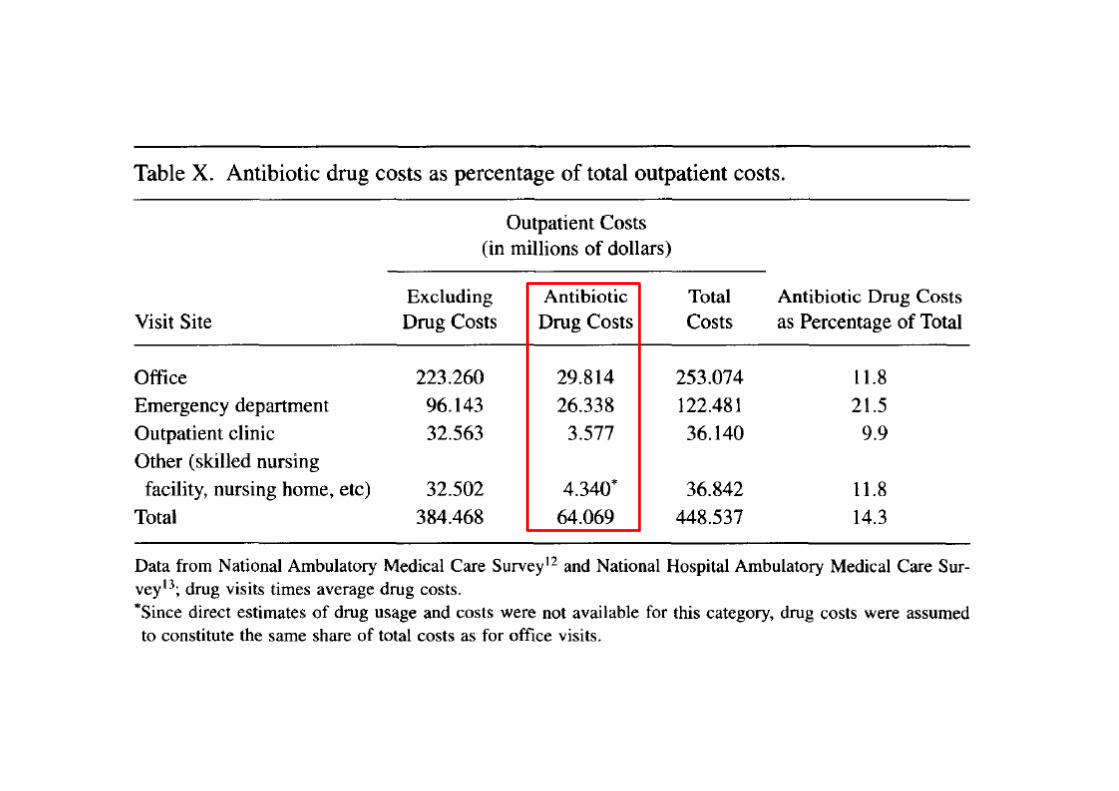
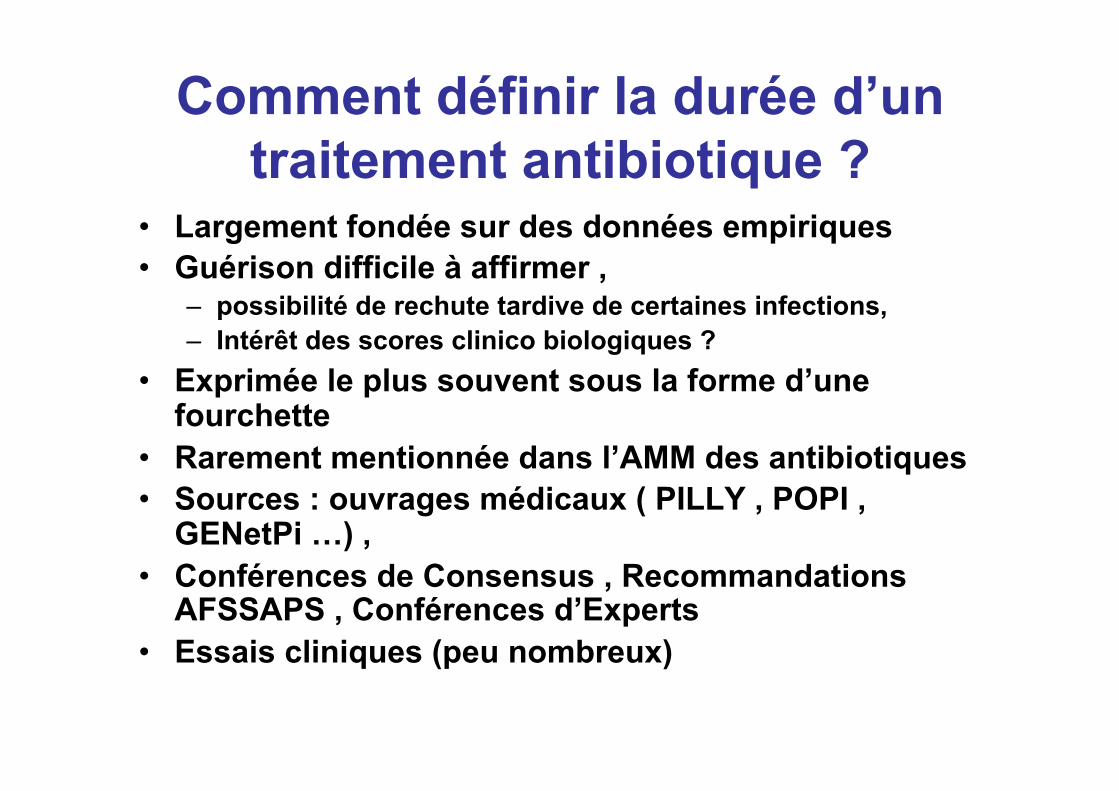
Comment définir la durée d’un traitement antibiotique ?
• Largement fondée sur des données empiriques • Guérison difficile à affirmer ,
– possibilité de rechute tardive de certaines infections, – Intérêt des scores clinico biologiques ?
• Exprimée le plus souvent sous la forme d’une fourchette
• Rarement mentionnée dans l’AMM des antibiotiques • Sources : ouvrages médicaux ( PILLY , POPI ,
GENetPi …) , • Conférences de Consensus , Recommandations
AFSSAPS , Conférences d’Experts • Essais cliniques (peu nombreux)
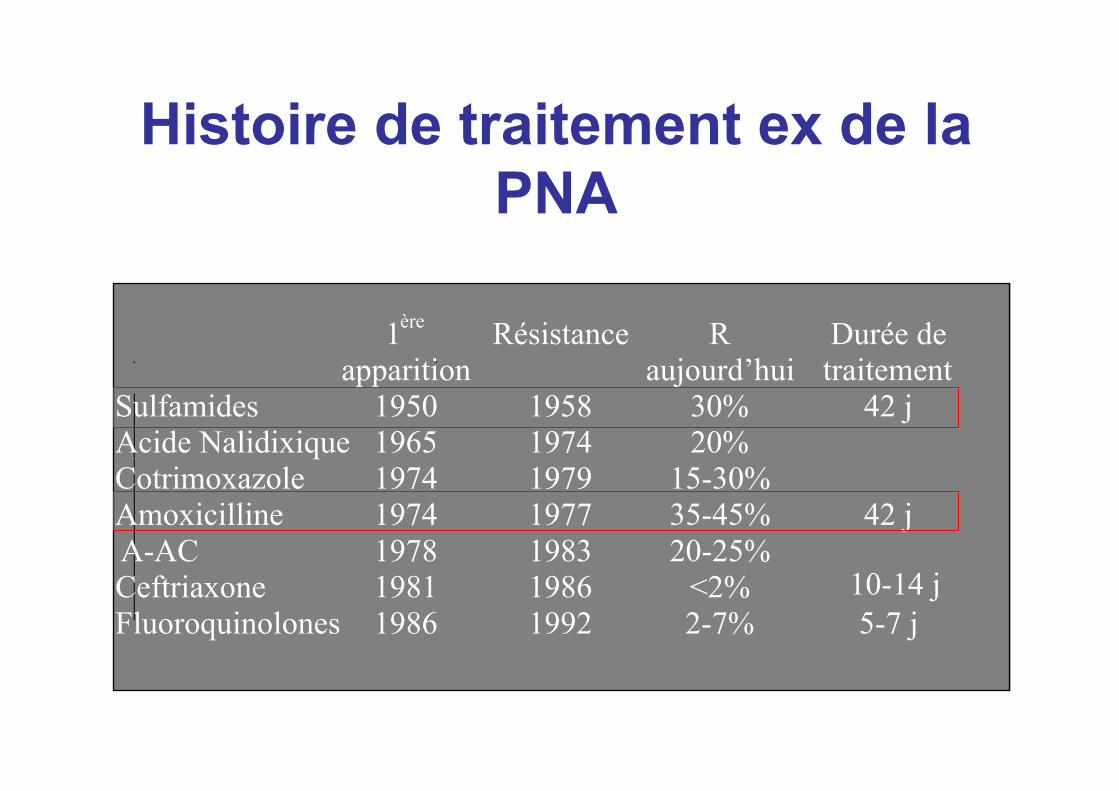
1 ère
apparition Résistance R
aujourd’hui Durée de traitement
Sulfamides 1950 1958 30% 42 j Acide Nalidixique 1965 1974 20% Cotrimoxazole 1974 1979 15-30% Amoxicilline 1974 1977 35-45% 42 j
A-AC 1978 1983 20-25% Ceftriaxone 1981 1986 <2% Fluoroquinolones 1986 1992 2-7% 5-7 j
Histoire de traitement ex de la PNA
10-14 j
Revue des données concernant des Pneumopathies
Conclusion
• Il y a une place pour les traitements courts dans les PAC !
• Reste à définir la population concernée • Jusqu’où « descendre » ? • Bien évaluer ces traitements afin d’éviter
un recours « sauvage » • Donc nécessité de nouvelles études
(difficultés méthodologiques)
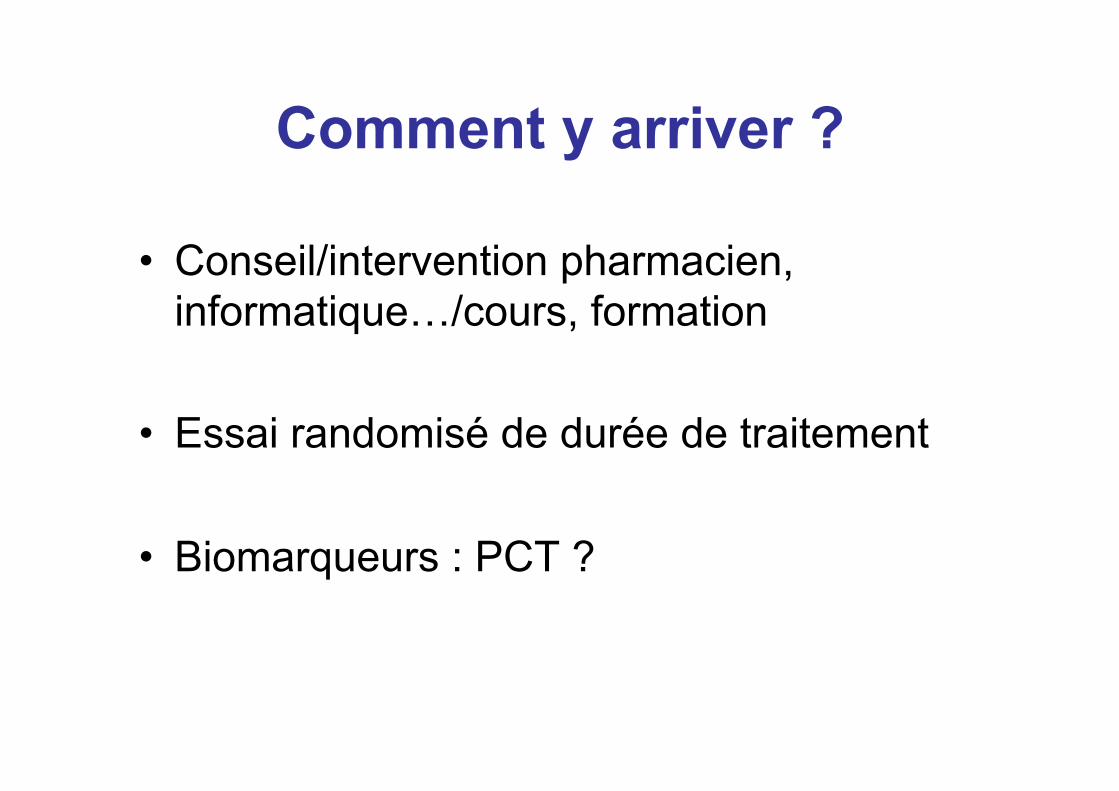
Comment y arriver ?
• Conseil/intervention pharmacien, informatique…/cours, formation
• Essai randomisé de durée de traitement
• Biomarqueurs : PCT ?

Copyright 2016 American Medical Association. All rights reserved.
group (P = .12) in the per-protocol analysis. At day 30, it im-
proved to 88.6% (132 of 150) and 91.9% (147 of 162) in the con-
trol and intervention groups, respectively, in the intent-to treat
analysis (P = .33) and to 92.7% (126 of 137) and 94.4% (136 of
146) in the control and intervention groups, respectively, in the
per-protocol analysis (P = .54). The CAP symptom question-
naire scores were similar in the 2 groups on day 5 (24.7 [11.4]
and 27.2 [12.5] in the control and intervention groups, respec-
tively;P = .10 in the intent-to-treat analysis; and 24.3 [11.4] and
26.6 [12.1] in the control and intervention groups, respec-
tively; P = .16 in the per protocol analysis). At day 10, the CAP
symptom questionnaire scores decreased in both groups (18.6
[9.0] and 17.9 [7.6] in the control and intervention groups, re-
spectively;P = .69 in the intent-to-treat analysis; and 18.1 [8.5]
and 17.6 [7.3] in the control and intervention groups, respec-
tively,P = .81 in the per protocol analysis) (Table2). Within dif-
ferent PSI severity groups, clinical success rate at day 10 was
comparable in the 2 groups. In the intent-to treat analysis, pa-
tients with more severe disease achieved clinical success at day
30 more frequently in the intervention group than in the con-
trol group. No differences were observed in the per-protocol
analysis (Table 3). Primary study outcomes by type of antibi-
otics and by hospitals are given in eTable 3 and eTable 4, re-
spectively, in Supplement 2.
Table 3. Clinical Success Rates at Days 10 and 30 Among Different Severity Groups Defined by PSI Classa
PSI Class
No. (%) of Participants
P ValueControl Group Intervention Group
Clinical Success at Day 10
PSI classes I-III
Intent to treat 41/86 (47.7) 58/101 (57.4) .18
Per protocol 39/80 (48.8) 58/94 (61.7) .09
PSI classes IV-V
Intent to treat 30/60 (50) 32/59 (54.2) .64
Per protocol 28/53 (52.8) 28/50 (56) .75
Clinical Success at Day 30
PSI classes I-III
Intent to treat 83/88 (94.3) 93/102 (91.2) .41
Per protocol 80/82 (97.6) 89/95 (93.7) .29
PSI classes IV-V
Intent to treat 49/61 (80.3) 54/58 (93.1) .04
Per protocol 46/54 (85.2) 47/49 (95.9) .10
Abbreviation: PSI, Pneumonia
Severity Index.a Percentages exclude patients with
missing data. The percentage of
missing data in the intent-to-treat
and per-protocol populations was as
follows: clinical success at day 10,
1.9% and 2.1%, respectively; and
clinical success at day 30, 0.9% and
1.0%, respectively.
Table 2. Results for the Primary Study Outcomes
Outcome Control Group Intervention Group P Value
Intent-to-Treat Analysis
Total No. of participants 150 162
Clinical success, No. (%)a
At day 10 71 (48.6) 90 (56.3) .18
At day 30 132 (88.6) 147 (91.9) .33
CAP symptom questionnaire score, mean (SD)b
At day 5 24.7 (11.4) 27.2 (12.5) .10
At day 10 18.6 (9.0) 17.9 (7.6) .69
Per-Protocol Analysis
Total No. of participants 137 146
Clinical success, No. (%)a
At day 10 67 (50.4) 86 (59.7) .12
At day 30 126 (92.7) 136 (94.4) .54
CAP symptom questionnaire score, mean (SD)b
At day 5 24.3 (11.4) 26.6 (12.1) .16
At day 10 18.1 (8.5) 17.6 (7.4) .81
Abbreviation: CAP, community-acquired pneumonia.a Percentages exclude patients with missing data. In the intent-to-treat
population, the percentage of missing data for each variable was as follows:
clinical success at day 10, 1.9%; clinical success at day 30, 0.9%; CAP symptom
questionnaire score at day 5, 3.8%; and CAP symptom questionnaire score at
day 10, 4.4%. In the per-protocol population, the percentage of missing data
was as follows: clinical success at day 10, 2.1%; clinical success at day 30, 1.0%;
CAP symptom questionnaire score at day 5, 3.1%; and CAP symptom
questionnaire score at day 10, 3.8%.b On the CAP symptom questionnaire, which is a specific and validated
patient-reported outcome measure based on 18 items, higher scores indicated
more severe CAP-related symptoms (range, 0-90).
Duration of Antibiotic Treatment in Community-Acquired Pneumonia Original Investigation Research
jamainternalmedicine.com (Reprinted) JAMA Internal Medicine September 2016 Volume 176, Number 9 1261
Copyright 2016 American Medical Association. All rights reserved.
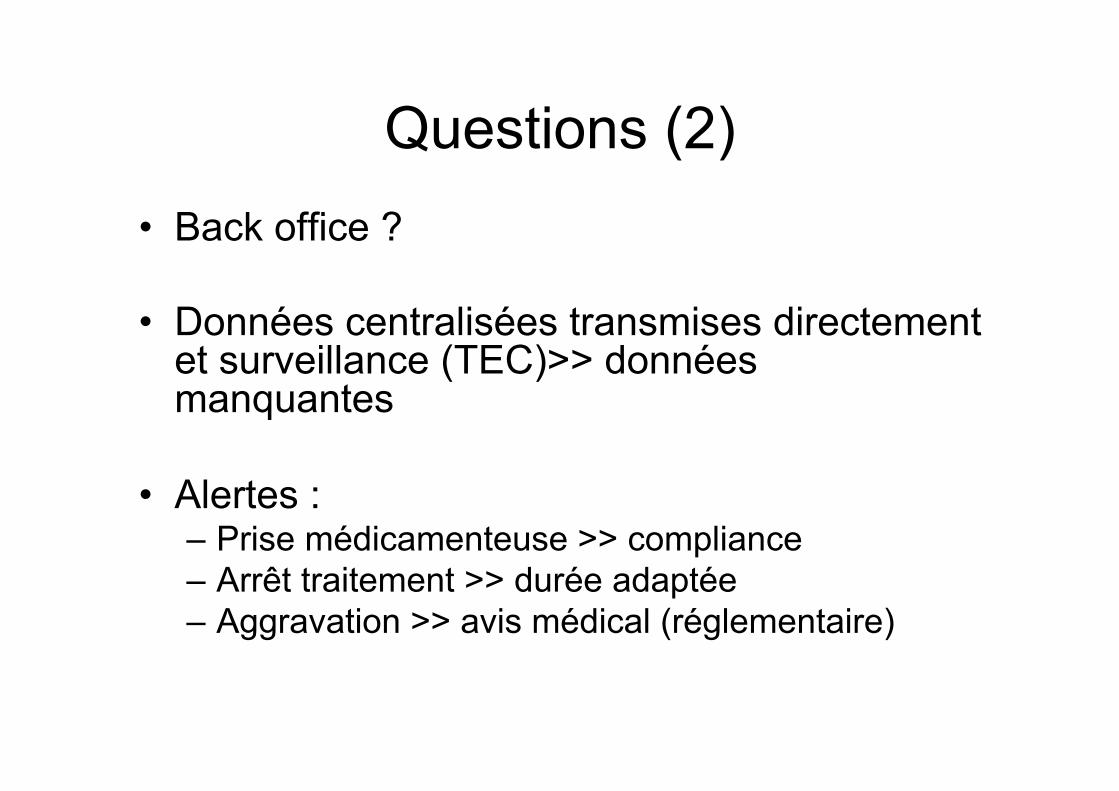
Questions (2) • Back office ?
• Données centralisées transmises directement et surveillance (TEC)>> données manquantes
• Alertes : – Prise médicamenteuse >> compliance – Arrêt traitement >> durée adaptée – Aggravation >> avis médical (réglementaire)
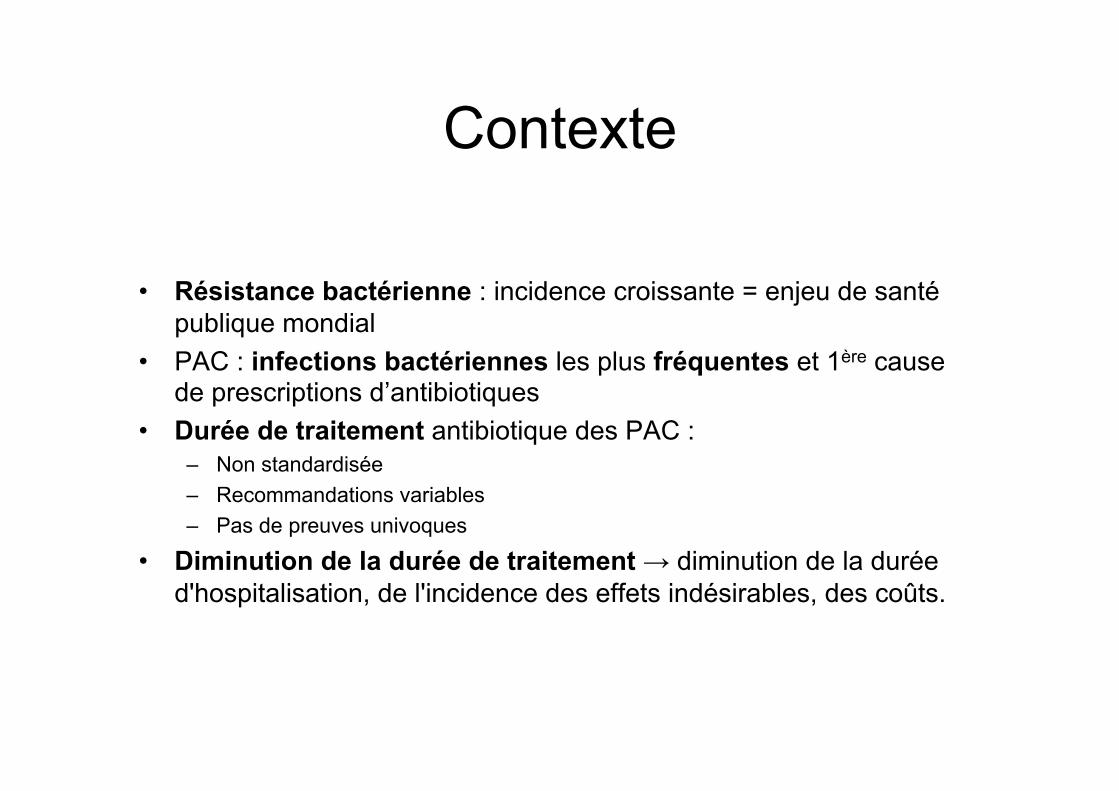
Contexte
• Résistance bactérienne : incidence croissante = enjeu de santé publique mondial
• PAC : infections bactériennes les plus fréquentes et 1ère cause de prescriptions d’antibiotiques
• Durée de traitement antibiotique des PAC : – Non standardisée – Recommandations variables – Pas de preuves univoques
• Diminution de la durée de traitement → diminution de la durée d'hospitalisation, de l'incidence des effets indésirables, des coûts.
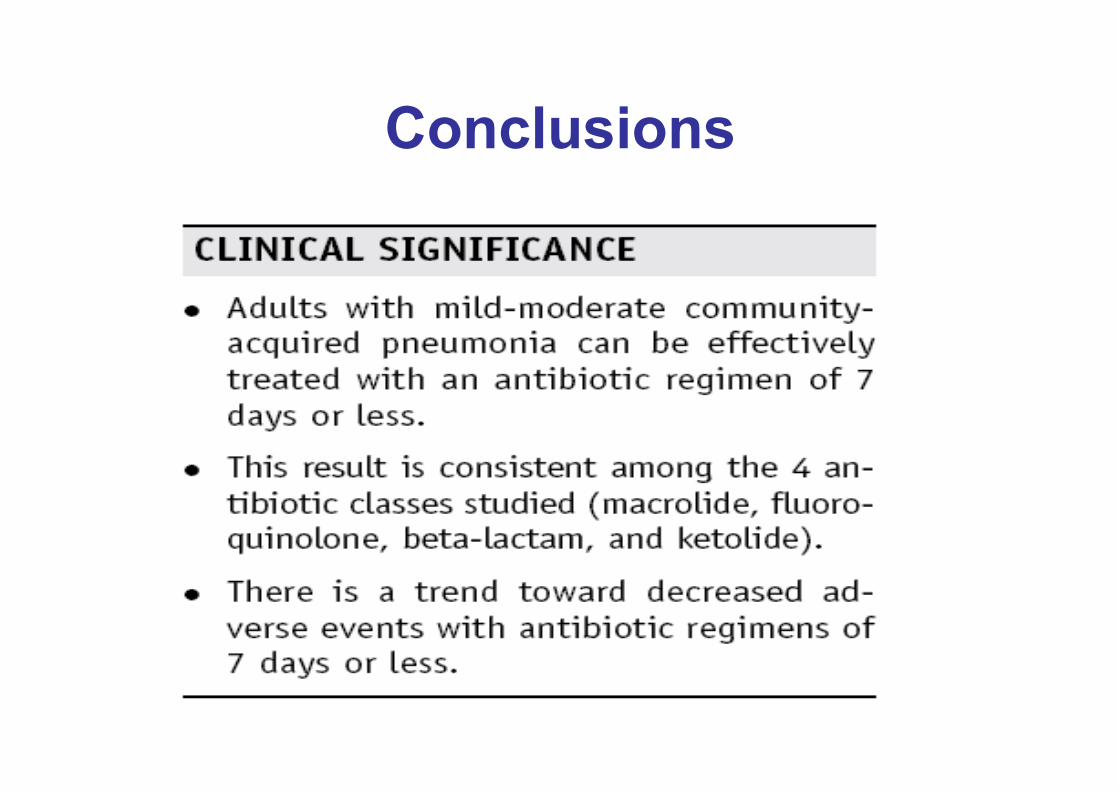
Conclusions